Marketing Management Marketing’s Relationship to the Firm and Society Paul Dishman, Ph.D....
27
Marketing Management Marketing’s Relationship to the Firm and Society Paul Dishman, Ph.D. Department of Business Management Marriott School of Management Brigham Young University Lecture 3
-
date post
20-Dec-2015 -
Category
Documents
-
view
215 -
download
2
Transcript of Marketing Management Marketing’s Relationship to the Firm and Society Paul Dishman, Ph.D....

Marketing Management
Marketing’s Relationship to theFirm and Society
Paul Dishman, Ph.D.Department of Business Management
Marriott School of Management
Brigham Young University
Lecture 3

Paul Dishman, Ph.D.
Marketing Management
Competitors
Marketingintermediaries
PublicsSuppliers
Mar
ketin
g
info
rmat
ion
syst
em
Marketing
planningsystem
Marketing
organization
system Mar
ketin
g
orga
niza
tion
and
impl
emen
tatio
n
Product
Promotion
Place PriceTargetcustomers
EconomicEconomicenvironmentenvironment
Social/Social/culturalcultural
environmentenvironment
TechnicalTechnicalenvironmentenvironment
Political/Political/legallegal
environmentenvironment

Paul Dishman, Ph.D.
Marketing Management
Environmental ForcesEnvironmental Forces
Social
Economic
Technological
Regulatory
Competitive

Paul Dishman, Ph.D.
Marketing Management
Social ForcesSocial Forces
1. Demographic shifts
2. Cultural changes
Paul Dishman, Ph.D.
Marketing Management
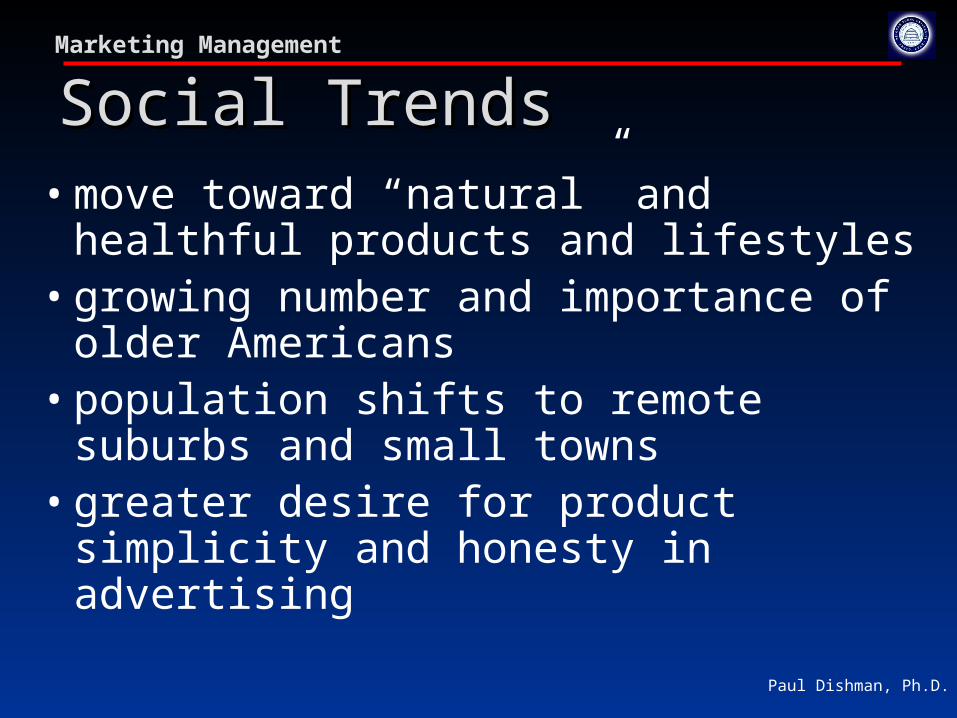
Social TrendsSocial Trends• move toward “natural” and healthful
products and lifestyles• growing number and importance of
older Americans• population shifts to remote suburbs and
small towns• greater desire for product simplicity and
honesty in advertising

Paul Dishman, Ph.D.
Marketing Management
The Population TrendThe Population Trend• 1999 U.S. Population estimated at 272
million
• number of people ages 20-34 has declined since 1990 and the number over 65 has increased
• mature households (age 50+) represent the fastest growing age segment and possess 75% of the net worth of U.S. households

Paul Dishman, Ph.D.
Marketing Management
Population Shifts in the U.S.Population Shifts in the U.S.• In the 1980s and 1990s the U.S. population has
shifted toward Western and Sunbelt states.
• Through 2025 three states--California, Texas, and Florida--will account for 45 percent of the net population change in the U.S.
• From the 1930s to 1980s the population shifted from cities to suburbs.
• 1990s the population is shifting again from suburbs to more remote suburbs called exurbs and to smaller towns called penturbia.

Paul Dishman, Ph.D.
Marketing Management
Major Population SegmentsMajor Population Segments• Baby Boomers: generation of 78 million born between 1946
and 1965, accounts for 56-58 percent of purchases of most
consumer product and service categories.
• Generation X: 17 % of the U.S. population born between
1965 and 1976. Consumers who are self-reliant,
entrepreneurial, supportive of diversity; better educated
than previous generations; not prone to extravagance and
likely to prefer lifestyles, products, and services that are
very different from baby boomers.
• Baby Boomlet: Americans born after 1976; also described
as Generation Y or the Net Generation.

Paul Dishman, Ph.D.
Marketing Management
The Net GenerationThe Net Generation• 80 million people under the age of 22 who have
grown up with the new technologies, becoming
authorities in their use.
• As the Internet has become the focus of the digital
age, the Net Generation has become the first
group to use it consistently for:
- entertainment -
communication
- information/education - shopping

Paul Dishman, Ph.D.
Marketing Management
Changes in the American FamilyChanges in the American Family
• 30 years ago 40% of all households consisted of married couples with children; this number has declined to 25%.
• 25% of all households consist of people who live alone
• 28% of married households are without children• the fastest growing types of households are those
with– single parents– other family members– unrelated persons

Paul Dishman, Ph.D.
Marketing Management
Racial and Ethnic DiversityRacial and Ethnic Diversity• Slightly more than one in four U.S. residents is
African-American, Hispanic, Asian, or a representative of another racial or ethnic group.
• The racial and ethnic composition of the U.S. population is expected to change even more by 2010, as since 1990:– Hispanic population growth 35+%– Asian population growth 35+%– African-American population growth 11+%– white population growth 3.6%

Paul Dishman, Ph.D.
Marketing Management
The Changing Role of WomenThe Changing Role of Women
• The percentage of women in the work force rose from 46 to 60 percent between 1975 and 1998.
• Women account for 11% of the officers and directors of the 500 largest corporations in the U.S.
• Women account for more than half of all:– financial managers– accountants and auditors– technical writers– economists– public relations specialists– authors

Paul Dishman, Ph.D.
Marketing Management
Economic ForcesEconomic Forces
1. Macroeconomic conditions
2. Consumer income

Paul Dishman, Ph.D.
Marketing Management
Economic CyclesEconomic Cycles
Economic Conditions
Time
Levels of Business Activity
Recovery Prosperity Recession Depression Recovery

Paul Dishman, Ph.D.
Marketing Management
• dramatic growth of electronic commerce• increase in per-capita income and
standard of living• U.S. firms adjust to crises in international
markets• economic growth reduces concern about
inflation and budget deficit
Economic TrendsEconomic Trends

Paul Dishman, Ph.D.
Marketing Management
Consumer ExpectationsConsumer Expectations Consumer expectations of an inflationary or
recessionary U.S. economy is an important element of environmental scanning. Consumer spending, which accounts for two-thirds of U.S. economic activity, is affected by expectations of the future.

Paul Dishman, Ph.D.
Marketing Management
University of Michigan Consumer University of Michigan Consumer Sentiment Index and Automobile SalesSentiment Index and Automobile Sales
507090
110130150170190
30 6.08.010.0
12.014.0
18.016.0
Consumer Sentiment Index (CSI) Vehicle sales (millions of units)
CSIVehicle sales
Note: The consumer sentiment index is calculated by subtracting the share of consumers who think it is a bad time to buy from those who think it is a good time to buy and then adding 100.
1970
1972
1974
1976
1978
1980
1982
1984
1986
1988
1990
1992
1994
1996
1998

Paul Dishman, Ph.D.
Marketing Management
Consumer IncomeConsumer Income A consumer’s ability to buy is related to income,
which consists of:
– gross income: the total amount of money made
in one year by a person, household, or family
unit;
– disposable income: the money a consumer has
left after paying taxes
– discretionary income: the money that remains
after paying for taxes and necessities.
Paul Dishman, Ph.D.
Marketing Management
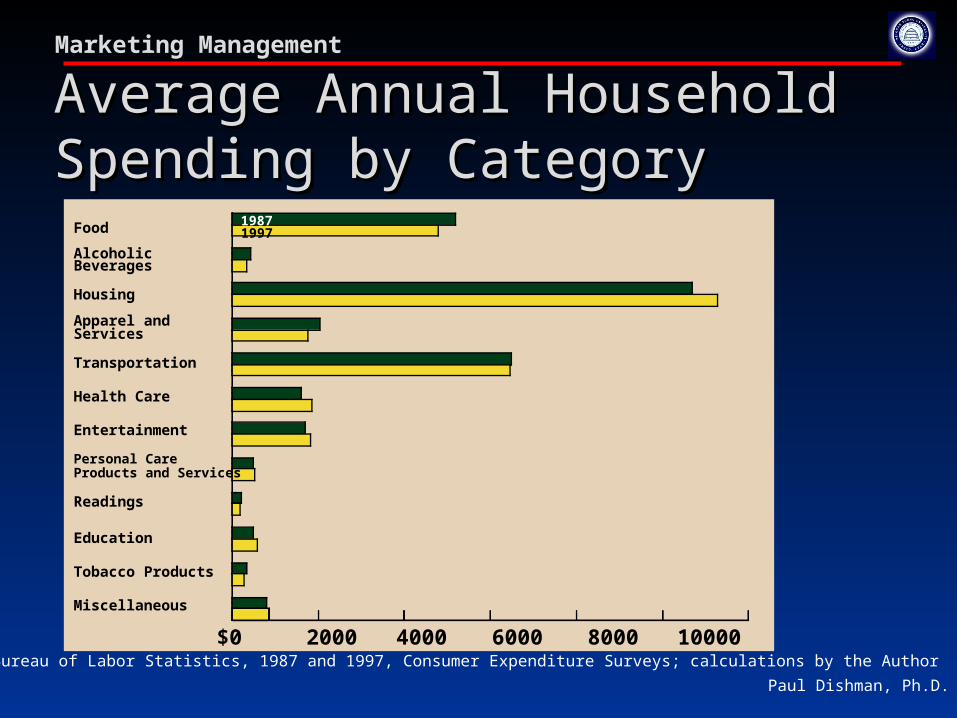
Average Annual Household Average Annual Household Spending by CategorySpending by Category
Source: Bureau of Labor Statistics, 1987 and 1997, Consumer Expenditure Surveys; calculations by the Author$0 2000 4000 6000 8000 10000
Food
AlcoholicBeverages
Housing
Apparel andServices
Transportation
Health Care
Entertainment
Personal Care Products and Services
Readings
Education
Tobacco Products
Miscellaneous
19971987

Paul Dishman, Ph.D.
Marketing Management
Income distribution of U.S. Income distribution of U.S. householdshouseholds
Under $10,000:11%
$10,000–$14,999:8%
$25,000–$34,999:13%
$35,000–$49,999:16%
$50,000–$74,999:18%
$75,000–$99,999:9%
$100,000 or more:9%
$15,000–$24,999:15%

Paul Dishman, Ph.D.
Marketing Management
Technological ForcesTechnological Forces
1. Changing technology
2. Technology’s impact on customer value

Paul Dishman, Ph.D.
Marketing Management
Technological TrendsTechnological Trends
• increased use of information and communication technology
• growing focus on the Internet as consumers and businesses go online
• expanded computer power and growth of “smart” products
• growing use of electronic money or “e-cash”

Paul Dishman, Ph.D.
Marketing Management
Regulatory ForcesRegulatory Forces
1. Laws protecting competition
2. Laws affecting marketing mix actions
3. Self-regulation

Paul Dishman, Ph.D.
Marketing Management
LawsLawsWacky, Outdated Laws Still on the Books
• In Utah, birds have the right of way on all highways.
• In Omaha, Nebraska, barbers are forbidden from shaving their customers’ chests.
• In Oklahoma people who make “ugly faces” at a dog may be fined and/or jailed.
• In Georgia, it is illegal to change the clothes on a storefront mannequin unless the shades are down.
• In South Bend, IN, monkeys are forbidden to smoke cigarettes.
• In Alaska, it is illegal to serve alcoholic beverages to a moose.

Paul Dishman, Ph.D.
Marketing Management
Regulatory TrendsRegulatory Trends
• increasing emphasis on free trade and deregulation
• greater concern for pollution and global warming
• new legislation related to information collection and privacy
• new legislation to encourage consumer savings

Paul Dishman, Ph.D.
Marketing Management
Legislation Protecting CompetitionLegislation Protecting Competition
Major legislation has been passed to encourage competition, which is deemed desirable because it permits the consumer to determine which competitors will succeed or fail. Relevant legislation includes:
Sherman Antitrust Act (1890)
- forbids restraint of trade
Clayton Act (1914)
- forbids actions that lessen competition
Robinson-Patman Act (1936)
- unlawful to discriminate in prices charged for same product

Paul Dishman, Ph.D.
Marketing Management
Other LegislationOther LegislationOther Federal legislation is aimed at:• products
• companies
• consumers (consumerism)
• both company and consumer
• pricing (fixing/unfair/discriminatory)
• distribution (exclusive dealing, requirement contracts, exclusive territorial distributorships, and typing arrangements)
• Advertising and promotion controls
• self-regulation