MARKETING MANAGEMENT 12 th edition KotlerKeller CONDUCTING MARKETING RESEARCH Chapter 3.
67
MARKETING MANAGEMENT 12 th edition Kotler Keller CONDUCTING MARKETING RESEARCH Chapter 3
-
Upload
silas-sydney-walsh -
Category
Documents
-
view
221 -
download
1
Transcript of MARKETING MANAGEMENT 12 th edition KotlerKeller CONDUCTING MARKETING RESEARCH Chapter 3.

MARKETING MANAGEMENT12th edition
Kotler Keller
CONDUCTING MARKETING RESEARCH
Chapter 3

Organizational Environment
Includes all elements existing outside the boundary of the organization that have the potential to affect the organization
Two Layers of theExternal Environment
Task environment General environment

Organizational Environment
Management
Employees Culture
Internal Environment
Suppliers
Com
petitors
Customers
Lab
or M
ark
et
Legal/PoliticalEco
nomic
Technological
SocioculturalIn
tern
atio
nal
General Environment
Task Environment

3-5
Information Information related to:
1) macro trends
2) micro effects particular to their business environment is constantly presenting new
opportunities and threats.
Marketers should continue monitoring and adapting to that environment.

3-6
Responsibility
falls to the company's marketers.
trend trackers and opportunity seekers.

3-7
Evidence (s)
Marketers also have extensive information about how consumption patterns vary across countries.
the Swiss consume the most chocolate, the Greeks eat the most cheese, the Irish drink the most tea, and the Austrians smoke the most cigarettes

3-8
Why Information?
Companies with superior information enjoy a competitive advantage.
The company can :
1) choose its markets better,
2) develop better offerings, and
3) execute better marketing planning

3-9
Paths and Channels
Every firm must organize and distribute a continuous flow of information to its marketing managers.
Companies study their managers' information needs and design marketing information systems (MIS) to meet these needs.

3-10
consists of: people, equipment, and procedures to gather, sort, analyze, evaluate, and distribute needed, timely, and accurate information to
marketing decision makers.
MIS

MIS has three components1. internal records system, which includes
information on the order-to-payment cycle and sales reporting systems;
2. marketing intelligence system, a set of procedures and sources used by managers to obtain everyday information about pertinent developments in the marketing environment
3. marketing research system that allows for the systematic design, collection, analysis, and reporting of data and findings relevant to a specific marketing situation.

3-12
MIS Probes for Information What decisions do you regularly make? What information do you need to make these decisions? What information do you regularly get? What special studies do you periodically request? What information would you want that you are not getting
now? What are the four most helpful improvements that could
be made in the present marketing information system?

3-13
Internal Records
Marketing managers rely on internal reports on:1.orders, 2. sales, 3.prices, 4. costs, 5. inventory levels, 6. receivables, 7.Payables8.By analyzing this information, they can spot
important opportunities and problems.

3-14
Internal Records
1. Order-to-Payment Cycle
2. Sales Information System
3. Databases, Warehousing, Data mining
4. Marketing Intelligence System

3-15
Order-to-Payment Cycle
1.Customers and sales representatives fax or e-mail their orders.
2.Computerized warehouses quickly fill these orders.
3.The billing department sends out invoices as quickly as possible.
using the Internet and extranets to improve the speed, accuracy, and efficiency of the order-to-payment cycle.

3-16
Internal Records
Sales Information SystemMarketing managers need timely and accurate reports on current sales.
Wal-Martknows the sales of each product by store and total each evening.
enables it to transmit nightly orders to suppliers for new shipments of replacement stock.
Wal-Mart shares its sales data with its larger suppliers such as P&G and expects P&G to re-supply Wal-Mart stores in a timely manner.
Wal-Mart has entrusted P&G with the management of its inventory. Outsourcing

3-17
Databases, Data Warehousing, and Data Mining
companies organize their information in databases:
1.customer databases, 2.product databases, 3.salesperson databasesOrganizations combine data from the
different databases.
Internal Records

customer database
customer database will contain every customer's:
1. name,
2. address,
3. past transactions,
4. demographics and
5. psychographics (activities, interests, and opinions) in some instances.

The PIZZA HUT Case
Pizza Hut claims to have: the largest fast-food customer data warehouse in the world, with 40 million U.S. households—or between 40 and 50
percent of the U.S. market. The millions of customer records are gleaned from point-of-
sale transactions at its restaurants. Pizza Hut can slice and dice data by: favorite toppings, date of last order, or by whether you
order a salad with your pepperoni pizza. Using its data Warehouse Miner, Pizza Hut has not only been able to purge expensive duplicates from its direct-mail campaigns, but can also target its marketing to find the best coupon offers for each household and predict the success of campaigns

3-20
The Marketing Intelligence System
is a set of procedures and sources managers use to obtain everyday information about developments in the marketing environment.

Sources of Information
Marketing managers collect marketing intelligence by:
1. reading books, 2. newspapers, and trade publications;3. talking to customers, suppliers, and
distributors; and 4. meeting with other company managers.
3-22
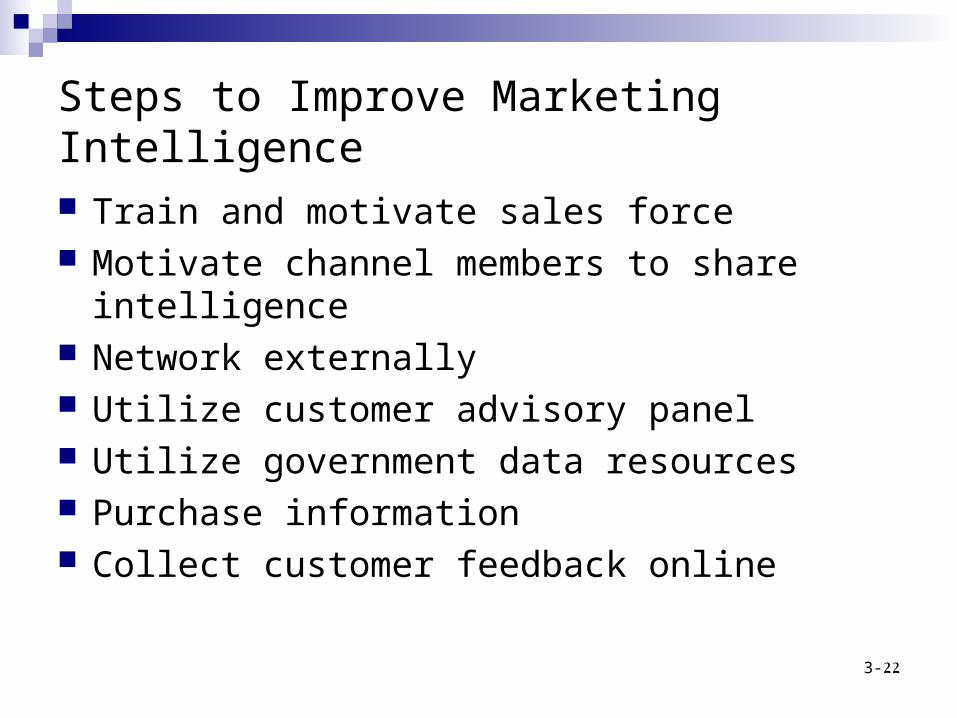
Steps to Improve Marketing Intelligence
Train and motivate sales force Motivate channel members to share intelligence Network externally Utilize customer advisory panel Utilize government data resources Purchase information Collect customer feedback online
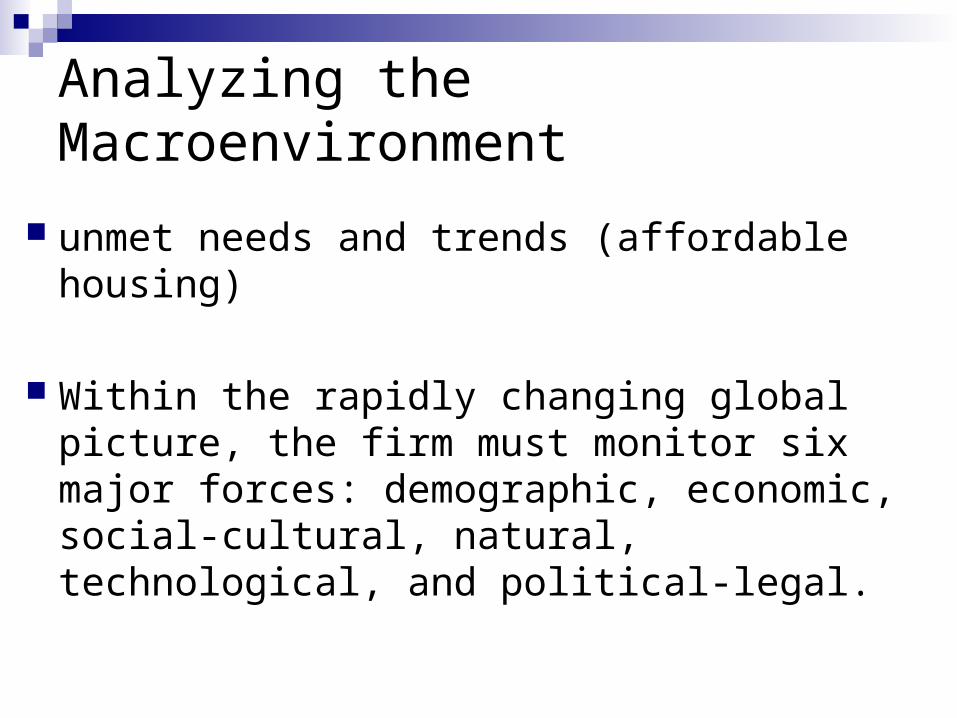
Analyzing the Macroenvironment
unmet needs and trends (affordable housing)
Within the rapidly changing global picture, the firm must monitor six major forces: demographic, economic, social-cultural, natural, technological, and political-legal.

3-24
Needs and TrendsFad
Trend
Mega-trend
is a direction or sequence of events
"unpredictable, short-lived, and without social, economic, and political significance
large social, economic, political and technological changes [that] are slow to form, and once in place, they influence us for some time— between seven and ten years, or longer.

3-25
10 Megatrends Shaping the Consumer Landscape
Aging boomers Delayed retirement Changing nature of
work Greater educational
attainment Labor shortages
Increased immigration Rising Hispanic
influence Shifting birth trends Widening geographic
differences Changing age
structure

3-26
Environmental Forcesopportunities and threats
Demographic Economic Socio-Cultural Natural Technological Political-Legal

3-27
Population and Demographics Size Growth rate Age distribution Ethnic mix Educational
levels
Household patterns
Regional characteristics
Movement

3-28
Economic Environment
$ Purchasing Power$ Income Distribution$ Savings Rate$ Debt$ Credit Availability

3-29
Types of Industrial Structures
Industrial economies Industrializing economies Raw-material exporting economies Subsistence economies

3-30
Social-Cultural Environment
Views of themselves Views of others Views of organizations Views of society Views of nature Views of the universe

3-31
Natural Environment
Shortage of raw materials Increased energy costs Anti-pollution pressures Governmental protections

3-32
Technological Environment
Pace of change Opportunities for innovation Varying R&D budgets Increased regulation of change

Melting Pot VS Salad Bowl
According to the 2000 census: the U.S. population of 276.2 million was 72% white. African Americans constituted 13%, and Latinos 11%. The Latino population had been growing fast, with the largest
subgroups of Mexican (5.4 percent), Puerto Rican (1.1 percent), and Cuban (0.4 percent) descent.
Asian Americans constituted 3.8 percent of the U.S. population, with the Chinese as the largest group, followed by the Filipinos, Japanese, Asian Indians, and Koreans, in that order.
Latino and Asian American consumers are concentrated in the far western and southern parts of the country, although some dispersal is taking place.
Moreover, there were nearly 25 million people living in the United States—more than 9 percent of the population—who were born in another country.

Megatrend
the increase in the percentage of Hispanics in the total population, represents a major shift in the nation's center of gravity. Hispanics made up half of all new workers in the past decade and will bump up to 25 percent of workers in two generations.

In addition to monitoring a changing marketing environment, marketers also need to develop specific knowledge about their particular markets. • Good marketers want information to help them interpret past performance as well as plan future activities. • Marketers need timely, accurate, and actionable information on consumers, competition, and their brands. • They need to make the best possible tactical decisions in the short run and strategic decisions in the long run. • Discovering a consumer insight and understanding its marketing implications can often lead to a successful product launch or spur the growth of a brand.

3-36
T-Louis-based Build-A-Bear Workshop has cleverly capitalized on the "kiddie-craft" trend in children's toys as well as the trend for interactive entertainment retailing. Instead of making pottery or
play jewelry,
the chain, with more than 160 stores in the United States, the United Kingdom, Japan, Denmark, and Korea, allows kids (and adults too) to design their own teddy bears and other stuffed animals, compete with clothing, shoes, and accessories.
The chain boasts an average of over $500 per square foot in annual revenue, double the U.S. mall average, ten percent of sales in 2003 came from hosting nearly 100,000 parties at a cost to customers of approximately $250 for two hours, which includes a stuffed animal for each child.
Build-A-Bear has created a database on 9 million kids and their households by inviting customers to register their bears:
Build-A-Bear

3-37
By including a barcode inside the bear, the company can reunite the owner with the bear if it gets lost.
The database allows Build-A-Bear to contact customers by surface and e-mail with gift certificates, promotions, and party reminders.
Build-A-Bear

Marketing Research Definition
marketing research is systematic design, collection, analysis, and reporting of data and findings relevant to a specific marketing situation facing the company.
market survey product-preference test
sales forecast by region advertising evaluation
Marketers request
Marketing research is now about a $16.5 billion industry
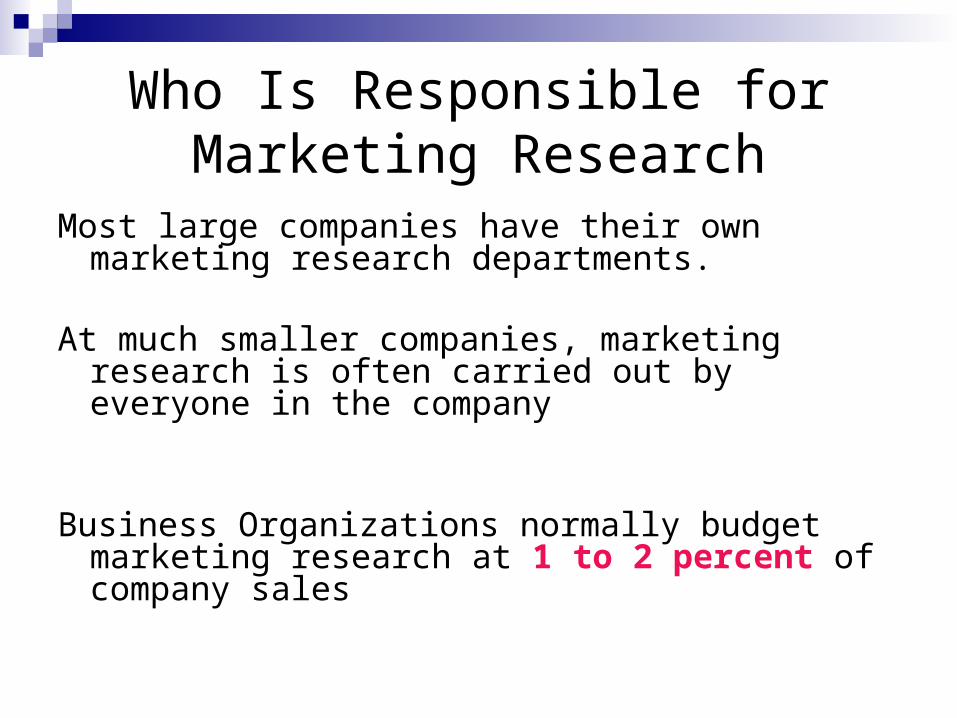
Who Is Responsible for Marketing Research
Most large companies have their own marketing research departments.
At much smaller companies, marketing research is often carried out by everyone in the company
Business Organizations normally budget marketing research at 1 to 2 percent of company sales

Marketing research & firms
Marketing research firms fall into three categories:
Type Examples
Syndicated-service research firms Gather & sell
Custom marketing research firms hired to carry out
Specialty-line marketing research firms (specialized in services) sells field interviewing services to other firms.

The Marketing Research Process
six steps as shown in
this Figure

Case Study: American Airlines (AA)American Airlines (AA) is constantly looking for new ways to serve its passengers; it was one of the
first companies to install phone handsets.
Now it is reviewing many new ideas, especially to cater to its first-class passengers on very long flights, many of whom are businesspeople whose high-priced tickets pay most of the freight.
Among these ideas are: (1) to supply an Internet connection with limited access to Web pages and e-mail messaging; (2) (2) to offer 24 channels of satellite cable TV; and (3) (3) to offer a 50-CD audio system that lets each passenger create a customized play list of
music and movies to enjoy during the flight.
The marketing research manager was assigned to investigate how first-class passengers would rate these services and how much extra they would be willing to pay if a charge was made. He was asked to focus specifically on the Internet connection. One estimate says that airlines might realize revenues of $70 billion over the next decade from in-flight Internet access, if enough first-class passengers would be willing to pay $25 for it. AA could thus recover its costs in a reasonable time. Making the connection available would cost the airline $90,000 per plane.6
FIG. 4.1 I The Marketing Research Process
Case Study: American Airlines (AA)
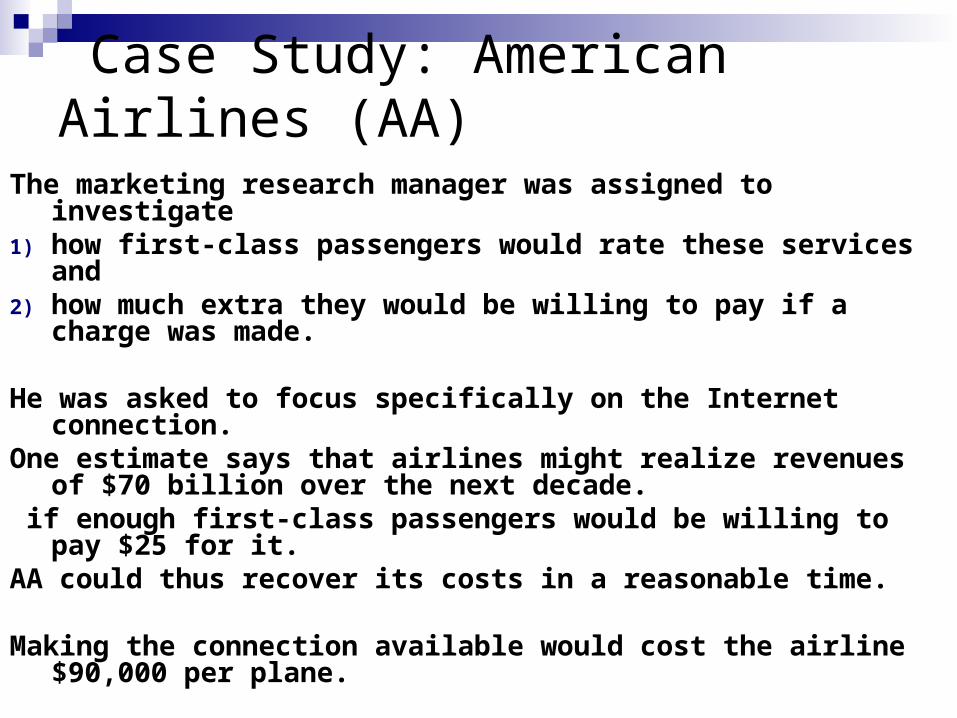
The marketing research manager was assigned to investigate 1) how first-class passengers would rate these services and 2) how much extra they would be willing to pay if a charge
was made.
He was asked to focus specifically on the Internet connection.
One estimate says that airlines might realize revenues of $70 billion over the next decade.
if enough first-class passengers would be willing to pay $25 for it.
AA could thus recover its costs in a reasonable time.
Making the connection available would cost the airline $90,000 per plane.
Defining the Problem
Will offering an in-flight Internet service create enough incremental preference and profit for American Airlines to justify its cost against other possible investments American might make?"

Research Objectives
Research objectives: What types of first-class passengers would respond
most to using an in-flight Internet service? How many first-class passengers are likely to use the
Internet service at different price levels? How many extra first-class passengers might choose
American because of this new service? How much long-term goodwill will this service add to
American Airlines' image? How important is Internet service to first-class
passengers relative to providing other services such as a power plug, or enhanced entertainment?

Research Types
Exploratory—research: its goal is to shed light on the real nature of the problem and to suggest possible solutions or new ideas.
Descriptive—research: is it seeks to ascertain certain magnitudes, such as how many first-class passengers would purchase in-flight Internet service at $25.
Causal—research: Its purpose is to test a cause-and-effect relationship.

Developing Research PlanDesigning a research plan calls for decisions
on the data sources, research approaches, research instruments, sampling plan, and contact methods

Data sourcesData sources: Primary data can be
collected in five main ways: Observation, Focus groups, Surveys, behavioral data, Customers leave traces of
their purchasing behavior in store scanning data, catalog purchases, and customer databases.
Experiments.

Behavioral Data
Customers leave traces of their purchasing behavior in store scanning data, catalog purchases, and customer databases.

Survey Research
Companies undertake surveys to learn about people's knowledge, beliefs, preferences, and satisfaction, and to measure these magnitudes in the general population.

Focus Group
is a gathering of six to ten people who are carefully selected based on certain demographic, psychographic, or other considerations and brought together to discuss at length various topics of interest.

Experimental Research
The most scientifically valid. The purpose of experimental research is to capture cause-and-effect relationships by eliminating competing explanations of the observed findings.
Experiments call for selecting matched groups of subjects, subjecting them to different treatments, controlling extraneous variables, and checking whether observed response differences are statistically significant.

three main research instruments in collecting primary data:
1) questionnaires,
2) qualitative measures, and
3) mechanical devices.
RESEARCH INSTRUMENTS

Qualitative research
QR techniques are relatively unstructured measurement approaches that permit a range of possible responses, and they are a creative means of ascertaining consumer perceptions that may otherwise be difficult to uncover.

Shadowing— observing people using products, shopping, going to hospitals, taking the train, using their cell phones.
Behavior mapping—photographing people within a space, such as a hospital waiting room, over two or three days.
Consumer journey—keeping track of all the interactions a consumer has with a product, service, or space.
Camera journals—asking consumers to keep visual diaries of their activities and impressions relating to a product.
Extreme user interviews—talking to people who really know—or know nothing—about a product or service and evaluating their experience using it.
Storeytelling—prompting people to tell personal stories about their consumer experiences.
Unfocus groups—interviewing a diverse group of people: To explore ideas
seven techniques

Mechanical Devices
Mechanical devices are occasionally used in marketing research.
After each exposure, the respondent describes everything he or she recalls.
Eye cameras study respondents' eye movements to see where their eyes land first, how long they linger on a given item, and so on.
Audiometers can be attached to television sets in participating homes to record when the set is on and to which channel it is tuned.

SAMPLING PLAN
SAMPLING PLAN After deciding on the research approach and instruments, the marketing researcher must design a sampling plan.
1. Sampling unit: Who is to be surveyed?
2. Sample size: How many people should be surveyed?
3. Sampling procedure: How should the respondents be chosen?7o

Simple random sample: Every member of the population has an equal chance of selection.
Stratified random sample: The population is divided into mutually exclusive groups (such as age groups), and random samples are drawn from each group.
Cluster (area) sample: The population is divided into mutually exclusive groups (such as city blocks), and the researcher
draws a sample of the groups to interview.
A. Probability Sample

B. Non-probability Sample
Convenience sample: The researcher selects the
most accessible population members. Judgment sample: The researcher selects
population members who are good prospects for accurate information.
Quota sample: The researcher finds and interviews a prescribed number of people in each of several categories.

CONTACT METHODSOnce the sampling plan has been determined, the marketing
researcher must decide how the subject should be contacted: 1)mail, 2) telephone, 3)personal, or online interview.

Step 3: Collect the Information Getting the right respondents is critical. In the case of surveys, four major problems arise.
1) Some respondents will not be at home and must be contacted again or replaced.
2) Other respondents will refuse to cooperate.
3) Others will give biased or dishonest answers. Finally,
4) some interviewers will be biased or dishonest.

Step 4: Analyze the Information
The next-to-last step in the process is to extract findings from the collected data.
The researcher tabulates the data and develops frequency distributions.
Averages and measures of dispersion are computed for the major variables.
The researcher will also apply some advanced statistical techniques and decision models in the hope of discovering additional findings.

Step 5: Present the Findings
As the last step, the researcher presents the findings. The researcher should present findings that are relevant to the major marketing decisions facing management.

The main survey findings for the American Airlines case show that:
The chief reasons for using in-flight Internet service are to pass the time surfing, and to send and receive messages from colleagues and family. The charge would be put on passengers' charge accounts and paid by their companies.

The main survey findings for the American Airlines case show that:About 5 first-class passengers out of every 10 would use the Internet
service during a flight at $25; about 6 would use it at $15. Thus, a charge of $15 would produce less
revenue ($90 = 6 x $15) than $25 ($125 = 5 X $25). By charging $25, AA would collect $125 per flight.
Assuming that the same flight takes place 365 days a year, AA would annually collect $45,625.
Since the investment is $90,000, it will take approximately two years before American Airlines breaks even.

Step 6: Make the Decision
The last step is decision-making process Evaluating the decision made
The decision process itself Two questions should be asked:1) Was the decision made (analyst do not
make decisions)2) Was a decision right

The Seven Characteristics of Good
Marketing Research Scientific method careful observation, formulation of hypotheses,
prediction, and testing Research creativity innovative ways to solve a problem
Multiple methods two or three methods to increase confidence
Interdependence of models and data
recognize that data are interpreted from underlying
models that guide the type of information sought
Value and cost of information
Costs are typically easy to determine, but the value of research is harder to quantify
Healthy skepticism alert to the problems caused by "marketing myths
Ethical marketing The misuse of marketing research can harm or annoy
consumers