Marketing Finance
181
Marketing Finance PGDM/MMS (Marketing) Semester III (2010-’12)
-
Upload
siddharth-jain -
Category
Documents
-
view
420 -
download
0
Transcript of Marketing Finance
Marketing Finance
PGDM/MMS (Marketing) Semester III (2010-’12)
07/04/23 2
Marketing Finance: SyllabusI: SALES REVENUE: Sales Revenue as an integral element of cost and
revenue – Investment Framework by RCM – Management of Sales Revenue – Analysis of revenue by Products, Territories, Channels, Customers’ Orders etc. – Analysis of marketing costs by types of costs by functions, significance of marking cost allocation for managerial decisions and its limitations.
07/04/23 3
Syllabus• II : MARKETING INVESTMENT:• Management of Accounts Receivables and
Inventories - Credit Decisions and Credit Policy - Special Promotion and Marketing Research Expenditure – Marketing Investments and their evaluation using the probability theory and Decision Trees - Evaluating Return on Marketing Investment – Developing and launching new products and the Concept of Investment in Life Cycle of Product - Application of DCF and linear programming to evaluate investments in product development and marketing product mix.
07/04/23 4
Syllabus• III : POLICY DECISIONS AND MARKETING
FINANCE:• Pricing of joint products and application of linear
programming - Pricing of new products under ROI concept - Bayesian Decision theory and Pricing - Government Price Control (Dual Pricing, approaches of government bodies to development of ‘Fair Price’ , Submitting of tenders ) – application of DCF techniques to budgeting – Developing sub-budgets by marketing segments – Advertising Budgets – Budgeting Sales Force Efforts – Optimum level and allocation for selling efforts among dealers – ……
07/04/23 5
Syllabus
• ……Developing comparison plans for sales force – budgeting samples – Warehousing decisions – Transportation decision – Delivery Route decisions – Cost analysis for distribution alternatives - Financial analysis for switching over from sole selling agency to direct selling to trade channel - impact of marketing strategies on organisational structure and design consequent financial implications - Concept of marketing cost and value – measuring value added by marketing effort.
07/04/23 6
Syllabus• IV:PRICING DECISIONS:• Target Pricing – Pricing of Turnkey Projects - Notional
Pricing – Brand Valuation and financial aspects of brand management – Impact of transfer pricing mechanism on marketing performance – Value chain analysis and relevant decisions about marketing costs and marketing investments.
• RECOMMENDED TEXT BOOKS: MARKETING MANAGEMENT – A Finance Emphasis –
By: Dr. B K Chatterjee, Fourth Edition – JAICO Publishing House.
FINANCIAL MANAGEMENT Theory and Practice – By; Dr. Prasanna Chandra, 7th Edition, Tata McGraw-Hill Publishing Co. Ltd.
Financial Management by any other Author
07/04/23 7
Other References - Websites• 1.
http://www.marketingteacher.com/lesson-store/#finance • 2. www.bestmarketingtextbook.com (Website of the
Authors: Arun Kumar and N.Meenakshi)• 3. http://www.ibef.org/home.aspx (India Brand Equity
Foundation);• 4. http://www.indiacore.com/index.html (India Core.com
– Information on Indian Infrastructure and core sectors)• 5. http://www.highbeam.com/ (High Beam Research –
Research articles on various Topics from various sources)
• 6. http://knol.google.com/k (Articles on various topics by experts from all over the world)
• 7. http://www.ignou.ac.in/prevyrpapers/pyq_papers.htm (Question Papers of IGNOU)
07/04/23 8
Other References - Websites• 8. http://www.marketingpower.com/Pages/default.aspx
(American Marketing Association)• 9. http://www.direct-marketing-association-india.org/
(Direct Marketing Association- India)• 10. http://www.rmai.in/index.html (Rural Marketing
Association of India)• 11. http://www.planmanconsulting.com/icmr/index.html
(Indian Council for Market Research)• 12. http://www.icrier.org/index.htm (Indian Council for
Research on International Economic Relations)• 13. http://www.imrbint.com/ (Indian Market Research
Bureau - IMRB International)• 14. http://www.marketresearchindia.org/index.html
{ Business Development Bureau (India) Pvt. Ltd.}
07/04/23 9
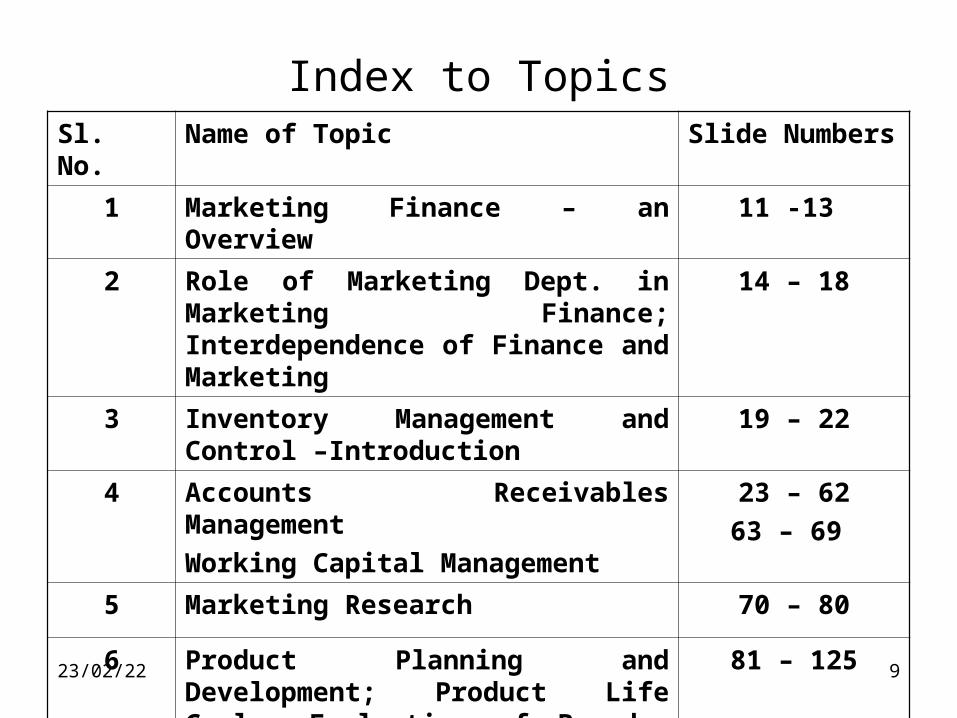
Index to TopicsSl. No. Name of Topic Slide Numbers
1 Marketing Finance – an Overview 11 -13
2 Role of Marketing Dept. in Marketing Finance; Interdependence of Finance and Marketing
14 – 18
3 Inventory Management and Control –Introduction
19 – 22
4 Accounts Receivables Management
Working Capital Management
23 – 62
63 – 69
5 Marketing Research 70 – 80
6 Product Planning and Development; Product Life Cycle; Evaluation of Brands, Elimination of Products
81 – 125
7 Cost analysis in Marketing Decisions 126-145
07/04/23 10
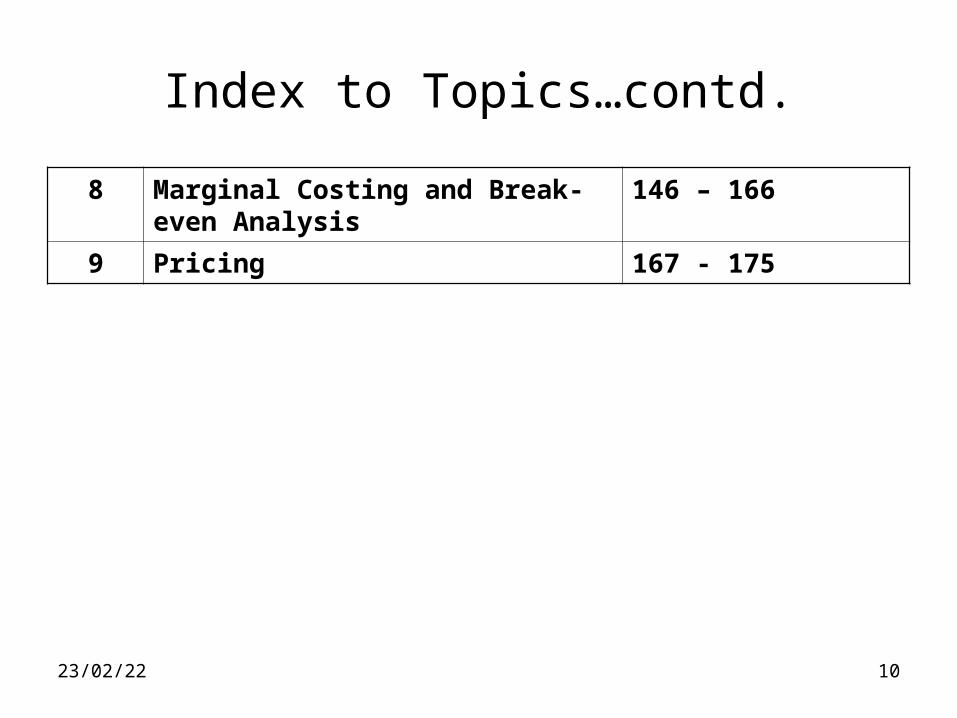
Index to Topics…contd.
8 Marginal Costing and Break-even Analysis
146 – 166
9 Pricing 167 - 175
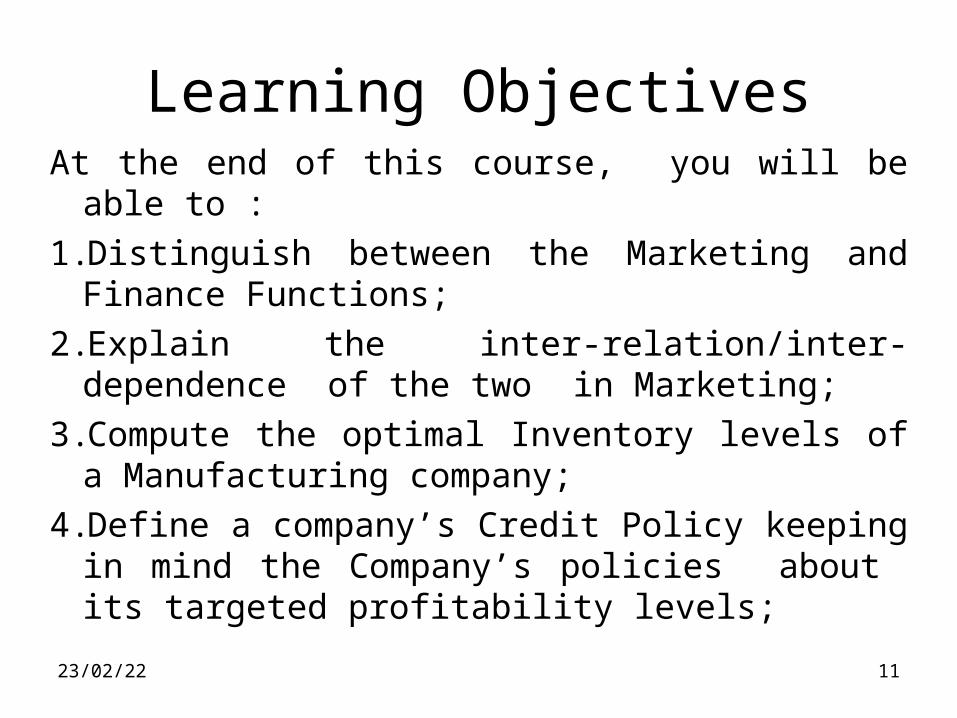
Learning ObjectivesAt the end of this course, you will be able to :
1.Distinguish between the Marketing and Finance Functions;
2.Explain the inter-relation/inter-dependence of the two in Marketing;
3.Compute the optimal Inventory levels of a Manufacturing company;
4.Define a company’s Credit Policy keeping in mind the Company’s policies about its targeted profitability levels;
07/04/23 11

Learning Objectives……
5. Compute the level of credit period allowable for each customer in line with the Company’s Credit Policies;
6. Compute the various financial ratios required to understand the financial implications of the company’s actions;
7. Allocate the optimal amount of expenditure for Marketing Research;
07/04/23 12
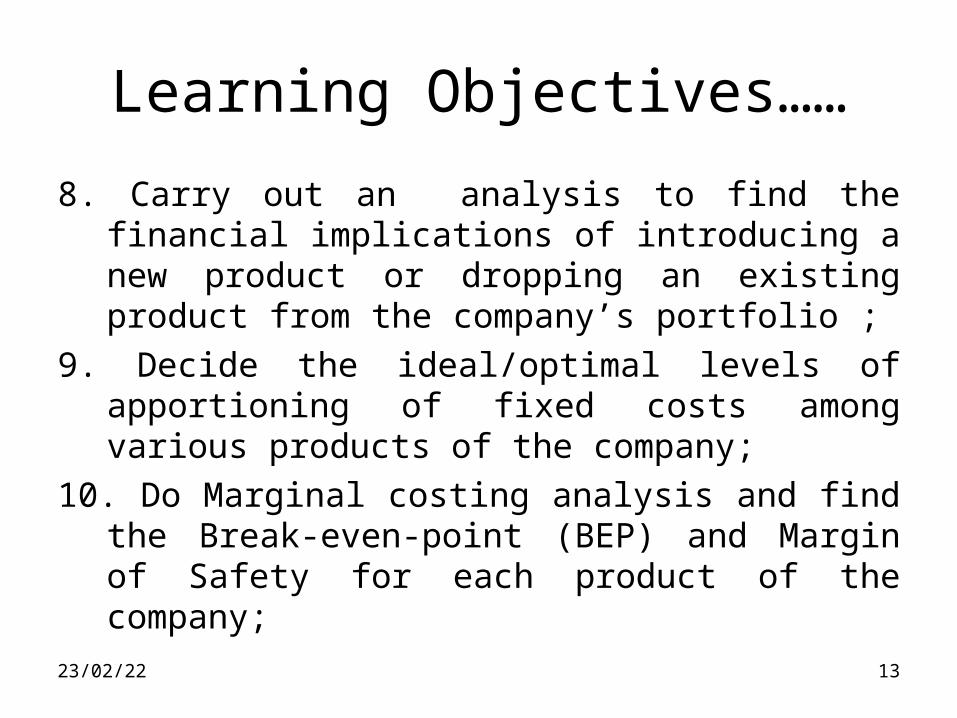
Learning Objectives……
8. Carry out an analysis to find the financial implications of introducing a new product or dropping an existing product from the company’s portfolio ;
9. Decide the ideal/optimal levels of apportioning of fixed costs among various products of the company;
10. Do Marginal costing analysis and find the Break-even-point (BEP) and Margin of Safety for each product of the company;
07/04/23 13
Learning Objectives……
11. Calculate the desirable pricing of the company’s various products.
07/04/23 14
07/04/23 15
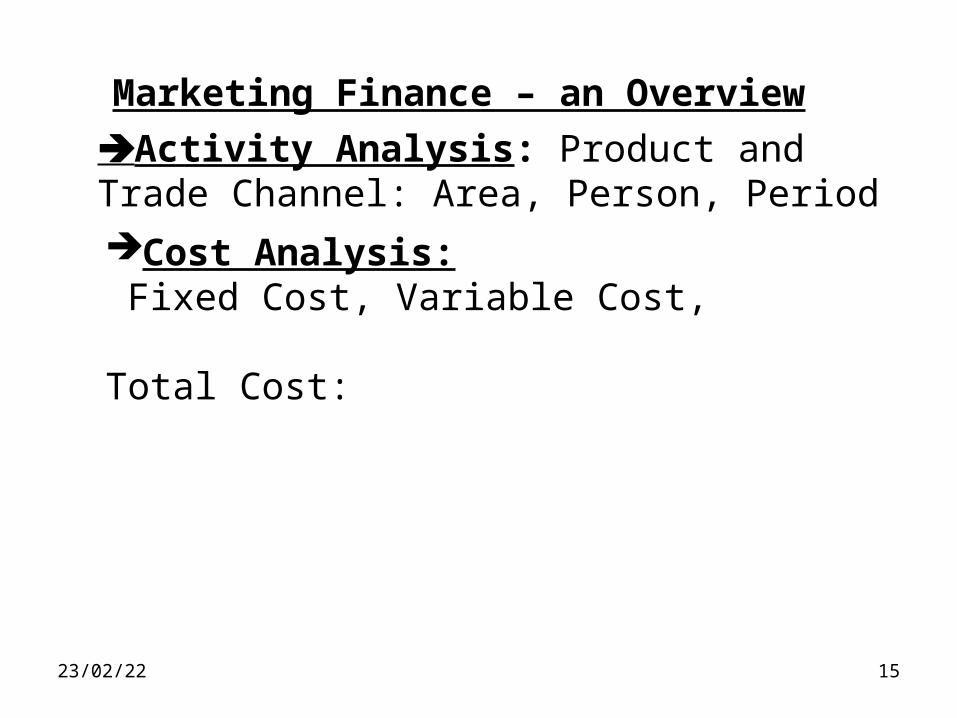
Marketing Finance – an Overview
Activity Analysis: Product and Trade Channel: Area, Person, Period
Cost Analysis: Fixed Cost, Variable Cost, Total Cost:
07/04/23 16
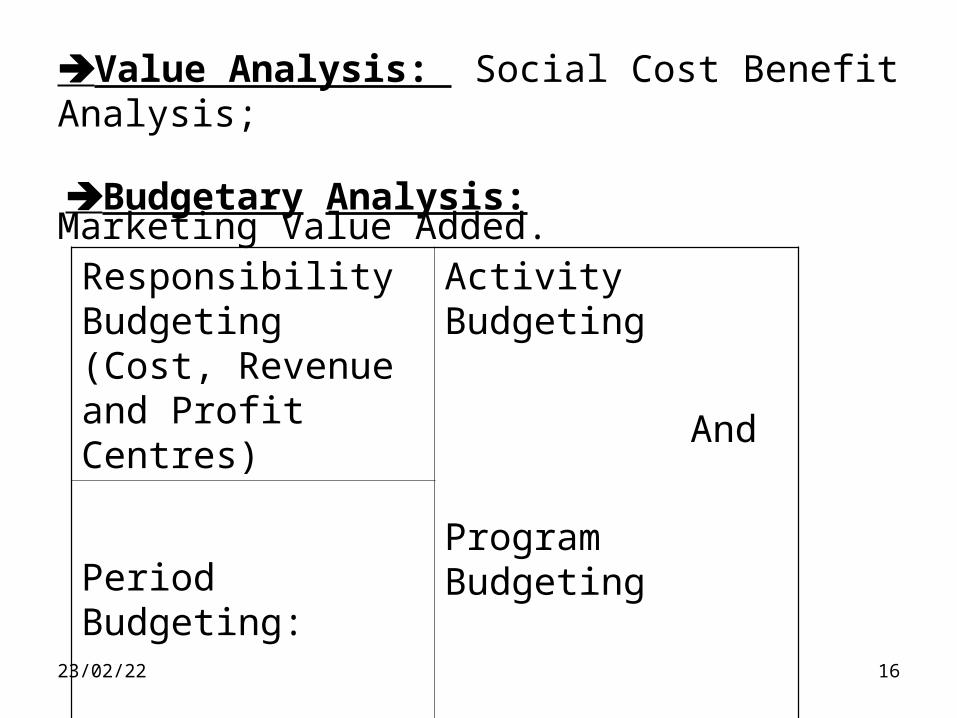
Value Analysis: Social Cost Benefit Analysis;
Marketing Value Added.
Budgetary Analysis:
Responsibility Budgeting (Cost, Revenue and Profit Centres)
Activity Budgeting
And
Program BudgetingPeriod Budgeting:
07/04/23 17
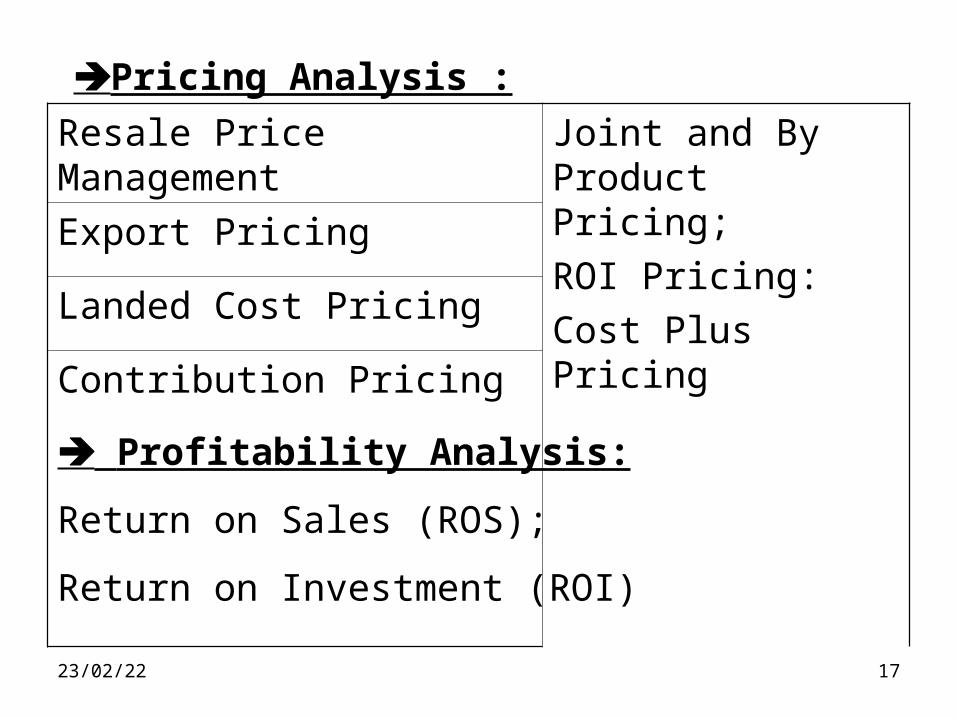
Pricing Analysis :
Profitability Analysis:
Return on Sales (ROS);
Return on Investment (ROI)
Resale Price Management Joint and By Product Pricing;
ROI Pricing:
Cost Plus Pricing
Export Pricing
Landed Cost Pricing
Contribution Pricing

07/04/23 18
Role of Mktg. Dept. in Marketing Finance (MF)
• Review Mktg. objectives, develop long and short range mktg. plans, coordinate all the specific functions and evaluate overall mktg. performance.
• Responsibilities of the Head of Mktg.:
Taking effective decisions reg. Prices, Terms of Sale, Credit Policy, Distribution Channels, Advertising Media etc. And
Controlling the activities of the Mktg. Dept.
07/04/23 19
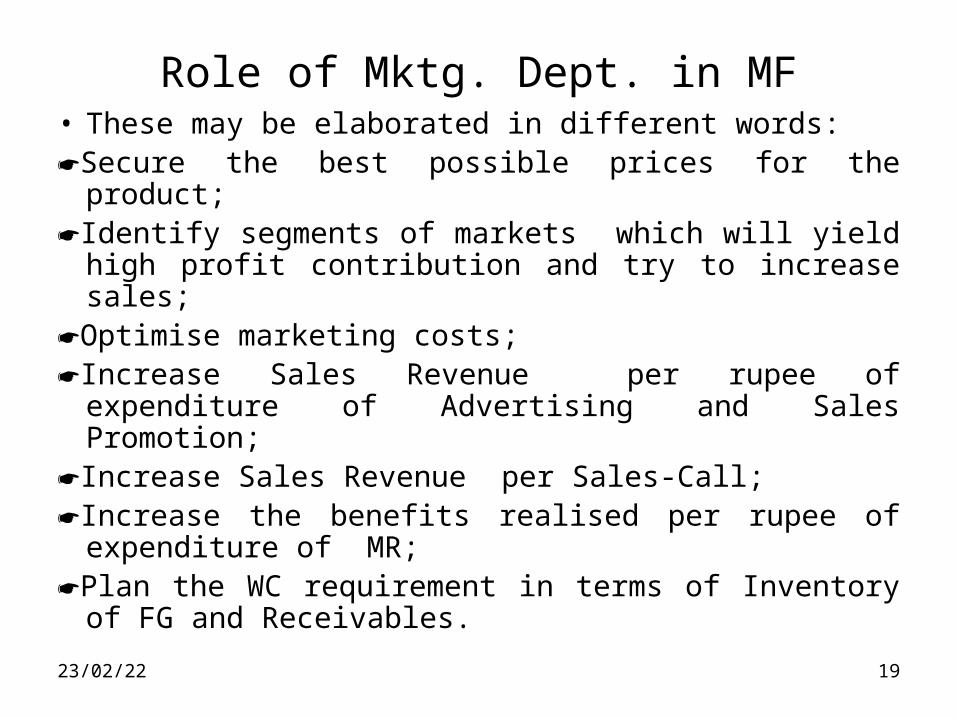
Role of Mktg. Dept. in MF• These may be elaborated in different words:Secure the best possible prices for the product; Identify segments of markets which will yield
high profit contribution and try to increase sales; Optimise marketing costs; Increase Sales Revenue per rupee of
expenditure of Advertising and Sales Promotion; Increase Sales Revenue per Sales-Call;Increase the benefits realised per rupee of
expenditure of MR;Plan the WC requirement in terms of Inventory of
FG and Receivables.
07/04/23 20
Mktg. and Finance – Interdependence
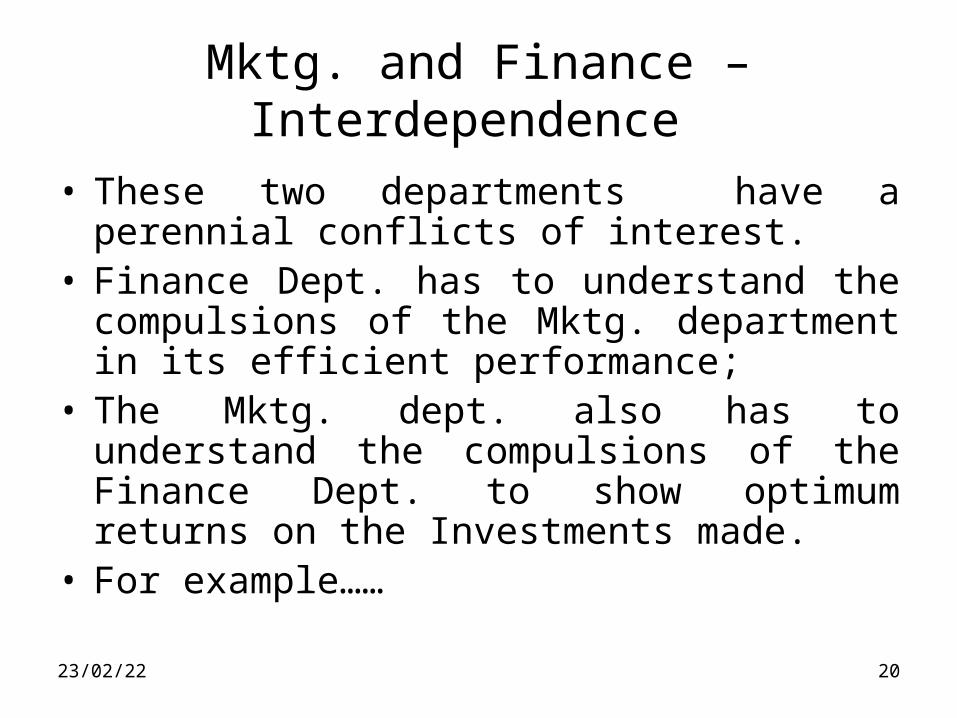
• These two departments have a perennial conflicts of interest.
• Finance Dept. has to understand the compulsions of the Mktg. department in its efficient performance;
• The Mktg. dept. also has to understand the compulsions of the Finance Dept. to show optimum returns on the Investments made.
• For example……
07/04/23 21
Mktg. and Finance – Interdependence
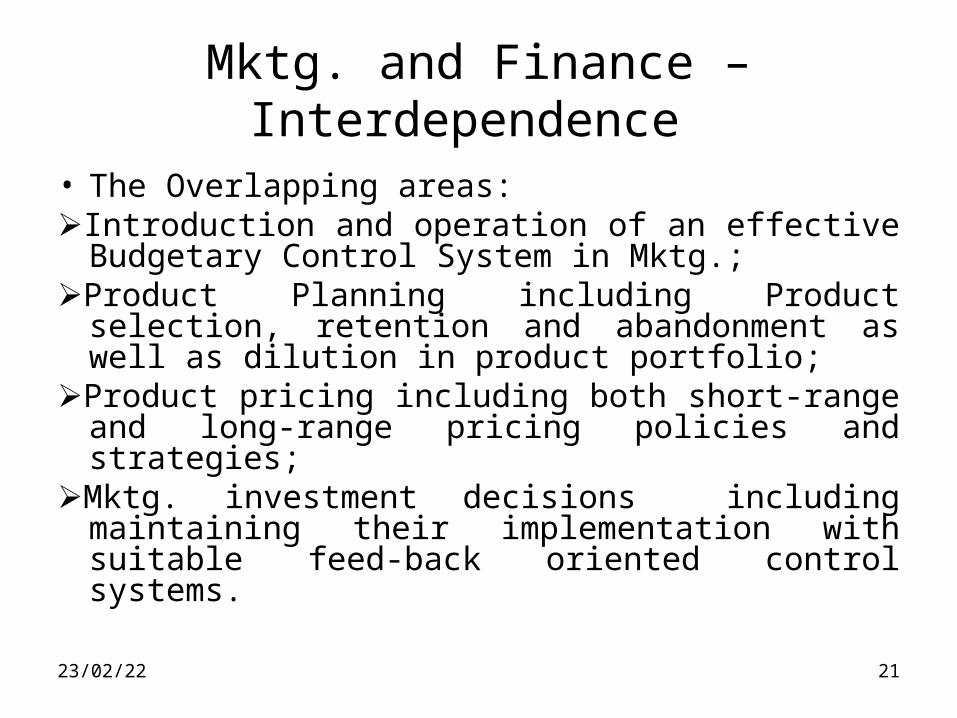
• The Overlapping areas:Introduction and operation of an effective
Budgetary Control System in Mktg.;Product Planning including Product selection,
retention and abandonment as well as dilution in product portfolio;
Product pricing including both short-range and long-range pricing policies and strategies;
Mktg. investment decisions including maintaining their implementation with suitable feed-back oriented control systems.
07/04/23 22
Mktg. and Finance – Interdependence
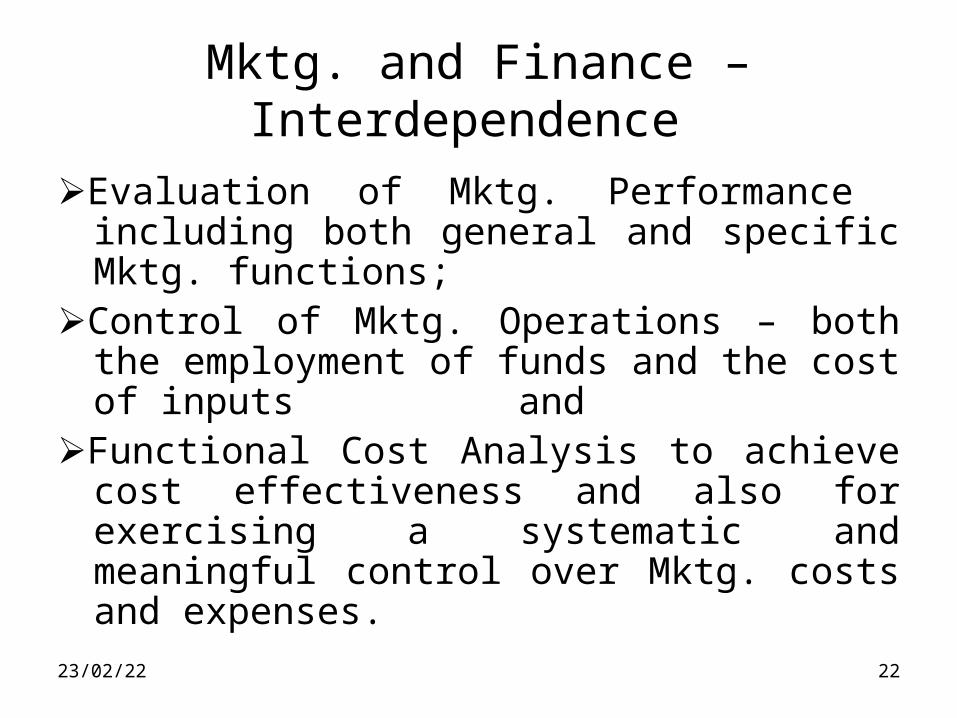
Evaluation of Mktg. Performance including both general and specific Mktg. functions;
Control of Mktg. Operations – both the employment of funds and the cost of inputs and
Functional Cost Analysis to achieve cost effectiveness and also for exercising a systematic and meaningful control over Mktg. costs and expenses.
07/04/23 23
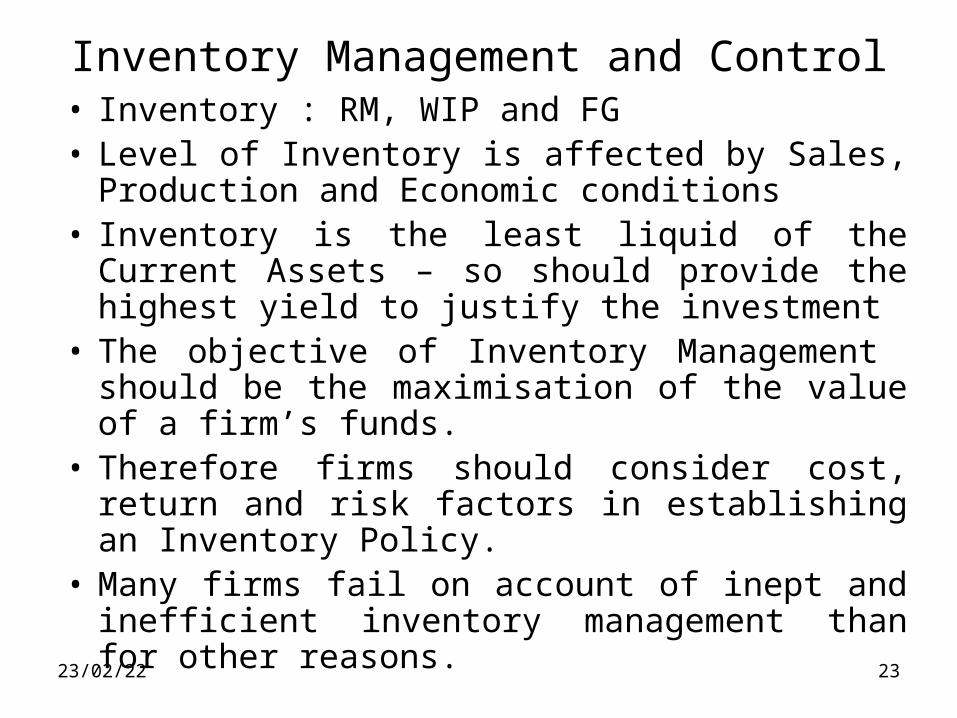
Inventory Management and Control• Inventory : RM, WIP and FG• Level of Inventory is affected by Sales,
Production and Economic conditions• Inventory is the least liquid of the Current Assets
– so should provide the highest yield to justify the investment
• The objective of Inventory Management should be the maximisation of the value of a firm’s funds.
• Therefore firms should consider cost, return and risk factors in establishing an Inventory Policy.
• Many firms fail on account of inept and inefficient inventory management than for other reasons.
Inventory Management and Control
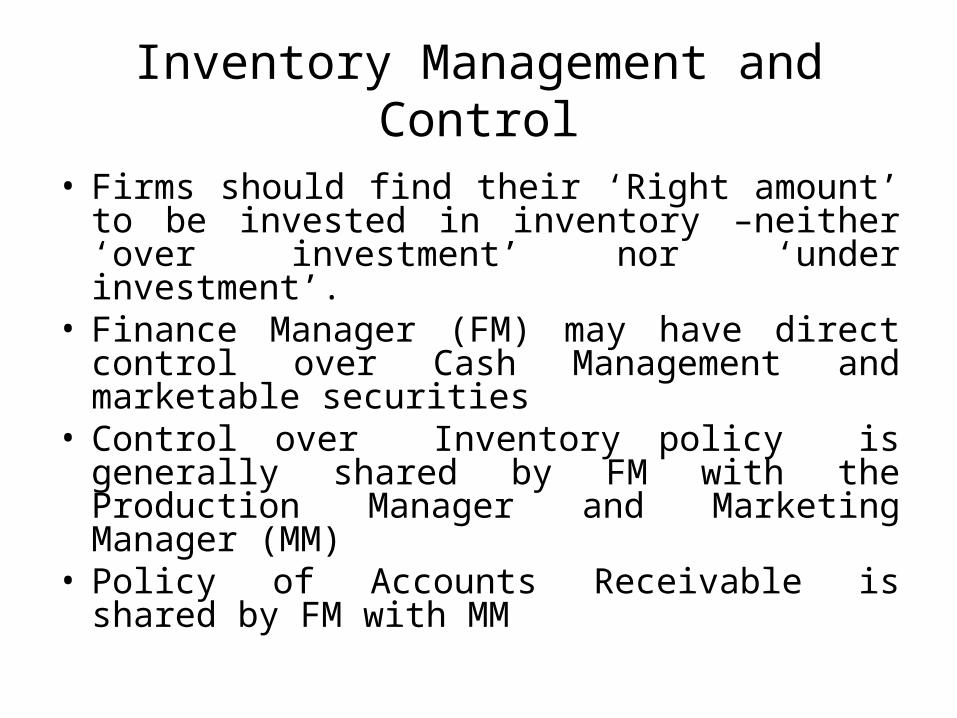
• Firms should find their ‘Right amount’ to be invested in inventory –neither ‘over investment’ nor ‘under investment’.
• Finance Manager (FM) may have direct control over Cash Management and marketable securities
• Control over Inventory policy is generally shared by FM with the Production Manager and Marketing Manager (MM)
• Policy of Accounts Receivable is shared by FM with MM
Inventory Management and Control
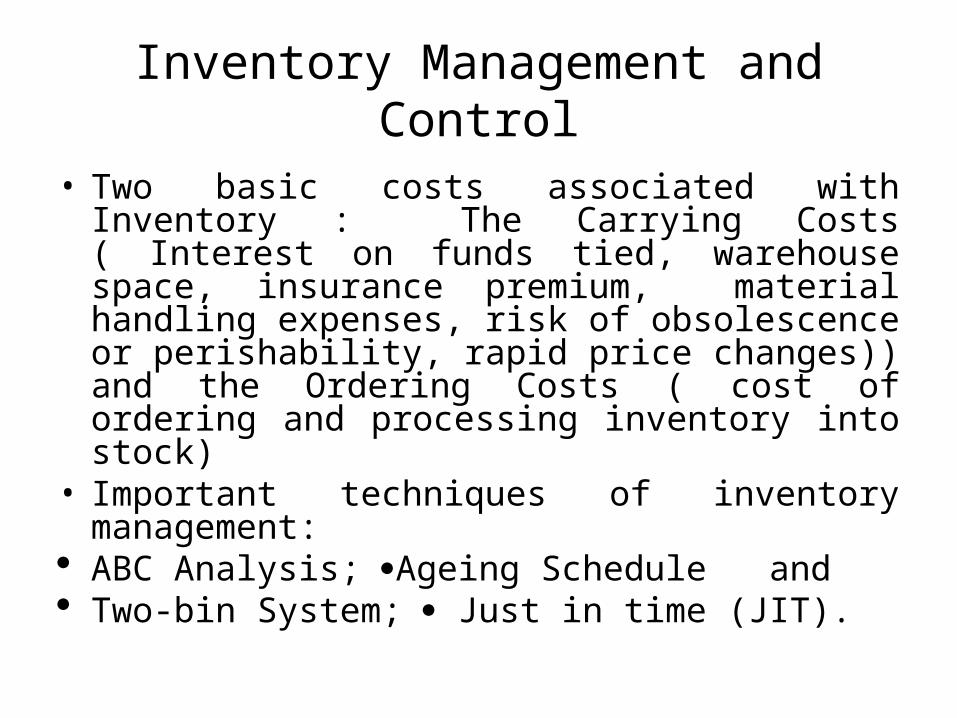
• Two basic costs associated with Inventory : The Carrying Costs ( Interest on funds tied, warehouse space, insurance premium, material handling expenses, risk of obsolescence or perishability, rapid price changes)) and the Ordering Costs ( cost of ordering and processing inventory into stock)
• Important techniques of inventory management: ABC Analysis; Ageing Schedule and Two-bin System; Just in time (JIT).

Inventory Management and Control
Decision on Inventory level is based on the Sales forecast, products manufactured, business scenario and overall policy of the company.
There is a trade-off between the level of inventory and effective functioning of the organisation.
ABC Analysis: An effective tool of inventory control. Through ABC analysis each item of inventory is categorised as A, B or C depending on its relative importance judged by its unit and or transaction value during a period….
07/04/23 27
Inventory Management and Control
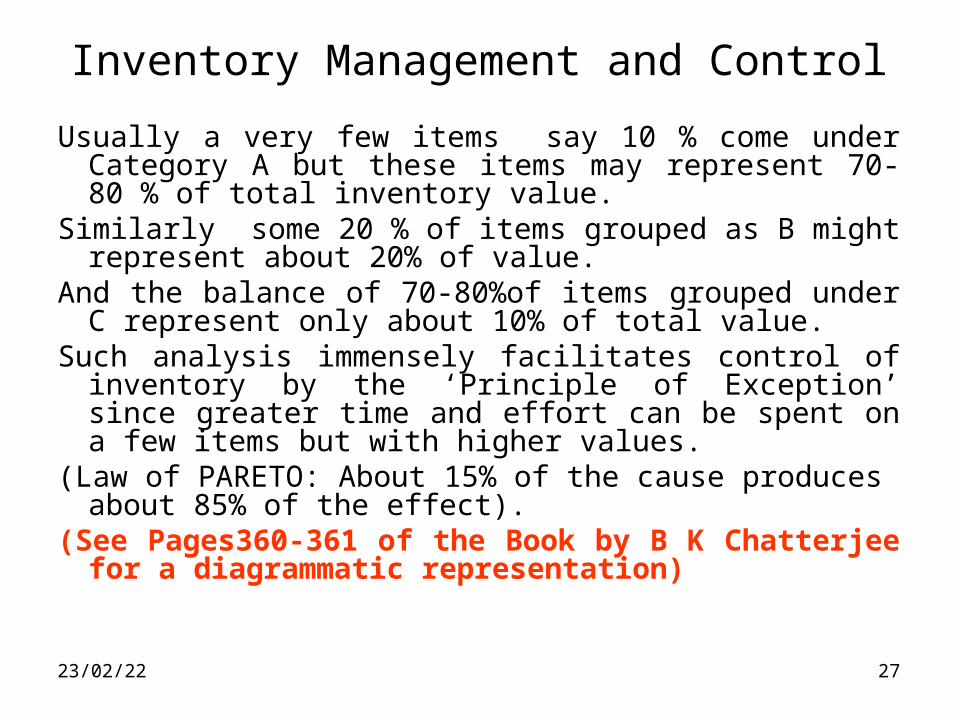
Usually a very few items say 10 % come under Category A but these items may represent 70- 80 % of total inventory value.
Similarly some 20 % of items grouped as B might represent about 20% of value.
And the balance of 70-80%of items grouped under C represent only about 10% of total value.
Such analysis immensely facilitates control of inventory by the ‘Principle of Exception’ since greater time and effort can be spent on a few items but with higher values.
(Law of PARETO: About 15% of the cause produces about 85% of the effect).
(See Pages360-361 of the Book by B K Chatterjee for a diagrammatic representation)

07/04/23 28
Inventory Management and Control
RM: Bulk discounts, lower ordering/transport cost vs. reduced inventory carrying cost, less risk of deterioration or obsolescence, reduced storage space and less handling and insurance cost; …….
WIP: Safeguard against machine breakdowns, Economic production runs and lower machine setting costs vs. reduced inventory carrying costs and more elbow room in the factory premises;
07/04/23 29
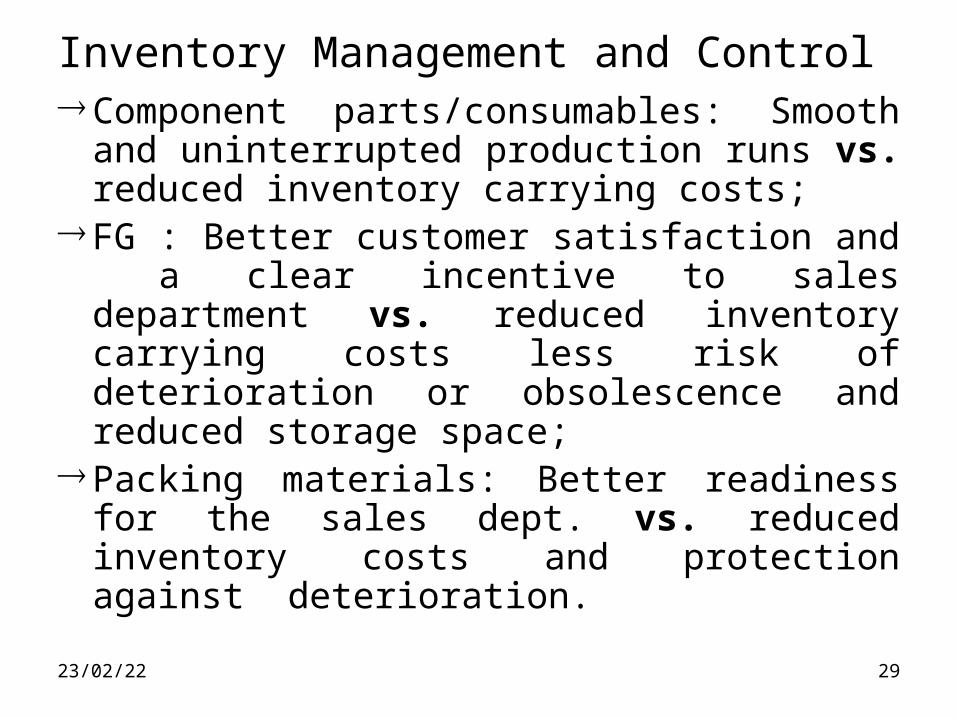
Inventory Management and Control Component parts/consumables: Smooth and
uninterrupted production runs vs. reduced inventory carrying costs;
FG : Better customer satisfaction and a clear incentive to sales department vs. reduced inventory carrying costs less risk of deterioration or obsolescence and reduced storage space;
Packing materials: Better readiness for the sales dept. vs. reduced inventory costs and protection against deterioration.
07/04/23 30
Accounts Receivables Management
• Define ‘Accounts Receivable’- Debt owed to the firm by customers resulting from sales of goods or services on credit in the ordinary course of business. (Part of modern competitive environment)
• Firms sell goods on credit to achieve the sales targets and keep the sales growing. The also incur some expenses on credit sales.
• Credit period extended by the firms is a policy decision.
07/04/23 31
Accounts Receivables Management
• Receivables represent an important major part of Current Assets of a firm.
• Receivables = Av. Daily Credit Sales x Av. Collection period • No sale is complete until money is collected from
the customer. • The responsibility for such collection should
generally rest with the sales personnel concerned. • Non collection or even delay in collection of
receivables invariably results in steady erosion of profits generated through sales.
07/04/23 32
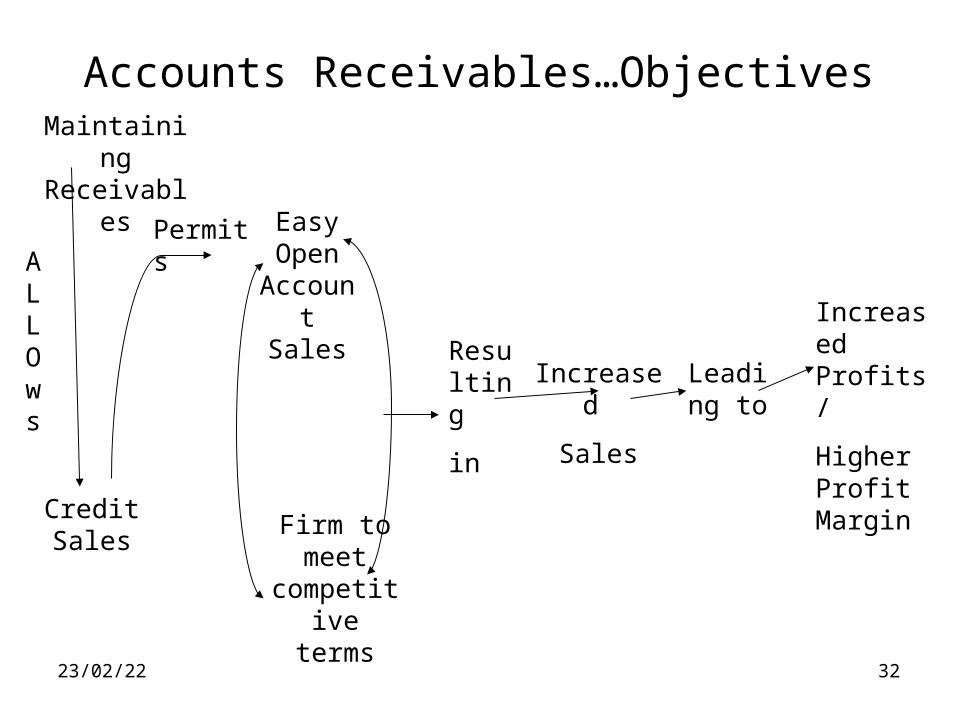
Accounts Receivables…ObjectivesMaintaining Receivables
Permits
Leading to
Credit Sales
Increased
Sales
Easy Open
Account Sales
Firm to meet
competitive terms
ALLOws
Resulting
in
Increased Profits/
Higher Profit Margin
07/04/23 33
Accounts Receivables…Objectives
Benefits:Boosting sales and profits because of liberal policy; Can attract new customers (a growth –oriented
notion); Can protect current sales against competition.Costs: Collection costs: additional expenses for staff,
stationery, postage… Capital Cost: to keep production cycle running in the
extended receivables period Delinquency costs: failure of the customers to pay in
time… Default Costs: bad debts to be written off.
07/04/23 34
Accounts Receivables…Objectives:
• Costs will be higher with liberal policies than with more stringent policies.
• A prudent receivables management is required to achieve at a balanced trade-off between profit and risk.
• Management of Receivables depends on two factors:
General Economic conditions which are external to the organisation – no control over the economic variables
Credit and Collection Policies: not independent of the policies of the other players in the industry.
Credit and collection policies are interrelated with pricing policy and must be viewed as an overall competitive process.
07/04/23 35
Accounts Receivables: Credit Policy
• The important dimensions of a firm’s credit policy are:
Credit Standards; Credit Period; Cash Discount and Collection Programme.
Credit Standards: Criteria adopted by a firm to extend credit to customers.
Quantitative basis for setting standards: Credit ratings, credit references, Av. Collection Period (ACP) and financial ratios.
Standards may be : (i) tight or restrictive (ii) liberal or non-restrictive.
The trade-off is with collection cost, level of sales, ACP and level of bad debt losses.
07/04/23 36
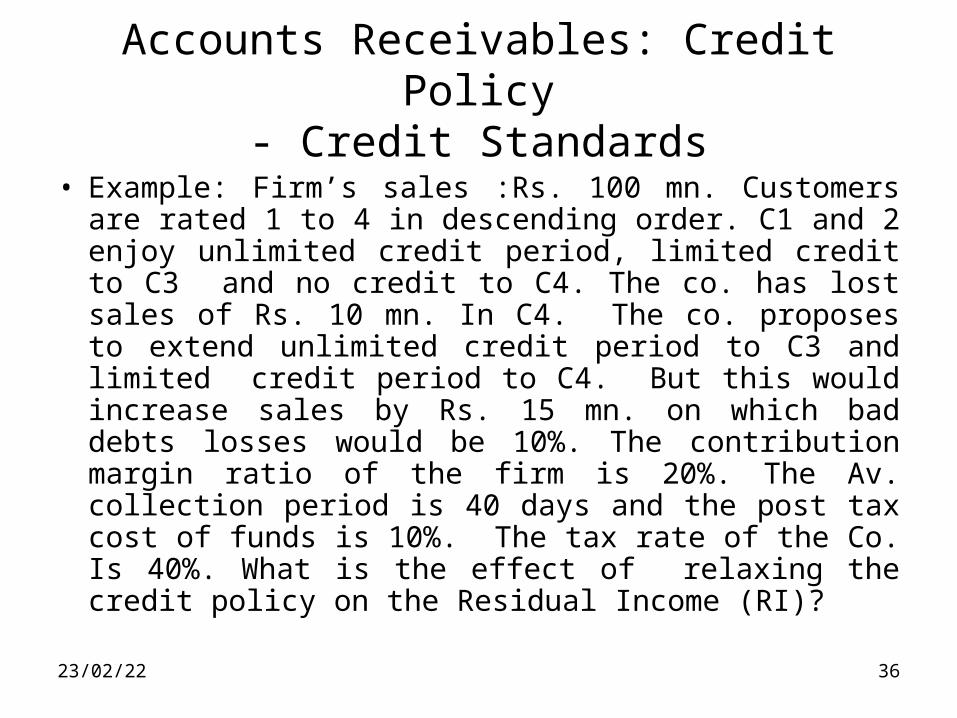
Accounts Receivables: Credit Policy- Credit Standards
• Example: Firm’s sales :Rs. 100 mn. Customers are rated 1 to 4 in descending order. C1 and 2 enjoy unlimited credit period, limited credit to C3 and no credit to C4. The co. has lost sales of Rs. 10 mn. In C4. The co. proposes to extend unlimited credit period to C3 and limited credit period to C4. But this would increase sales by Rs. 15 mn. on which bad debts losses would be 10%. The contribution margin ratio of the firm is 20%. The Av. collection period is 40 days and the post tax cost of funds is 10%. The tax rate of the Co. Is 40%. What is the effect of relaxing the credit policy on the Residual Income (RI)?
07/04/23 37
Accounts Receivables: Credit Policy - Credit Standards
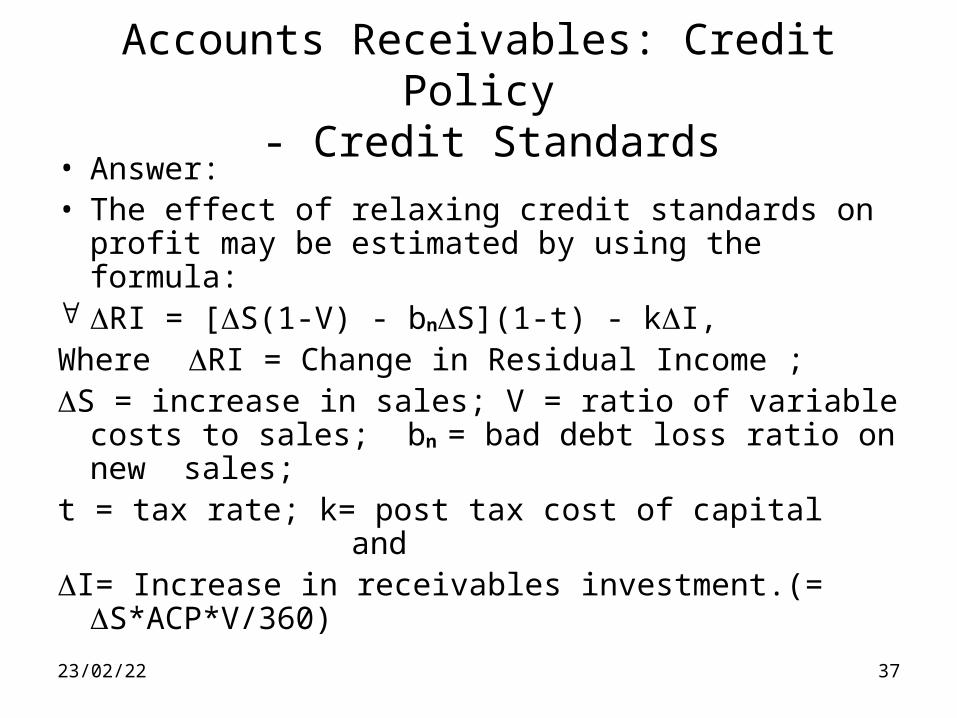
• Answer: • The effect of relaxing credit standards on profit may
be estimated by using the formula: RI = [S(1-V) - bnS](1-t) - kI, Where RI = Change in Residual Income ; S = increase in sales; V = ratio of variable costs to
sales; bn = bad debt loss ratio on new sales;t = tax rate; k= post tax cost of capital and I= Increase in receivables investment.(=
S*ACP*V/360)
Accounts Receivables: Credit Policy - Credit Standards
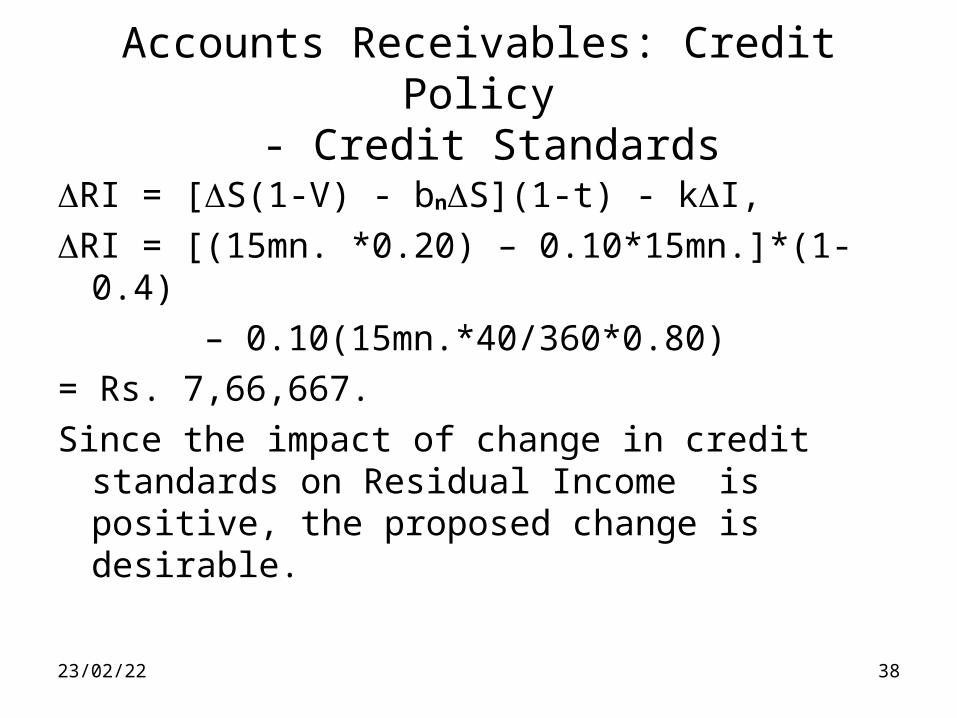
RI = [S(1-V) - bnS](1-t) - kI,
RI = [(15mn. *0.20) – 0.10*15mn.]*(1-0.4)
– 0.10(15mn.*40/360*0.80)
= Rs. 7,66,667.
Since the impact of change in credit standards on Residual Income is positive, the proposed change is desirable.
07/04/23 38
07/04/23 39
Accounts Receivables: Credit Policy - Credit Period
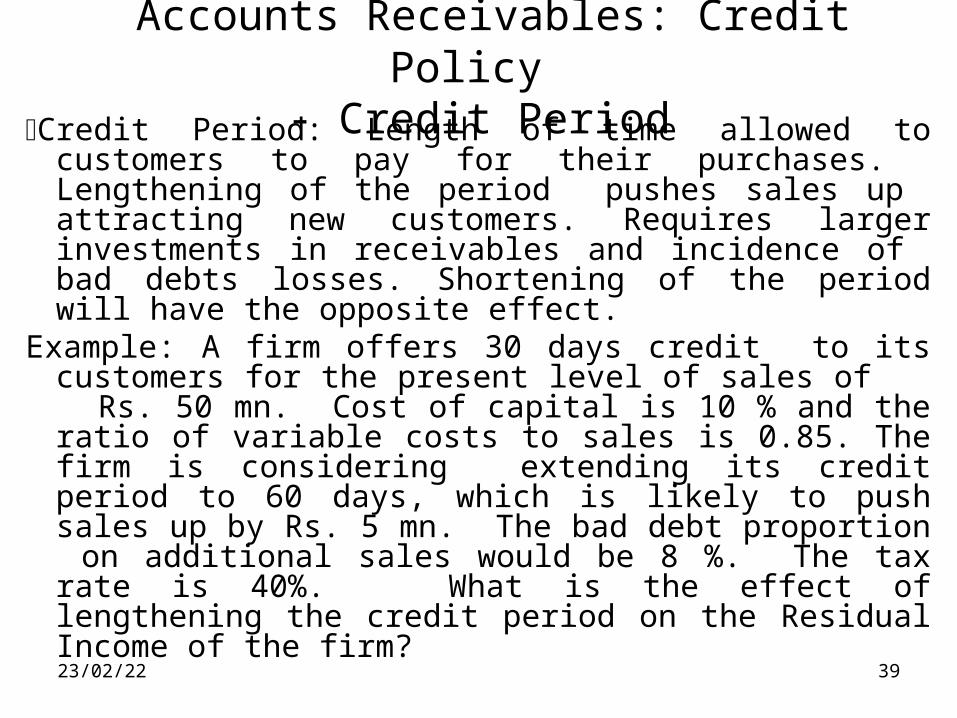
Credit Period: Length of time allowed to customers to pay for their purchases. Lengthening of the period pushes sales up attracting new customers. Requires larger investments in receivables and incidence of bad debts losses. Shortening of the period will have the opposite effect.
Example: A firm offers 30 days credit to its customers for the present level of sales of Rs. 50 mn. Cost of capital is 10 % and the ratio of variable costs to sales is 0.85. The firm is considering extending its credit period to 60 days, which is likely to push sales up by Rs. 5 mn. The bad debt proportion on additional sales would be 8 %. The tax rate is 40%. What is the effect of lengthening the credit period on the Residual Income of the firm?
07/04/23 40
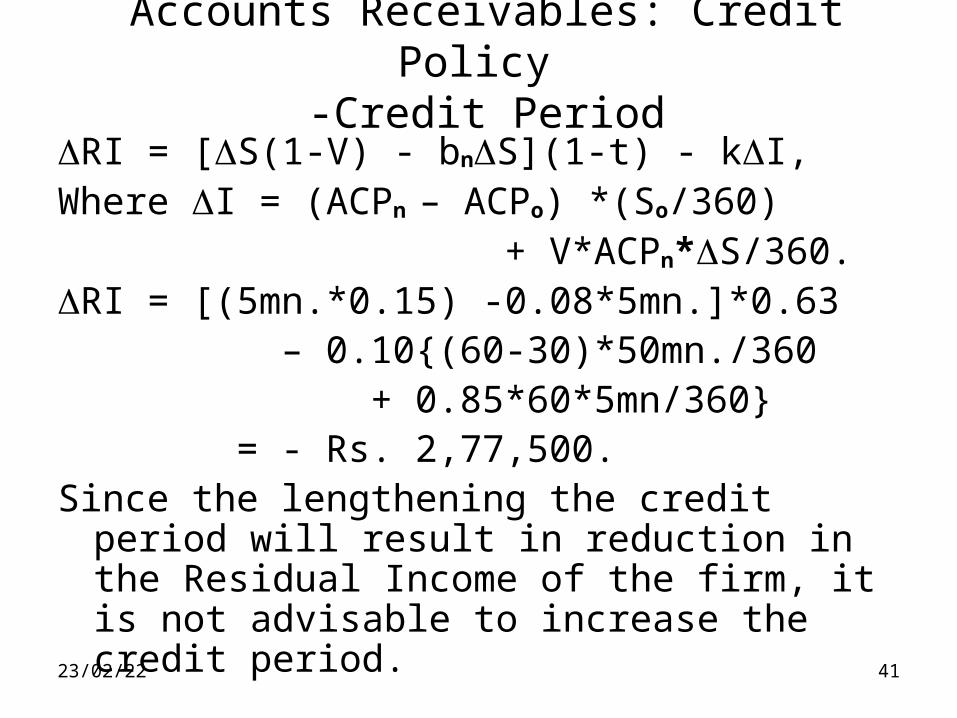
Accounts Receivables: Credit Policy -Credit Period
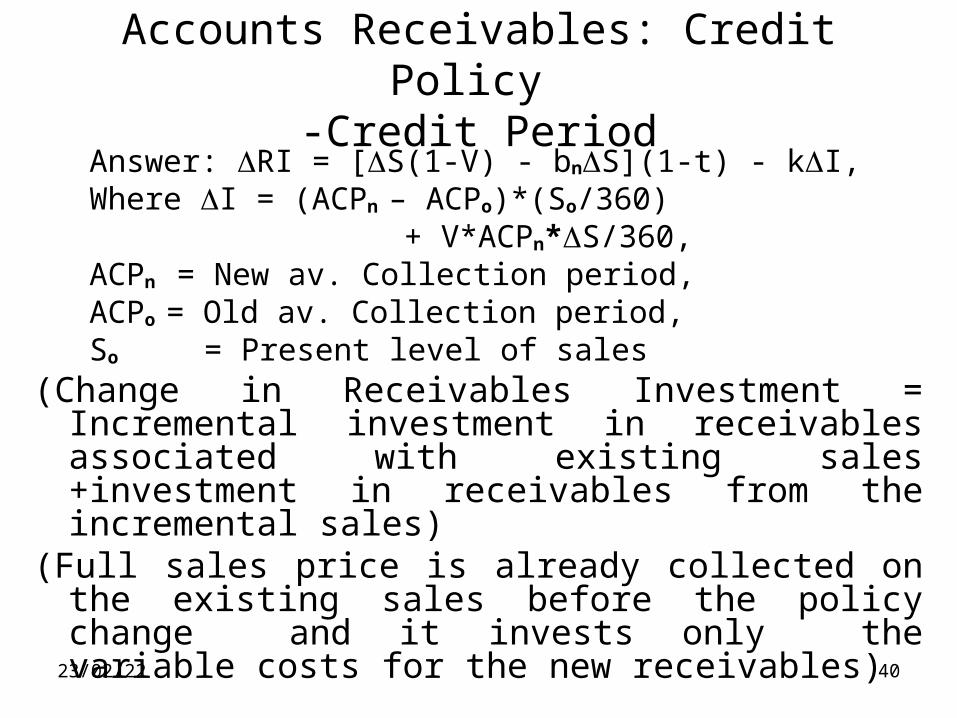
Answer: RI = [S(1-V) - bnS](1-t) - kI, Where I = (ACPn – ACPo)*(So/360) + V*ACPn*S/360, ACPn = New av. Collection period, ACPo = Old av. Collection period, So = Present level of sales(Change in Receivables Investment = Incremental
investment in receivables associated with existing sales +investment in receivables from the incremental sales)
(Full sales price is already collected on the existing sales before the policy change and it invests only the variable costs for the new receivables)
07/04/23 41
Accounts Receivables: Credit Policy -Credit Period
RI = [S(1-V) - bnS](1-t) - kI, Where I = (ACPn – ACPo) *(So/360) + V*ACPn*S/360.RI = [(5mn.*0.15) -0.08*5mn.]*0.63 – 0.10{(60-30)*50mn./360 + 0.85*60*5mn/360} = - Rs. 2,77,500.Since the lengthening the credit period will result in
reduction in the Residual Income of the firm, it is not advisable to increase the credit period.
07/04/23 42
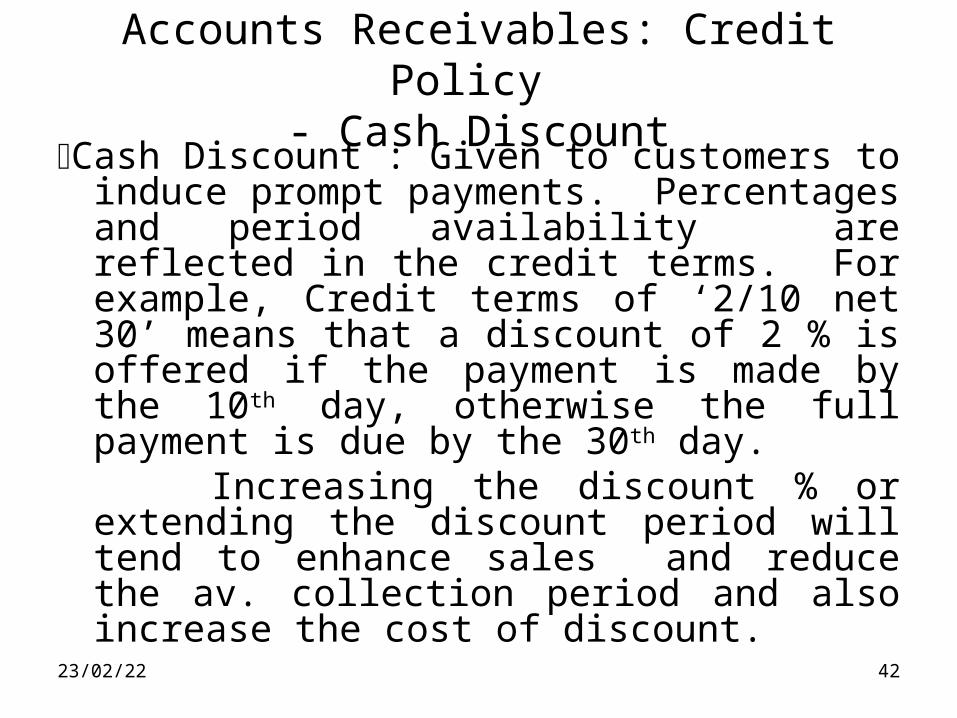
Accounts Receivables: Credit Policy - Cash Discount
Cash Discount : Given to customers to induce prompt payments. Percentages and period availability are reflected in the credit terms. For example, Credit terms of ‘2/10 net 30’ means that a discount of 2 % is offered if the payment is made by the 10th day, otherwise the full payment is due by the 30th day.
Increasing the discount % or extending the discount period will tend to enhance sales and reduce the av. collection period and also increase the cost of discount.
07/04/23 43
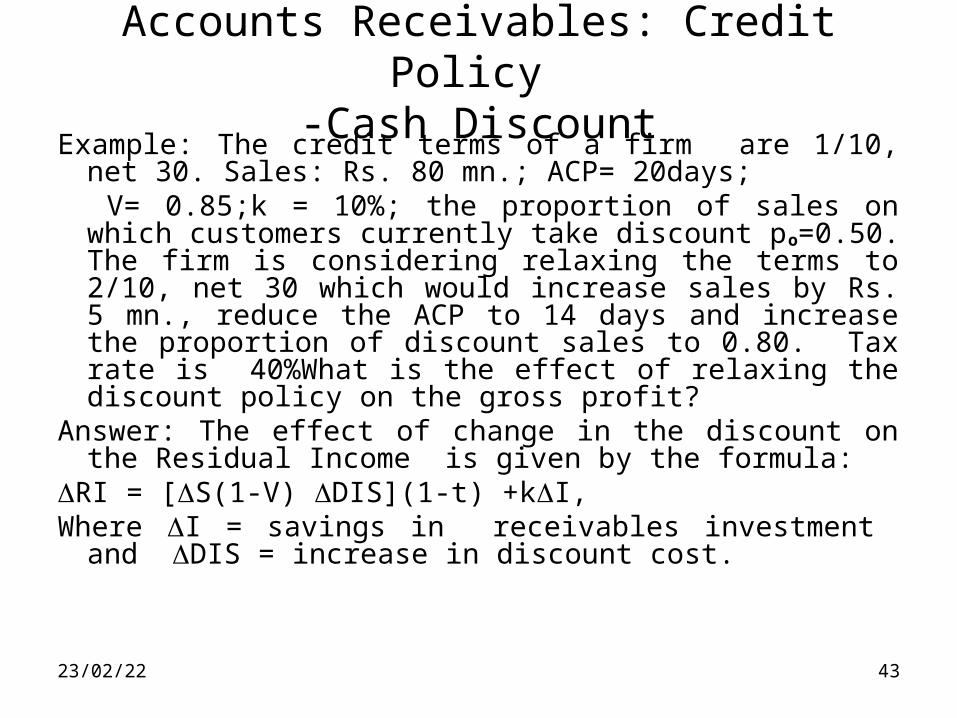
Accounts Receivables: Credit Policy -Cash Discount
Example: The credit terms of a firm are 1/10, net 30. Sales: Rs. 80 mn.; ACP= 20days;
V= 0.85;k = 10%; the proportion of sales on which customers currently take discount po=0.50. The firm is considering relaxing the terms to 2/10, net 30 which would increase sales by Rs. 5 mn., reduce the ACP to 14 days and increase the proportion of discount sales to 0.80. Tax rate is 40%What is the effect of relaxing the discount policy on the gross profit?
Answer: The effect of change in the discount on the Residual Income is given by the formula:
RI = [S(1-V) DIS](1-t) +kI,Where I = savings in receivables investment and DIS
= increase in discount cost.
07/04/23 44
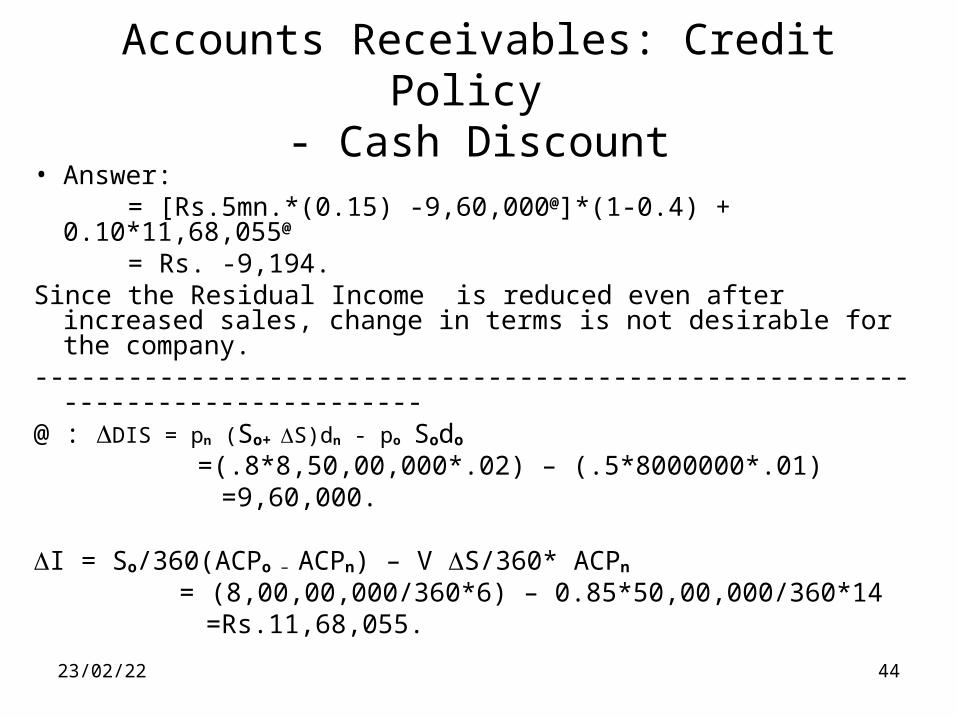
Accounts Receivables: Credit Policy - Cash Discount
• Answer: = [Rs.5mn.*(0.15) -9,60,000@]*(1-0.4) + 0.10*11,68,055@
= Rs. -9,194.Since the Residual Income is reduced even after increased
sales, change in terms is not desirable for the company.-------------------------------------------------------------------------------@ : DIS = pn (So+ S)dn - po Sodo
=(.8*8,50,00,000*.02) – (.5*8000000*.01) =9,60,000.
I = So/360(ACPo – ACPn) – V S/360* ACPn
= (8,00,00,000/360*6) – 0.85*50,00,000/360*14 =Rs.11,68,055.
07/04/23 45
Accounts Receivables: Credit Policy-Collection Programme
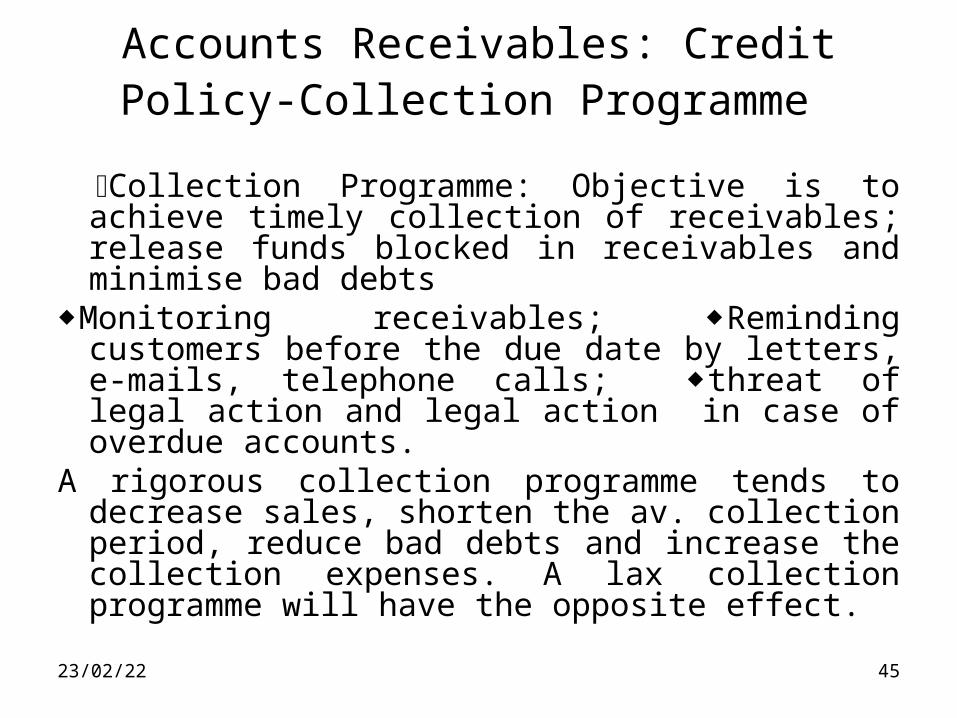
Collection Programme: Objective is to achieve timely collection of receivables; release funds blocked in receivables and minimise bad debts
Monitoring receivables; Reminding customers before the due date by letters, e-mails, telephone calls; threat of legal action and legal action in case of overdue accounts.
A rigorous collection programme tends to decrease sales, shorten the av. collection period, reduce bad debts and increase the collection expenses. A lax collection programme will have the opposite effect.
07/04/23 46
Accounts Receivables: Credit Policy
Monitoring receivables: Some of the measures: monitoring of Av. collection period (ACP); Ageing Schedule (AS); Conversion matrix and Float analysis.
07/04/23 47
Accounts Receivables: Credit Policy-Collection Programme
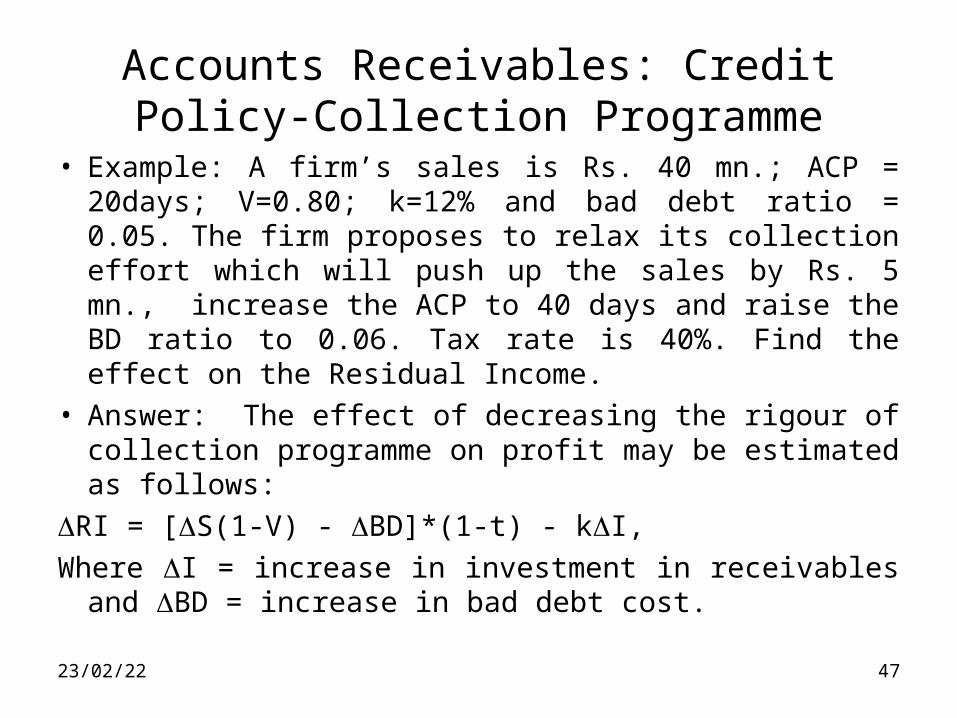
• Example: A firm’s sales is Rs. 40 mn.; ACP = 20days; V=0.80; k=12% and bad debt ratio = 0.05. The firm proposes to relax its collection effort which will push up the sales by Rs. 5 mn., increase the ACP to 40 days and raise the BD ratio to 0.06. Tax rate is 40%. Find the effect on the Residual Income.
• Answer: The effect of decreasing the rigour of collection programme on profit may be estimated as follows:
RI = [S(1-V) - BD]*(1-t) - kI,
Where I = increase in investment in receivables and BD = increase in bad debt cost.
07/04/23 48
Accounts Receivables: Credit Policy-Collection Programme
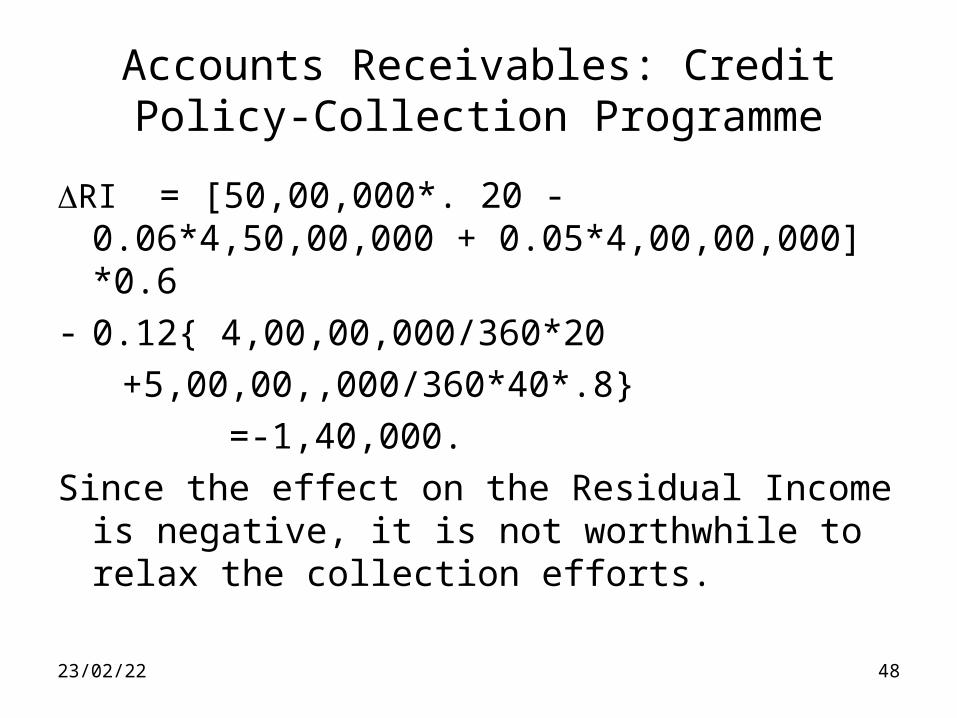
RI = [50,00,000*. 20 -0.06*4,50,00,000 + 0.05*4,00,00,000] *0.6
- 0.12{ 4,00,00,000/360*20
+5,00,00,,000/360*40*.8}
=-1,40,000.
Since the effect on the Residual Income is negative, it is not worthwhile to relax the collection efforts.
07/04/23 49
Accounts Receivables: Credit Policy-Credit Evaluation
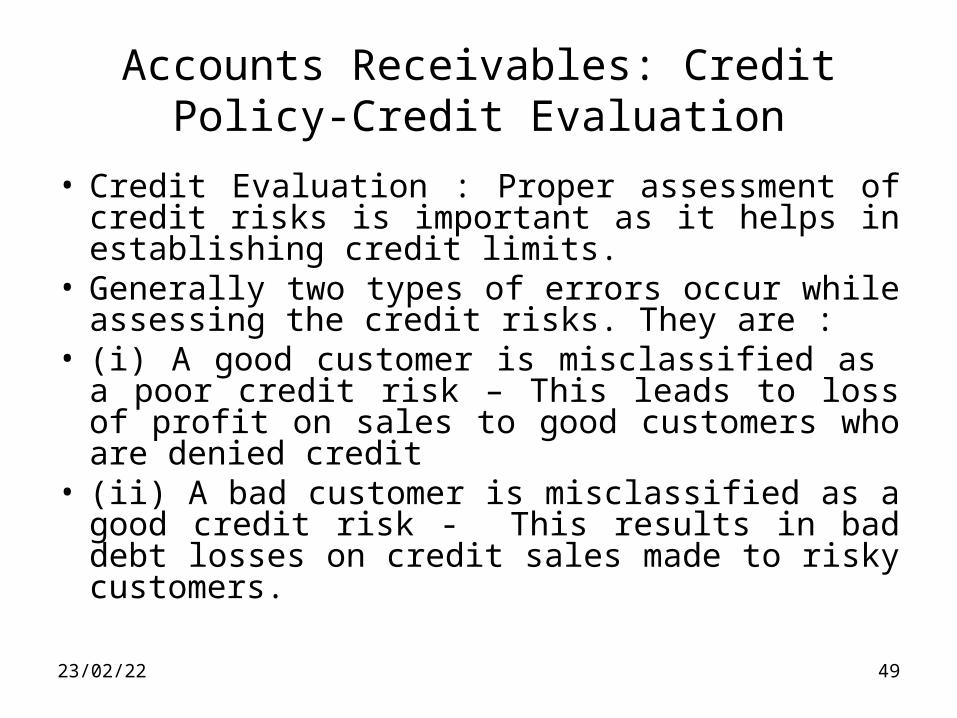
• Credit Evaluation : Proper assessment of credit risks is important as it helps in establishing credit limits.
• Generally two types of errors occur while assessing the credit risks. They are :
• (i) A good customer is misclassified as a poor credit risk – This leads to loss of profit on sales to good customers who are denied credit
• (ii) A bad customer is misclassified as a good credit risk - This results in bad debt losses on credit sales made to risky customers.
Accounts Receivables: Credit Policy-Credit Evaluation
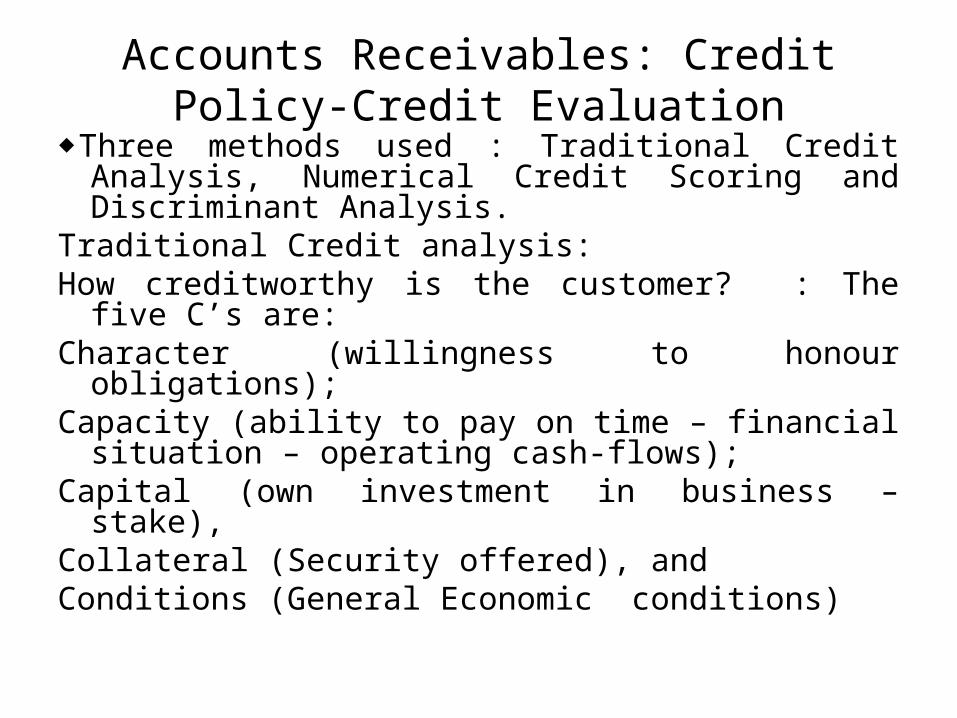
Three methods used : Traditional Credit Analysis, Numerical Credit Scoring and Discriminant Analysis.
Traditional Credit analysis: How creditworthy is the customer? : The five C’s are: Character (willingness to honour obligations);Capacity (ability to pay on time – financial situation –
operating cash-flows);Capital (own investment in business – stake),Collateral (Security offered), and Conditions (General Economic conditions)
Accounts Receivables: Credit Policy-Credit Evaluation
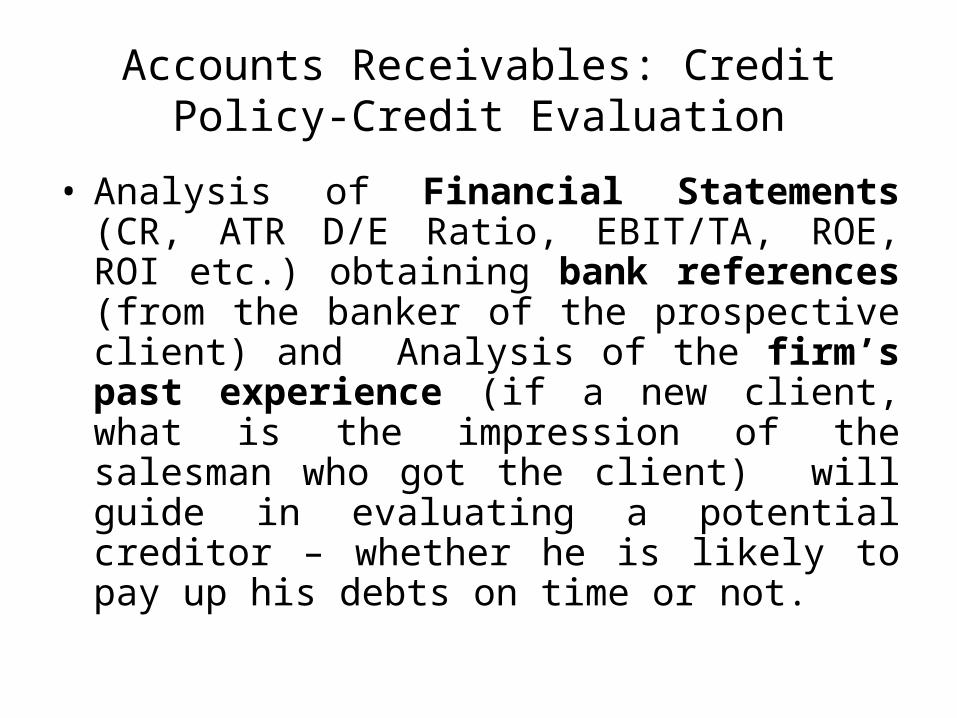
• Analysis of Financial Statements (CR, ATR D/E Ratio, EBIT/TA, ROE, ROI etc.) obtaining bank references (from the banker of the prospective client) and Analysis of the firm’s past experience (if a new client, what is the impression of the salesman who got the client) will guide in evaluating a potential creditor – whether he is likely to pay up his debts on time or not.
Accounts Receivables: Credit Policy-Credit Evaluation
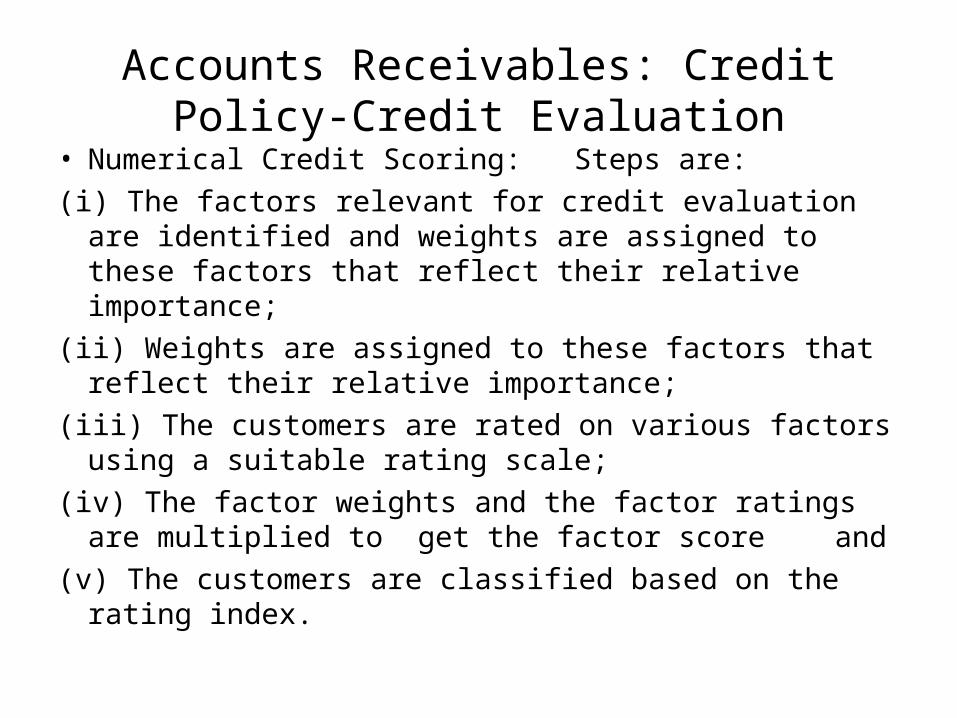
• Numerical Credit Scoring: Steps are:
(i) The factors relevant for credit evaluation are identified and weights are assigned to these factors that reflect their relative importance;
(ii) Weights are assigned to these factors that reflect their relative importance;
(iii) The customers are rated on various factors using a suitable rating scale;
(iv) The factor weights and the factor ratings are multiplied to get the factor score and
(v) The customers are classified based on the rating index.
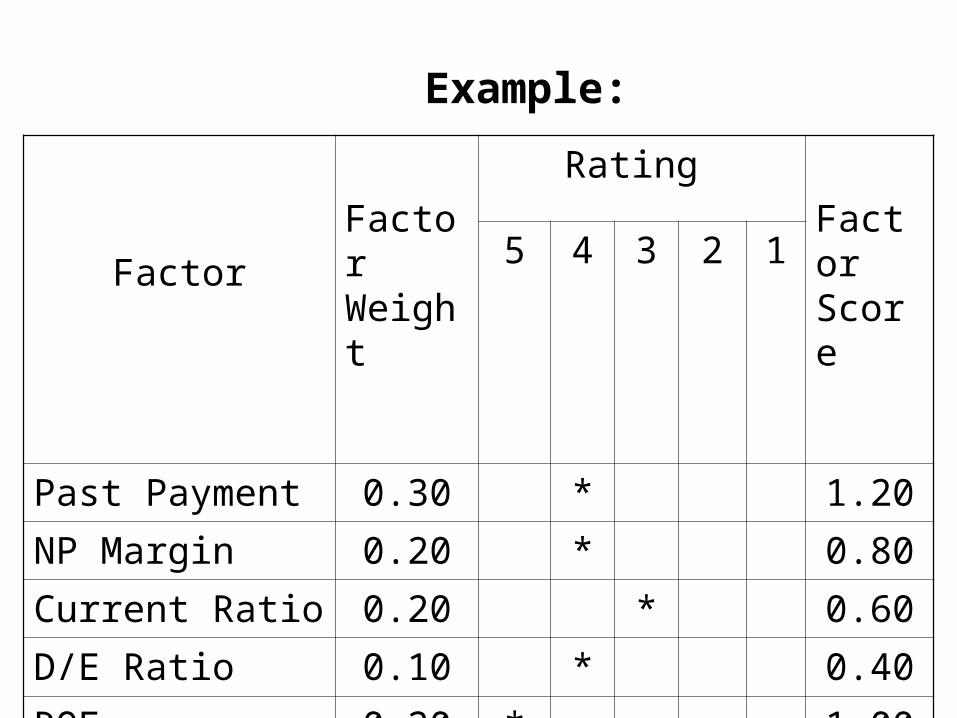
Factor
Factor Weight
Rating
Factor Score
5 4 3 2 1
Past Payment 0.30 * 1.20
NP Margin 0.20 * 0.80
Current Ratio 0.20 * 0.60
D/E Ratio 0.10 * 0.40
ROE 0.20 * 1.00
Rating Index 4.00
Example:
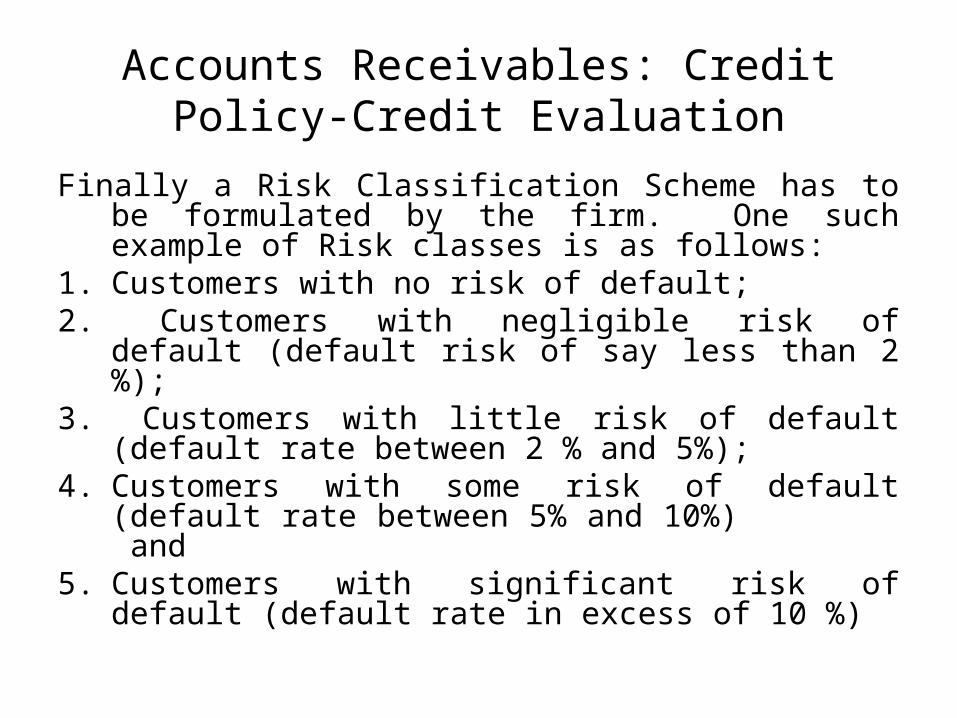
Accounts Receivables: Credit Policy-Credit Evaluation
Finally a Risk Classification Scheme has to be formulated by the firm. One such example of Risk classes is as follows:
1. Customers with no risk of default;2. Customers with negligible risk of default
(default risk of say less than 2 %);3. Customers with little risk of default (default
rate between 2 % and 5%);4. Customers with some risk of default (default
rate between 5% and 10%) and 5. Customers with significant risk of default
(default rate in excess of 10 %)
07/04/23 55
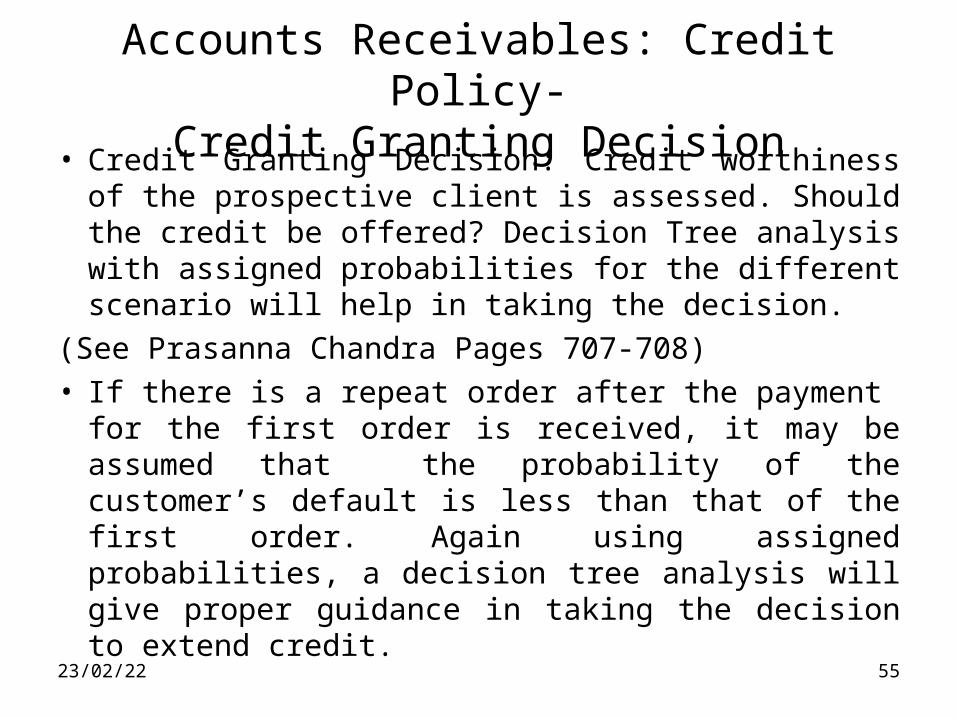
Accounts Receivables: Credit Policy-Credit Granting Decision
• Credit Granting Decision: Credit worthiness of the prospective client is assessed. Should the credit be offered? Decision Tree analysis with assigned probabilities for the different scenario will help in taking the decision.
(See Prasanna Chandra Pages 707-708)• If there is a repeat order after the payment for the
first order is received, it may be assumed that the probability of the customer’s default is less than that of the first order. Again using assigned probabilities, a decision tree analysis will give proper guidance in taking the decision to extend credit.
07/04/23 56
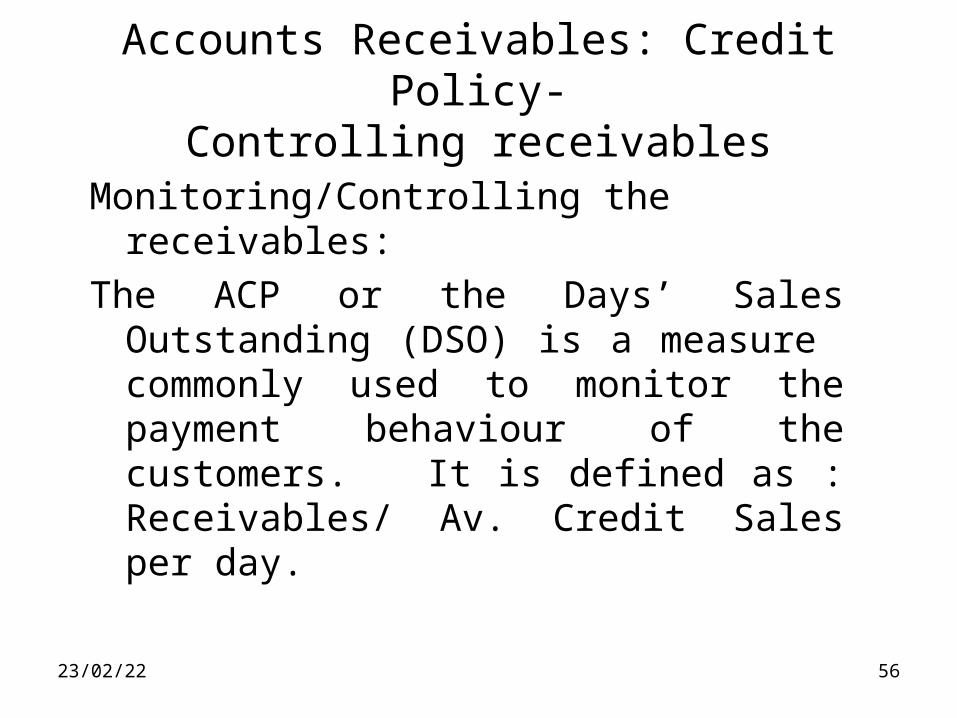
Accounts Receivables: Credit Policy-Controlling receivables
Monitoring/Controlling the receivables:
The ACP or the Days’ Sales Outstanding (DSO) is a measure commonly used to monitor the payment behaviour of the customers. It is defined as : Receivables/ Av. Credit Sales per day.
07/04/23 57
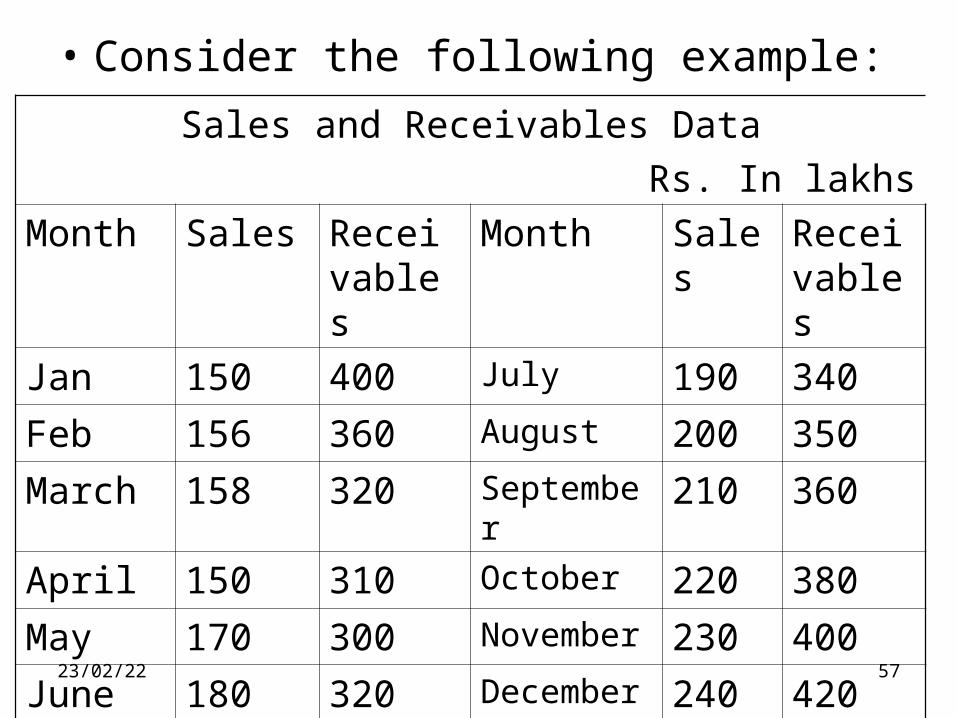
• Consider the following example:
Sales and Receivables Data
Rs. In lakhs
Month Sales Receivables
Month Sales Receivables
Jan 150 400 July 190 340
Feb 156 360 August 200 350
March 158 320 September 210 360
April 150 310 October 220 380
May 170 300 November 230 400
June 180 320 December 240 420
07/04/23 58
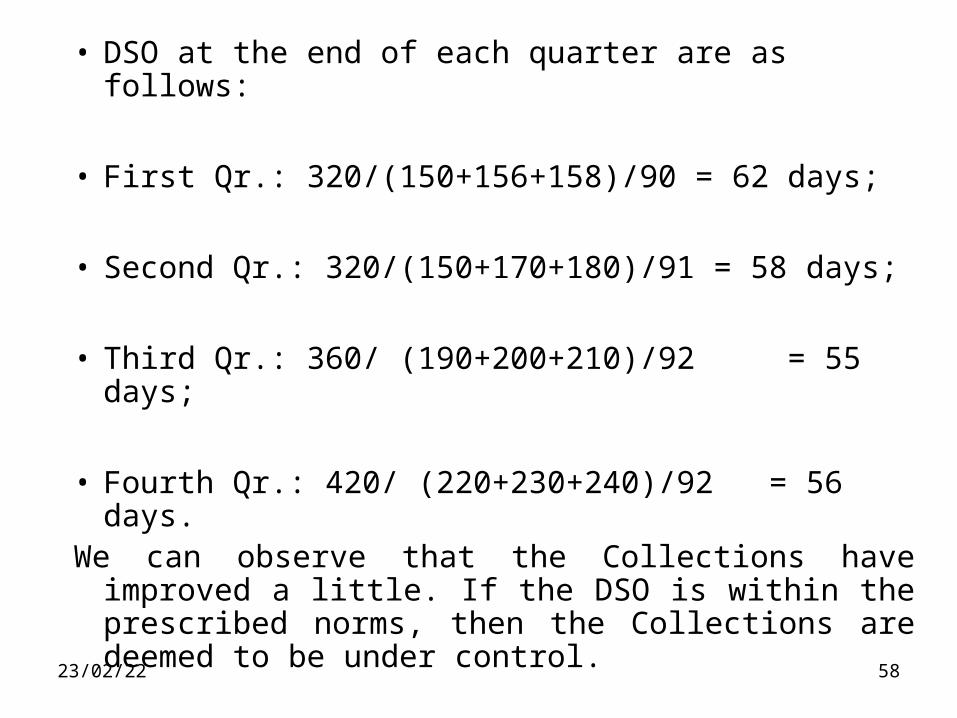
• DSO at the end of each quarter are as follows:
• First Qr.: 320/(150+156+158)/90 = 62 days;
• Second Qr.: 320/(150+170+180)/91 = 58 days;
• Third Qr.: 360/ (190+200+210)/92 = 55 days;
• Fourth Qr.: 420/ (220+230+240)/92 = 56 days.We can observe that the Collections have
improved a little. If the DSO is within the prescribed norms, then the Collections are deemed to be under control.
07/04/23 59
Accounts Receivables: Credit Policy-Control of Receivables
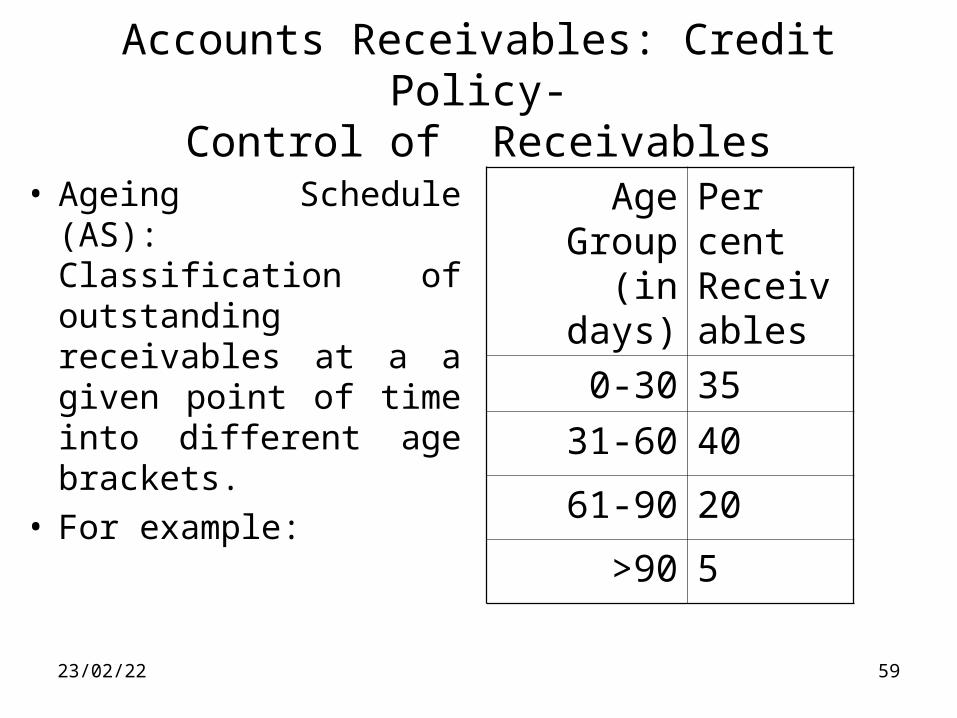
• Ageing Schedule (AS): Classification of outstanding receivables at a a given point of time into different age brackets.
• For example:
Age Group (in days)
Per cent Receivables
0-30 35
31-60 40
61-90 20
>90 5
07/04/23 60
Accounts Receivables: Credit Policy-Control of Receivables
AS depicts the age-wise distribution of accounts receivable at a given period of time;
- helps identify changes in payment behaviour of customers;
- can be compared top credit period extended;
- AS beyond limits indicates higher probability of bad debts and is influenced by the sales pattern.
The actual AS is compared with some standard AS to determine whether the accounts receivables are in control.
07/04/23 61
Accounts Receivables: Credit Policy-Control of Receivables
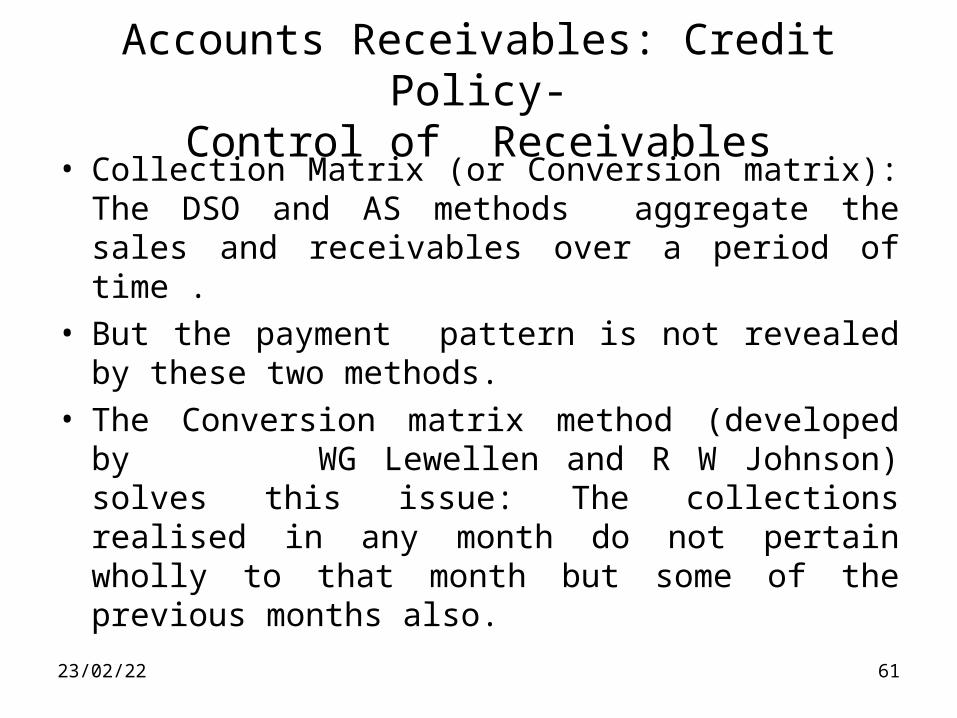
• Collection Matrix (or Conversion matrix): The DSO and AS methods aggregate the sales and receivables over a period of time .
• But the payment pattern is not revealed by these two methods.
• The Conversion matrix method (developed by WG Lewellen and R W Johnson) solves this issue: The collections realised in any month do not pertain wholly to that month but some of the previous months also.
07/04/23 62
Accounts Receivables: Credit Policy-Control of Receivables
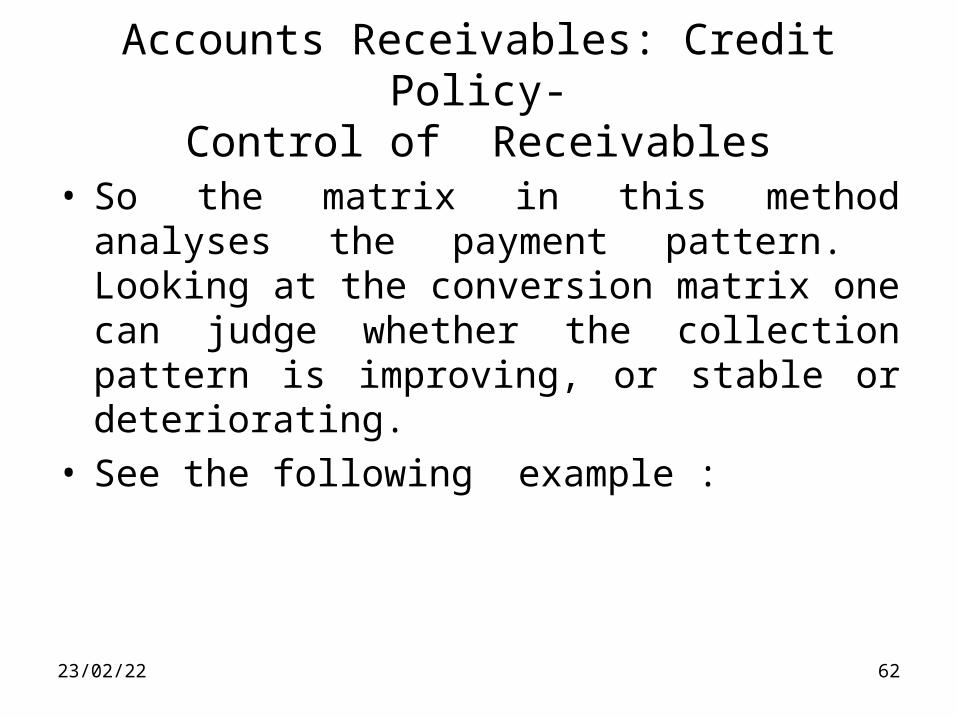
• So the matrix in this method analyses the payment pattern. Looking at the conversion matrix one can judge whether the collection pattern is improving, or stable or deteriorating.
• See the following example :
07/04/23 63
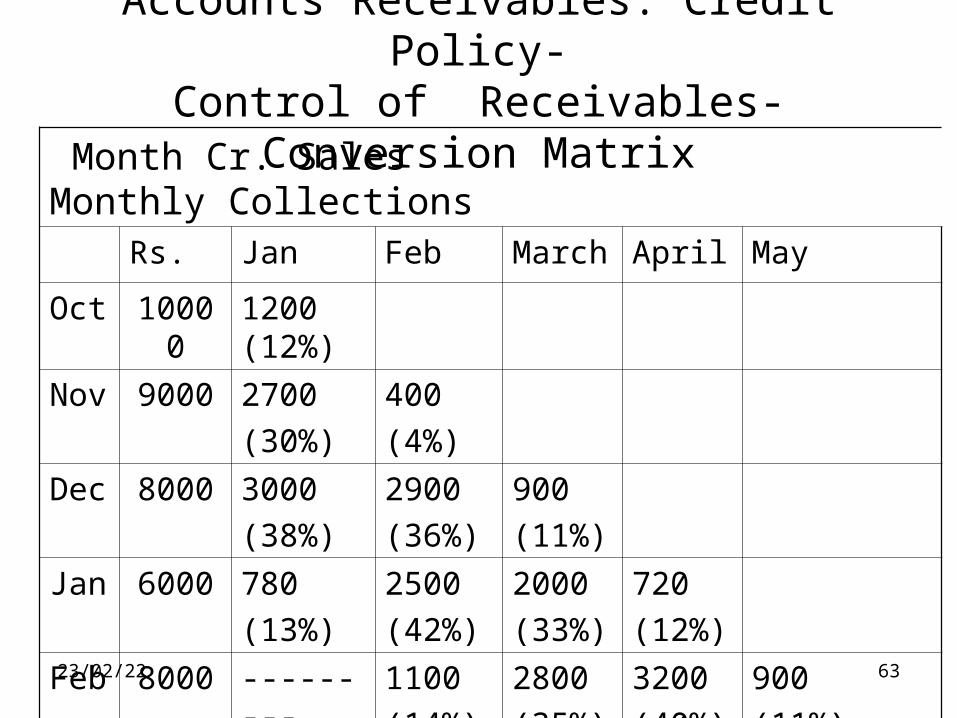
Accounts Receivables: Credit Policy-Control of Receivables-Conversion Matrix
Month Cr. Sales Monthly CollectionsRs. Jan Feb March April May
Oct 10000 1200 (12%)
Nov 9000 2700
(30%)
400
(4%)
Dec 8000 3000
(38%)
2900
(36%)
900
(11%)
Jan 6000 780
(13%)
2500
(42%)
2000
(33%)
720
(12%)
Feb 8000 --------- 1100
(14%)
2800
(35%)
3200
(40%)
900
(11%)
07/04/23 64
Accounts Receivables: Credit Policy-Control of Receivables-Conversion Matrix
• The conversion matrix method is not dependent on sales level.
• It focuses on the key issue, the payments behaviour. • It enables one to analyse month-by-month payment
pattern as against the combined sales and payment patterns.
• A limitation of this method is that it cannot be prepared on the basis of published financial statements alone. Internal financial data are required. But still this method is less demanding on internal data than the AS method.
07/04/23 65
Accounts Receivables: Credit Policy-Control of Receivables – Float Analysis
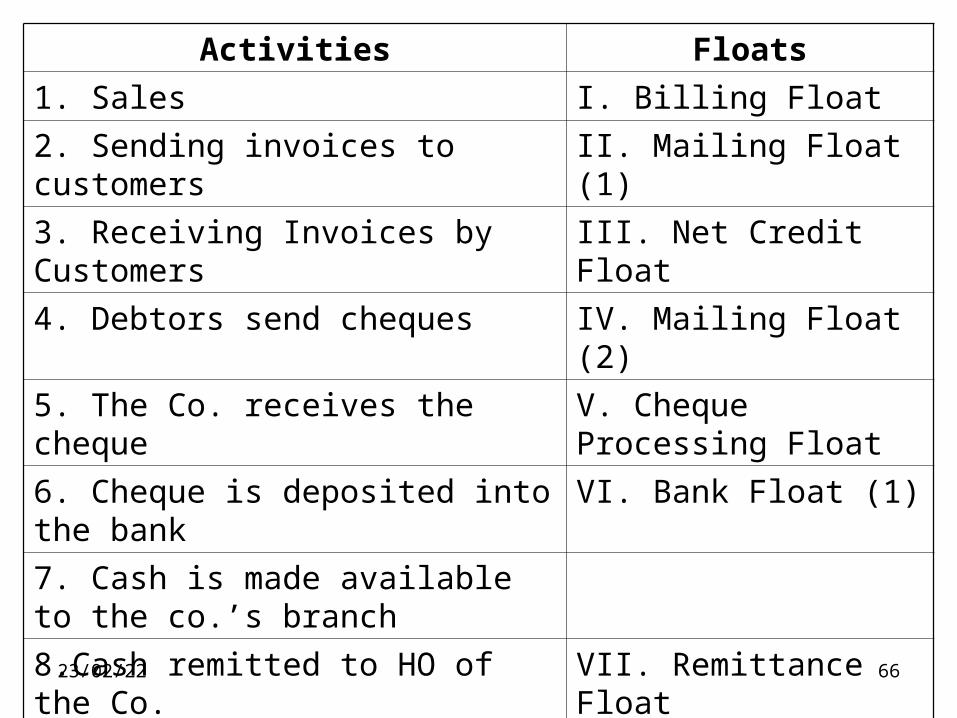
• Float analysis implies analysis of the period that affects cash as it moves through the different phases in the collection process.
• Study the following table to understand the ‘float’ involved in the activities:
07/04/23 66
Activities Floats
1. Sales I. Billing Float
2. Sending invoices to customers II. Mailing Float (1)
3. Receiving Invoices by Customers III. Net Credit Float
4. Debtors send cheques IV. Mailing Float (2)
5. The Co. receives the cheque V. Cheque Processing Float
6. Cheque is deposited into the bank VI. Bank Float (1)
7. Cash is made available to the co.’s branch
8.Cash remitted to HO of the Co. VII. Remittance Float
9. Remittance received by HO of the co. and credited to its bank account.
VIII. Bank Float (2)
07/04/23 67
Accounts Receivables: Credit Policy-Control of Receivables – Float Analysis
• So even if the customer promptly remits the amount by cheque, due to the delay built into the system of the cheque collection process by the banks, Sellers are not able to utilise the funds immediately.
• However, due to the modern techniques and computerisation of banking operations, nowadays the length of the cheque collection process has been greatly reduced. (Core Banking Solutions – Anywhere banking, Direct Deposits of Cheques by customers into the Sellers’ Banks’ branches – at any centre)
07/04/23 68
Accounts Receivables: Credit Policy-Control of Receivables
• Improvements required in the management of receivables:
• Credit policies need to be articulated in explicit terms and revised periodically in the light of internal and external changes.
• A proper system has to be developed for continuous credit appraisal and evaluation of creditworthiness of customers.
07/04/23 69
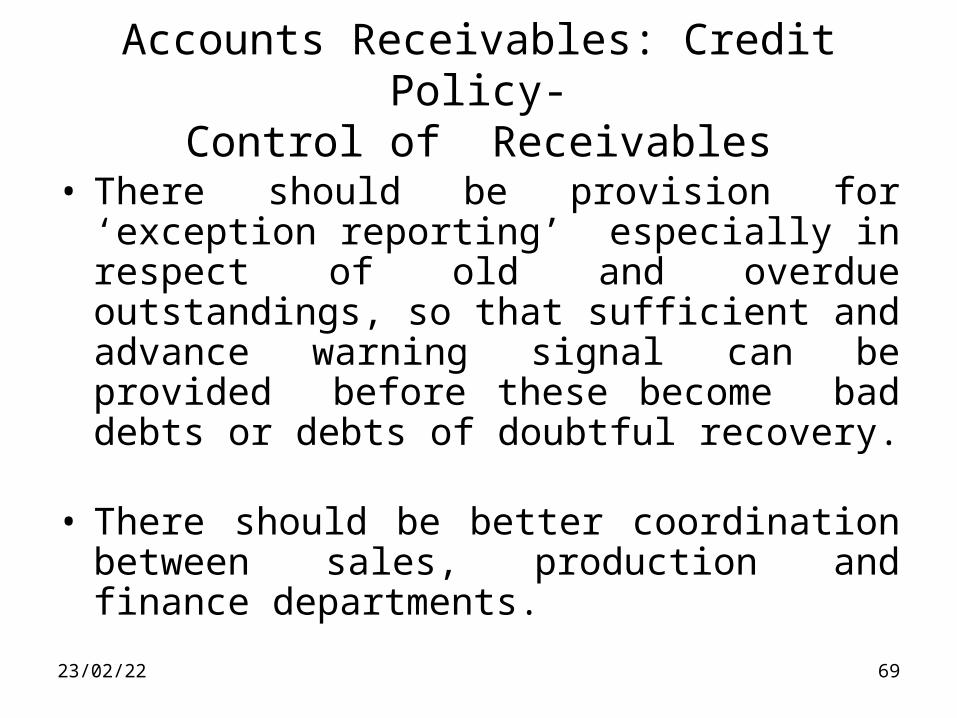
Accounts Receivables: Credit Policy-Control of Receivables
• There should be provision for ‘exception reporting’ especially in respect of old and overdue outstandings, so that sufficient and advance warning signal can be provided before these become bad debts or debts of doubtful recovery.
• There should be better coordination between sales, production and finance departments.
07/04/23 70
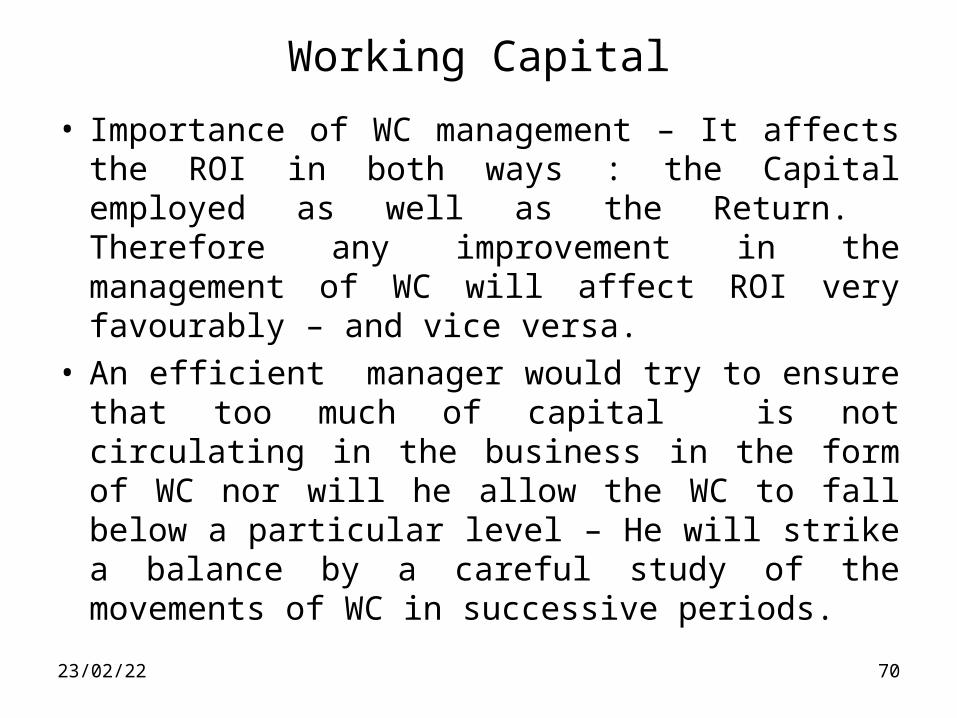
Working Capital
• Importance of WC management – It affects the ROI in both ways : the Capital employed as well as the Return. Therefore any improvement in the management of WC will affect ROI very favourably – and vice versa.
• An efficient manager would try to ensure that too much of capital is not circulating in the business in the form of WC nor will he allow the WC to fall below a particular level – He will strike a balance by a careful study of the movements of WC in successive periods.
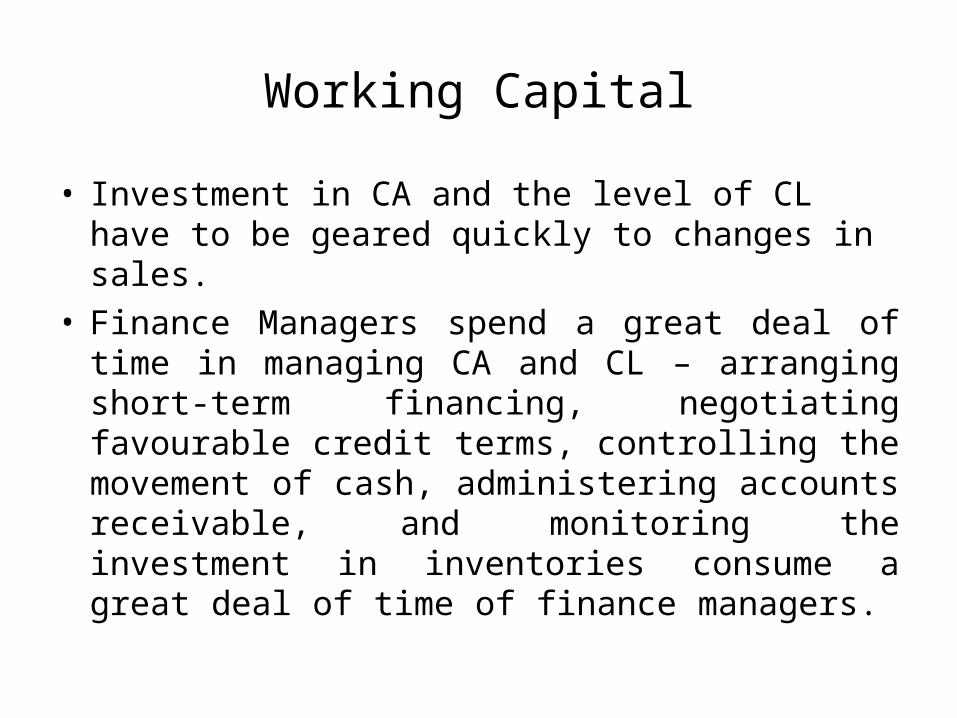
Working Capital
• Investment in CA and the level of CL have to be geared quickly to changes in sales.
• Finance Managers spend a great deal of time in managing CA and CL – arranging short-term financing, negotiating favourable credit terms, controlling the movement of cash, administering accounts receivable, and monitoring the investment in inventories consume a great deal of time of finance managers.

Working Capital
• There is a close interaction among WC components.
• A large accumulation of FG may have to be disposed of through liberal credit terms or through a lax credit collection process.
• A firm’s liquidity crunch may be solved through generous discounts on its sales.
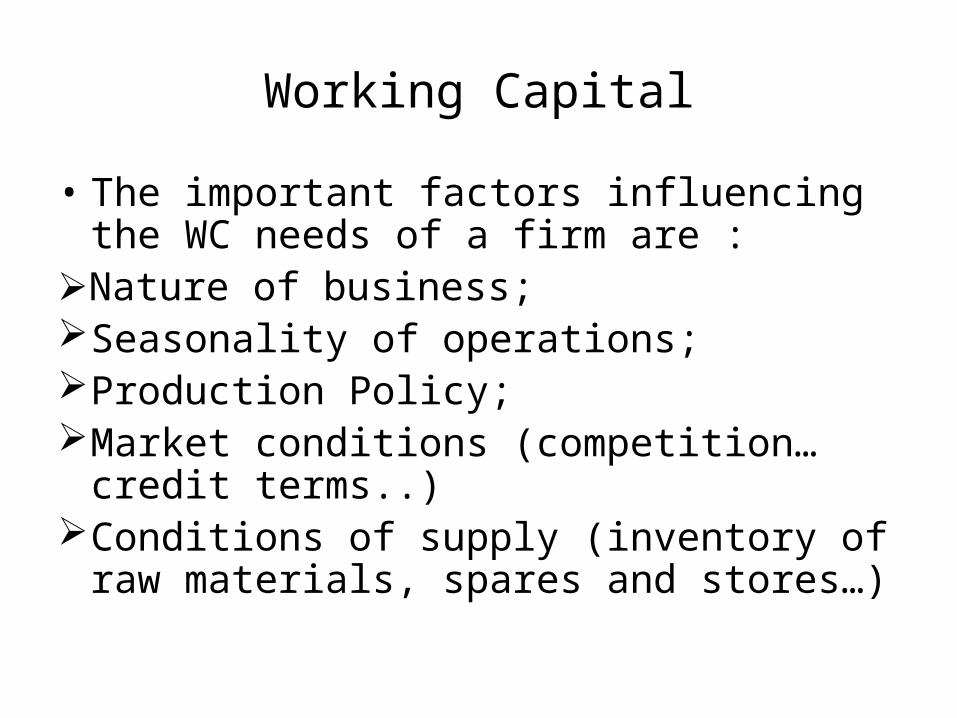
Working Capital
• The important factors influencing the WC needs of a firm are :
Nature of business;Seasonality of operations;Production Policy;Market conditions (competition…credit
terms..)Conditions of supply (inventory of raw
materials, spares and stores…)
07/04/23 74
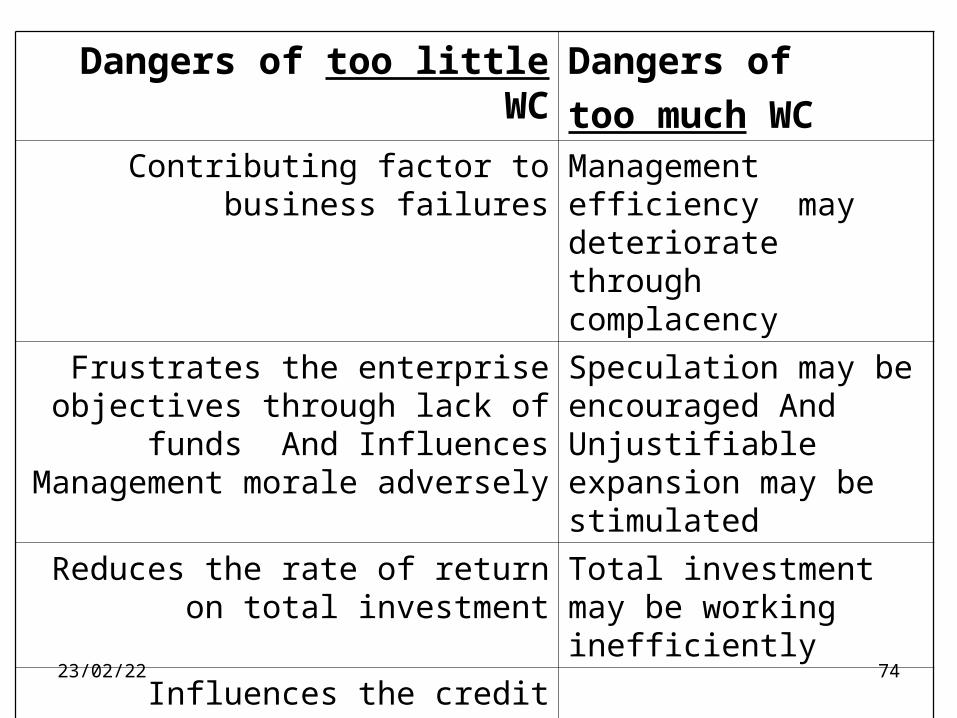
Dangers of too little WC Dangers of
too much WCContributing factor to business
failuresManagement efficiency may deteriorate through complacency
Frustrates the enterprise objectives through lack of funds And
Influences Management morale adversely
Speculation may be encouraged And Unjustifiable expansion may be stimulated
Reduces the rate of return on total investment
Total investment may be working inefficiently
Influences the credit rating adversely
Prevents discounts being taken
Prevents attractive opportunities from materialisng
07/04/23 75
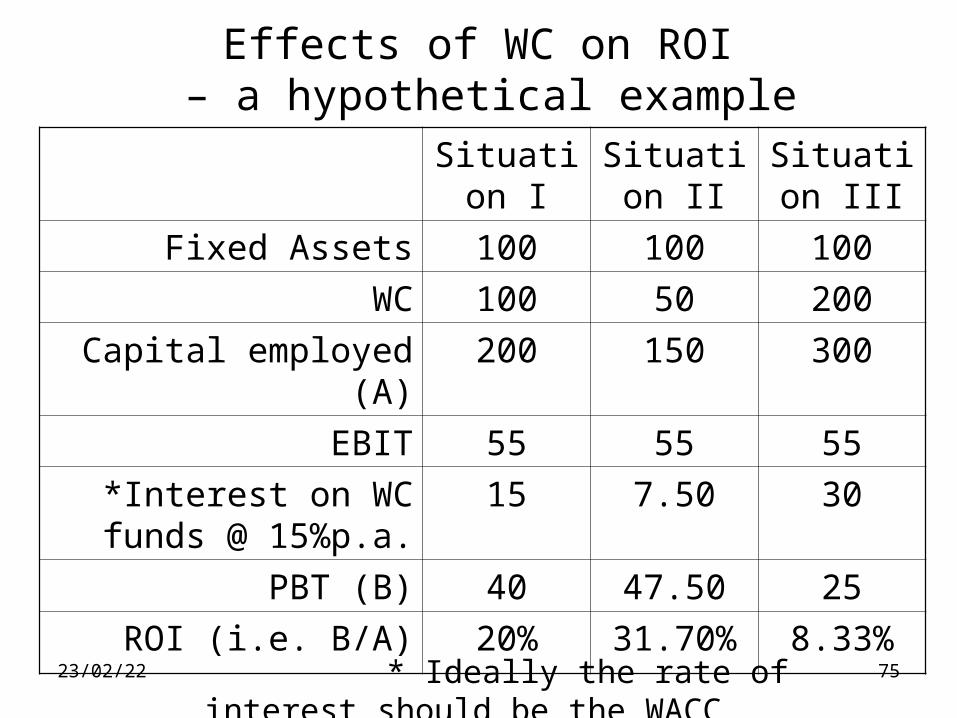
Situation I
Situation II
Situation III
Fixed Assets 100 100 100
WC 100 50 200
Capital employed (A) 200 150 300
EBIT 55 55 55
*Interest on WC funds @ 15%p.a.
15 7.50 30
PBT (B) 40 47.50 25
ROI (i.e. B/A) 20% 31.70% 8.33%
Effects of WC on ROI – a hypothetical example
* Ideally the rate of interest should be the WACC
07/04/23 76
Working Capital
• The three financial ratios which are important in keeping a constant watch on the WC management : Inventory Turnover Ratio, Debtors Turnover and Creditors Turnover.
• The finance aspect of WC management essentially means controlling the cost of finance involved. Cost of finance varies according to the different sources of finance.
• Click the icon below to see the working of ratios:
Microsoft Word Document

07/04/23
Marketing Research
• Definition by AMA: MR is the systematic gathering, recording and analysing of data about problem relating to marketing of goods and services.
• Kotler: Systematic problem analysis, model building and fact finding for the purpose of improved decision making and control in the marketing of goods and services.
07/04/23 78
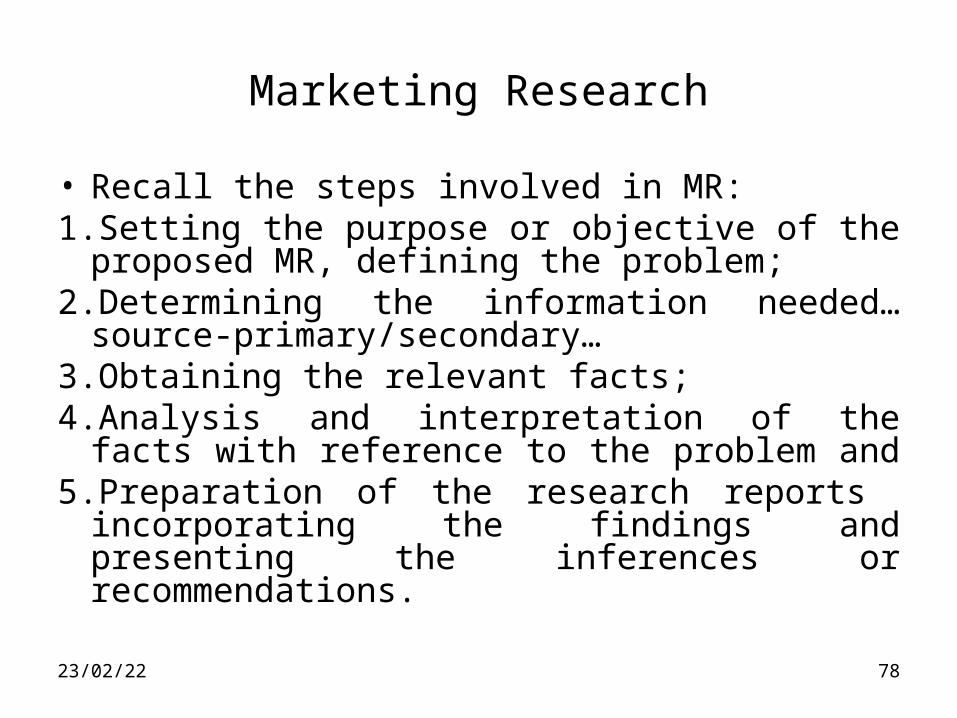
Marketing Research
• Recall the steps involved in MR: 1.Setting the purpose or objective of the proposed
MR, defining the problem;2.Determining the information needed…source-
primary/secondary…3.Obtaining the relevant facts; 4.Analysis and interpretation of the facts with
reference to the problem and 5.Preparation of the research reports
incorporating the findings and presenting the inferences or recommendations.
07/04/23 79
Marketing Research
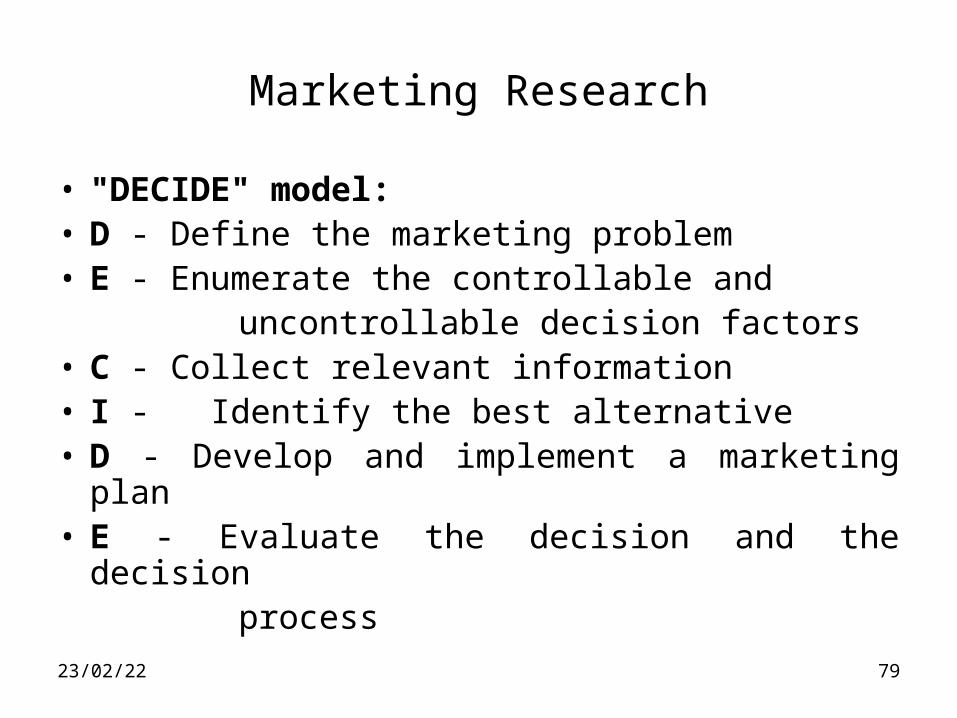
• "DECIDE" model:• D - Define the marketing problem• E - Enumerate the controllable and uncontrollable decision factors• C - Collect relevant information• I - Identify the best alternative• D - Develop and implement a marketing plan• E - Evaluate the decision and the decision process
07/04/23 80
Marketing Research
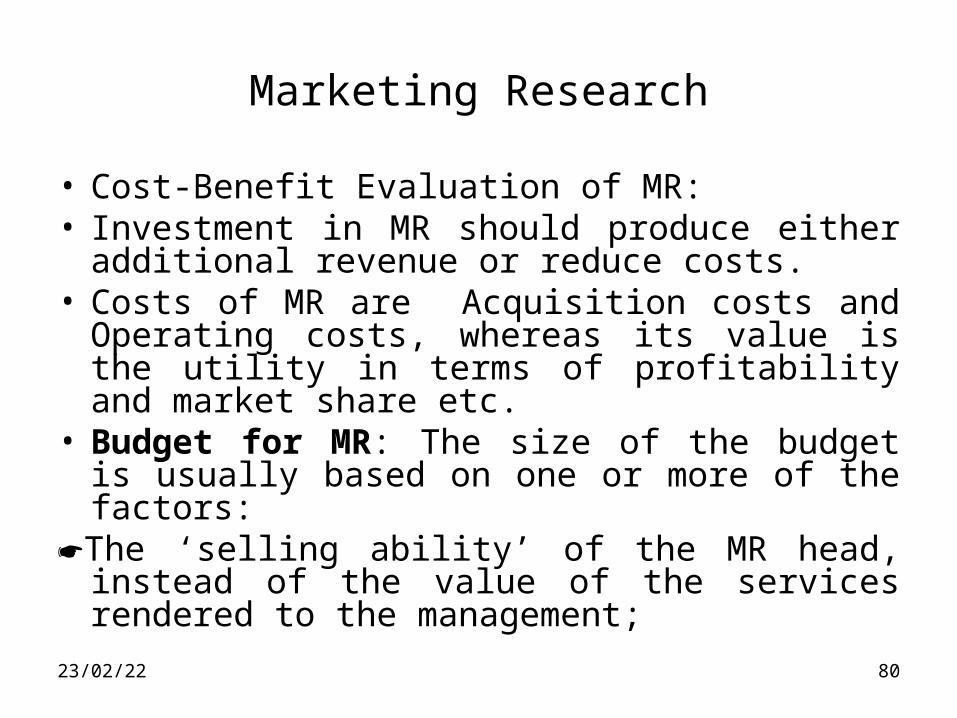
• Cost-Benefit Evaluation of MR:• Investment in MR should produce either
additional revenue or reduce costs.• Costs of MR are Acquisition costs and
Operating costs, whereas its value is the utility in terms of profitability and market share etc.
• Budget for MR: The size of the budget is usually based on one or more of the factors:
The ‘selling ability’ of the MR head, instead of the value of the services rendered to the management;
07/04/23 81
Marketing Research
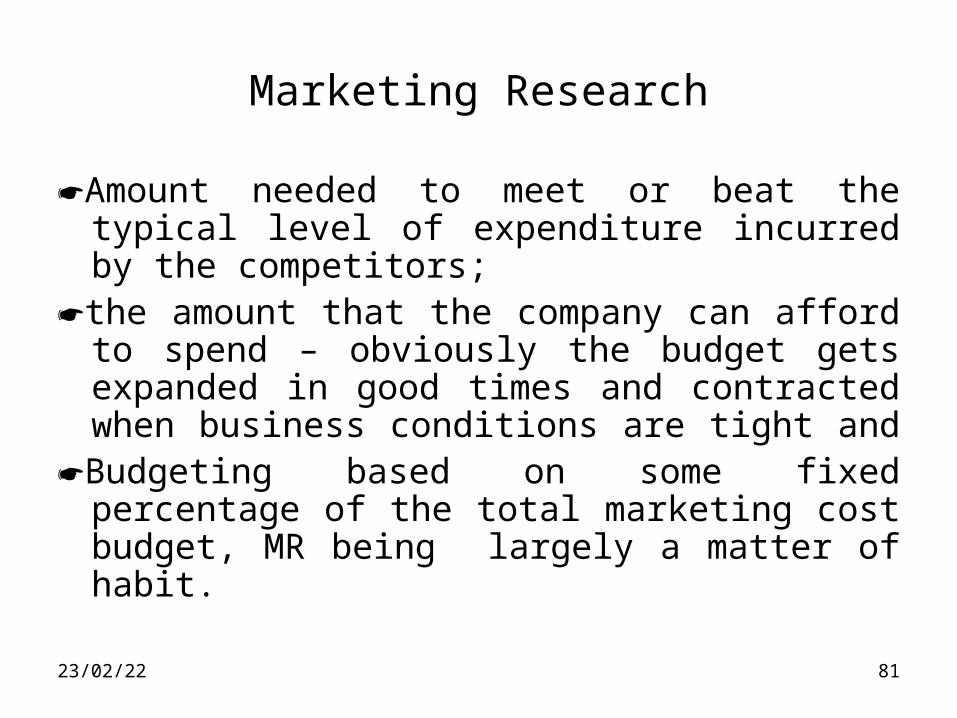
Amount needed to meet or beat the typical level of expenditure incurred by the competitors;
the amount that the company can afford to spend – obviously the budget gets expanded in good times and contracted when business conditions are tight and
Budgeting based on some fixed percentage of the total marketing cost budget, MR being largely a matter of habit.

07/04/23 82
Marketing Research
• None of these bases are adequate to meet today’s needs.
• The current thinking and ideology is that MR should be regarded as an investment and not an expense.
• For measuring the effectiveness of MR, Twedt used the formula:
• (‘Worth’ or Value of Finding * Proportion of crucial cases)/Annual MR Budget = ROI
07/04/23 83
Marketing Research
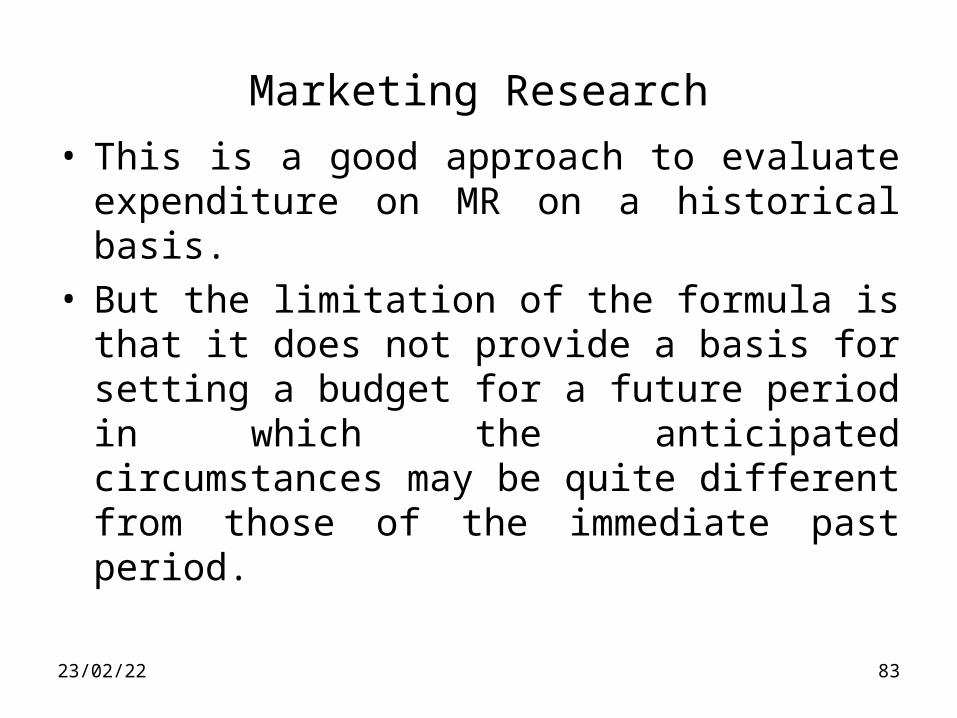
• This is a good approach to evaluate expenditure on MR on a historical basis.
• But the limitation of the formula is that it does not provide a basis for setting a budget for a future period in which the anticipated circumstances may be quite different from those of the immediate past period.
07/04/23 84
Marketing Research
• From the financial angle, the most obvious question that arises is “What should Marketing Planning Cost?”
• W Dickerson Hogue has given a simple formula which is based on the assumption that any planning effort would require certain amounts and certain types of additional information and consequently, there should be a cost benefit equation to examine this .
07/04/23 85
Marketing Research
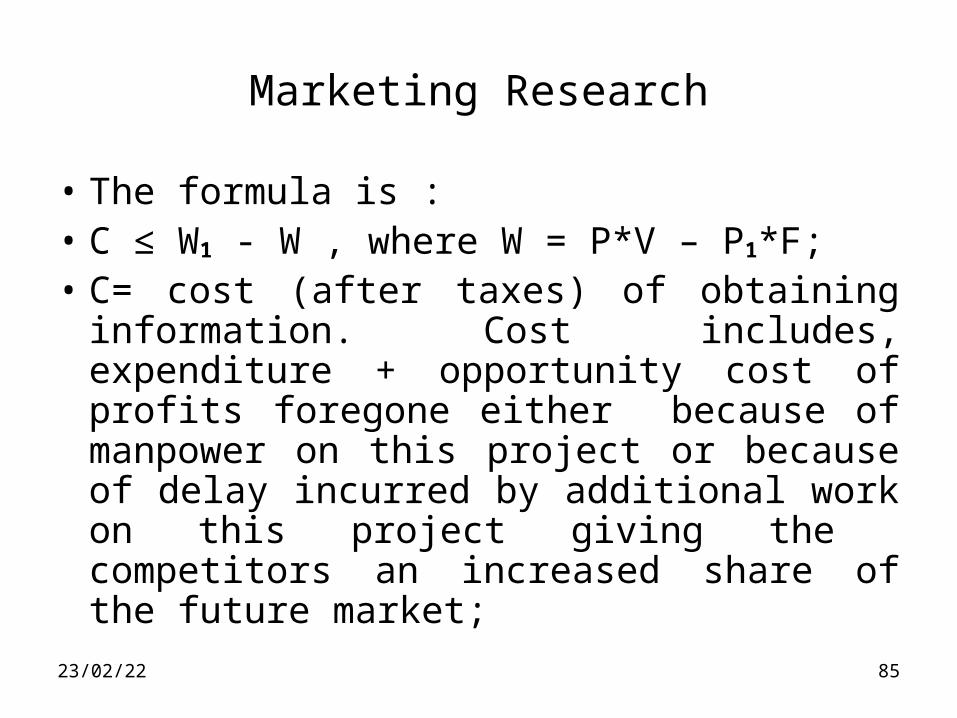
• The formula is :• C ≤ W1 - W , where W = P*V – P1*F;• C= cost (after taxes) of obtaining
information. Cost includes, expenditure + opportunity cost of profits foregone either because of manpower on this project or because of delay incurred by additional work on this project giving the competitors an increased share of the future market;
Marketing Research
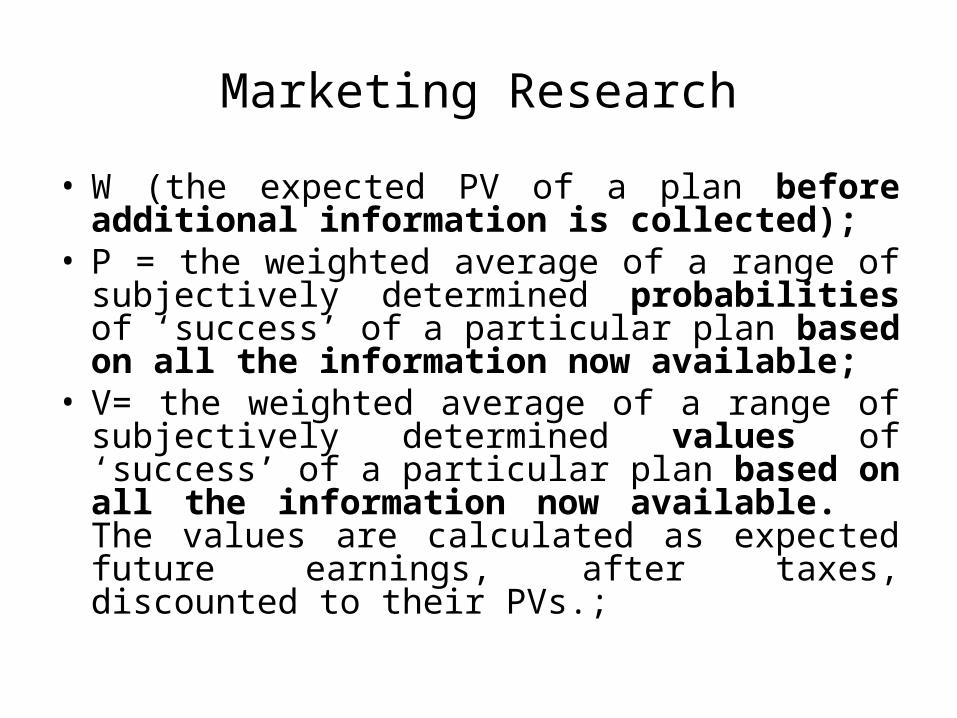
• W (the expected PV of a plan before additional information is collected);
• P = the weighted average of a range of subjectively determined probabilities of ‘success’ of a particular plan based on all the information now available;
• V= the weighted average of a range of subjectively determined values of ‘success’ of a particular plan based on all the information now available. The values are calculated as expected future earnings, after taxes, discounted to their PVs.;
Marketing Research
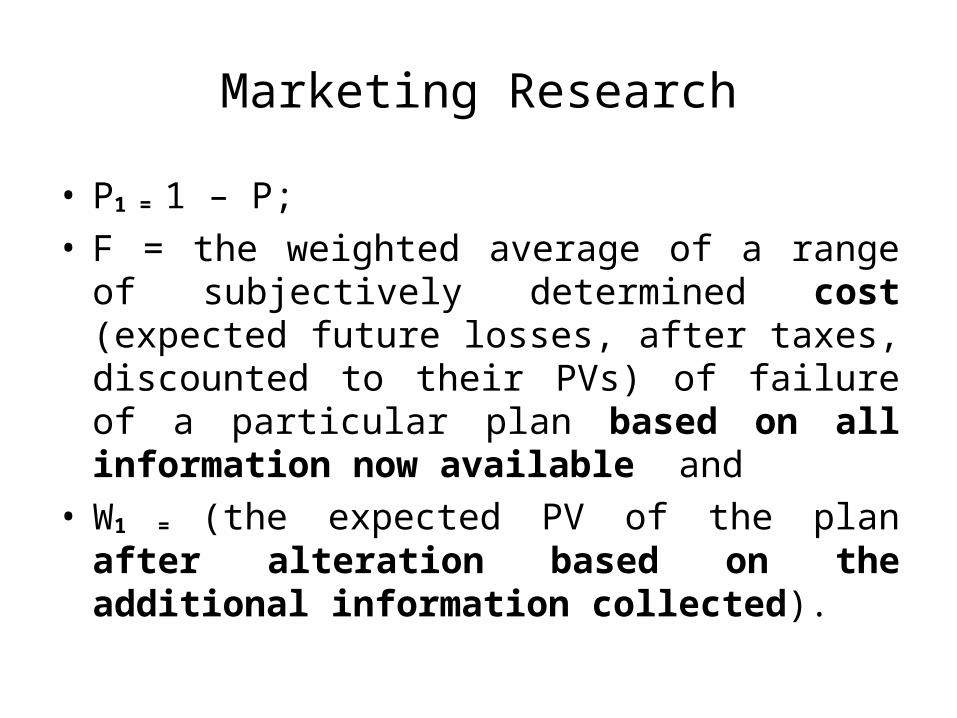
• P1 = 1 – P;
• F = the weighted average of a range of subjectively determined cost (expected future losses, after taxes, discounted to their PVs) of failure of a particular plan based on all information now available and
• W1 = (the expected PV of the plan after alteration based on the additional information collected).

Product Planning and Development Chapter 11 of B K Chatterjee
• Definition: “Anything that can be offered to a market for attention, acquisition, use or consumption that might satisfy a want or need.” – Kotler.
• So a product may be a physical product or ‘services’ (repairs, travel services…)or even ‘ideas’ (saving of energy, family planning, ill effects of tobacco, awareness of AIDS….).
• A company’s marketing efforts and planning depends upon the offering of its products.
Product Planning and Development
• Products must be planned – not just designed. So marketers have to be directly involved in designing the product to meet the diverse and specific requirements of the targeted customers.
• Marketers have to discover the ‘needs’; they should sell ‘benefits’, not features.
• Recall the different levels of a product- the consumer hierarchy by Kotler: Core, Basic, Expected, Augmented and Potential.
Product Planning and Development
Two attributes of a product: • Physical or Measurable and • Psychological or Perceived.Marketers try to exploit the perceived
attributes.In the product-mix of a marketer, the relative
importance of weightage of the different products along criteria like Sales, Gross Margin etc. have to be ascertained.

Product Planning and Development
• Kotler’s approach to Product Life Cycle and implications - the human being and a product:
• The PLC curve:
Childhood – Introduction; Adulthood – Growth; Manhood – Maturity and Extinction – Decline.
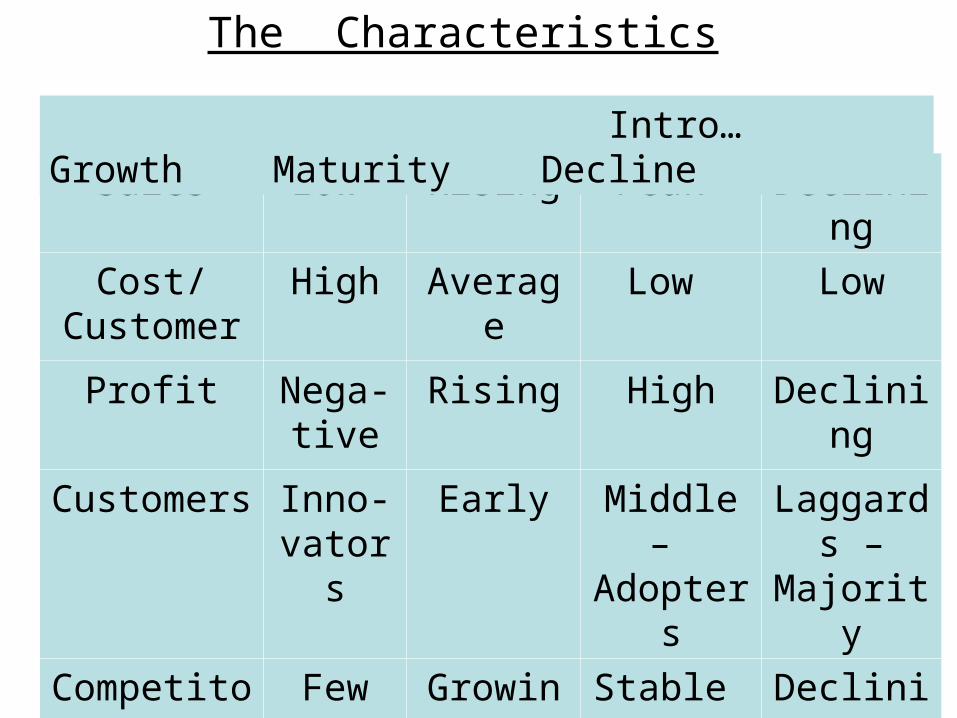
The Characteristics
Stages I II III IV
Sales Low Rising Peak Declining
Cost/Customer
High Average Low Low
Profit Nega-tive
Rising High Declining
Customers Inno-vators
Early Middle – Adopters
Laggards –
Majority
Competitors Few Growing Stable Declining
Intro… Growth Maturity Decline
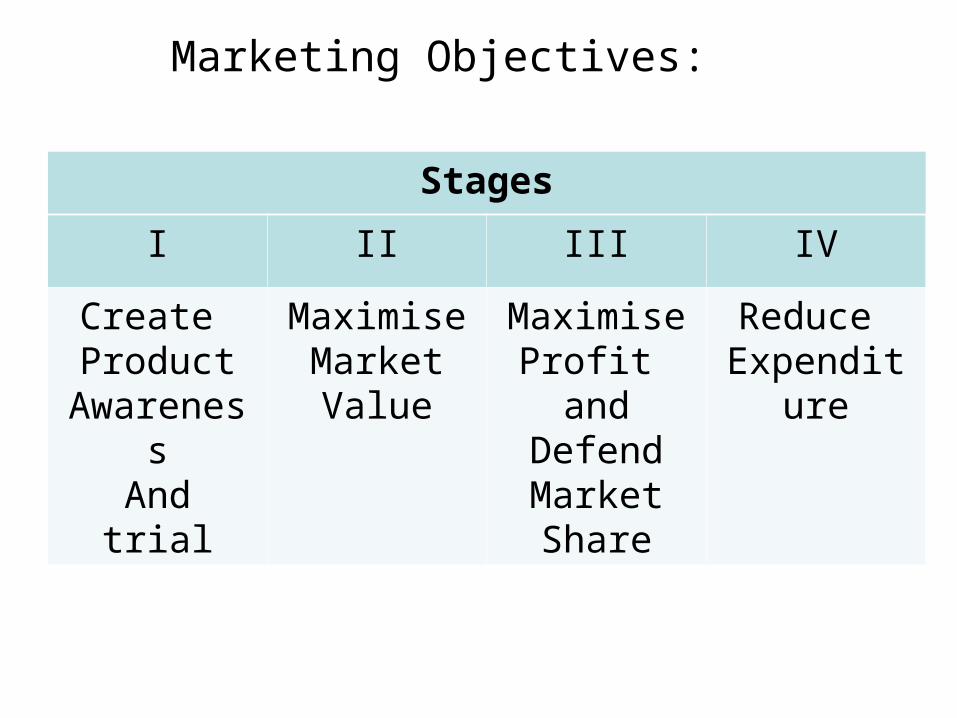
Marketing Objectives:
Stages
I II III IV
Create Product
AwarenessAnd trial
Maximise MarketValue
MaximiseProfit and
DefendMarketShare
Reduce Expenditure
Product Planning and Development
• “The length of the Product cycle is governed by the rate of technological change, the rate of market acceptance and ease of competitive entry. By and large, consumer products have shorter life cycle whereas basic industry or products goods have longer life cycle.” –
Joel Dean.
The ‘Diagnosis and Prognosis’ technique is adopted to find the stage of the life cycle which a product is passing through at a given time.
Product Planning and Development
• In this technique, six different curves are drawn in a logical sequence – as follows:
1. Sales revenue of the particular product for the past five years of the firm;
2.Sales revenue for the same period as in 1 above, for he same product for the industry as a whole;
3. Direct cost of selling, for the product of the firm, for the period;
Product Planning and Development
4.’Profit’ which is the difference between sales revenue (1 above) and cost of selling (3 above). (This ‘Profit’ is not the same as the conventional profit.)
5.The ROI relating the Profit (4) to the cost of inputs or investments as per 3.
The ROI curve and comparison between the two curves as per 1 and 2 above will indicate adulthood or manhood or declining state of the product and will also suggest necessary corrective actions.
Product Planning and Development
6.Action curve, indicating actions required to sustain adulthood or manhood and prevent decline. This could be in the form of more resource inputs, higher revenue through better pricing policy, etc.
This technique should be adopted at regular intervals, say every 6 months for consumer products and every two or three years for industrial products.
Product Planning and Development
• Discovery of new uses, entry into totally new markets, emergence of new customers, addition of new features….These are the things that make the PLC of a product very unpredictable.
• The three broad aspects of product planning:
Exploring new uses of existing products – Introduction of new products - and pruning or phasing out of weak products.
Generally, exploring new uses of existing products is a neglected area in marketing.
Product Planning and Development
• Booz Allen and Hamilton have identified the following types of new products :
(i) New to the world products-an entirely new product;
(ii) New product lines – entering an established market for the first time;
(iii) Addition to existing product lines – supplement company’s existing product lines;
Product Planning and Development
(iv) Improvement/revision to existing products – improved performance and greater perceived value;
(v) Re-positioning – existing products targeted to new markets, new customers;
(vi) Cost reductions – news products providing similar performance at reduced cost
Product Planning and Development
• The products new to the world – as in (i) -involve the greatest risk and the last one as in (vi) involves the least risk.
• It is essential to identify new opportunities and take advantage of the situation by developing new products – since the existing product range will sooner or later be in a declining stage in the life cycle
Product Planning and Development
• Criteria in New Product Decisions:
Search for synergy - marketing, suppliers, customers, technological, equipment, manpower… search for portfolio effect; search for stability; search for security; PLC considerations; vertical specialisation and segment movements.
Product Planning and Development
• Stages in New Product development:first information about new product ideas;
credibility count; matching of objectives; MR (field surveys…demand and market acceptability); technology forecasting; technology sourcing for R and D; first financial feasibility studies; filter – to identify technically, commercially and financially feasible product ideas; pilot stage; final financial feasibility studies; test marketing and commercialisation.
Product Planning and Development
• Financial Evaluation of a Brand:
Till recently, a brand was assessed in qualitative terms only – like brand recall, awareness, positioning etc.
The financial view of a brand in terms of ‘brand equity’ is a recent phenomenon.
Earlier, M&As were done for the purpose of getting hold of an established brand.
Product Planning and Development
• Nowadays it is very common to see M&As being done at a multiple of many more times the value of the acquiree’s assets or a few times the market value of its shares.
• Creating a brand from scratch is costly, time-consuming and risky and so it is easier to invest in an existing and established brand.

Product Planning and Development
• Through acquiring a brand, the acquirer avoids future competition.
• The acquisition price
= value of the tangible assets
+ price of the brand
+cost of preventing the brand from
going into the competitor’s hands.
Product Planning and Development
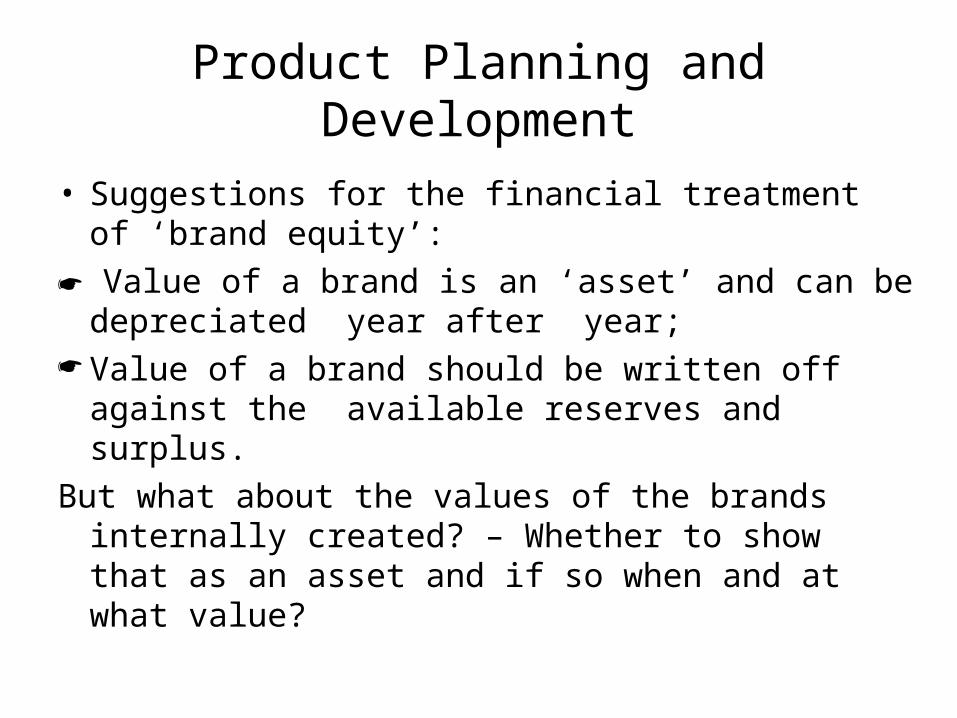
• Suggestions for the financial treatment of ‘brand equity’:
Value of a brand is an ‘asset’ and can be depreciated year after year;
Value of a brand should be written off against the available reserves and surplus.
But what about the values of the brands internally created? – Whether to show that as an asset and if so when and at what value?
Product Planning and Development
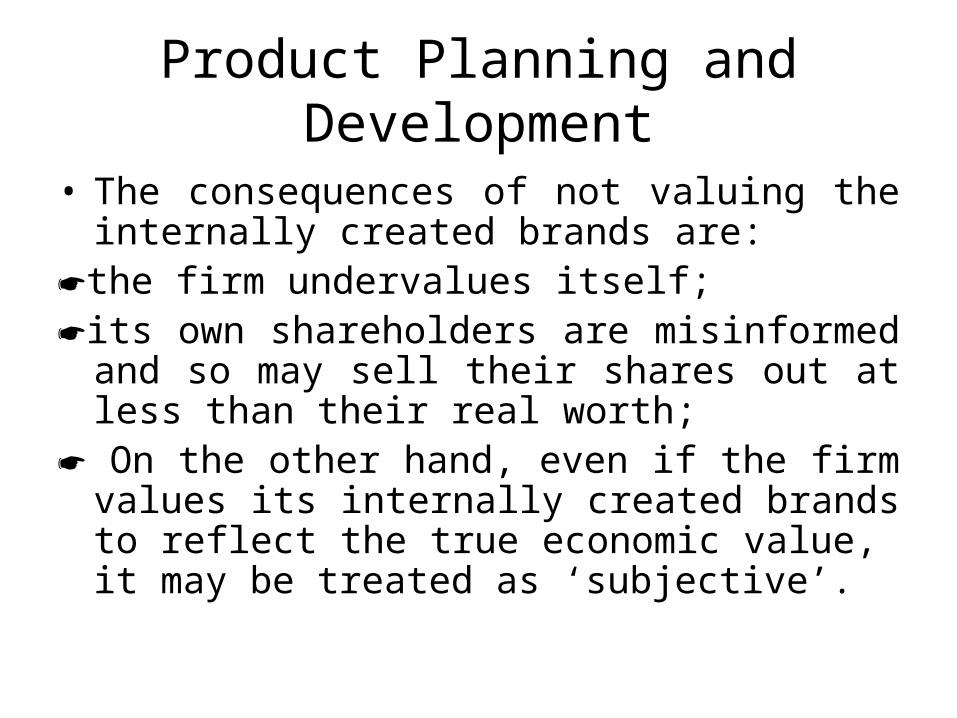
• The consequences of not valuing the internally created brands are:
the firm undervalues itself; its own shareholders are misinformed and so
may sell their shares out at less than their real worth;
On the other hand, even if the firm values its internally created brands to reflect the true economic value, it may be treated as ‘subjective’.
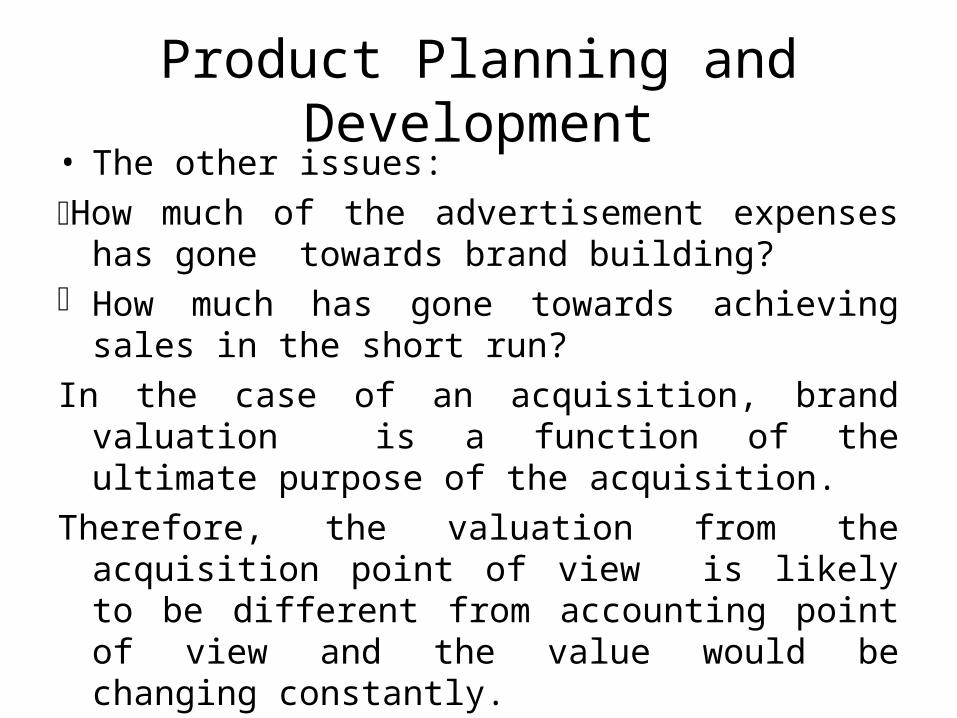
Product Planning and Development• The other issues:
How much of the advertisement expenses has gone towards brand building?
How much has gone towards achieving sales in the short run?
In the case of an acquisition, brand valuation is a function of the ultimate purpose of the acquisition.
Therefore, the valuation from the acquisition point of view is likely to be different from accounting point of view and the value would be changing constantly.
Product Planning and Development
• Thus there are constant conflicts between the finance and marketing professionals in respect of brand valuations.
• They should have mutual respect and try to understand the common objectives of the firm under constraints.
Product Planning and Development
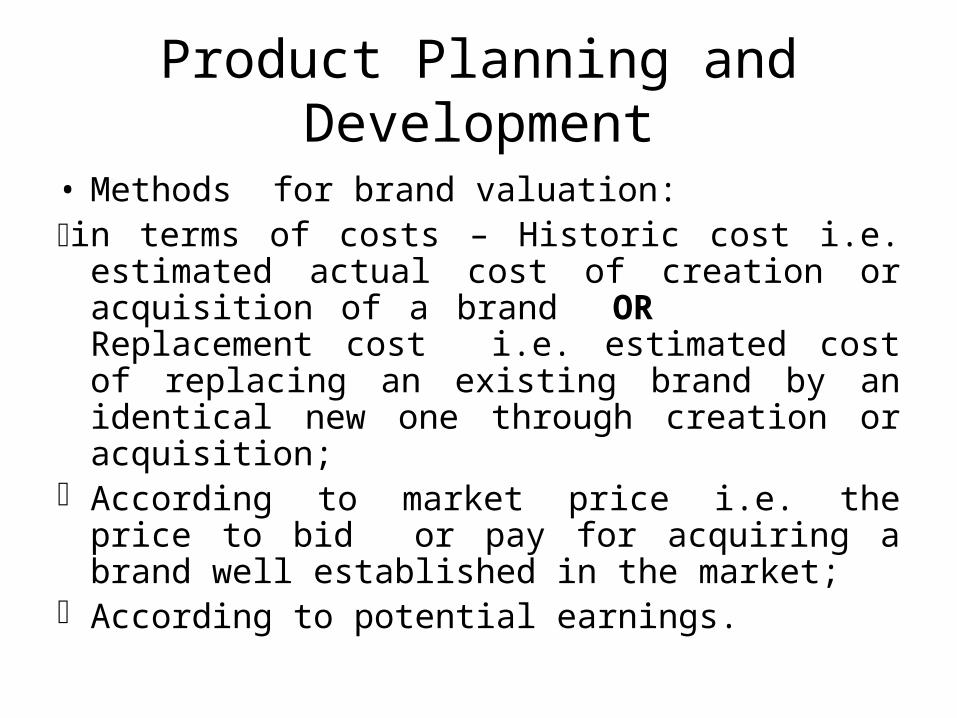
• Methods for brand valuation:in terms of costs – Historic cost i.e. estimated
actual cost of creation or acquisition of a brand OR Replacement cost i.e. estimated cost of replacing an existing brand by an identical new one through creation or acquisition;
According to market price i.e. the price to bid or pay for acquiring a brand well established in the market;
According to potential earnings.
Product Planning and Development
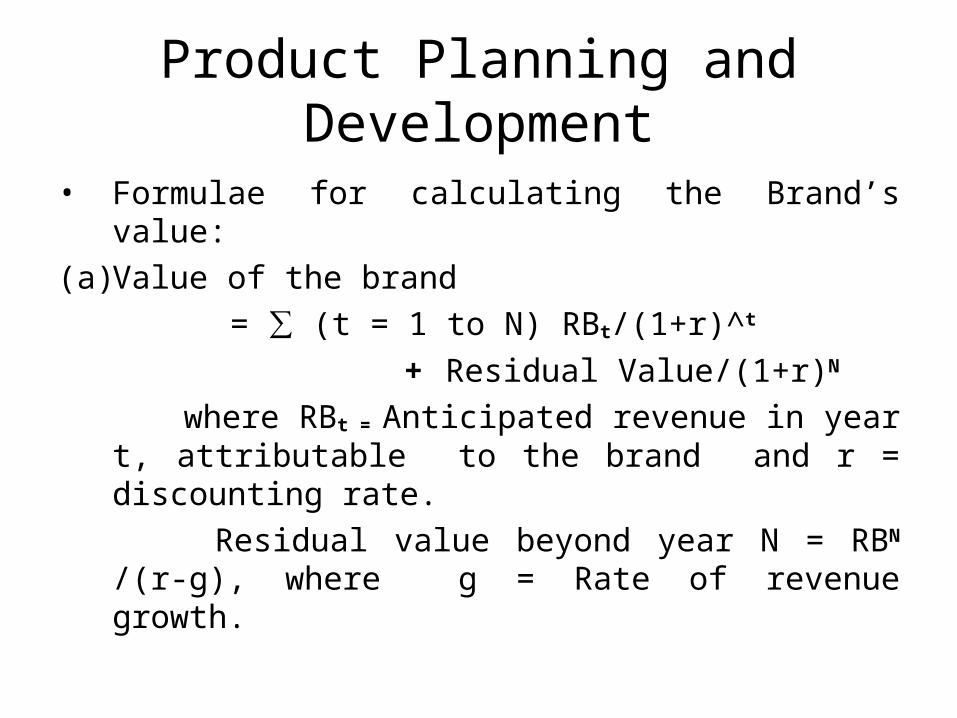
• Formulae for calculating the Brand’s value:
(a) Value of the brand
= ∑ (t = 1 to N) RBt/(1+r)^t
+ Residual Value/(1+r)N
where RBt = Anticipated revenue in year t, attributable to the brand and r = discounting rate.
Residual value beyond year N = RBN /(r-g), where g = Rate of revenue growth.

Product Planning and Development
• (b) The Multiple method:
P/E = Market value of Equity/Known Profits
Brand Multiple = Brand Equity/Brand Net Profits
Product Planning and Development
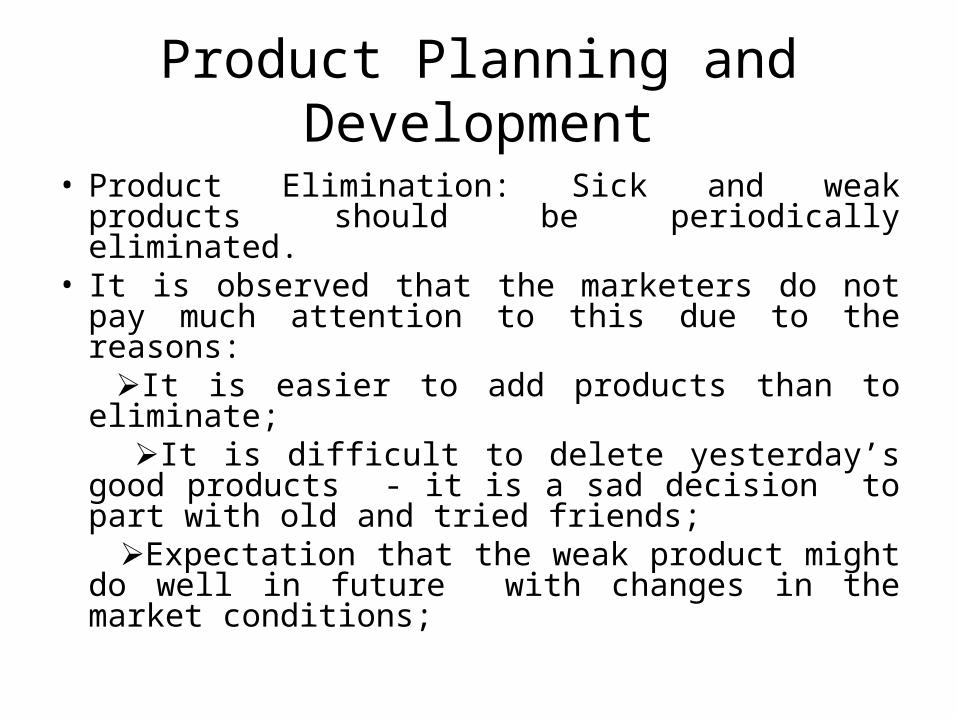
• Product Elimination: Sick and weak products should be periodically eliminated.
• It is observed that the marketers do not pay much attention to this due to the reasons:
It is easier to add products than to eliminate; It is difficult to delete yesterday’s good
products - it is a sad decision to part with old and tried friends;
Expectation that the weak product might do well in future with changes in the market conditions;
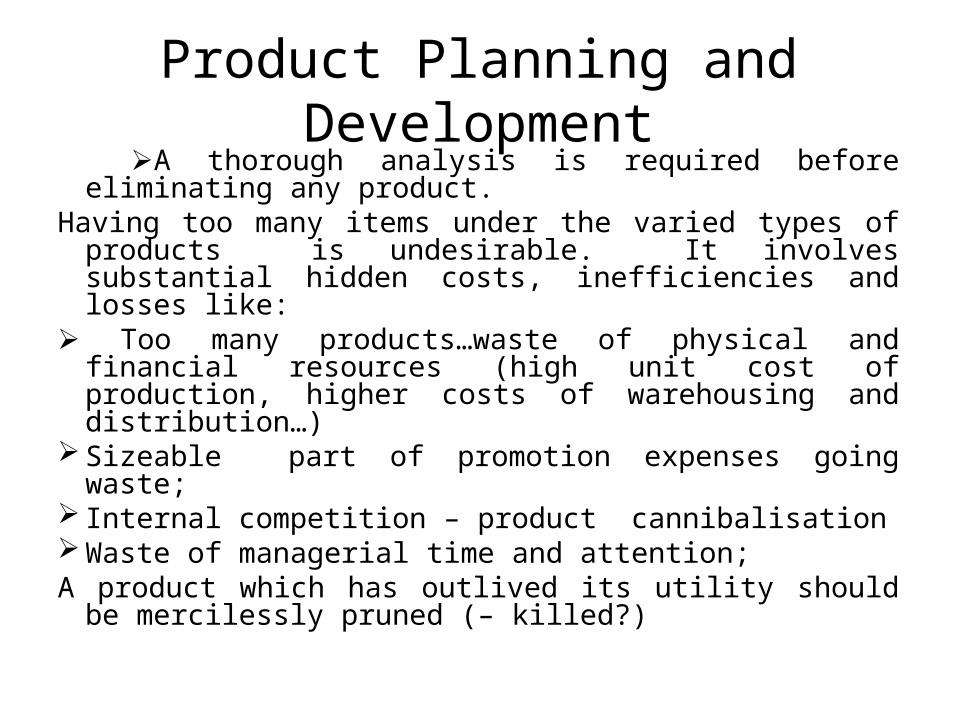
Product Planning and Development A thorough analysis is required before eliminating
any product. Having too many items under the varied types of
products is undesirable. It involves substantial hidden costs, inefficiencies and losses like:
Too many products…waste of physical and financial resources (high unit cost of production, higher costs of warehousing and distribution…)
Sizeable part of promotion expenses going waste; Internal competition – product cannibalisation Waste of managerial time and attention; A product which has outlived its utility should be
mercilessly pruned (– killed?)
Product Planning and Development
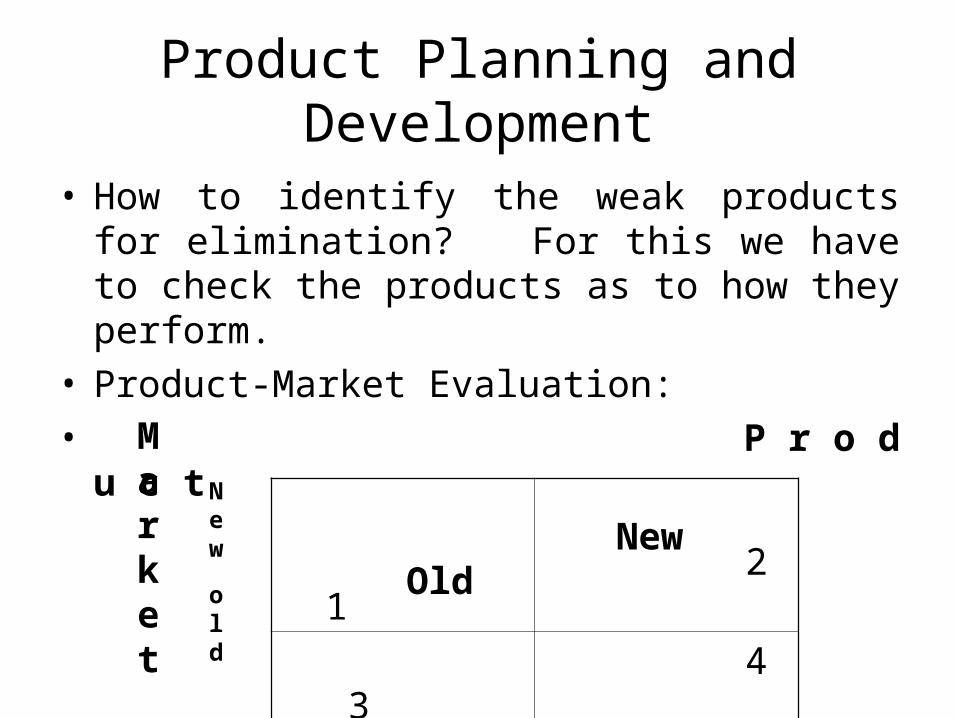
• How to identify the weak products for elimination? For this we have to check the products as to how they perform.
• Product-Market Evaluation:• P r o d u c t
New OldMarket
old
New
1 2
3 4
Product Planning and Development
• Products should be put in the respective quadrants: some formula is: up to 3 years old for consumer products and five years for industrial products.
• New use or application of an old product may be considered as a new product.
• Determine the percentages of total sales and total gross margin earned by each group.
• On analysis of the figures for the quadrants, some inferences may be drawn like :
Product Planning and Development• If the quadrant 1 shows at least a 25% of total
sales or GP Margin, then it may be considered to be satisfactory.
• If the quadrant 4 shows sizeable figure of say 75% or more, in terms of sales or GP Margin, then the company may be heading towards sickness. It shows poor marketing effectiveness. So the figures of the quadrant 4 should be minimum.
• Products in quadrants 2 and 3 show generally satisfactory marketing effectiveness.
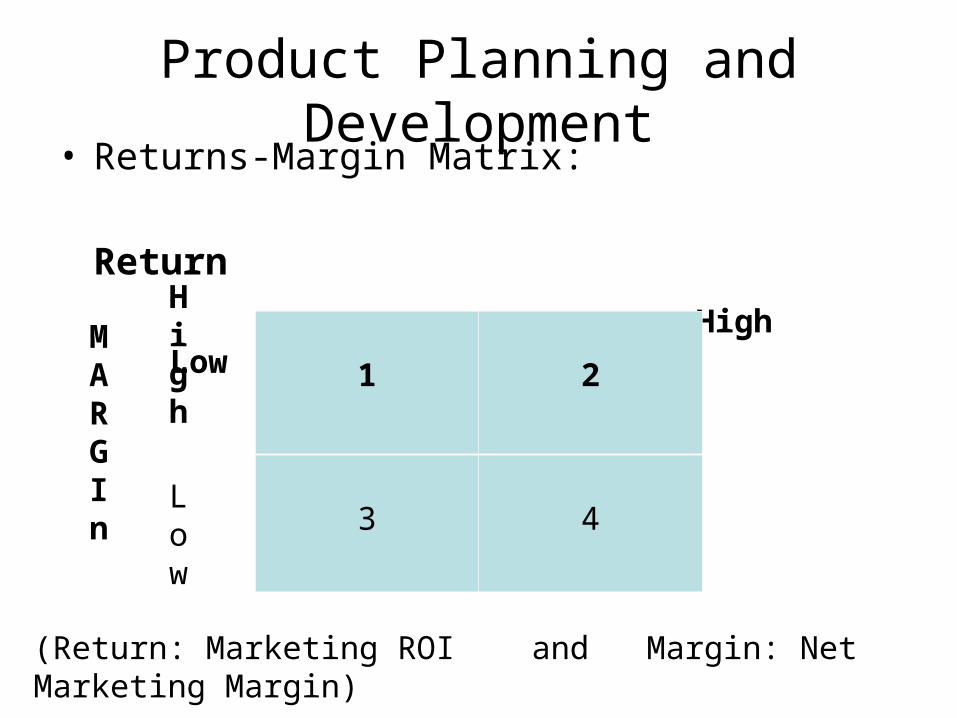
Product Planning and Development• Returns-Margin Matrix:
Return
High Low
1 2
3 4
MARGIn
High
Low
(Return: Marketing ROI and Margin: Net Marketing Margin)
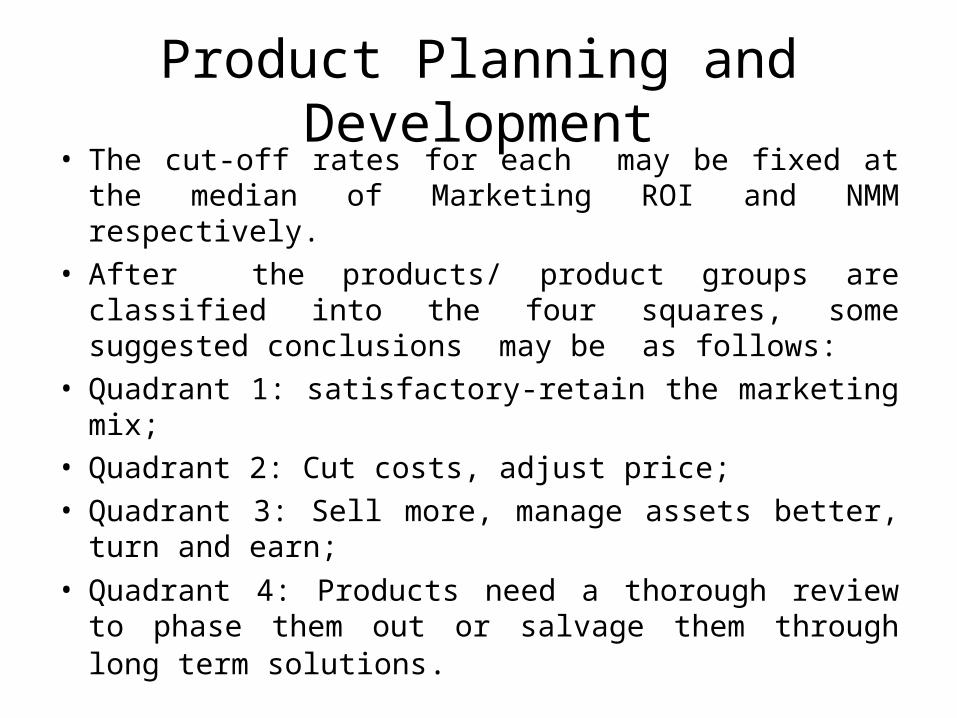
Product Planning and Development• The cut-off rates for each may be fixed at the
median of Marketing ROI and NMM respectively.
• After the products/ product groups are classified into the four squares, some suggested conclusions may be as follows:
• Quadrant 1: satisfactory-retain the marketing mix;
• Quadrant 2: Cut costs, adjust price;
• Quadrant 3: Sell more, manage assets better, turn and earn;
• Quadrant 4: Products need a thorough review to phase them out or salvage them through long term solutions.

Product Planning and Development
• Ideally a marketer should try to have as many products as possible in the Quadrant 1, and as few products as possible in Quadrant 4.
• Too many products in Quadrant 4 point to insipient sickness of the company.
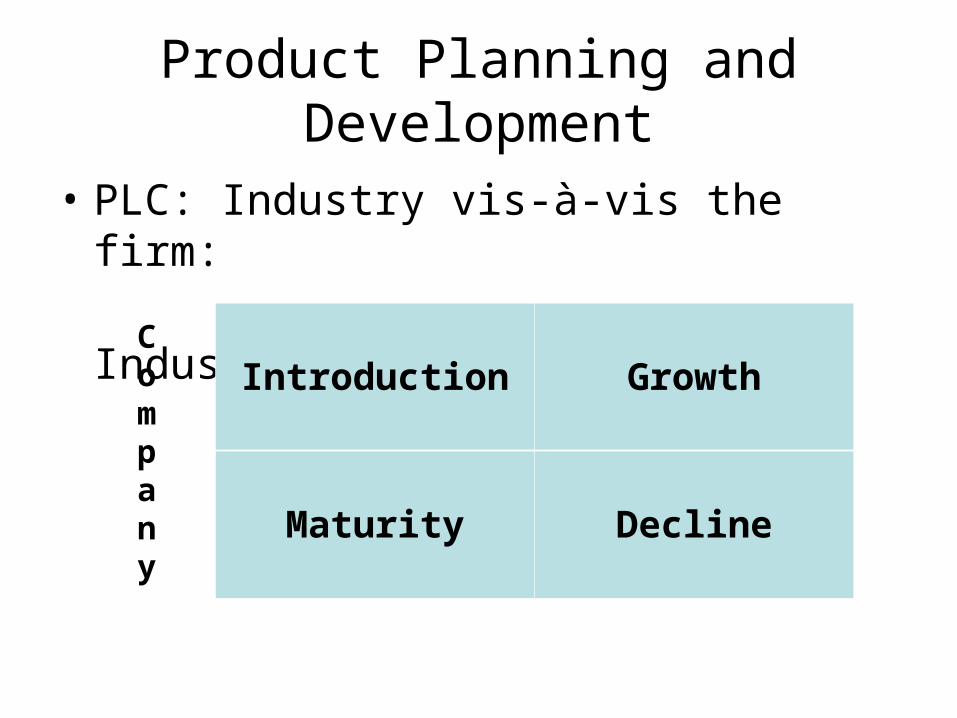
Product Planning and Development
• PLC: Industry vis-à-vis the firm:
Industry
Company
Introduction Growth
Maturity Decline
Product Planning and Development
• Possible inferences are as follows:• Industry and company launch: Leadership
status;• Industry growth - Company launch: Good but
monitoring required;• Industry maturity - Company launch: To be
extremely careful as the situation is fraught with danger;
• Industry decline – Company launch: God save the company.
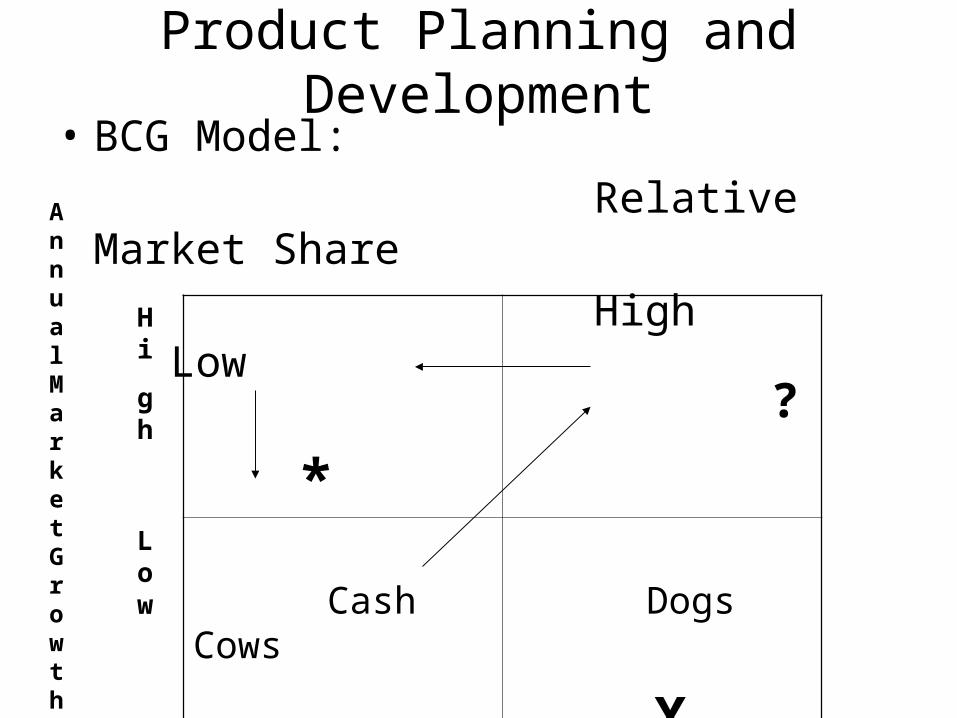
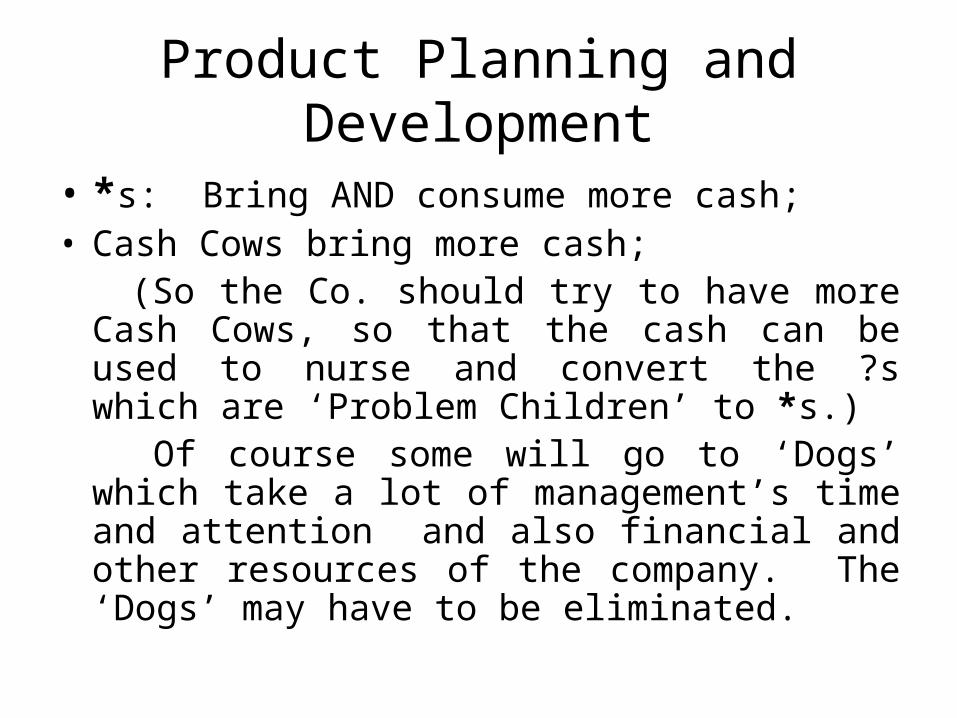
Product Planning and Development• BCG Model:
Relative Market Share
High Low
*
?
Cash Cows
Dogs
X
Annual Market Growth
Hi
gh
Low
Product Planning and Development
• *s: Bring AND consume more cash;• Cash Cows bring more cash; (So the Co. should try to have more Cash Cows,
so that the cash can be used to nurse and convert the ?s which are ‘Problem Children’ to *s.)
Of course some will go to ‘Dogs’ which take a lot of management’s time and attention and also financial and other resources of the company. The ‘Dogs’ may have to be eliminated.
Product Planning and Development
• It has been observed by BCG group that the direct manufacturing costs of the *s and the Cash Cows are relatively low.
• Comparison of all the four models: Products in quadrant 1–highly satisfactory; quadrant 4 – extremely poor; (These are the most likely candidates for pruning).
• So, Sickness as well as the Recovery start at the Market place. Financial ratios may find the effects – not the causes.

Product Planning and Development
• Product-wise profitability analysis: This helps in:• identifying the most profitable products;• allocating funds available for future investments;• maintaining close control over cost.
Product-wise profits may be measured by comparing the sales revenues of each product with the costs associated with its production, selling and distribution.
Product Planning and Development• There are two approaches for this analysis:
Contribution approach and Absorption costing approach.
• The Contribution approach requires the segregation of all costs into their fixed and variable components and tracing the variable components to the individual products.
• The Absorption Costing approach traces all costs - fixed and variable – to the individual products. So this approach judges the profitability of a product by the profits earned as the difference between the sales value and total cost of sales of a product.
Product Planning and Development
• Click the icon below to see two examples for a clear understanding:
Microsoft Word Document
Product Planning and Development
• In real life situations, for large companies having diversified product range and operating through a large number of sales and distribution outlets, the division/product group/product-wise analysis is more complicated.
• Computerisation helps – but the appropriate programmes have to be in place. ( Can u suggest the data that has to be collected for the inputs?)
Product Planning and Development
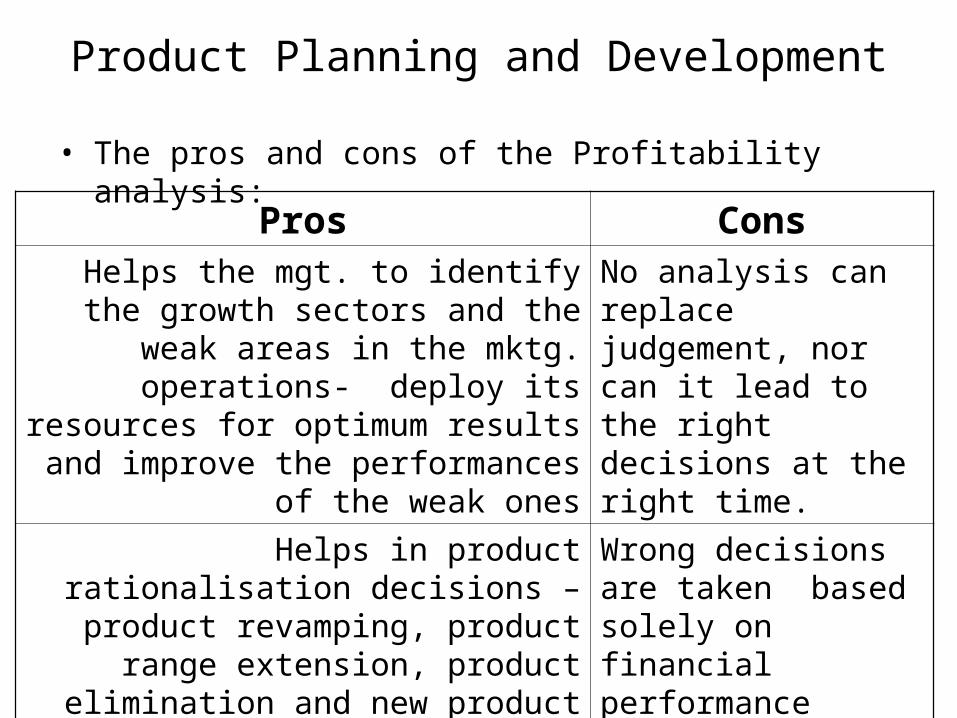
• The pros and cons of the Profitability analysis:
Pros ConsHelps the mgt. to identify the growth
sectors and the weak areas in the mktg. operations- deploy its resources
for optimum results and improve the performances of the weak ones
No analysis can replace judgement, nor can it lead to the right decisions at the right time.
Helps in product rationalisation decisions – product revamping,
product range extension, product elimination and new product
introduction
Wrong decisions are taken based solely on financial performance results ignoring strategic marketing considerations.
Product Planning and Development
• So we can conclude that profitability statements analysis should be used only as a guide for obtaining useful information in planning appropriate measures for improving the performance of products.
Cost analysis in Marketing Decisions
• Managements at different levels have to take a wide variety of decisions – some of them unprogrammed and others programmed or repetitive.
• The ‘unprogrammed’ are unique – examples: all the capital expenditure decisions.
• Repetitive decisions have to be taken at periodic intervals in respect of repetitive aspects of business – examples: advertisement media selection, expense planning, inventory norms, pricing decisions, optimum product or sales mix etc.
07/04/23 133
Cost analysis in Marketing Decisions
• “Modern Management should be interested not so much in recent decisions as in the futurity of the present decisions .” – Peter Drucker.
• A systematic analysis of past data would definitely offer a good guide to the decision maker.
• While making decisions, there are non-financial or qualitative factors also which weigh heavily than the financial factors.
07/04/23 134
Cost analysis in Marketing Decisions
• The purpose of cost analysis in marketing is essentially to generate and provide financial and quantitative data to decision makers to aid and improve the decision making process.
• A proper analysis of marketing costs aids in the following:
Determination of the marketing costs of each product so that when they are combined with production cost data, product-wise profitability can be worked out;
Control of marketing costs through establishment of budgets and evaluation of managers according to their cost responsibilities;
07/04/23 135
Cost analysis in Marketing Decisions
Analysis of costs involved in serving different classes of customers and different areas to determine their relative profitability
Computation of such figures as cost per sales call, cost per order, cost to include a new customer on the books, etc.
Decision making in regard to sales such as selling through different channels of distribution, selling in different markets and regions, determining product profitability for differing levels of promotional expenses to choose the best possible method of sales promotion and so on.
Cost analysis in Marketing Decisions
• Marketing Cost Analysis is done in two stages: • (i) Costs are initially reclassified from their
accounting headings into functional cost groups in such a way that each cost group brings together all the costs associated with a particular activity in marketing the product.
• (ii) These functional groups are then allocated to control units (i.e. products, consumer groups, channels of distribution) using reasonable bases.
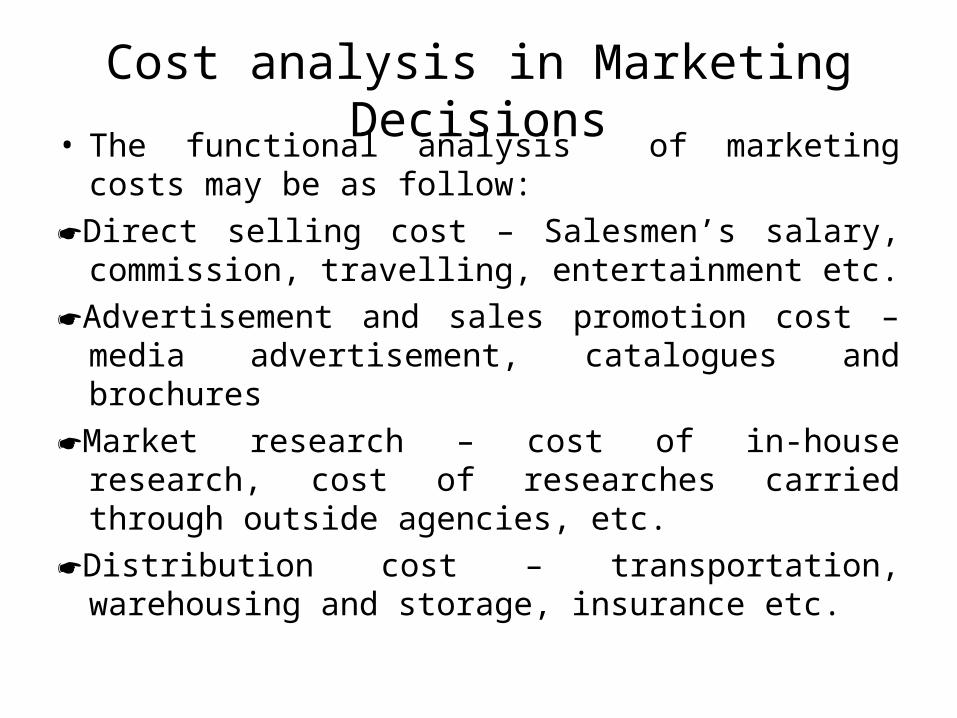
Cost analysis in Marketing Decisions• The functional analysis of marketing costs may
be as follow:
Direct selling cost – Salesmen’s salary, commission, travelling, entertainment etc.
Advertisement and sales promotion cost – media advertisement, catalogues and brochures
Market research – cost of in-house research, cost of researches carried through outside agencies, etc.
Distribution cost – transportation, warehousing and storage, insurance etc.
Cost analysis in Marketing Decisions
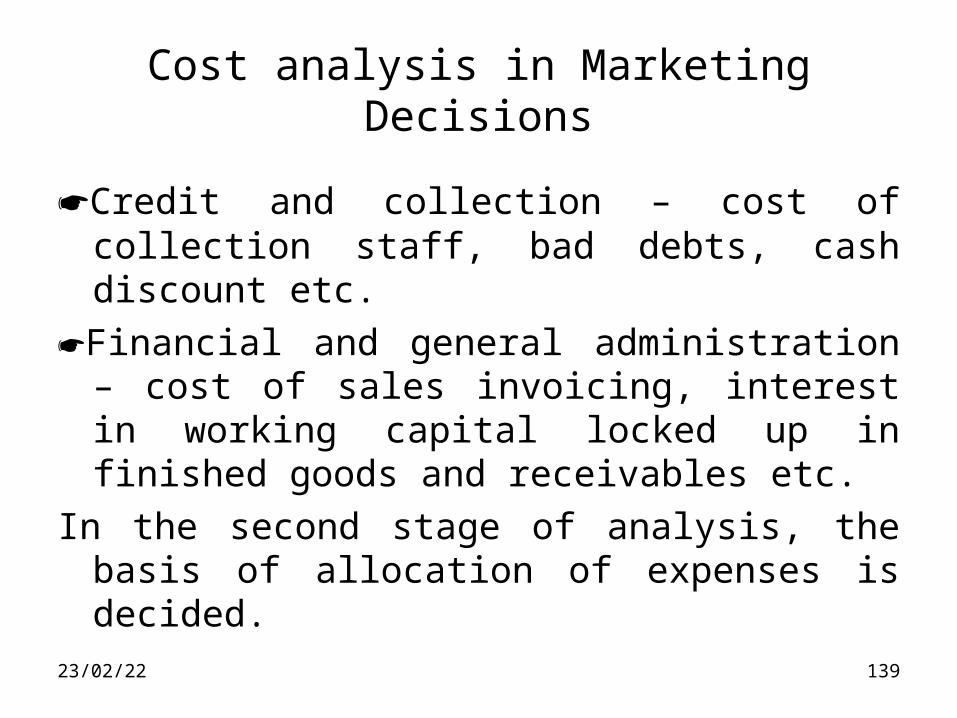
Credit and collection – cost of collection staff, bad debts, cash discount etc.
Financial and general administration – cost of sales invoicing, interest in working capital locked up in finished goods and receivables etc.
In the second stage of analysis, the basis of allocation of expenses is decided.
07/04/23 139
Cost analysis in Marketing Decisions
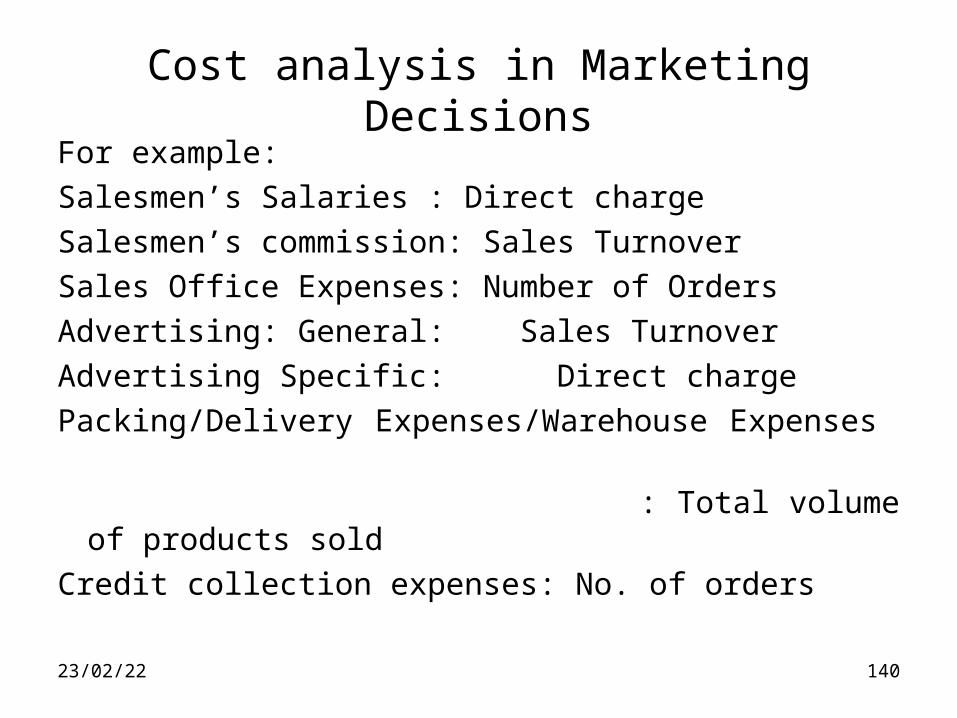
For example:
Salesmen’s Salaries : Direct charge
Salesmen’s commission: Sales Turnover
Sales Office Expenses: Number of Orders
Advertising: General: Sales Turnover
Advertising Specific: Direct charge
Packing/Delivery Expenses/Warehouse Expenses
: Total volume of products sold
Credit collection expenses: No. of orders
07/04/23 140
Cost analysis in Marketing Decisions
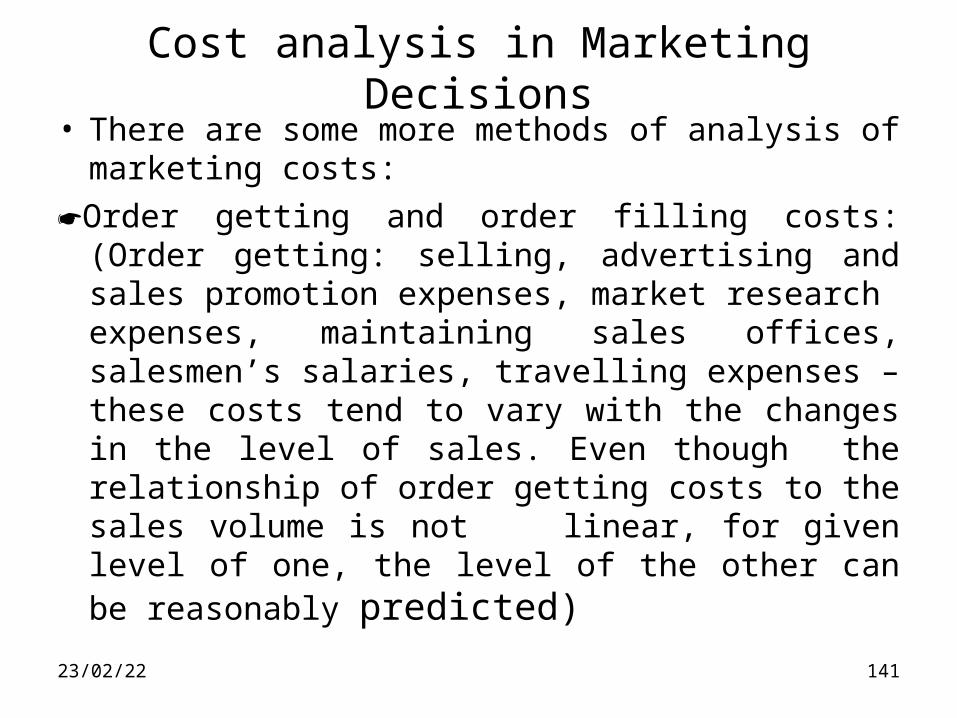
• There are some more methods of analysis of marketing costs:
Order getting and order filling costs: (Order getting: selling, advertising and sales promotion expenses, market research expenses, maintaining sales offices, salesmen’s salaries, travelling expenses – these costs tend to vary with the changes in the level of sales. Even though the relationship of order getting costs to the sales volume is not linear, for given level of one, the level of the other can be reasonably predicted)
07/04/23 141

Cost analysis in Marketing Decisions
(Order filling costs: Order processing cost, warehouse expenses, FG inventory carrying costs, transport costs, packing expenses, customer services expenses, repairs during warranty etc. Order filling costs per unit of output will increase with the increase in volume of sales )
07/04/23 142
Cost analysis in Marketing Decisions
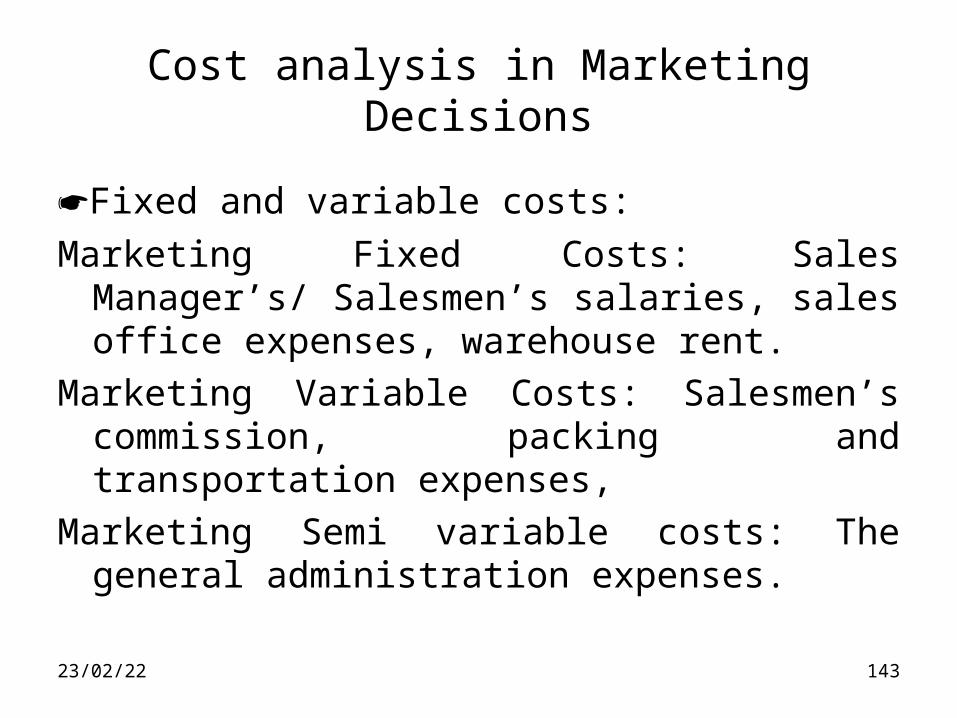
Fixed and variable costs:
Marketing Fixed Costs: Sales Manager’s/ Salesmen’s salaries, sales office expenses, warehouse rent.
Marketing Variable Costs: Salesmen’s commission, packing and transportation expenses,
Marketing Semi variable costs: The general administration expenses.
07/04/23 143

Cost analysis in Marketing Decisions
Cost effectiveness analysis: Two important applications:
One is that you can find the cheapest means of accomplishing a defined objective – like alternative modes of distribution to reach same customers.
The other is to derive maximum value out of a give expenditure.
In both the methods, benefits cannot be quantified strictly in monetary terms.
07/04/23 144
Cost analysis in Marketing Decisions
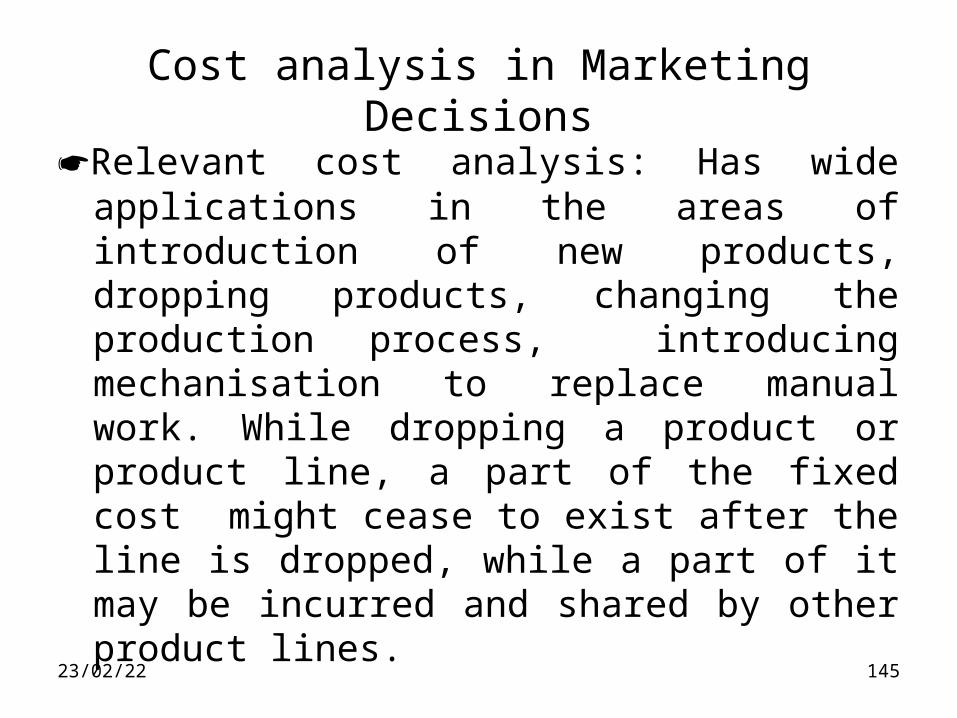
Relevant cost analysis: Has wide applications in the areas of introduction of new products, dropping products, changing the production process, introducing mechanisation to replace manual work. While dropping a product or product line, a part of the fixed cost might cease to exist after the line is dropped, while a part of it may be incurred and shared by other product lines.
07/04/23 145
07/04/23 146
Period Production
(units)
FC p.a. (Rs.)
VC @ Rs.2
Total Cost(Rs.)
Cost per unit (Rs.)
1 10,000 50,000 20,000 70,000 7
2 20,000 50,000 40,000 90,000 4.50
3 1,00,000 50,000 2,00,000 2,50,000 2.50
4 30,000 50,000 60,000 1,10,000 3.67
5 5,000 50,000 10,000 60,000 12
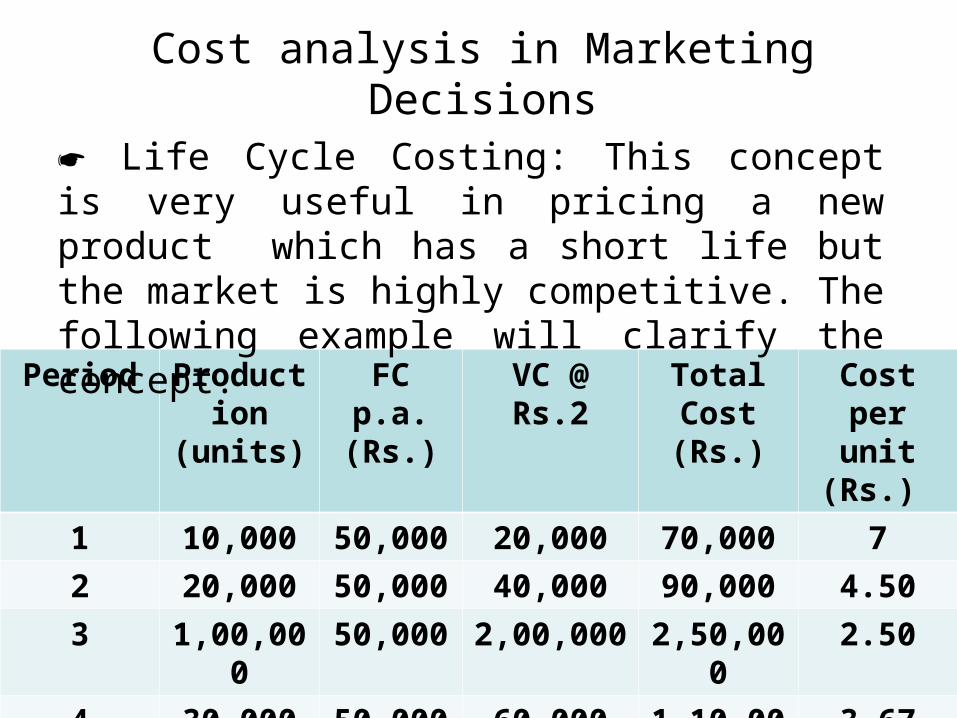
Life Cycle Costing: This concept is very useful in pricing a new product which has a short life but the market is highly competitive. The following example will clarify the concept.
Cost analysis in Marketing Decisions
Cost analysis in Marketing Decisions
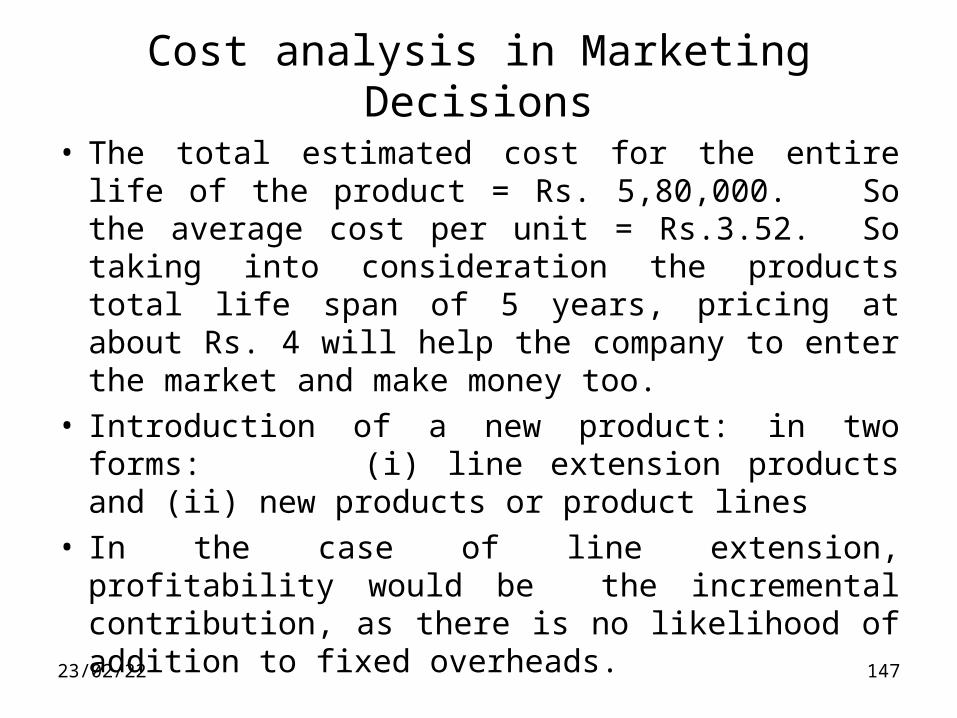
• The total estimated cost for the entire life of the product = Rs. 5,80,000. So the average cost per unit = Rs.3.52. So taking into consideration the products total life span of 5 years, pricing at about Rs. 4 will help the company to enter the market and make money too.
• Introduction of a new product: in two forms: (i) line extension products and (ii) new products or product lines
• In the case of line extension, profitability would be the incremental contribution, as there is no likelihood of addition to fixed overheads. 07/04/23 147

Cost analysis in Marketing Decisions
• (ii) In the case of new product line, the relatable fixed cost, which arises directly out of the introduction of the new product line would have to be deducted from the initial contribution to arrive at the net incremental contribution from the new product line. This incremental contribution can be taken as the profit since the other general fixed costs would have been recovered through the sale of other existing products.
07/04/23 148
Cost analysis in Marketing Decisions
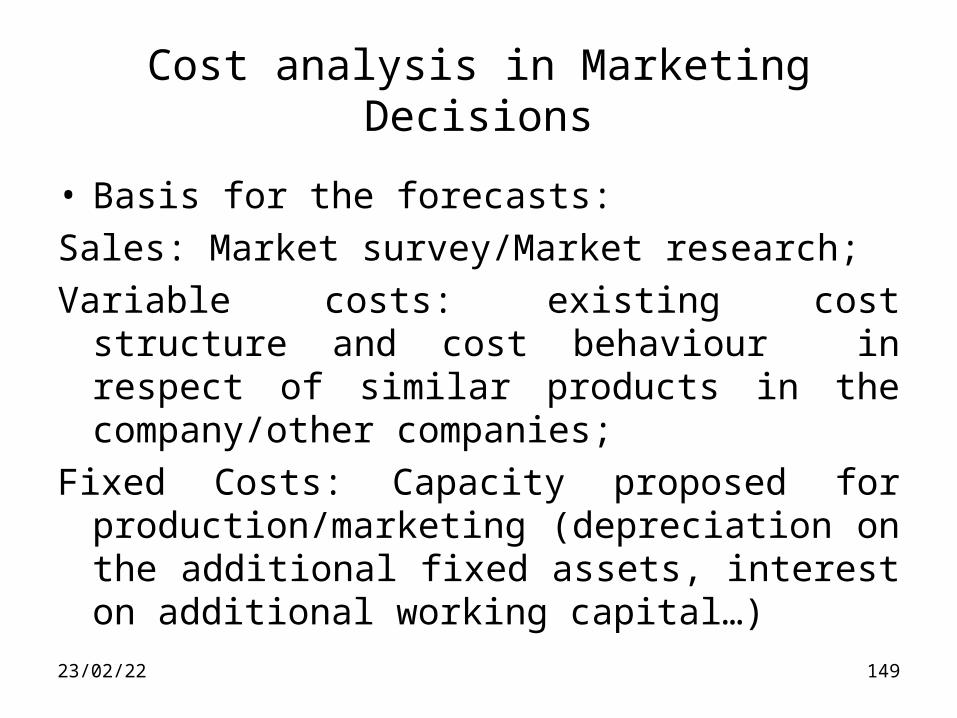
• Basis for the forecasts:
Sales: Market survey/Market research;
Variable costs: existing cost structure and cost behaviour in respect of similar products in the company/other companies;
Fixed Costs: Capacity proposed for production/marketing (depreciation on the additional fixed assets, interest on additional working capital…)
07/04/23 149
Cost analysis in Marketing Decisions
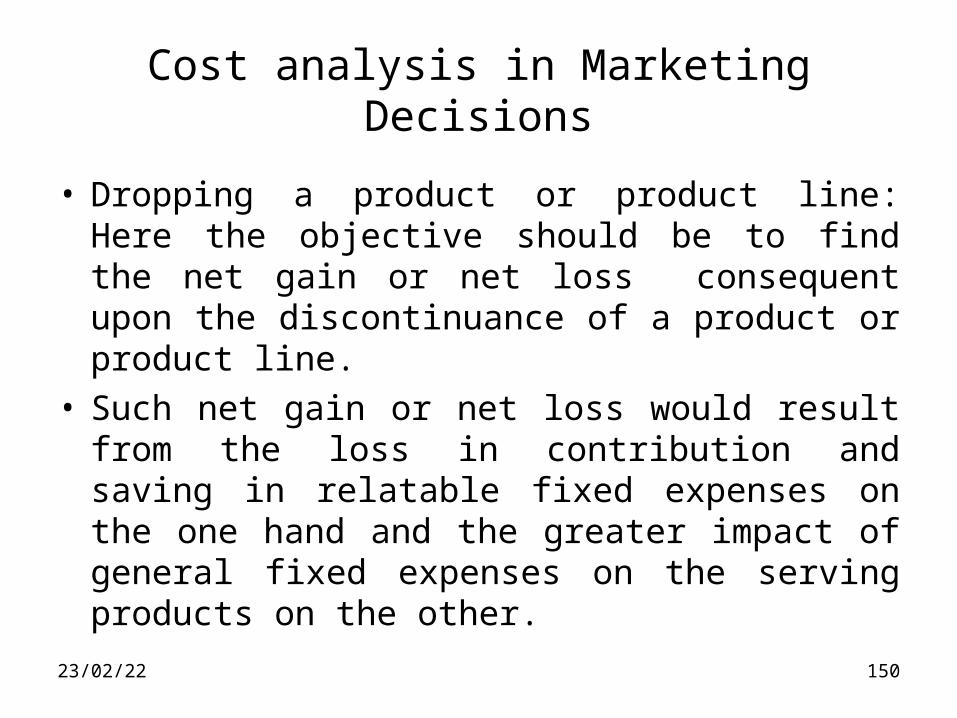
• Dropping a product or product line: Here the objective should be to find the net gain or net loss consequent upon the discontinuance of a product or product line.
• Such net gain or net loss would result from the loss in contribution and saving in relatable fixed expenses on the one hand and the greater impact of general fixed expenses on the serving products on the other.
07/04/23 150

07/04/23 151
Status Quo After Dropping C
A B C Total A B Total
Sales 50 60 40 150 50 60 110
Contribution 25 24 8 57 25 24 49
Direct Relatable Fixed Cost
4 5 3 12 4 5 9
General Fixed Cost (apportioned in the ratio of
sales)10 12 8 30 14 16 30
Profit 11 19 (3) 15 7 3 10
In this case, the dropping of C does not improve the overall profitability, though C was a loss making product. The total profit comes down by 5 which was the net contribution of C.
Cost analysis in Marketing Decisions
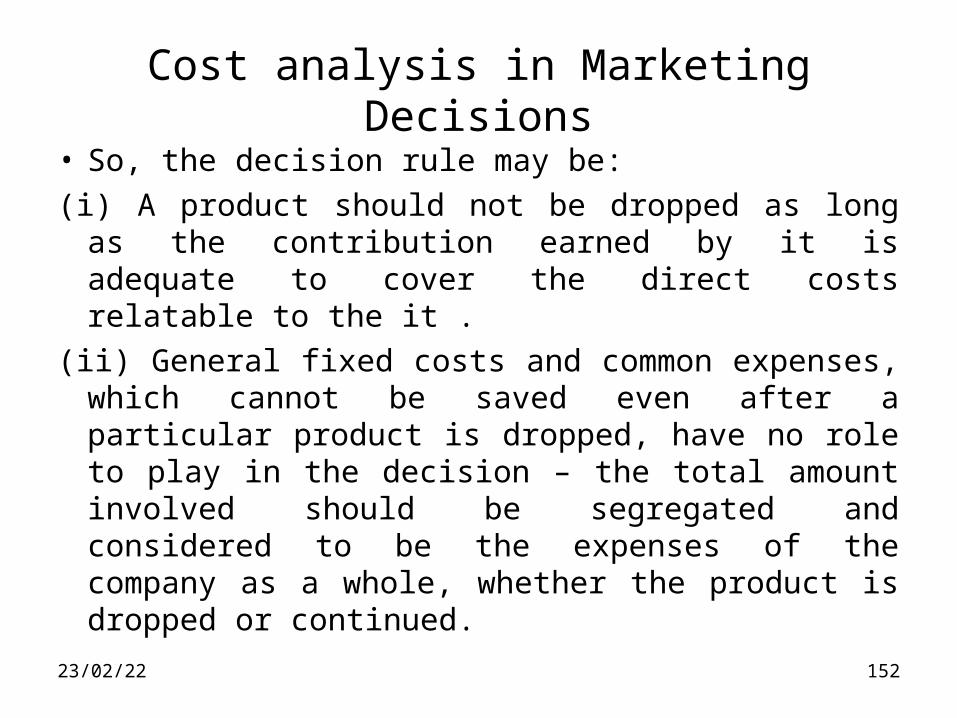
• So, the decision rule may be:
(i) A product should not be dropped as long as the contribution earned by it is adequate to cover the direct costs relatable to the it .
(ii) General fixed costs and common expenses, which cannot be saved even after a particular product is dropped, have no role to play in the decision – the total amount involved should be segregated and considered to be the expenses of the company as a whole, whether the product is dropped or continued.
07/04/23 152

Marginal Costing and Break-even Analysis
• Marginal Costing: is the technique of segregating fixed and variable costs and arriving at the cost which would vary in proportion to the volume of production or sales. (Marginal costing and marginal cost are also known as direct costing and direct cost)
• Fixed costs are unaffected by variations in the volume of output (for a particular range of activities.)
• Variable costs are those that tend to vary directly in relation to the volume of output.
07/04/23 153
Marginal Costing and Break-even Analysis
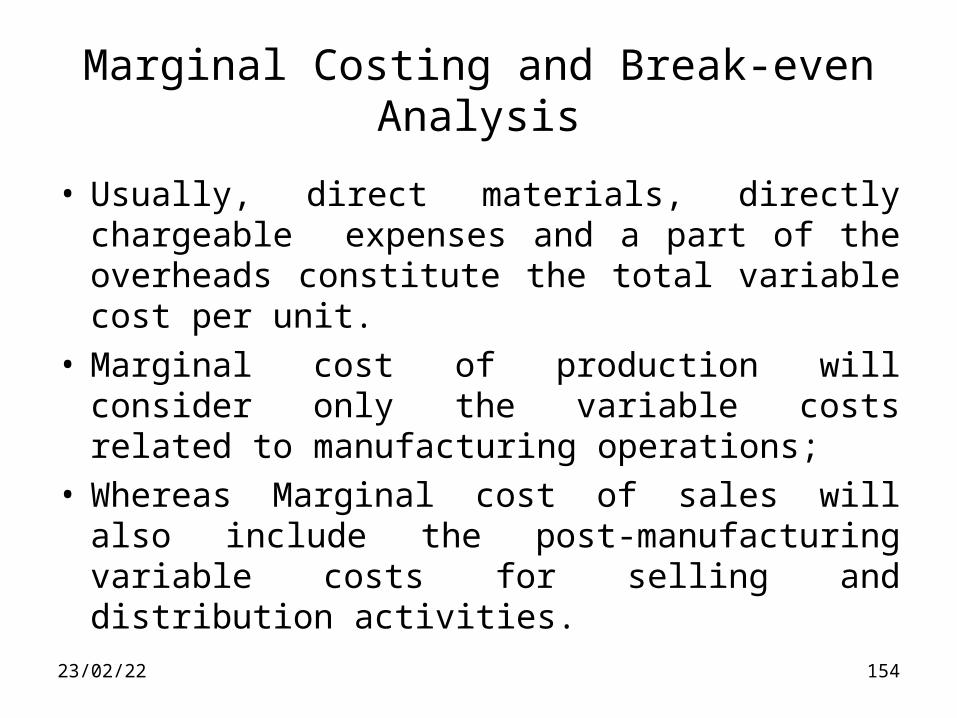
• Usually, direct materials, directly chargeable expenses and a part of the overheads constitute the total variable cost per unit.
• Marginal cost of production will consider only the variable costs related to manufacturing operations;
• Whereas Marginal cost of sales will also include the post-manufacturing variable costs for selling and distribution activities.
07/04/23 154
Marginal Costing and Break-even Analysis
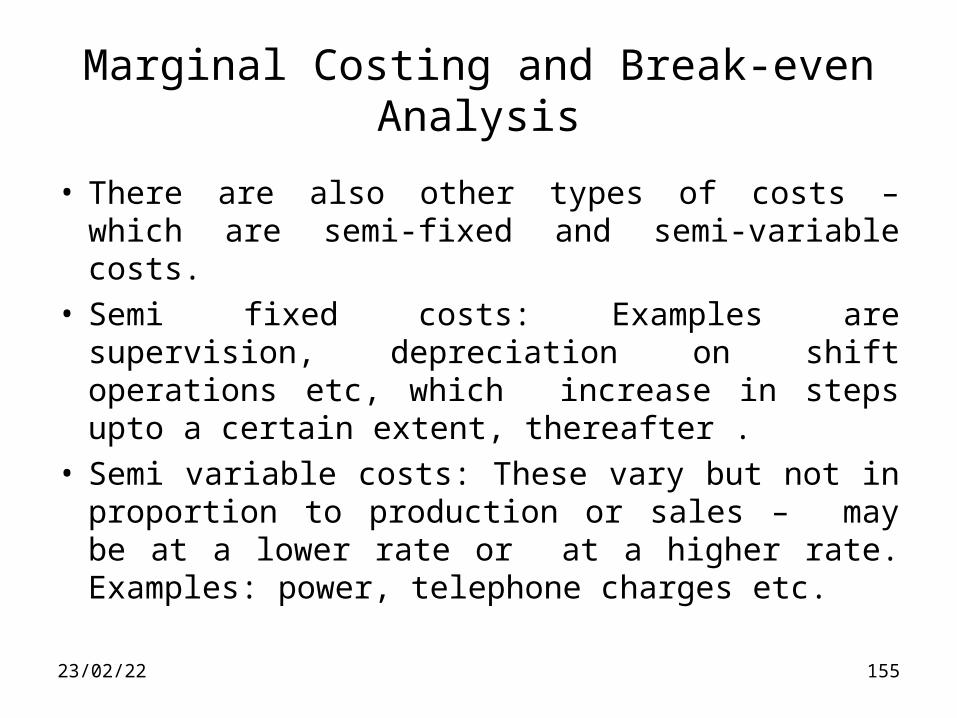
• There are also other types of costs – which are semi-fixed and semi-variable costs.
• Semi fixed costs: Examples are supervision, depreciation on shift operations etc, which increase in steps upto a certain extent, thereafter .
• Semi variable costs: These vary but not in proportion to production or sales – may be at a lower rate or at a higher rate. Examples: power, telephone charges etc.
07/04/23 155
Marginal Costing and Break-even Analysis• Marginal Costing technique precludes any
apportionment of fixed costs among products. Fixed costs are treated as period costs of the business and are considered separately in arriving at the profits of the business.
• The total profit of a business may change merely because of a change in the sales-mix, while all other factors remain changed.
07/04/23 156

Three Scenarios – changes in the sales mix.
07/04/23 157
Scenario 1 Scenario 2 Scenario 3
A B C A B C A B CUnits Sold-lakhs 1 2 3 3 1 2 1 4 1
Contribution per unit Rs. 45 20 30 45 20 30 45 20 30
Total contribution Rs.lakhs 45 40 90 135 20 60 45 80 30
Contribution fund of the business
175 215 155
Total fixed cost of the Business Rs. lakhs
75 75 75
Total Profit of the Business – Rs. lakhs
100 140 80
This example shows that there is no necessity to apportion the fixed costs among the products as long as overall profit is maintained or improved as in Scenario 2.
Marginal Costing and Break-even Analysis
• C/S Ratio: Contribution to Sales ratio (also known as P/V ratio- Profit Volume ratio-even though it is not the ratio of profit to the volume)
• If the sales price is Rs. 100 and the contribution is Rs. 40, then the C/S ration = 0.4 or 40%
• Recall that in a previous example, we have worked out this ratio.
07/04/23 158
Marginal Costing and Break-even Analysis
• Continuing the previous example, if the sales prices of the three products are Rs. 100, 40 and 90 and the marginal costs are Rs. 55,20 and 60 respectively, then the C/S ratios are 45%,50% and 33.33%.
• In this case, from the sales price point of view, the order of preference of the products would be A,C and B. Whereas from the C/S point of view, it should be B,A and C.
07/04/23 159
Marginal Costing and Break-even Analysis
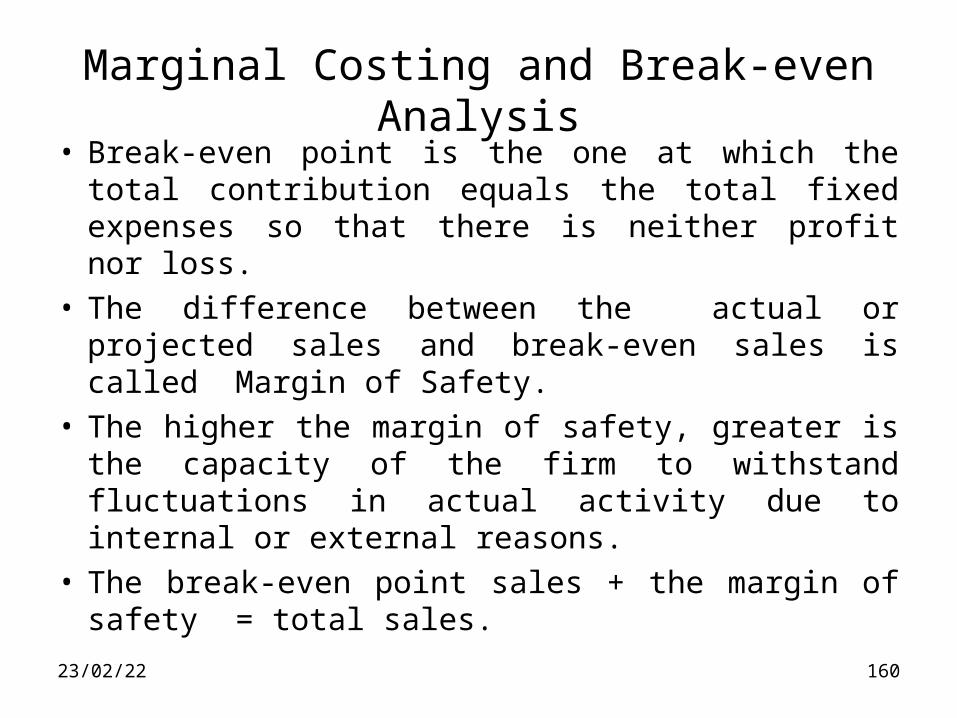
• Break-even point is the one at which the total contribution equals the total fixed expenses so that there is neither profit nor loss.
• The difference between the actual or projected sales and break-even sales is called Margin of Safety.
• The higher the margin of safety, greater is the capacity of the firm to withstand fluctuations in actual activity due to internal or external reasons.
• The break-even point sales + the margin of safety = total sales.
07/04/23 160
Marginal Costing and Break-even Analysis
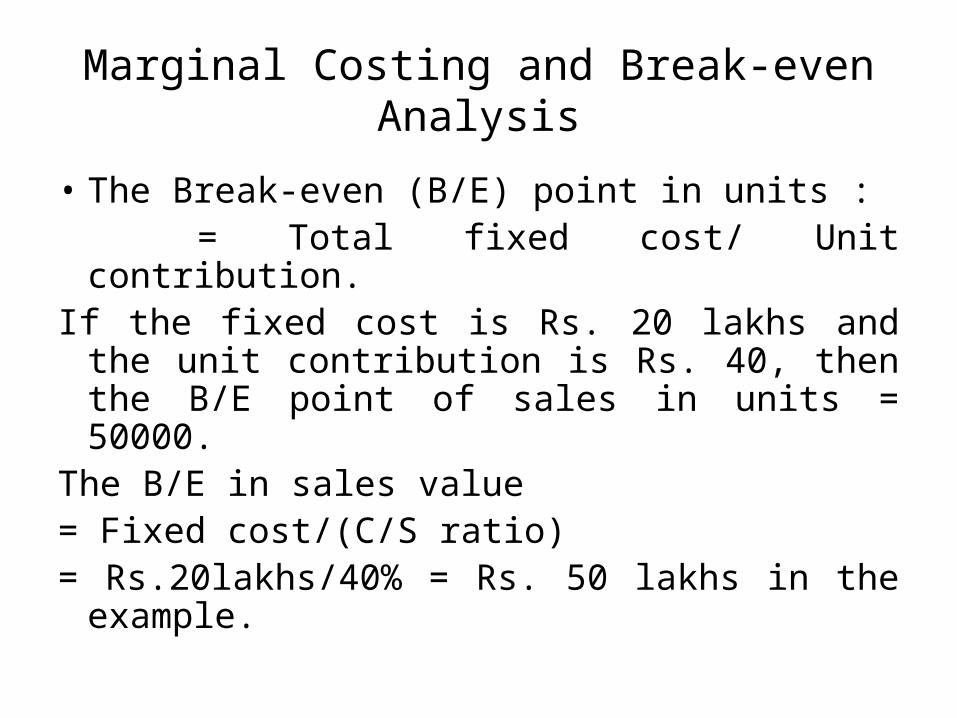
• The Break-even (B/E) point in units : = Total fixed cost/ Unit contribution.If the fixed cost is Rs. 20 lakhs and the unit
contribution is Rs. 40, then the B/E point of sales in units = 50000.
The B/E in sales value = Fixed cost/(C/S ratio)= Rs.20lakhs/40% = Rs. 50 lakhs in the
example.
Marginal Costing and Break-even Analysis
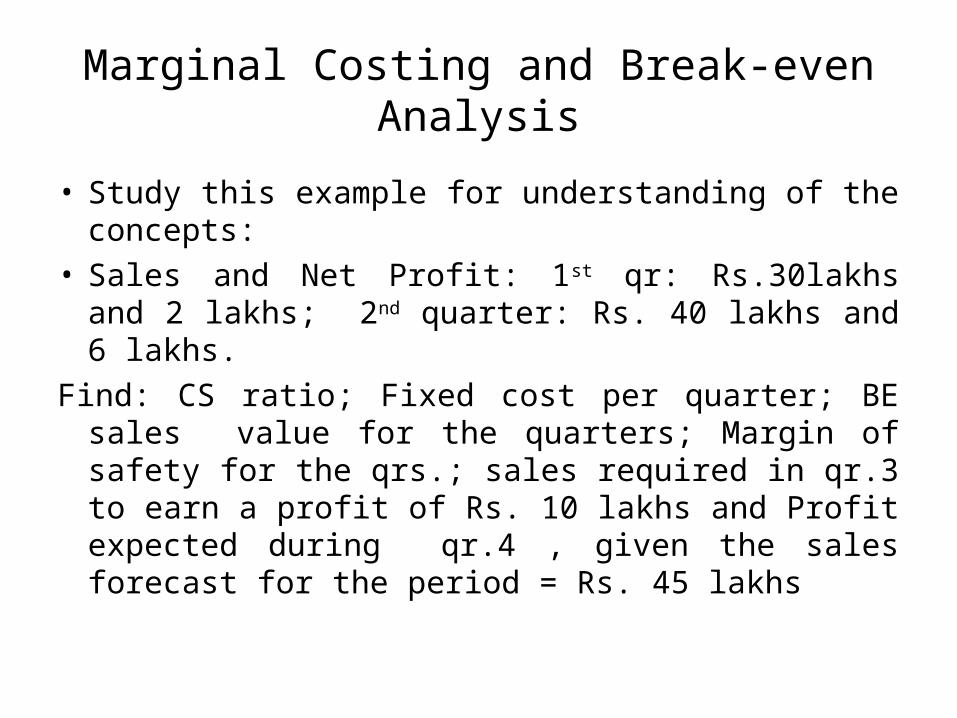
• Study this example for understanding of the concepts:
• Sales and Net Profit: 1st qr: Rs.30lakhs and 2 lakhs; 2nd quarter: Rs. 40 lakhs and 6 lakhs.
Find: CS ratio; Fixed cost per quarter; BE sales value for the quarters; Margin of safety for the qrs.; sales required in qr.3 to earn a profit of Rs. 10 lakhs and Profit expected during qr.4 , given the sales forecast for the period = Rs. 45 lakhs
Marginal Costing and Break-even Analysis
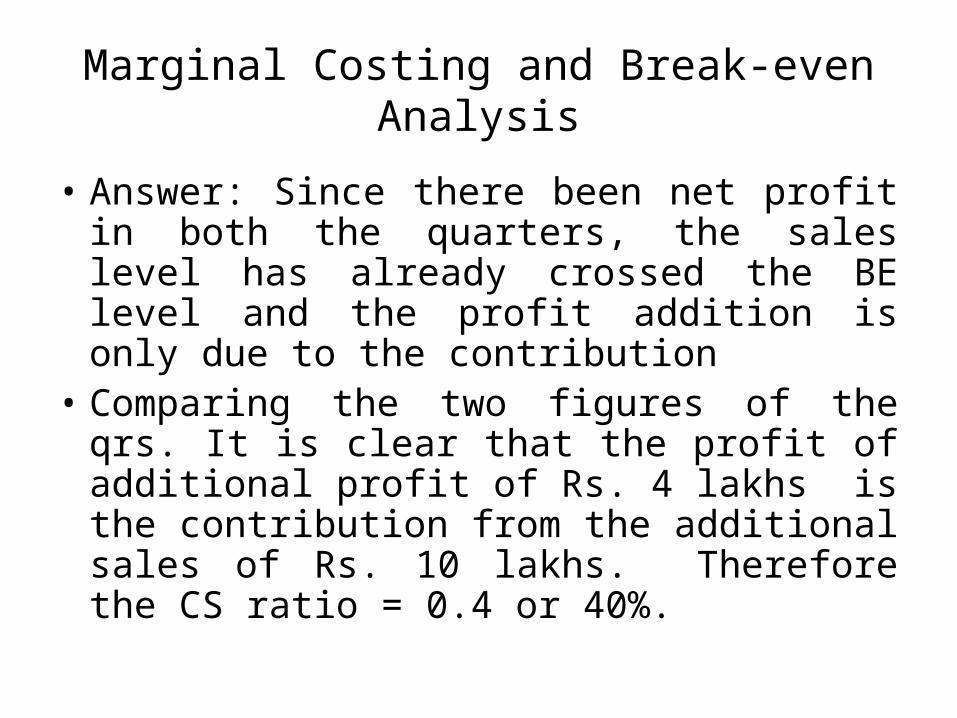
• Answer: Since there been net profit in both the quarters, the sales level has already crossed the BE level and the profit addition is only due to the contribution
• Comparing the two figures of the qrs. It is clear that the profit of additional profit of Rs. 4 lakhs is the contribution from the additional sales of Rs. 10 lakhs. Therefore the CS ratio = 0.4 or 40%.
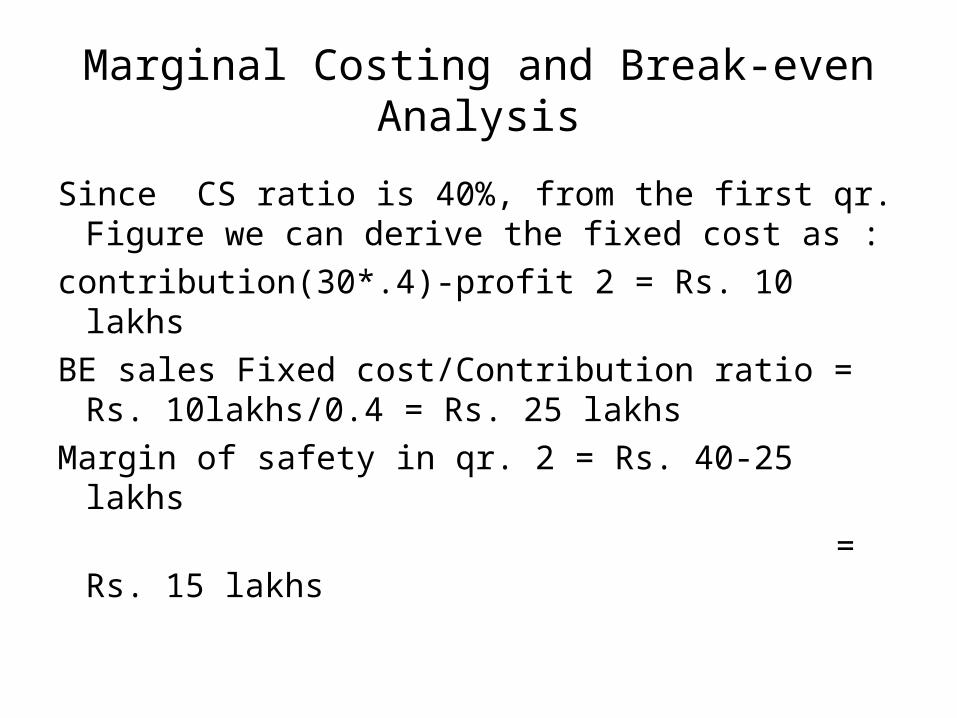
Marginal Costing and Break-even Analysis
Since CS ratio is 40%, from the first qr. Figure we can derive the fixed cost as :
contribution(30*.4)-profit 2 = Rs. 10 lakhs
BE sales Fixed cost/Contribution ratio = Rs. 10lakhs/0.4 = Rs. 25 lakhs
Margin of safety in qr. 2 = Rs. 40-25 lakhs
= Rs. 15 lakhs

Marginal Costing and Break-even Analysis
• Sales required in qr iii to earn a profit of Rs. 10 lakhs :
Contribution required = fixed cost Rs. 10 lakhs + Profit Rs. 10 lakhs i.e. 20 lakhs.
Therefore the required sales
= Rs. 20 lakhs/contribution ratio 0.4
= Rs. 50 lakhs.
Marginal Costing and Break-even Analysis
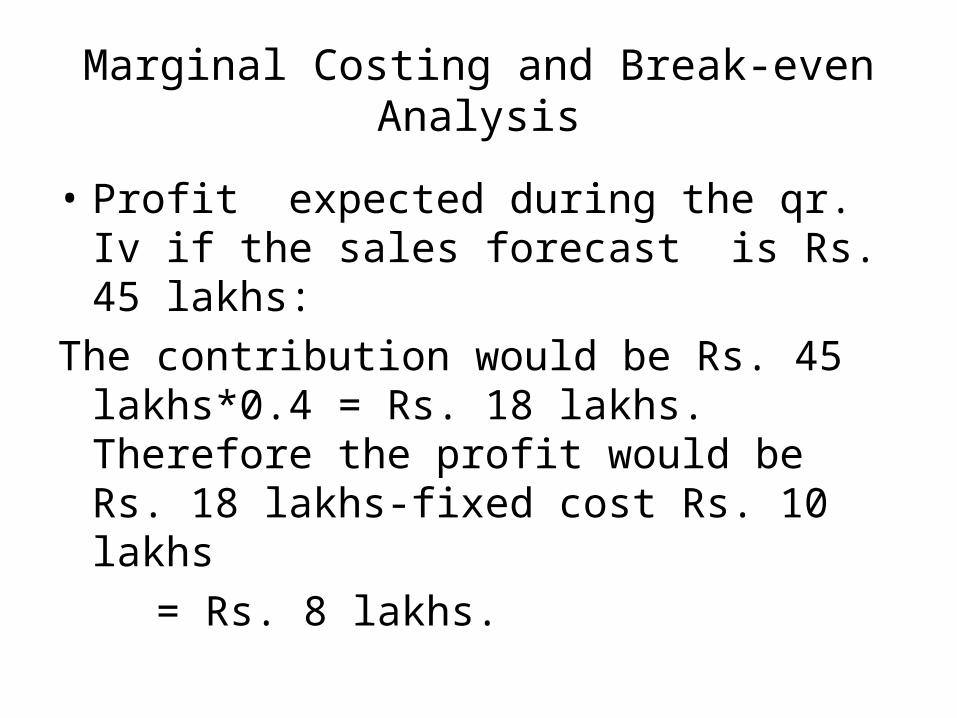
• Profit expected during the qr. Iv if the sales forecast is Rs. 45 lakhs:
The contribution would be Rs. 45 lakhs*0.4 = Rs. 18 lakhs. Therefore the profit would be Rs. 18 lakhs-fixed cost Rs. 10 lakhs
= Rs. 8 lakhs.
Marginal Costing and Break-even Analysis
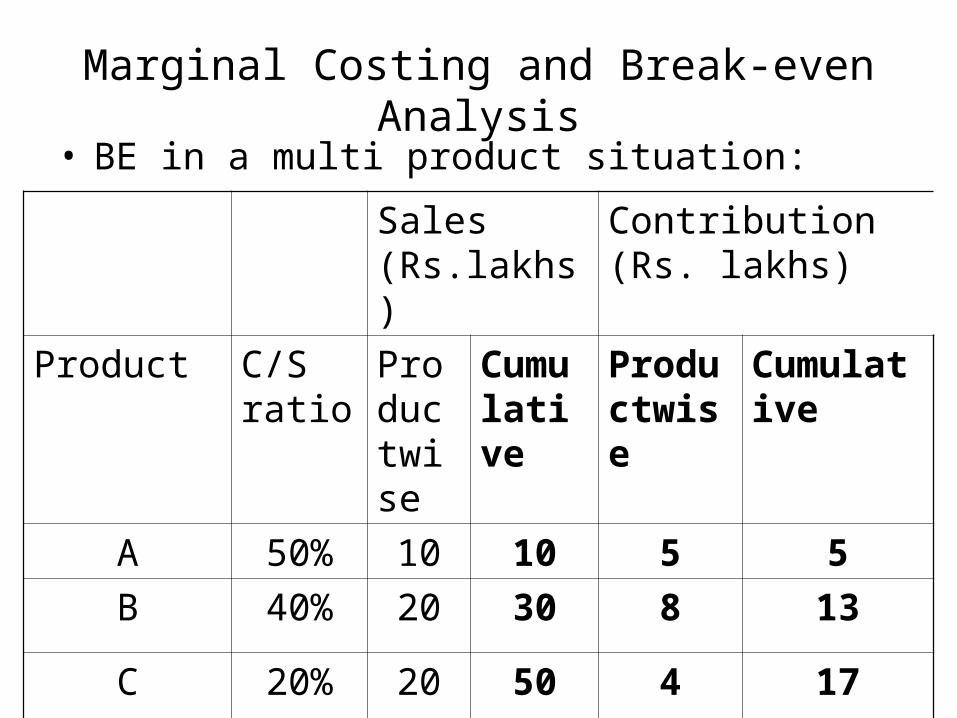
• BE in a multi product situation:
Sales (Rs.lakhs)
Contribution (Rs. lakhs)
Product C/S ratio
Productwise
Cumulative
Productwise
Cumulative
A 50% 10 10 5 5
B 40% 20 30 8 13
C 20% 20 50 4 17
Marginal Costing and Break-even Analysis
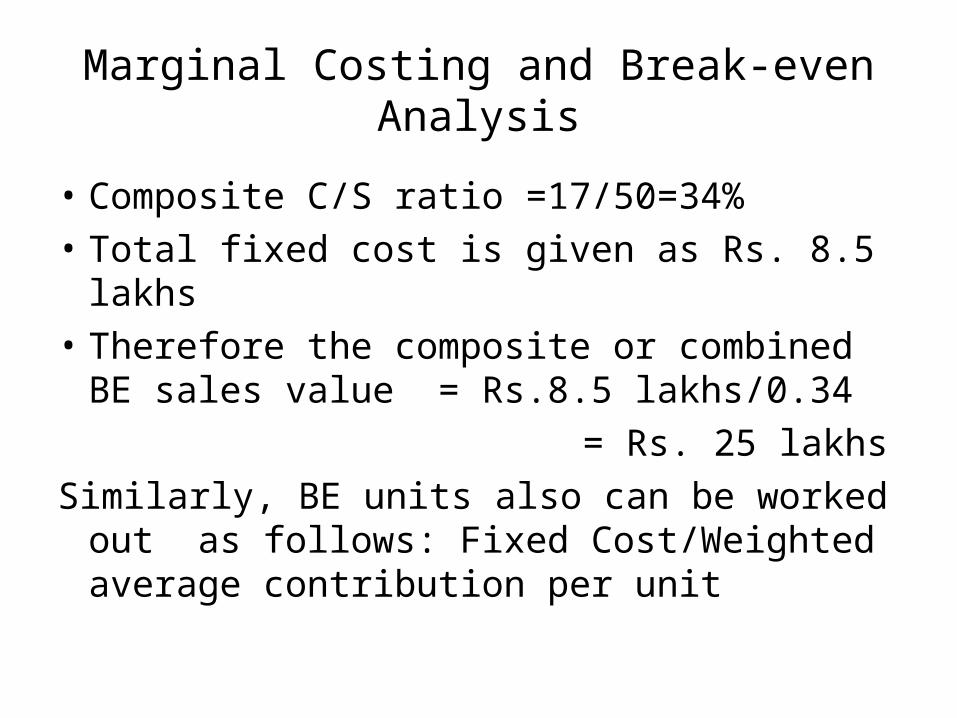
• Composite C/S ratio =17/50=34%
• Total fixed cost is given as Rs. 8.5 lakhs
• Therefore the composite or combined BE sales value = Rs.8.5 lakhs/0.34
= Rs. 25 lakhs
Similarly, BE units also can be worked out as follows: Fixed Cost/Weighted average contribution per unit
Marginal Costing and Break-even Analysis
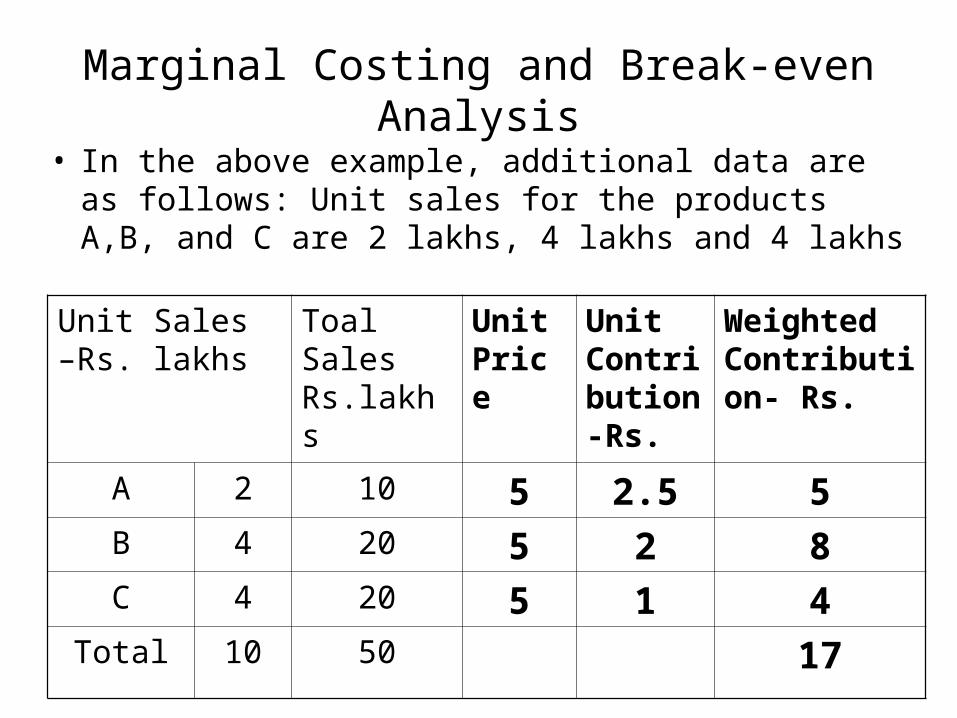
• In the above example, additional data are as follows: Unit sales for the products A,B, and C are 2 lakhs, 4 lakhs and 4 lakhs
Unit Sales –Rs. lakhs
Toal Sales Rs.lakhs
Unit Price
Unit Contribution-Rs.
Weighted Contribution- Rs.
A 2 10 5 2.5 5B 4 20 5 2 8C 4 20 5 1 4
Total 10 50 17
Marginal Costing and Break-even Analysis
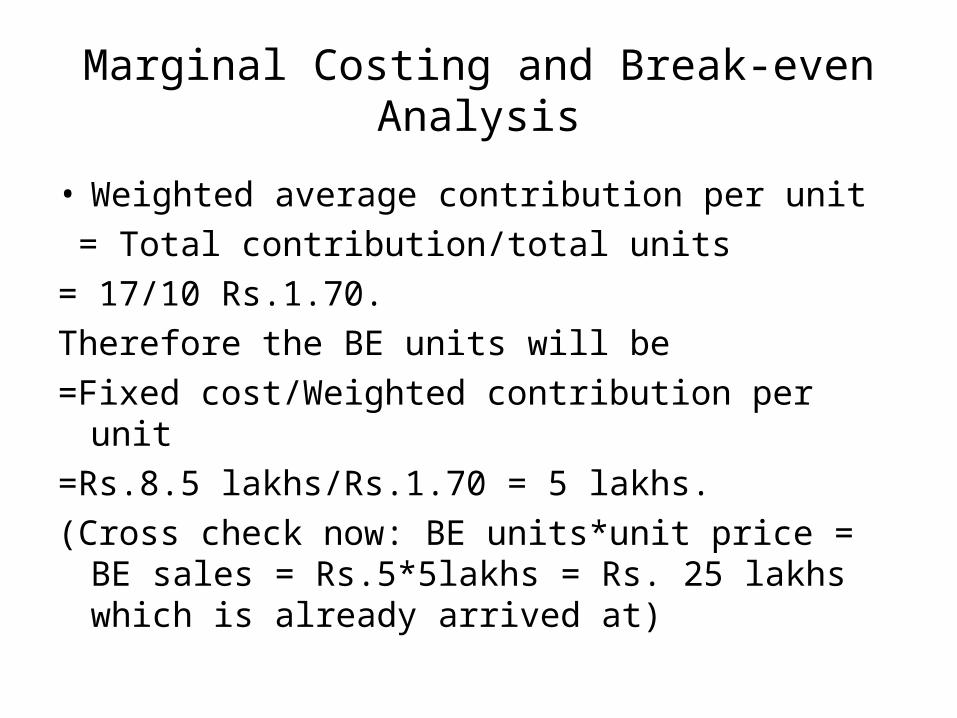
• Weighted average contribution per unit
= Total contribution/total units
= 17/10 Rs.1.70.
Therefore the BE units will be
=Fixed cost/Weighted contribution per unit
=Rs.8.5 lakhs/Rs.1.70 = 5 lakhs.
(Cross check now: BE units*unit price = BE sales = Rs.5*5lakhs = Rs. 25 lakhs which is already arrived at)

• The composite C/S ration will change when the sales-mix changes and so the composite BE sales too.
• This approach is only approximate but still gives a good idea about the consequences of changes in the sales mix.
Marginal Costing and Break-even Analysis
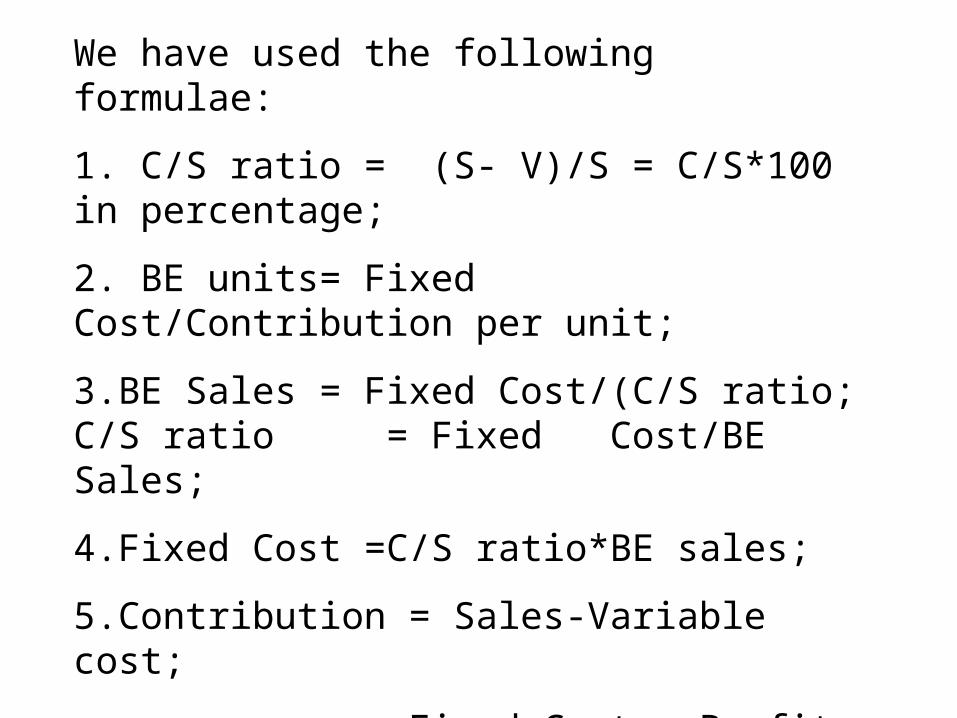
We have used the following formulae:
1. C/S ratio = (S- V)/S = C/S*100 in percentage;
2. BE units= Fixed Cost/Contribution per unit;
3.BE Sales = Fixed Cost/(C/S ratio; C/S ratio = Fixed Cost/BE Sales;
4.Fixed Cost =C/S ratio*BE sales;
5.Contribution = Sales-Variable cost;
=Fixed Cost + Profit or C/S ratio*Sales;
6.Margin of Safety = Sales- BE sales
=(Contribution-Fixed Cost) (i.e. profit)/(C/S) ratio
Pricing
• Pricing is a crucial decision – an integral part of the marketing mix management;
• Price, Volume and Profit are interrelated and affect profit;
• High price or high unit profit leads to low volume of sales and low absolute profit;
• Low price or low unit price leads to high volume of sales and low absolute profit;
Pricing
• Pricing should strike a healthy balance between marketing and cost considerations.
• But the relative importance of the two will largely depend upon: time frame, market conditions, primary marketing objective, consumer buying behaviour and product characteristics.
Pricing
• As you are aware, there are different approaches to pricing:
• High price and low volume vs. Low price and high volume;
• Going rate pricing;• Sealed bid pricing;• Geographical pricing;• Discount pricing;• Discriminatory pricing;• Penetration pricing;• Skimming the cream;
Pricing
• Snob value pricing;• Pre-emptive pricing ;• Product Life Cycle Pricing;• Price reductions ( Price cutting-Price warfare-
Formation of price cartel)
Pricing
• Cost based approaches:• Full cost pricing – ignores elasticity of demand,
ignores competition, no distinction between fixed and variable costs;
• Conversion cost method: based on the value added (–eg. Printing industry);
• Marginal Cost Pricing;• Return on Investment Pricing – useful in a multi
product company, or while introducing new products where no market price exists;
Pricing
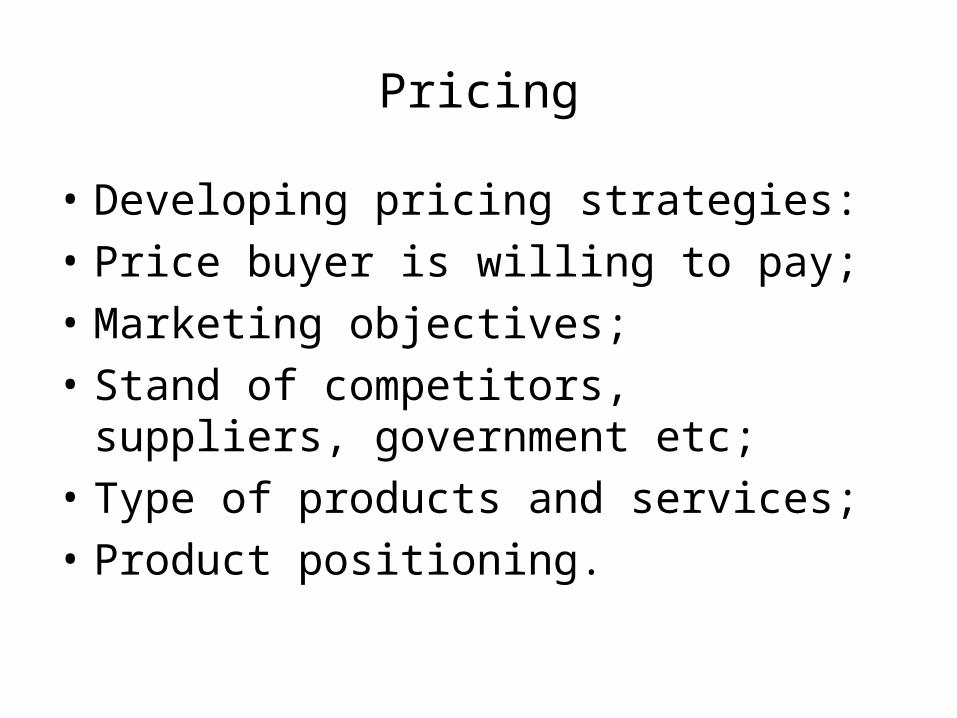
• Developing pricing strategies:
• Price buyer is willing to pay;
• Marketing objectives;
• Stand of competitors, suppliers, government etc;
• Type of products and services;
• Product positioning.
Pricing
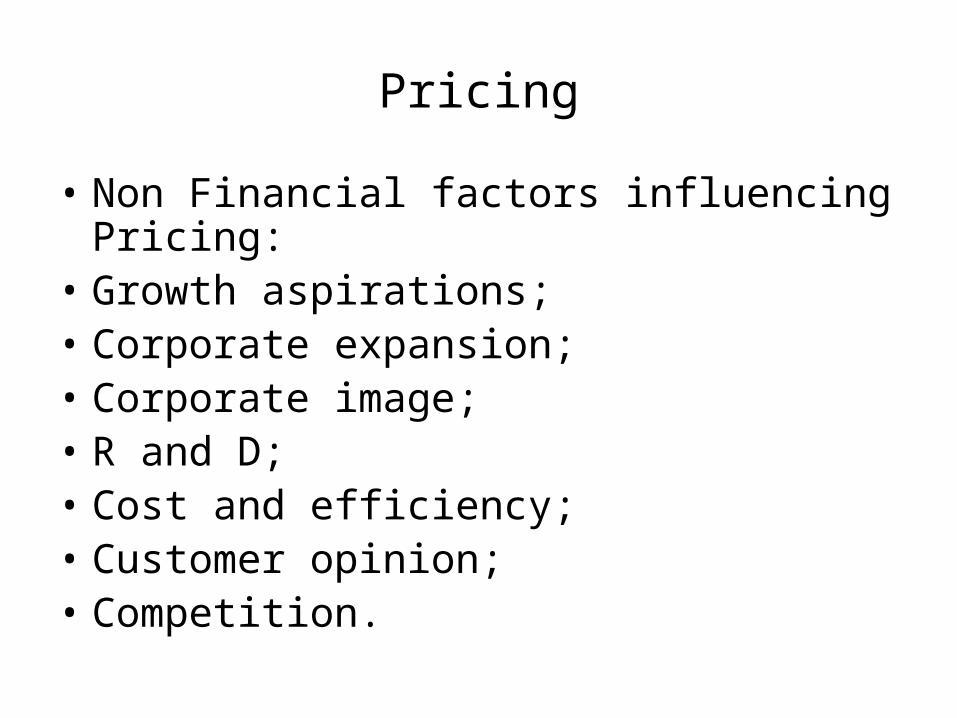
• Non Financial factors influencing Pricing:• Growth aspirations;• Corporate expansion;• Corporate image;• R and D;• Cost and efficiency;• Customer opinion;• Competition.

Pricing
• In export pricing, the following costs have to be borne in mind:
• Ex-factory price of product;• Cost of Special packing if any;• Inspection charges to Export Inspection
Agencies;• Transportation from factory to warehouse/ports,
warehouse rentals;• Clearing and Forwarding Agent’s charges if any;• Port charges including handling inside the ports;
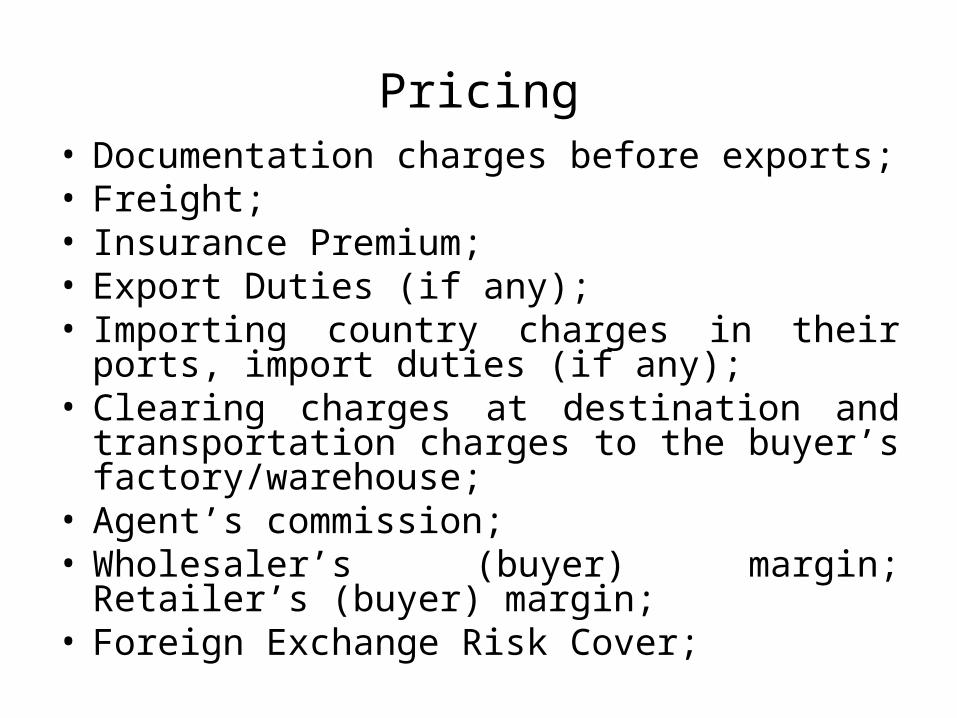
Pricing• Documentation charges before exports;• Freight;• Insurance Premium;• Export Duties (if any);• Importing country charges in their ports, import
duties (if any);• Clearing charges at destination and
transportation charges to the buyer’s factory/warehouse;
• Agent’s commission;• Wholesaler’s (buyer) margin; Retailer’s (buyer)
margin;• Foreign Exchange Risk Cover;