Marketing Expenditure Trends - London Business...
78
Marketing Expenditure Trends December 2002 By Patrick Barwise and Alan Styler
Transcript of Marketing Expenditure Trends - London Business...

Marketing Expenditure TrendsDecember 2002By Patrick Barwise and Alan Styler

Marketing Expenditure TrendsContents
About this Report 3
Executive Summary 4
1. Aims and Method 8
2. Total Marketing Expenditure 122.1 Changes in total expenditure2.2 The reasons behind the changes
3. Allocating the Marketing Budget 20
4. Media Advertising 244.1 Expenditure 2001-034.2 Reasons for increases/decreases in expenditure4.3 Direct response advertising
5. Sales Promotion 345.1 Expenditure 2001-035.2 Reasons for increases/decreases in expenditure5.3 Evaluating sales promotions
6. Direct Mail 426.1 Expenditure 2001-036.2 Reasons for increases/decreases in expenditure6.3 Outsourcing
7. PR/sponsorship 487.1 Expenditure 2001-037.2 Reasons for increases/decreases in expenditure
8. Interactive Marketing 528.1 Expenditure 2001-038.2 Reasons for increases/decreases in expenditure
9. Organizational and Market Context 569.1 Is the marketing function represented at board level?9.2 Marketing metrics9.3 Respondents’ comments on market trends
10. Conclusions 64
Appendix A: Trends in the Five CountriesAppendix B: Industry Sector TrendsAbout the AuthorsLondon Business School, Havas, and Kudos Research
2

About this Report
This report describes a study of actual and planned marketing expenditure in the top five global markets: USA,Japan, Germany, UK, France. It covers expenditure on advertising, sales promotion, direct mail, PR/sponsorship,and interactive marketing over the three years 2001-2003.
The study was commissioned by Havas and conducted by a team at London Business School directed byProfessor Patrick Barwise in collaboration with Alan Styler of EHS Brann. The data, telephone interviews with700 chief marketing officers, were collected by Kudos Research in July/August 2002. 20% of respondentswere recontacted in late October 2002 to check that their responses had not changed significantly.
This report can be accessed at http://www.london.edu/marketing. Results from the report may be reproducedwithout permission, with the following acknowledgement: "Source: London Business School/Havas, MarketingExpenditure Trends (www.london.edu/marketing)".
ISBN: 0-902583-34-4 © London Business School and Havas 2002
3
44 Executive Summary
Executive Summary
This study explores actual and planned expenditure on marketing by large and mid-sized businesses in the topfive global markets: USA, Japan, Germany, UK, France. Taken together, these five countries account for almosttwo-thirds of the world market for marketing and communication services.
The results are based on a survey of over 700 companies. They cover actual and planned expenditure for thethree years 2001-2003 on:
- media advertising- sales promotion- direct mail- PR and sponsorship- interactive marketing.
The study was commissioned by Havas and directed by Professor Patrick Barwise at London Business School.
Method
The data were collected by Kudos Research in London, using structured telephone interviews with chief marketing officers (eg marketing director, VP marketing) in July-August 2002. The target population was defined as businesses spending at least $1million (€1million, £667,000) last year on marketing, ie the fiveactivities listed above, within the particular country. “Expenditure” excluded in-house staff costs, equipment,overheads, and market research.
Usable responses were obtained from 727 businesses out of 1475 contacted, a response rate of 49.3% ([usable responses]/[refusals + usable responses]), split as follows:
USA 240Japan 122
Germany 120UK 124
France 121727
The interview covered the following items:
• Business demographics (industry sector, local/multinational, expenditure range)
• Total marketing expenditure trends (2002 vs 2001, 2003 vs 2002)
• Allocation of expenditure across the five categories (2001, 2002, 2003)
• % of media advertising allocated to direct response advertising (defined in Section 4.3) (2001, 2002, 2003)
• Formal evaluation/post-audit of sales promotions
• Whether direct mail execution and database management are mainly outsourced or conducted in-house
• Whether the marketing function is represented at board level
• Marketing metrics (current and planned)

Executive Summary 5
Total Expenditure on Marketing
The main trend (Section 2) is that marketing expenditure in the top five global markets is likely to be more-or-less static this year moving to modest growth in 2003. This conclusion is based on data collected inJuly/August 2002 but a follow-up call to 20% of the respondents in late October showed that their expecta-tions had changed little up to that point.
This conclusion is reinforced both by “purchasing diffusion index” data (which simply ask whether firms planto increase, decrease, or not change their expenditure level) and by the many qualitative comments collected.The overwhelming majority of reasons given for cutbacks in marketing suggest that they are a temporaryresponse to current financial and market conditions.
Underneath the general pattern, there are large differences between countries:
Figure 1: Year-on-Year % Change in Total Expenditure
In the UK, USA, and France, a static or growing market in 2002 is followed by clear growth in 2003, leavingthese markets 5%-10% up over the two years (in current local currencies). In contrast, Germany is expectedto be sharply down in 2002 with little if any recovery in 2003 and Japan is expected to decline slightly in bothyears.
Table 1: Year-on-Year % Change in Total Marketing Expenditure (Current local currencies)
Country 2002 vs 2001 2003 vs 2002 2003 vs 2001
USA (n = 237) + 2.0 + 4.4 + 6.5
Japan (n = 116) - 1.4 - 1.5 - 2.9
Germany (n = 104) - 4.5 + 1.3 - 3.4
UK (n = 120) + 4.2 + 5.3 + 9.7
France (n = 108) + 0 .3 + 5.1 + 5.4
Total (n = 685) + 0.6 + 3.3 + 3.9
-5
-3
-1
1
3
5
7
9
2002 vs 2001
2003 vs 2002
2003 vs 2001
USA (n = 237)Japan (n = 116)Germany (n = 104)UK (n = 120)France (n = 108)
% Change
% of Total Expenditure Allocated to Each Category
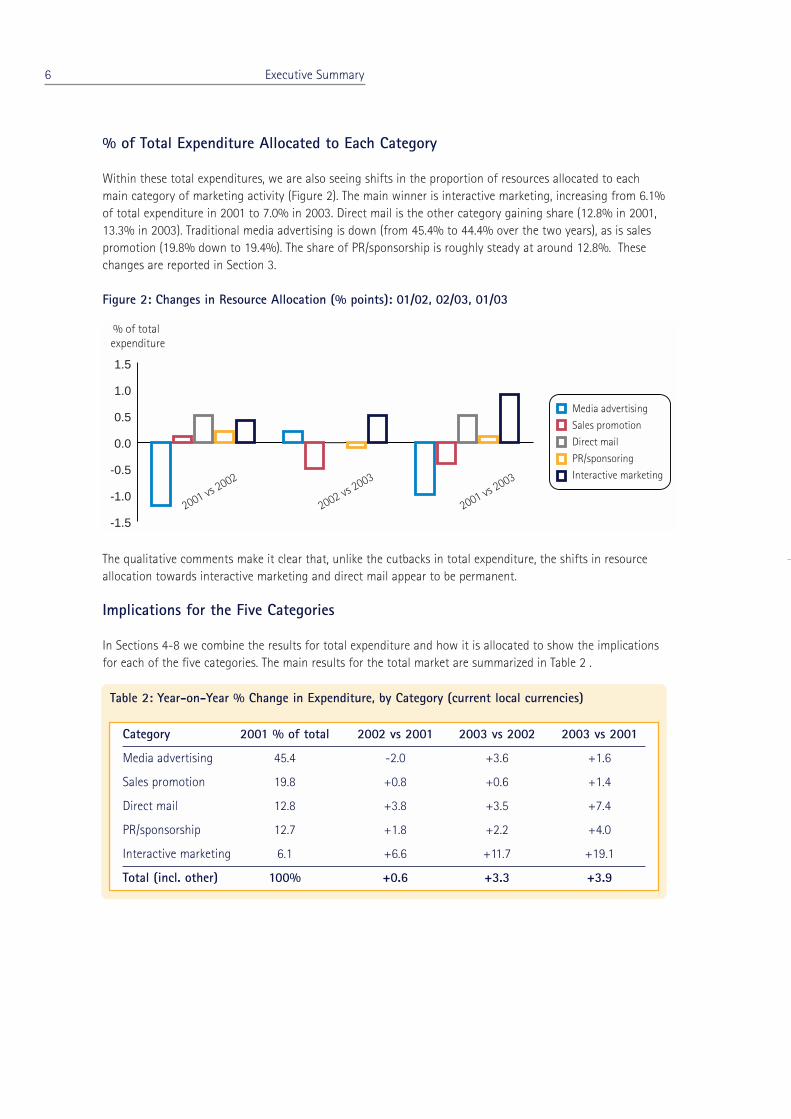
Within these total expenditures, we are also seeing shifts in the proportion of resources allocated to eachmain category of marketing activity (Figure 2). The main winner is interactive marketing, increasing from 6.1%of total expenditure in 2001 to 7.0% in 2003. Direct mail is the other category gaining share (12.8% in 2001,13.3% in 2003). Traditional media advertising is down (from 45.4% to 44.4% over the two years), as is salespromotion (19.8% down to 19.4%). The share of PR/sponsorship is roughly steady at around 12.8%. Thesechanges are reported in Section 3.
Figure 2: Changes in Resource Allocation (% points): 01/02, 02/03, 01/03
The qualitative comments make it clear that, unlike the cutbacks in total expenditure, the shifts in resourceallocation towards interactive marketing and direct mail appear to be permanent.
Implications for the Five Categories
In Sections 4-8 we combine the results for total expenditure and how it is allocated to show the implicationsfor each of the five categories. The main results for the total market are summarized in Table 2 .
6 Executive Summary
-1.5
-1.0
-0.5
0.0
0.5
1.0
1.5
2001 vs 2002
2002 vs 2003
2001 vs 2003
% of total expenditure
Media advertising
Sales promotion
Direct mail
PR/sponsoring
Interactive marketing
Table 2: Year-on-Year % Change in Expenditure, by Category (current local currencies)
Category 2001 % of total 2002 vs 2001 2003 vs 2002 2003 vs 2001
Media advertising 45.4 -2.0 +3.6 +1.6
Sales promotion 19.8 +0.8 +0.6 +1.4
Direct mail 12.8 +3.8 +3.5 +7.4
PR/sponsorship 12.7 +1.8 +2.2 +4.0
Interactive marketing 6.1 +6.6 +11.7 +19.1
Total (incl. other) 100% +0.6 +3.3 +3.9

Concluding Comments
This study is designed to provide depth and insight rather than as a quantitative forecast of the market nextyear. However, we believe that the trends reported here are real in terms of overall market sentiment and thedifferences between the five countries and the five categories of expenditure.
In addition to the main findings, the report also includes many more detailed results about particular combi-nations of country and category, about different types of product market and ownership, and about otherspecific topics (direct response advertising, sales promotion evaluation, direct mail outsourcing, whether themarketing function is represented at board level, and marketing metrics) together with qualitative commentsfrom respondents giving the reasons behind the trends. We believe it paints a detailed and accurate pictureof the state of the market in these top five countries in 3Q02.
The main trends for each country are brought together in Appendix A. Appendix B presents selected resultsfor 15 specific industrial sectors.
In Conclusion, the Top-Line Results of the Study are:
1. Total marketing expenditure for the five countries taken together is expected to be flat in 2002 (in cur-rent local currencies) with modest growth in 2003.
2. At an individual country level, the US, UK and France show moderate growth in 2002, increasing in2003. Japan shows continuing, gradual decline. Marketing expenditure in Germany is projected to besharply down in 2002 with little if any recovery in 2003.
3. Qualitative data suggest that changes in total marketing expenditure are largely driven by short-term factors, mainly market and economic conditions.
4. Within marketing budgets, there is a shift in resource allocation from media advertising and, to a lesserextent, sales promotion towards interactive marketing and direct mail.
5. Qualitative data on resource allocation suggest that this shift is driven by long-term factors and there-fore likely to continue.
Executive Summary 7

1.Aims and Method
8
Aims and Method 9
This study explores actual and planned expenditure on marketing by large and mid-sized businesses in the topfive global markets: USA, Japan, Germany, UK, France. Taken together, these five countries account for almosttwo-thirds of the world market for marketing and communication services.
The results are based on a survey of chief marketing officers in July/August 2002. They cover actual andplanned expenditure for the three years 2001-2003 on:
- media advertising (broadcast, press, posters, cinema)- sales promotion- direct mail- PR and sponsorship- interactive marketing.
The study was commissioned by Havas and directed by Patrick Barwise, Professor of Management andMarketing at London Business School, in collaboration with Alan Styler of EHS Brann. The survey data werecollected by Kudos Research and analyzed by Andy Lepki at Kudos and by Robyn Stevenson, Susan Dean andAdrian Clarke at LBS. Both Kudos and LBS are wholly independent of Havas.
There are already several annual and quarterly series published about marketing expenditure trends, especiallyadvertising. These are typically based either on confidential client data or on a simple quarterly survey ofwhether budgets are increasing, decreasing, or steady. The aim of this report is to complement these regularseries by exploring the trends in more depth. Specifically, this study:
• Covers all the main marketing/communication expenditure headings, not just advertising
• Uses independent market research based on a statistically representative sample
• Analyzes the results by country and by company size and characteristics where relevant
• Includes qualitative data from the same respondents, to give insight into the thinking behind the numbers,and help distinguish between long and short term trends
• Also includes results on more detailed trends in direct response advertising, how businesses evaluate salespromotions, outsourcing of direct mail activities, and marketing metrics.
The purpose of this study is to provide insight into how much and why businesses are allocating resources tomarketing as a whole and to specific types of marketing activity. It is not a forecast, but it is based on a largesample and the numbers for expenditure planned for 2003 can be taken as an indicator of the trends for nextyear, both overall and for specific countries and expenditure categories. It is not designed, however, as aquantitative forecast of marketing expenditure and should not be used as such.
This report is being published at a time of high market uncertainty and nervousness. An equivalent study lastyear (ie based on data collected in July-August 2001) would have been significantly affected by the impact of9/11 on the market. Even this year, stock prices and consumer confidence have declined since the data werecollected.
To check the impact of these recent shifts, we asked Kudos Research to call back 20% of the respondents ineach country in late October. The results of this callback (reported in Section 2) suggest that the impact ofcontinuing market uncertainty has been negative but limited. We therefore believe that the numbers in thisreport would have changed little if the data had been collected in October 2002 instead of July-August 2002.One possible exception is Germany where economic conditions have deteriorated over the last few months.

10 Aims and Method
Method
The data were collected via structured telephone interviews with chief marketing officers (eg marketing direc-tor, VP marketing) in July-August 2002. The target population was defined as businesses spending at least$1million (€1million) last year on marketing, ie the five activities listed above, within the particular country.Note that this excludes marketing expenditure by governments, political parties, and other not-for-profitorganizations. The sampling lists used were primarily based on leading national advertisers. “Expenditure”excludes in-house staff costs, equipment, overheads, and market research.
Usable responses were obtained from 727 businesses out of 1475 contacted, a response rate of 49.3% ([usable responses]/[refusals + usable responses]), split as follows:
USA 240Japan 122
Germany 120UK 124
France 121727
The interview covered the following items:
• Business demographics (industry sector, local/multinational, expenditure range)
• Total marketing expenditure trends (2002 vs 2001, 2003 vs 2002)
• Allocation of expenditure across the five categories (2001, 2002, 2003)
• % of media advertising allocated to direct response advertising (defined in Section 4.3) (2001, 2002, 2003)
• Formal evaluation/post-audit of sales promotions
• Whether direct mail execution and database management are mainly outsourced or conducted in-house
• Whether the marketing function is represented at board level
• Marketing metrics (current and planned)
Total marketing expenditure trends were explored using both qualitative and quantitative measures. The qua-litative measure asked whether expenditure was expected to increase, decrease, or stay unchanged year-on-year. This enables us to compute a standard “purchasing index” on a 0-to-100 scale, where 50 represents nonet change (see Section 2.1). The quantitative measures asked respondents to refine their responses, expres-sing them as a percentage increase or decrease. The expenditure data were all in current local currencies(USD, Yen, euro, GBP).
An important feature of the study is the collection and use of extensive qualitative data. Respondents wereasked to summarize the reasons behind the quantitative responses. These qualitative data are not only usefulfor interpreting the numbers but also for distinguishing which of the trends are likely to be short term andwhich long term.

Aims and Method 11

2.Total MarketingExpenditure
12

2.1 Changes in Total Expenditure
Table 2.1 and Figure 2.1 give the average % changes in total marketing expenditure for the five countries andthe whole sample.
To allow for the importance within the market of higher-spending businesses, the results have been weightedas follows:
Range (USD or euro) Weighting1m - 5m 1.05m - 10m 1.510m - 30m 2.0
30m+ 2.5
Two outliers (with year-on-year increases of over 400% due to one-off events/changes) have been excluded.
Fig 2.1: Year-on-Year % Change in Total Expenditure
The overall picture is of a more-or-less static market this year, with the decline in Germany roughly offset bygrowth in the UK, and with the other countries in between. The picture for next year is of modest growth,with only Japan still decreasing slightly.
These results are % changes in current local currencies. Table 2.2 shows the equivalent results expressed inconstant local currencies, ie adjusted for year-on-year changes in general consumer prices. (In Japan, consu-mer prices are falling, so the results in Table 2.2 appear slightly better than in Table 2.1).
Total Marketing Expenditure 13
Table 2.1: Year-on-Year % Change in Total Expenditure (Current local currencies)
Country 2002 vs 2001 2003 vs 2002 2003 vs 2001
USA (n = 237) + 2.0 + 4.4 + 6.5
Japan (n = 116) - 1.4 - 1.5 - 2.9
Germany (n = 104) - 4.5 + 1.3 - 3.4
UK (n = 120) + 4.2 + 5.3 + 9.7
France (n = 108) + 0 .3 + 5.1 + 5.4
Total (n = 685) + 0.6 + 3.3 + 3.9
-5
-3
-1
1
3
5
7
9
2002 vs 2001
2003 vs 2002
2003 vs 2001
USA (n = 237)Japan (n = 116)Germany (n = 104)UK (n = 120)France (n = 108)
% Change

These results are supported by the responses to the qualitative purchasing “diffusion index” questions whichasked whether total expenditure was expected to increase, decrease, or not change year-on-year. The index is1.0x (% saying “increase”) plus 0.5x (% saying “no change”). An index of 50 represents a stationary market,with an equal number saying “increase” and “decrease”. Table 2.3 shows the results. Again, the data suggest astatic market in 2002, with some improvement in 2003 in all countries except Japan.
Table 2.4 reports the results of the late October callbacks to 20% of the respondents in each country. In themain survey in July/August, these 145 respondents had given replies corresponding to diffusion indices of48.6 and 62.4 for 2001/02 and 2002/03, respectively (in both cases slightly lower than the July/Augustresponses for the whole sample of 727 respondents). At the time of the October callback, these had changedlittle, to 47.6 (01/02) and 60.6 (02/03). These results suggest that the impact of continuing market uncertaintyhas been negative but limited. We therefore believe that the numbers in this report would have changed littleif the data had been collected in October 2002 instead of July-August 2002.
14 Total Marketing Expenditure
Table 2.2: Year-on-Year % Change in Total Expenditure (Constant local currencies) (1)
(1) Consumer price changes from Oxford Economic Forecasting, Economic Outlook, 26,4 (July 2002)
Country 2002 vs 2001 2003 vs 2002 2003 vs 2001
USA (n = 237) - 0.2 + 2.5 + 2.3
Japan (n = 116) - 0.6 - 0.8 - 1.4
Germany (n = 104) - 6.4 - 0.1 - 6.6
UK (n = 120) + 2.2 + 3.2 + 5.5
France (n = 108) - 1.4 + 3.3 + 1.9
Total (n = 685) - 1.0 + 1.8 + 0.8
Table 2.3: Purchasing “Diffusion Index”
(1) (Increase %) x 1.0 plus (N/C %) x 0.5
Country 2002 - 2001 2003 - 2002 Diffusion Index (1)
Country Decr N/C Incr Decr N/C Incr
Country % % % % % % 01/02 02/03 Diff
USA (n = 240) 25 43 33 9 46 45 54 68 +14
Japan (n = 122) 30 54 16 26 60 14 43 44 +1
Germany (n = 120) 44 41 15 12 56 33 35 60 +25
UK (n = 124) 20 35 44 10 40 51 62 70 +8
France (n = 121) 32 39 29 8 51 40 48 66 +18
Total (n = 727) 29 42 28 12 50 38 50 63 +13
(1) (Increase %) x 1.0 plus (N/C %) x 0.5

Size, Ownership, and Sector Differences
Within our sample, mid-sized businesses with annual marketing expenditure in the range 1m-5m (USD oreuro) have tended to cut back this year, while larger businesses spending 5m-plus have not, on average.Conversely, the mid-sized firms are planning slightly above-average increases for 2003 (Table 2.5).
Table 2.5 also shows that it is the businesses owned by multinationals, not the local companies, that havebeen mainly cutting back.
In line with economic theory, firms selling infrequently purchased products/services are significantly morevolatile in their marketing expenditure than firms in frequently purchased categories such as consumer packaged goods (Table 2.6). The table also shows that there were no significant differences between business-to-business and business-to-consumer firms, nor between those selling products versus services.
Total Marketing Expenditure 15
2001 – 02 2002 – 03
Main Survey (1) Callback (2) Difference Main Survey (1) Callback (2) Difference
48.6 47.6 - 1.0 62.4 60.6 - 1.8
Table 2.4: Results of Callback Survey: “Diffusion Index” (n=145)
(1) July/August 2002 (2) 15-24 October 2002
Table 2.5: Year-on-Year % Change in Total Expenditure by Expenditure Range and Company Ownership (Current local currencies)
Size/Ownership 2002 vs 2001 2003 vs 2002 2003 vs 2001
Size (USD or euro)
1m – 5m (n = 335) - 2.4 + 4.0 + 1.6
5m + (n = 350) (1) + 2.0 + 2.8 + 3.5
Ownership
Multinational -1.0 + 2.6 + 1.9
Local (2) + 2.1 + 3.8 + 6.0
Total (n = 685) (1) + 0.6 + 3.3 + 3.9
(1) Weighted by size (2) 75% of revenue in the local country
Table 2.6: Year-on-Year % Change in Total Expenditure by Type of Product Market (Current local currencies)
Type of Product Market 2002 vs 2001 2003 vs 2002 2003 vs 2001
Low purchase frequency (n = 310) - 1.5 + 3.8 + 2.2
High purchase frequency (n = 315) + 2.8 + 2.9 + 5.8
B2B (n = 86) + 0.8 + 2.6 + 3.4
B2C (n = 539) + 0.6 + 3.5 + 4.1
Products (n = 350) + 0.7 + 3.7 + 4.4
Services (n = 275) + 0.6 + 3.0 + 3.6
Total (n = 685) + 0.6 + 3.3 + 3.9
2.2 Reasons Behind the Changes
Reasons for Budget Cuts
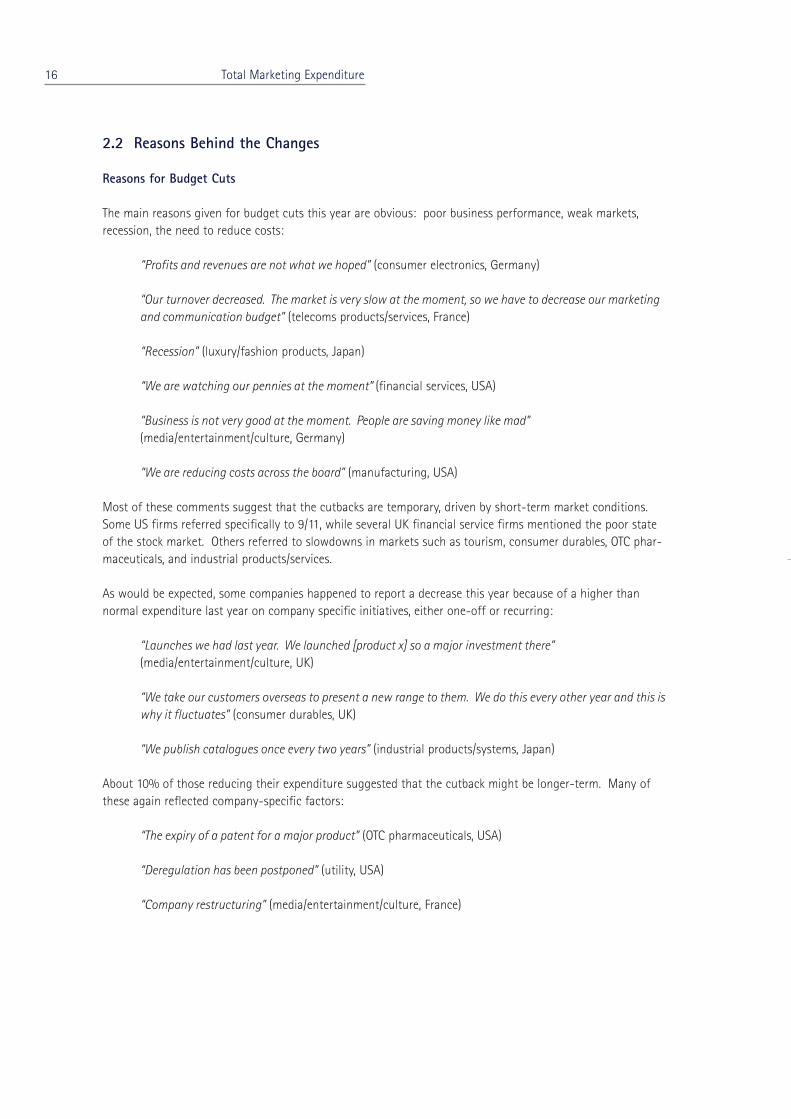
The main reasons given for budget cuts this year are obvious: poor business performance, weak markets,recession, the need to reduce costs:
“Profits and revenues are not what we hoped” (consumer electronics, Germany)
“Our turnover decreased. The market is very slow at the moment, so we have to decrease our marketingand communication budget” (telecoms products/services, France)
“Recession” (luxury/fashion products, Japan)
“We are watching our pennies at the moment” (financial services, USA)
“Business is not very good at the moment. People are saving money like mad”(media/entertainment/culture, Germany)
“We are reducing costs across the board” (manufacturing, USA)
Most of these comments suggest that the cutbacks are temporary, driven by short-term market conditions.Some US firms referred specifically to 9/11, while several UK financial service firms mentioned the poor stateof the stock market. Others referred to slowdowns in markets such as tourism, consumer durables, OTC phar-maceuticals, and industrial products/services.
As would be expected, some companies happened to report a decrease this year because of a higher thannormal expenditure last year on company specific initiatives, either one-off or recurring:
“Launches we had last year. We launched [product x] so a major investment there”(media/entertainment/culture, UK)
“We take our customers overseas to present a new range to them. We do this every other year and this iswhy it fluctuates” (consumer durables, UK)
“We publish catalogues once every two years” (industrial products/systems, Japan)
About 10% of those reducing their expenditure suggested that the cutback might be longer-term. Many ofthese again reflected company-specific factors:
“The expiry of a patent for a major product” (OTC pharmaceuticals, USA)
“Deregulation has been postponed” (utility, USA)
“Company restructuring” (media/entertainment/culture, France)
16 Total Marketing Expenditure

“Joint venture leading to rationalization” (automotive, Germany)
Some were ambiguous about whether marketing budgets might increase again later:
“At the moment we’re investing in improving and extending distribution rather than investing in promotion” (consumer electronics, Germany)
There were, however, a few responses which did suggest that the firm was cutting back more permanentlybecause of dissatisfaction with its previous marketing investments or simply because of the pressure on margins:
“We didn’t think we were spending wisely. We’re trying to be more effective with our funds, shifting fromtrade shows into more focused image building” (business services, USA)
“Our margins are being squeezed. We simply haven’t had the money ... Retailers put pressure on marginsso we’ve had to look at savings throughout the company” (importer/distributor, UK)
The overwhelming evidence from the qualitative data, however, is that the slowdown in marketing expenditureis temporary.
Reasons for Budget Increases
On the plus side, the main reasons for increased expenditure were that the company and/or the market weregrowing. Most of the upbeat comments for this year came from UK or US companies:
“Because of the growth in the business. We are advertising to help the growth but it is also coming fromour established customer base” (retail/mail order, UK)
“Organic business growth makes it a necessity” (business/industrial services, USA)
“We are growing so we are doing more public awareness and more branding”(consumer/retail financial services, USA)
Several French companies were also upbeat, suggesting that revenue and profit growth had provided thefunds to invest in marketing:
“Good results leading to increase in volumes, leading to more expenditures” (consumer/packaged goods,France)
“Profits increased, better results, so we’re spending more” (luxury/fashion products, France)
Some companies were actively seeking to drive the market:
“We anticipate a big increase in consumer demand. We need to maintain market leadership and maxi-mize share of voice and share of trade” (consumer/retail financial services, UK)
Total Marketing Expenditure 17
“Seeking to grow the business ... We’re a new company and the drive in sales links directly to the marketing spend” (consumer durables, UK)
“Because we’re driving certain brands” (consumer/packaged goods, UK)
“Investment in this segment. It’s the priority for the company” (consumer/packaged goods, France)
At least for this year, there were few general upbeat comments from Japan and none from Germany. In allfive countries, however, there were firms increasing their marketing expenditure in order to launch newbrands, products, line extensions, or outlets, or to increase brand awareness:
“Launching new brands” (luxury/fashion products, France)
“New product launches” (OTC pharmaceuticals, USA)
“Introducing new products, investing in restructuring the brand” (automotive, Germany)
“Because we’re opening new stores” (retail/mail order, USA)
“We will be doing more TV advertising and print also. We want to identify ourselves more in the market-place” (retail/mail order, UK)
“We feel it necessary to work on advertisements and PR to overcome the extensive competition nowa-days. We really need to keep the brand recognition and expand it even further” (consumer/packagedgoods, Japan)
“We are going to have more stores and we want to communicate more than in the past. We want ourbrand to be well known” (luxury/fashion products, France)
Two respondents in the hotels/tourism/leisure sector were increasing marketing expenditure in response to9/11:
“It’s a practical increase ... to tactically address September 11th” (hotels/tourism/leisure, UK)
Finally, several firms were increasing expenditure in order to invest more in specific marketing activities:
“We are spending more on subscription marketing and [trade] marketing” (media/entertainment/culture, USA)
“We’re focusing on direct response advertising” (healthcare, USA)
“We’ll do an increased direct mail program” (hotels/tourism/leisure, USA)
“More into radio advertising and more focus on web-based marketing”(media/entertainment/culture, USA)
18 Total Marketing Expenditure

The general tone of the comments about 2003 was more upbeat than for 2002. Many businesses anticipateda general market recovery and a reversal of current cuts:
“We anticipate that our expenditure will be back to the level it was last year” (consumer durables, UK)
“To get back to previous levels” (industrial products/systems, France)
“Just getting back to the level of last year” (consumer/retail financial services, US)
“I would like to see spending levels back up to levels seen in 2000” (consumer durables, US).
Total Marketing Expenditure 19

3.Allocatingthe MarketingBudget
20
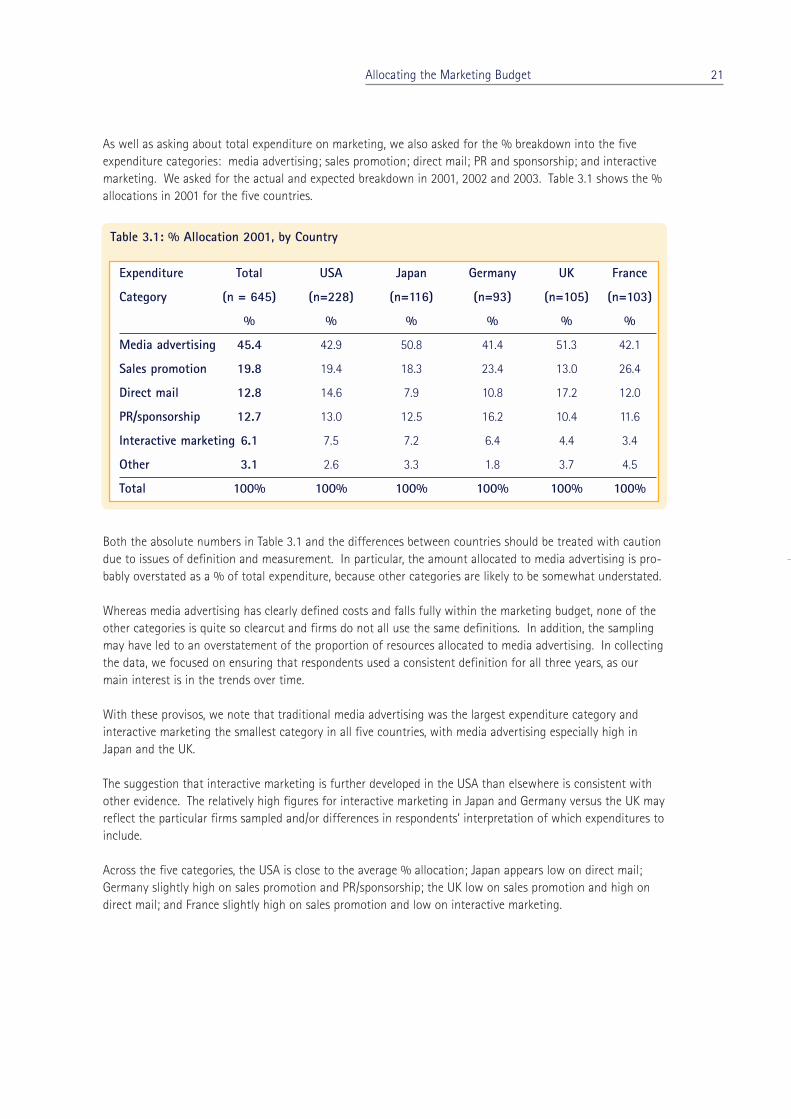
As well as asking about total expenditure on marketing, we also asked for the % breakdown into the fiveexpenditure categories: media advertising; sales promotion; direct mail; PR and sponsorship; and interactivemarketing. We asked for the actual and expected breakdown in 2001, 2002 and 2003. Table 3.1 shows the %allocations in 2001 for the five countries.
Both the absolute numbers in Table 3.1 and the differences between countries should be treated with cautiondue to issues of definition and measurement. In particular, the amount allocated to media advertising is pro-bably overstated as a % of total expenditure, because other categories are likely to be somewhat understated.
Whereas media advertising has clearly defined costs and falls fully within the marketing budget, none of theother categories is quite so clearcut and firms do not all use the same definitions. In addition, the samplingmay have led to an overstatement of the proportion of resources allocated to media advertising. In collectingthe data, we focused on ensuring that respondents used a consistent definition for all three years, as ourmain interest is in the trends over time.
With these provisos, we note that traditional media advertising was the largest expenditure category andinteractive marketing the smallest category in all five countries, with media advertising especially high inJapan and the UK.
The suggestion that interactive marketing is further developed in the USA than elsewhere is consistent withother evidence. The relatively high figures for interactive marketing in Japan and Germany versus the UK mayreflect the particular firms sampled and/or differences in respondents’ interpretation of which expenditures toinclude.
Across the five categories, the USA is close to the average % allocation; Japan appears low on direct mail;Germany slightly high on sales promotion and PR/sponsorship; the UK low on sales promotion and high ondirect mail; and France slightly high on sales promotion and low on interactive marketing.
Allocating the Marketing Budget 21
Table 3.1: % Allocation 2001, by Country
(1) Consumer price changes from Oxford Economic Forecasting Economic Outlook, 26,4 (July 2002)
Expenditure Total USA Japan Germany UK France
Category (n = 645) (n=228) (n=116) (n=93) (n=105) (n=103)
% % % % % %
Media advertising 45.4 42.9 50.8 41.4 51.3 42.1
Sales promotion 19.8 19.4 18.3 23.4 13.0 26.4
Direct mail 12.8 14.6 7.9 10.8 17.2 12.0
PR/sponsorship 12.7 13.0 12.5 16.2 10.4 11.6
Interactive marketing 6.1 7.5 7.2 6.4 4.4 3.4
Other 3.1 2.6 3.3 1.8 3.7 4.5
Total 100% 100% 100% 100% 100% 100%

Changes in % Allocations
Table 3.2 and Figure 3.1 show the actual and expected changes in % allocations over the three years for thetotal sample. The growth areas are interactive marketing (up from 6.1% to 7.0%) and direct mail (up from12.8% to 13.3%). The main reduction is in media advertising, down from 45.4% to 44.4%, despite a slightrecovery 2002-2003. Sales promotion is also down from 19.8% to 19.4% due to a loss in share in 2003. Theshare of PR and sponsorship is steady.
Fig 3.1: Changes in % Allocation (% points) 01/02, 02/03, 01/03
There were some differences between countries in the changes in % allocations (Table 3.3). Comparing theresults for each country with those in the Total column, the data suggest that, relative to other countries:
• In the USA, interactive marketing is rapidly gaining share and sales promotion and PR/sponsorshipare losing share.
• In Japan, direct mail is losing share and PR/sponsorship is gaining. Interactive marketing is gaining,in line with the general trend.
• In Germany, media advertising is significantly losing share while sales promotion and PR/sponsors-hip are gaining. Interactive marketing is barely gaining share.
• In the UK, both media advertising and PR/sponsorship are losing share while direct mail and inter-active marketing are gaining.
• In France, media advertising is gaining slightly, against the trend elsewhere, while sales promotion islosing and interactive marketing growing only slowly (from a base which is already lower than inthe other countries).
22 Allocating the Marketing Budget
Table 3.2: Changes in % Allocation 2001-2003 (Total five countries, n = 645)
(1) Consumer price changes from Oxford Economic Forecasting Economic Outlook, 26,4 (July 2002)
Expenditure 2001 2002 2003 Changes (% points)
Category % % % 01/02 02/03 01/03
Media advertising 45.4 44.2 44.4 - 1.2 + 0.2 - 1.0
Sales promotion 19.8 19.9 19.4 + 0.1 - 0.5 - 0.4
Direct mail 12.8 13.3 13.3 + 0.5 0 + 0.5
PR/sponsorship 12.7 12.9 12.8 + 0.2 - 0.1 + 0.1
Interactive marketing 6.1 6.5 7.0 + 0.4 + 0.5 + 0.9
Other 3.1 3.2 3.2 + 0.1 0 + 0.1
Total 100% 100% 100% 0 0 0
-1.5
-1.0
-0.5
0.0
0.5
1.0
1.5
2001 vs 2002
2002 vs 2003
2001 vs 2003
% Change
Media advertising
Sales promotion
Direct mail
PR/sponsoring
Interactive marketing

Allocating the Marketing Budget 23
Table 3.3: Changes in % allocation 2001-03 by Country (% points)
Expenditure Total USA Japan Germany UK France
Category (n = 645) (n = 228) (n = 116) (n = 93) (n = 105) (n = 103)
Media advertising - 1.2 - 1.0 - 0.3 - 2.5 - 2.4 0
Sales promotion + 0.1 + 0.1 - 0.1 +0.1 + 0.8 - 0.7
Direct mail + 0.5 + 0.4 - 0.1 + 0.4 + 1.5 - 0.1
PR/sponsorship + 0.2 - 0.3 + 0.4 + 1.8 - 1.0 + 0.4
Interactive mktg + 0.4 + 0.7 + 0.1 + 0.2 + 0.7 - 0.1
Media advertising +0.2 +0.4 - 0.3 + 0.2 - 0.2 + 0.6
Sales promotion - 0.5 - 1.0 - 0.3 + 0.6 - 0.7 - 0.5
Direct mail 0 + 0.1 - 0.1 - 0.2 + 0.3 + 0.1
PR/sponsorship - 0.1 - 0.3 + 0.1 - 0.6 + 0.2 0
Interactive mktg + 0.5 + 0.6 + 0.7 0 + 0.9 + 0.3
01/02
02/03
Media advertising - 1.0 - 0.6 - 0.6 - 2.3 - 2.6 + 0.6
Sales promotion - 0.4 - 0.9 - 0.4 + 0.7 + 0.1 - 1.2
Direct mail + 0.5 + 0.5 - 0.2 + 0.2 + 1.8 0
PR/sponsorship + 0.1 - 0.6 + 0.5 + 1.2 - 0.8 + 0.4
Interactive mktg + 0.9 + 1.3 + 0.8 + 0.2 + 1.6 + 0.2
01/03
4. MediaAdvertising
24 Media Advertising

(1) Using unrounded numbers, the more accurate estimate is a 0.3% decrease – the top left figure in Table 4.1.
In Sections 4-8, we combine the results from Section 2.1, on the changes in total marketing expenditure, andSection 3, on the % allocations in the three years, to give an indication of the implications for each expendi-ture category over the three years.
For instance, in Section 2.1, we reported that total marketing expenditure in the USA was expected to be up2.0% in 2002 versus 2001 (current USD, see Table 2.1). In Section 3, we reported that the % of this expendi-ture allocated to media advertising was 42.9% in 2001 (Table 3.1), falling by 1.0 percentage points in 2002(Table 3.3), ie to 41.9%. Combining these results, we can estimate that US expenditure on media advertisingwill change from 42.9% of 100 (taking 2001 total expenditure as 100) to 41.9% of 102.0, see Figure 4.1.
Figure 4.1: Change in US Media Advertising Expenditure 2001-02 (Current USD)
Numerically, 102.0 x (41.9/42.9) = 99.6, corresponding to a 0.4% decrease from 2001 to 2002. (1)
Using this method, we can estimate the year-on-year changes in expenditure for each of the five categoriesin each country (and for sectors and other company characteristics). Note that the results should be taken asindicative only: both the total expenditure and the % allocation are subject to sampling and measurementerrors, and the estimates here are based on a combination of these data. Nevertheless, the results do indicatethe general trends within each category.
Sections 4.1 and 4.2 present the numerical results for media advertising expenditure and the reasons givenfor increases/decreases in this expenditure. Section 4.3 gives the further analysis of direct response advertising as a % of total media advertising.
Media Advertising 25
2001
Totalexpenditure
100.0
Totalexpenditure
102.0
of which mediaadvertising 42.9%
2002
of which mediaadvertising 41.9%

4.1 Expenditure 2001-03
Table 4.1 and Figure 4.2 show the year-on-year % changes in expenditure on media advertising in the fivecountries, computed using the method outlined above. Media advertising includes TV, radio, press, posters,cinema and all production costs. Program sponsorship and product placement are also included. Classifiedadvertising and interactive advertising are excluded.
For the total market (ie these five countries taken together), 2002 is 2% down on 2001. The market looks setto recover next year, leaving it slightly ahead of 2001 (in current local currency terms). However, beneath thisare some marked differences between countries. In particular, the data confirm a large drop this year inGermany, with the other countries showing little change between 2001 and 2002. Next year sees clear, ifunspectacular, growth in the USA, UK, and France, with a partial recovery in Germany still leaving it nearly 9%down on 2001, while Japan continues to decline.
There were no significant differences in the results for firms with different types of product market (infre-quent vs frequent purchases, B2B vs B2C, products vs services).
Figure 4.2: Year-on-Year % Change in Media Advertising Expenditure (Current local currencies)
26 Media Advertising
Table 4.1: Year-on-Year % Change in Media Advertising Expenditure (Current local currencies)
Country 2002 vs 2001 2003 vs 2002 2003 vs 2001
USA (n = 228) - 0.3 +5.3 +5.0
Japan (n = 116) -2.0 -2.1 - 4.1
Germany (n = 93) -10.4 +1.8 - 8.8
UK (n = 105) -0.8 +4.8 +4.0
France (n = 103) +0.3 +6.6 +7.0
Total (n = 645) - 2.0 +3.6 +1.6
-11
-9
-7
-5
-3
-1
1
3
5
7
2002 vs 2001
2003 vs 2002
2003 vs 2001
USA (n = 228)Japan (n = 116)Germany (n = 93)UK (n = 105)France (n = 103)
% Change

4.2 Reasons for Increases/Decreases in Expenditure
Increases
The main reason for increases in the proportion of the total budget allocated to media advertising was thatthere were new aspects of the business to promote in the form of new products, new facilities or stores, newmarkets to enter or some other new initiative:
“This year the strategy is to use media advertising a lot for new products. It is faster communication andreally powerful” (consumer/packaged goods, France)
“More adverts because more products” (energy company, Germany)
“We are entering a new market and advertising to a larger audience, in particular via print”(utilities, US)
“Small increase in media advertising with new store opening” (retail/mail order, UK)
Continued brand building was another important reason:
“We need to communicate more to make our brand better known” (luxury/fashion products, France)
“Image improvements” (consumer durables, Germany)
“Continuing to put money above the line to address image problems of brand”(consumer/packaged goods, UK)
Improved economic conditions facilitating a larger budget justified the increased spend for a few, especiallyfor 2003:
“Because our marketing expenditure is economy led - a forecast recovery in domestic and world marketswill lead to increasing marketing expenditure, in line with a stronger economy” (retail/mail order, US)
“Hopefully the economic situation will improve” (consumer/packaged goods, US)
A few simply cited their long-term commitment to media advertising:
“As a company we totally believe in media advertising. We went against what our hearts said and followed our heads, but we’re going back to it” (consumer/packaged goods, UK)
Finally, some referred to improved value for money in media buying or performance:
“We have not tried a heavy media approach for a while. A lot of bargains available in media this year”(luxury/fashion products, US)
“We have received a good result from a radio ad” (retail/mail order, Japan)
“I believe media to be more effective, especially TV and billboards” (consumer/packaged goods, US)
Media Advertising 27

Decreases
At least for 2002, there were many more comments indicating decreases in media advertising allocation thanincreases, in line with the quantitative results. Allocation of budget to a different expenditure categoryaccounted for nearly half of the reasons given. The new categories being embraced are principally direct mailand interactive marketing, and the implication is that this shift will be long-term:
“Not working as well as direct marketing. We have sophisticated measuring tools and know it is notworking” (consumer durables, UK)
“We need to target more our customers for some products, we’re spending more on direct mail, buying adatabase to get the customers we want” (automotive, France)
“More focus on interactive online marketing. Importance of web media environment. Invest in those.It’s a strategic change where we’re looking for our customers” (media/entertainment/culture, UK)
“So we can fund more of the interactive side. It’s easier to reduce the media budget” (business/industrial services, US)
A perception of media advertising as ineffective and expensive was cited by many:
“There are better ways of reaching target groups more efficiently” (telecoms products/services,Germany)
“Mass media, mainly TV, has a limit to appeal to consumers individually” (consumer/packaged goods,Japan)
“It is very costly and not very accountable” (hotels/tourism/leisure, US)
“Don’t get value for money from it. We get a response but it’s not relative to spend. More profitabilityneeded, and profit from media advertising relative to spend is poor” (media/entertainment/culture, UK)
Continuing financial pressure causing reduced budgets affected nearly one fifth of those who commented,and particularly Japanese companies:
“Smaller budget available due to turnover in retail decreasing” (consumer/packaged goods, Germany)
“We want to save money and in our company this is done by cutting costs in media advertising” (tele-coms products/services, Germany)
“Because of recession there will be less budget this year” (industrial products/systems, Japan)
“That’s the biggest pool that we can take money out of” (automotive, US)
A few businesses reported one off, company-specific issues:
“We haven’t had a new product launch so this year was quiet. Also had a change of agency”(automotive, UK)
Overall, the reasons for a decreased proportion of the budget going to media advertising predominantly indica-ted a long-term change in resource allocation, with more resource going into direct and interactive marketing.
28 Media Advertising

4.3 Direct Response Advertising
The study also explored businesses’ use of direct response advertising (DRA) within their total media advertising expenditure. DRA was defined as:
“Advertising whose main purpose is to generate a specific and fairly immediate customer response suchas a direct order, a qualified sales lead, an information request, or a visit to a store or website. (It doesnot include classified ads.)”
Many advertisements involve a combination of long-term brand-building and short-term direct responsegeneration. We would argue that advertisers should almost always be clear which of the two is the mainobjective of the campaign, but not everyone would agree. Some campaigns could be categorized either way.
With this proviso, Table 4.2 shows the responses for the five countries in 2001. Looking first at the Totalcolumn:
• 93% of respondents used media advertising as part of their marketing activity in 2001
• Of this 93%, 63% (ie 59% of all respondents) used DRA
• Among those who used DRA, it accounted for 54% of their expenditure on media advertising
• Multiplying these last two figures (63% of advertisers each spending 54% on DRA) gives us anapproximate figure of 34% for the proportion of all advertising accounted for by DRA in 2001 inthese five markets (1)
Looking across Table 4.2, the striking feature is the huge variation between countries in both the % of adver-tisers who say they use DRA (75% for the USA vs only 22% for Japan) and, among those saying they useDRA, the % of advertising expenditure they allocate to it (75% for the UK vs only 26% for Japan). The effectis to create three groupings in terms of their overall use of DRA (approximate % of all advertising expenditure):
• The “Anglo-Saxon” markets: UK 54%, USA 43%
• The Continental Europe markets: France 29%, Germany 26%
• Japan: 6%
Media Advertising 29
(1) The 34% estimate is approximate not only because of the partly subjective definition of DRA but also because it assumes that the average advertising expenditure was the same among the 63% of advertisers who used DRA as amongthe other 37% who did not. In practice, this was roughly true. The proportion of mid-sized advertisers (total marketingexpenditure USD 1m-5m) using DRA was 65%, slightly higher than the 60% of larger advertisers who used DRA. In addition, those who used DRA allocated a slightly lower proportion of their total expenditure to media advertising thanthose who used advertising but not DRA (47% versus 49%). Taken together, these two factors suggest that the actualproportion of advertising accounted for by DRA was roughly 32% rather than the 34% in Table 4.2
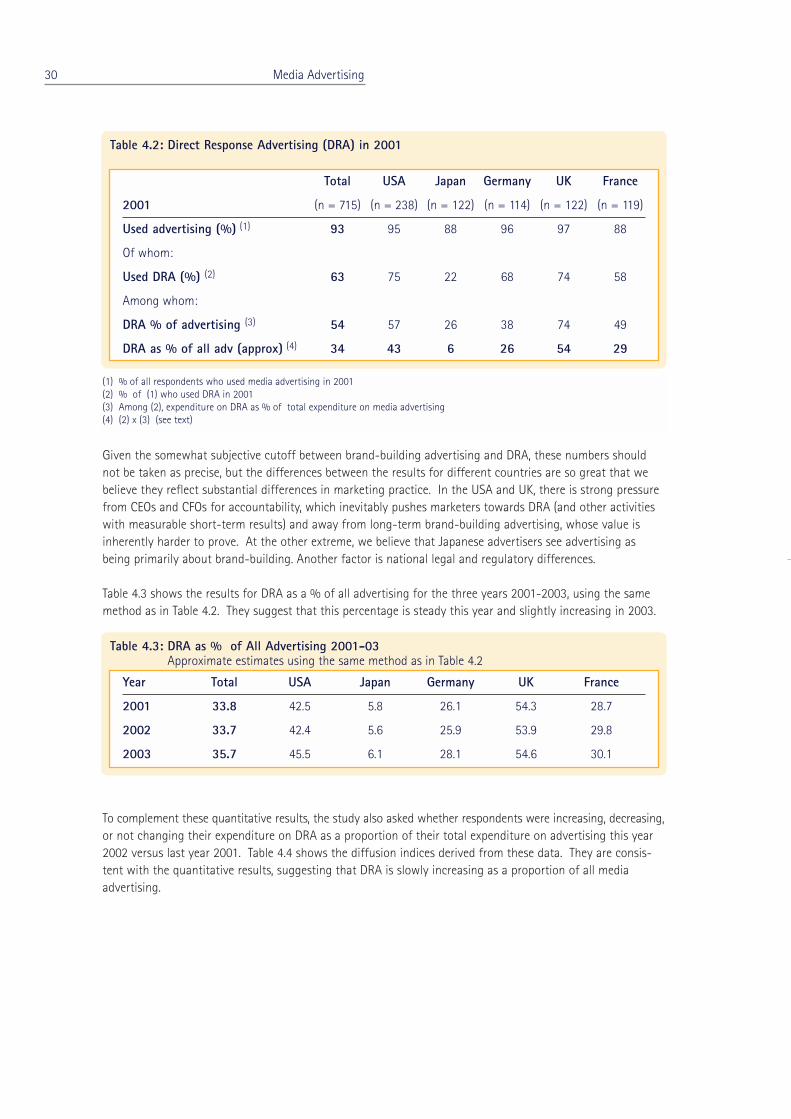
Given the somewhat subjective cutoff between brand-building advertising and DRA, these numbers shouldnot be taken as precise, but the differences between the results for different countries are so great that webelieve they reflect substantial differences in marketing practice. In the USA and UK, there is strong pressurefrom CEOs and CFOs for accountability, which inevitably pushes marketers towards DRA (and other activitieswith measurable short-term results) and away from long-term brand-building advertising, whose value isinherently harder to prove. At the other extreme, we believe that Japanese advertisers see advertising asbeing primarily about brand-building. Another factor is national legal and regulatory differences.
Table 4.3 shows the results for DRA as a % of all advertising for the three years 2001-2003, using the samemethod as in Table 4.2. They suggest that this percentage is steady this year and slightly increasing in 2003.
To complement these quantitative results, the study also asked whether respondents were increasing, decreasing,or not changing their expenditure on DRA as a proportion of their total expenditure on advertising this year2002 versus last year 2001. Table 4.4 shows the diffusion indices derived from these data. They are consis-tent with the quantitative results, suggesting that DRA is slowly increasing as a proportion of all mediaadvertising.
30 Media Advertising
Table 4.2: Direct Response Advertising (DRA) in 2001
Total USA Japan Germany UK France
2001 (n = 715) (n = 238) (n = 122) (n = 114) (n = 122) (n = 119)
Used advertising (%) (1) 93 95 88 96 97 88
Of whom:
Used DRA (%) (2) 63 75 22 68 74 58
Among whom:
DRA % of advertising (3) 54 57 26 38 74 49
DRA as % of all adv (approx) (4) 34 43 6 26 54 29
(1) % of all respondents who used media advertising in 2001(2) % of (1) who used DRA in 2001(3) Among (2), expenditure on DRA as % of total expenditure on media advertising(4) (2) x (3) (see text)
Table 4.3: DRA as % of All Advertising 2001-03Approximate estimates using the same method as in Table 4.2
Year Total USA Japan Germany UK France
2001 33.8 42.5 5.8 26.1 54.3 28.7
2002 33.7 42.4 5.6 25.9 53.9 29.8
2003 35.7 45.5 6.1 28.1 54.6 30.1
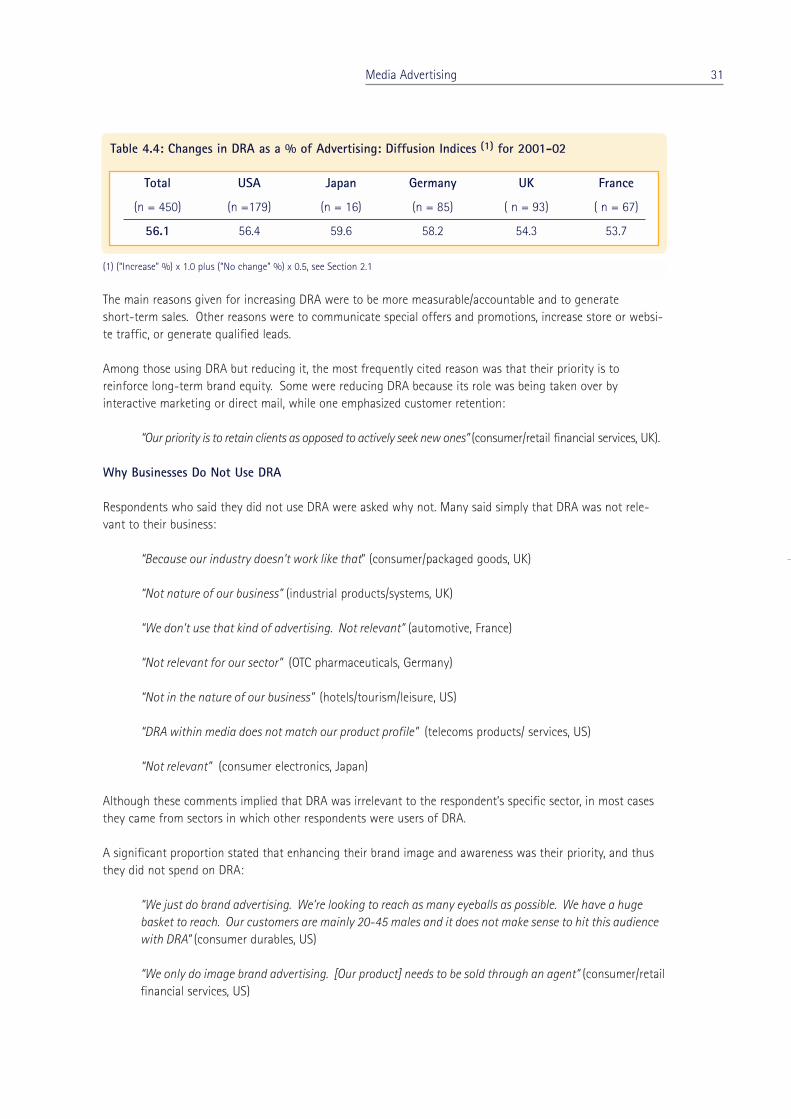
The main reasons given for increasing DRA were to be more measurable/accountable and to generate short-term sales. Other reasons were to communicate special offers and promotions, increase store or websi-te traffic, or generate qualified leads.
Among those using DRA but reducing it, the most frequently cited reason was that their priority is to reinforce long-term brand equity. Some were reducing DRA because its role was being taken over by interactive marketing or direct mail, while one emphasized customer retention:
“Our priority is to retain clients as opposed to actively seek new ones” (consumer/retail financial services, UK).
Why Businesses Do Not Use DRA
Respondents who said they did not use DRA were asked why not. Many said simply that DRA was not rele-vant to their business:
“Because our industry doesn’t work like that” (consumer/packaged goods, UK)
“Not nature of our business” (industrial products/systems, UK)
“We don’t use that kind of advertising. Not relevant” (automotive, France)
“Not relevant for our sector” (OTC pharmaceuticals, Germany)
“Not in the nature of our business” (hotels/tourism/leisure, US)
“DRA within media does not match our product profile” (telecoms products/ services, US)
“Not relevant” (consumer electronics, Japan)
Although these comments implied that DRA was irrelevant to the respondent’s specific sector, in most casesthey came from sectors in which other respondents were users of DRA.
A significant proportion stated that enhancing their brand image and awareness was their priority, and thusthey did not spend on DRA:
“We just do brand advertising. We’re looking to reach as many eyeballs as possible. We have a hugebasket to reach. Our customers are mainly 20-45 males and it does not make sense to hit this audiencewith DRA” (consumer durables, US)
“We only do image brand advertising. [Our product] needs to be sold through an agent” (consumer/retailfinancial services, US)
Media Advertising 31
Table 4.4: Changes in DRA as a % of Advertising: Diffusion Indices (1) for 2001-02
Total USA Japan Germany UK France
(n = 450) (n =179) (n = 16) (n = 85) ( n = 93) ( n = 67)
56.1 56.4 59.6 58.2 54.3 53.7
(1) (“Increase” %) x 1.0 plus (“No change” %) x 0.5, see Section 2.1

“We don’t think advertising is a way to generate sales, we use it only for brand awareness” (industrialproducts/systems, US)
“We only use classical TV advertising, image advertising” (consumer/packaged goods, US)
“It’s not our aim. Our brand image is really important” (luxury/fashion products, France)
“For us it’s more on brand” (automotive, UK)
“The types of campaigns are brand building and using creative media” (manufacturing, UK)
A similar number reasoned that DRA was inappropriate as they are B2B businesses and don’t sell direct to theconsumer:
“We don’t communicate with the external consumer. Just B2B” (consumer/retail financial services, UK)
“It is not our market. We only work with professionals not consumers” (telecoms products/services,France)
“We have a B2B approach so this is not relevant to our activity” (industrial products/systems, France)
“We do not approach end customers directly” (hotels/tourism/leisure, Germany)
“We don’t really sell direct to consumer, our customers are retailers” (luxury/fashion products, US)
“Our products do not involve ordinary consumers” (industrial products/systems, Japan)
Another group choose not to use DRA because they regard it as ineffective, too expensive or positively damaging:
“There is a limit to our consumers. Not so much effect by doing this” (consumer/packaged goods,Japan)
“Because we sell cheap food. It’s not been cost effective in the past. It doesn’t pay back when you’re sel-ling 50p foods” (consumer/packaged goods, UK)
“We think this kind of communication is not good for our brand image” (consumer durables, France)
“It does not work at all. French people do not answer to that kind of advertising” (consumer durables,France)
“It does not work for us” (consumer/retail financial services, Germany)
“So far I have not seen any valid methods that would justify spending money on DRA” (automotive,Germany)
“It’s costly, less direct, and less accountable” (business/industrial services, US)
32 Media Advertising

A few respondents gave lack of budget as a reason for not using DRA:
“Because of the size of our budget” (media/entertainment/culture, US)
“Due to lack of money” (consumer/packaged goods, UK)
“Our budget is too small for that kind of advertising” (consumer durables, France)
Finally, Japanese businesses were the only ones to state that DRA was not necessary to them because theyalready have relationships with all likely prospects:
“We know all the companies that exist in this field” (manufacturing, Japan)
“Not necessary because we have a list of all relevant companies” (industrial products/systems, Japan)
“Our consumers are locals who do their shopping very often with us” (retail/mail order, Japan)
“Not necessary at the moment. We deal on a personal basis” (consumer/retail financial services, Japan)
Media Advertising 33

5.SalesPromotion
34 Sales Promotion

5.1 Expenditure 2001-03
Table 5.1 and Figure 5.1 show the year-on-year % changes in expenditure on sales promotion, defined toinclude both trade and end-customer promotions, short-term/temporary price cuts, and partnership/affinityprograms. The methodology and layout are equivalent to Table 4.1 and Figure 4.2, but for this and the othersmaller categories the statistical base is more limited than for media advertising.
Figure 5.1: Year-on-Year % Change in Sales Promotion Expenditure
The total market shows virtually no growth in either year (in current local currency terms). The only largeyear-on-year change is a 10.7% increase in the UK this year, possibly an overstatement due to sampling.
There were some differences for firms in different types of product market, the main one being that B2B firmsare on average cutting back on sales promotions while B2C firms are not (Table 5.2).
Sales Promotion 35
Table 5.1: Year-on-Year % Change in Sales Promotion Expenditure (Current local currencies)
Country 2002 vs 2001 2003 vs 2002 2003 vs 2001
USA (n = 228) + 2.6 - 0.8 +1.8
Japan (n = 116) - 2.2 - 3.4 - 5.5
Germany (n = 93) - 4.0 + 4.1 0
UK (n = 105) +10.7 - 0.1 +10.6
France (n = 103) - 2.3 + 2.8 + 0.5
Total (n = 645) + 0.8 + 0.6 +1.4
-6
-4
-2
0
2
4
6
8
10
2002 vs 2001
2003 vs 2002
2003 vs 2001
USA (n = 228)Japan (n = 116)Germany (n = 93)UK (n = 105)France (n = 103)
% Change

5.2 Reasons for Increases/Decreases in Expenditure
IncreasesThe primary reason given for increased resource allocation to sales promotion was its demonstrable effective-ness. German companies were especially effusive about this category:
“Marketing through partnership with other companies. It is cost effective and brings good results”(hotels/tourism/leisure, US)
“We thought that parts of our budget are spent more wisely in below the line marketing”(consumer/packaged goods, Germany)
“More efficient way to reach customer” (consumer electronics, Germany)
“Value for money. More profitable. Can measure the profitability. It is more measurable than above theline. It is important to be able to measure performance and it’s much easier with sales promotion to seethe return” (media/entertainment/culture, UK)
Several others gave a variety of strategic reasons for the increase in proportion of the budget - an increasedfocus on sales, new initiatives, products and channels:
“Changes in philosophy, moving more money to the sales force again” (media/entertainment/culture,US)
“We are seeking a closer contact with the retail business. Retail is our number one customer and consumers number two. We are focusing on trade marketing” (consumer/packaged goods, Germany)
“Because we are now developing more brands, new brands, we need to invest more money on final on-site marketing” (luxury/fashion products, France)
“We have an additional sales channel (the other company that acquired us) and therefore more moneywill go into sales” (industrial products/systems, US)
36 Sales Promotion
Table 5.2: Year-on-Year % Change in Sales Promotion Expenditure by Type of Product Market
Type of Product Market 2002 vs 2001 2003 vs 2002 2003 vs 2001
Low purchase frequency (n = 299) - 0.9 + 2.2 + 1.2
High purchase frequency (n = 287) + 3.1 - 1.3 + 1.8
B2B (n = 80) - 1.3 - 1.8 - 3.0
B2C (n = 506) + 1.5 + 0.7 + 2.3
Products (n = 322) + 0.3 + 0.4 + 0.7
Services (n = 264) + 2.7 + 0.5 + 3.2
Total, incl other (n = 645) + 0.8 + 0.6 + 1.4

A few are spending more on sales promotion because they have reduced their spend in other areas - sometemporarily, some permanently:
“Smaller budget. Decrease in direct mail and interactive marketing. Therefore percentage of sales pro-motion increases” (automotive, Germany)
“Due to PR/events decrease” (leisure goods manufacturer, Japan)
Decreases
Many more companies gave reasons for a decrease in resource allocation to sales promotion than for anincrease.
The principal reason was that businesses are allocating this spend to other activities, predominantly to mediaadvertising and interactive marketing, but to other categories also:
“More effort given to TV campaign which explains decrease in other categories such as public relationsand sales promotion” (consumer/packaged goods, France)
“In order to invest more into media adverts we take it away from here” (telecoms products/services,Germany)
“To meet costs of interactive advertising” (industrial products/systems, US)
“A lot of our sales tools will go interactive, so it’s only logical to take this money from sales promotions”(industrial products/systems, US)
“Because we only have one pot to spend and if we spend more in one part we spend less in another[increased spend on PR]” (consumer durables, UK)
Several companies commented that they found sales promotion ineffective, or that they had no need for it.(There were more comments to this effect for 2002/2003 than for 2001/2002):
“In the current financial situation they are not effective” (hotels/tourism/leisure, US)
“A lot of our budget is in sales promotion and we find they don’t pay back particularly well in the currenteconomic situation” (consumer/packaged goods, US)
For several other businesses more general strategic issues came into play:
“Desire to drive longer term activities instead of short term gain” (industrial products/systems, US)
“Next year the strategy will change slightly to add value to brands and to reduce our dependence onprice promotion” (consumer/packaged goods, UK)
“Our strategy follows strengthening of marketing and communication. Generate greater demand thatdoesn’t need as much sales promotion anymore” (automotive, Germany)
“ New product launches” (consumer/ packaged goods, France)
Sales Promotion 37

5.3 Evaluating Sales Promotions
Respondents were asked whether they always (or usually) quantify the net impact of sales promotions onsales volume and on profits. Table 5.3 shows the results.
71% of respondents claimed that they always (or usually) quantify/post-audit the net impact of sales promo-tions on sales volume, while 59% claimed that they quantify the impact on profits. The outlier is Japan, withonly about half as many respondents as in the other countries claiming to post-audit their sales promotions.
As one might expect, larger businesses and businesses which were part of multinational corporations weresomewhat more likely to claim to quantify the impact on sales volume and profits, although the differencesare not dramatic (Table 5.4).
38 Sales Promotion
Table 5.3: Always (or Usually) Quantify/Post-Audit the Net Impact of Sales Promotions on Sales Volume and Profits
% Saying “Yes” Total USA Japan Germany UK France
Sales volume 71 78 35 82 75 70
Profits 59 58 33 70 65 66
Table 5.4: % Quantifying the Net Impact of Sales Promotions by Size and Ownership
% Saying “Yes” Total Marketing Expenditure Ownership(USD or euro)
1-5m 5-10m 10-30m 30m+ Multinational Local
Sales volume 71 70 68 77 73 73 69
Profits 59 53 57 71 68 60 58

There was also significant variation between industrial sectors (Table 5.5.):
Those claiming to post-audit their sales promotions were then asked whether they did this formally (eg using acomputerized measurement model) or in a more informal, ad hoc way. Table 5.6 shows the results by country.
Both for sales volume (57%) and for profits (62%), about 60% of those claiming to post-audit their sales pro-motions said they did this using a formal measurement model (or a mixture of formal and informal methods).Combining these responses with those in Table 5.3, 40% of all respondents claim to use formal methods topost-audit the impact of sales promotions on sales volume and as many as 37% for the impact on profits.These percentages vary widely between countries, from 17%-18% for Japan to around 50% for France.
Sales Promotion 39
Table 5.5: % Quantifying the Net Impact of Sales Promotions by Industrial Sector
Sector % Claiming to quantify the impact on:Sales volume Profits
Consumer durables (n = 48) 81 75
Business industrial services (n = 92) 80 70
Consumer/packaged goods (n = 35) 77 6
Luxury/fashion products (n = 64) 75 64
Consumer electronics (n = 27) 74 78
OTC pharmaceuticals (n = 23) 74 61
Consumer/retail financial services (n = 25) 72 56
Electronic products/systems (n = 59) 70 63
Hotels/tourism/leisure (n = 32) 69 62
Retail/mail order (n = 27) 63 44
Media/entertainment/culture (n = 36) 58 43
Telecoms products/services (n = 36) 56 42
Automotive (n = 51) 57 37
Total, incl Other (n = 647 incl. other) 71 59

Methods for evaluating sales promotions vary widely in their sophistication. For a valid assessment of the netimpact on short-term profits, one needs a combination of:
• A prediction of what sales and realized prices would have been without the promotion, after allowingfor both delayed purchases (due to customers waiting for the promotion) and accelerated purchases(due to customers stocking up at the promotional price).
• A valid estimate of the full incremental cost of the promotion itself and of the extra volume it generated.
This requires an advanced modeling and costing system available in few firms today. Most of those claiming to use formal methods to post-audit their sales promotions are likely using simplifying assumptions(including about longer-term effects too) to make decisions which are “roughly right”. The validity of theseassumptions will depend on the product category, eg purchase acceleration is a significant issue for detergents but not for impulse ice cream.
40 Sales Promotion
Table 5.6: % of Those Claiming to Post-Audit Sales Promotions Using a Formal Measurement Model
% Claiming to Use a Formal Total USA Japan Germany UK FranceMeasurement Model(or a Mixture)
As % of those claimingto post-audit promotions (1)
Sales volume 57 55 52 50 60 73Profits 62 63 52 50 64 72
As % of all respondents (2)
Sales volume 40 43 18 41 45 51Profits 37 37 17 35 42 48
(1) eg % of those claiming to post-audit net impact of sales volume who also claim to do this using a formal measurement model
(2) eg % of all respondents who claim to use a formal measurement model to post-audit net impact on sales promotions

Sales Promotion 41

6. Direct Mail
42 Direct Mail

6.1 Expenditure 2001-03
Table 6.1 and Figure 6.1 show the results for direct mail, including expenditure on mail packs and mailed leaflets/brochures: print, postage, and outsourced database management.
Figure 6.1: Year-on-Year % Change in Direct Mail Expenditure
The total market appears to be growing steadily, regardless of the general economic slowdown, driven by sub-stantial growth in the UK (especially this year, according to our respondents) and a strong performance in theUSA. Japan and, to a lesser extent, Germany are down. France is steady this year, growing again next year. Aswith sales promotion we believe the UK figure for 2002 may be overstated.
Growth is especially strong for frequently purchased goods/services and for firms in B2C markets (Table 6.2).
Direct Mail 43
-10
0
10
20
30
40
50
2002 vs 2001
2003 vs 2002
2003 vs 2001
USA (n = 228)Japan (n = 116)Germany (n = 93)UK (n = 105)France (n = 103)
% Change
Table 6.1: Year-on-Year % Change in Direct Mail Expenditure (Current local currencies)
Country 2002 vs 2001 2003 vs 2002 2003 vs 2001
USA (n = 228) +4.8 +4.9 +9.9
Japan (n = 116) -2.4 -2.5 -4.8
Germany (n = 93) -1.1 -0.9 -2.0
UK (n = 105) +13.3 +6.8 +21.0
France (n = 103) -0.3 +5.7 +5.4
Total (n = 645) + 3.8 +3.5 +7.4

6.2 Reasons for Increases/Decreases in Expenditure
Increases
As might be expected from the quantitative data, Japanese companies had little to say about allocating moreresources to direct mail. Of those who did make comments, the principal reason for increasing spend ondirect mail was its effectiveness - businesses cited its ability to show good returns, its speed, targeting andvalue for money. Businesses from Germany particularly emphasized its ability to address the consumerdirectly. Respondents in the automotive, hotels/tourism/leisure and consumer durable sectors gave the mostresponses of this type, suggesting that direct mail is particularly well suited to their marketing needs.
“DM working really well. We can see a direct return” (consumer durables, UK)
“Better ROI in direct mail” (automotive, US)
“It’s more cost effective and targeted compared to traditional marketing” (hotels/tourism/leisure, US)
“Now we want to target our customers more, we want to go to them and not wait for them to come tous” (consumer durables, France)
“It’s much cheaper to reach customers directly than publish in magazines and newspapers” (automotive,US)
“It’s the future. One-to-one marketing is increasing steadily, addressing the consumer directly” (automotive, Germany)
“We know our customers and therefore communicate better if we address them directly” (consumerelectronics, Germany)
Many companies gave strategic reasons for investing in direct mail - including a heavier emphasis on moretargeted marketing and promotion of new aspects of the business - new initiatives/products/markets:
“More emphasis on target marketing” (consumer/retail financial services, US)
“We are trying to get more targeted in our approaches. We can be much more efficient by generating
44 Direct Mail
Table 6.2: Year-on-Year Change in Direct Mail Expenditure by Type of Product Market
Type of Product Market 2002 vs 2001 2003 vs 2002 2003 vs 2001
Low purchase frequency (n = 299) +1.2 + 3.9 + 5.1
High purchase frequency (n = 287) + 6.6 + 3.7 +10.6
B2B (n = 80) - 1.0 + 4.4 + 3.4
B2C (n = 506) + 4.6 + 3.7 + 8.5
Products (n = 322) + 3.4 + 5.4 + 9.0
Services (n = 264) + 4.2 + 2.6 + 6.9
Total, incl Other (n = 645) + 3.8 + 3.5 + 7.4

leads for sales people“ (industrial products/systems, Germany)
“Driven by major campaigns with existing customers, so writing to them to replace their existing models.Also done some marketing to a new target group, company cars” (automotive, UK)
“Because of new audiences we have to reach that our sales force does not call on” (business services,US)
“More direct mail products. Basically advertising is first in line and then we use direct mail”(consumer/packaged goods, UK)
Just one company gave a reason related to 9/11:
“Because of consumer confidence. We stopped in 2001 because of the anthrax scare, we ‘ll start againthis year as the scare is beginning to subside” (manufacturer, US)
Decreases
Few businesses gave reasons for decreasing the proportion of their spend going to direct mail (reflecting thequantitative results). Most of those decreasing their spend were allocating it to another specific category ofthe marketing mix - usually interactive marketing or media advertising (split roughly 50/50):
“Because of the potential for sales on our website” (media/entertainment/culture, US)
“We want to switch more to the internet” (transport/travel, Germany)
“Slight decrease in this category due to expenditure from resource allocation model being moved toincrease [media ads]” (hotels/tourism/leisure, UK)
“To even out the budget [higher spend on media advertising]” (luxury/fashion products, France)
Some businesses also expressed dissatisfaction with the effectiveness of direct mail:
“We tested but were not satisfied with the outcome and decided to cut back and free our budget formore classical media advertising again” (luxury/fashion products, Germany)
“There is just too much clutter in that marketing channel” (media/entertainment/culture, US)
“Due to postage increases direct mailing has become less cost effective. Whereas you can accomplish alot more online for a lot less” (industrial products/ services, US)
One cited increased buying efficiency for the reduced spend:
“Tightening up on the wastage in direct mail, buying better, less spend due to better return from media”(consumer/retail financial services, UK)
Direct Mail 45

6.3 Outsourcing Direct Mail
Respondents were asked two questions about outsourcing direct mail: first, was most direct mail execution(preparing packs, etc) conducted inhouse or mostly outsourced; second, was the DM database managed/main-tained inhouse or outsourced.
On average, 55% said their direct mail execution was mostly outsourced (including 6% who said “a mixture”)and 32% said their DM database was outsourced (including 4% who said “a mixture). There was some, butnot dramatic, variation by country (Table 6.3) and annual marketing spend (Table 6.4).
There was also variation by sector (Table 6.5, note small sample sizes for some sectors). In particular, the topfive sectors in the table, all primarily B2C, tend to outsource DM execution and are also more likely than average to outsource their DM database. Among the sectors towards the bottom of the table (ie those thattend to conduct their DM execution in-house), retail/mail order includes a significant minority (38%) whooutsource their database.
46 Direct Mail
Table 6.3: Outsourcing Direct Mail by Country (%)(1)
Activity Total USA Japan Germany UK France
(n=529) (n=208) (n=56) (n=78) (n=97) (n=90)
DM execution 55 54 48 64 55 56
DM database 32 32 23 23 37 41
(1) % of respondents saying “outsourced” or “a mixture”
Table 6.4: Outsourcing Direct Mail by Annual Marketing/Communication Spend (USD/euro) (%)(1)
Activity Total 1-5m 5-10m 10-30m 30m+
(n=529) (n=261) (n=105) (n=91) (n=72)
DM execution 55 52 48 69 61
DM database 32 31 32 38 28
(1) % of respondents saying “outsourced” or “a mixture”

Direct Mail 47
Table 6.5: Outsourcing Direct Mail by Sector (%) (1)
Sector DM Execution Database
% %
Consumer electronics (n = 21) 76 41
Consumer/packaged goods (n = 56) 75 41
Automotive (n = 45) 69 49
Hotels/tourism/leisure (n = 29) 68 38
Consumer durables (n = 75) 68 38
Travel/transport (n = 21) 57 29
Electronic products/systems (n = 22) 55 14
Consumer/retail financial services (n = 62) 50 26
Telecoms products/services (n = 14) 50 6
Media/entertainment/culture (n = 56) 45 29
Industrial products/systems (n = 29) 45 26
OTC pharmaceuticals (n = 15) 40 32
Business/industrial services (n = 15) 40 20
Retail/mail order (n = 45) 36 38
Luxury/fashion products (n = 24) 33 33
Total, incl. Other (n = 529) 55 32
(1) % of respondents saying “outsourced” or “a mixture”

7. PR/sponsorship
48

7.1 Expenditure 2001-03
Results for PR/sponsorship are shown in Table 7.1 and Figure 7.1. This category includes events - exhibitions,trade shows, sport, etc - and event sponsorship, but not broadcast program sponsorship, which is includedunder media advertising (Section 4).
Figure 7.1: Year-on-Year % Change in PR/sponsorship Expenditure (current local currencies)
The data suggest marginal increases in the total market for PR/sponsorship in both years (in current local currencies). The differences in the results for different countries should be seen as indicative only: the effective statistical base within each country is limited for this and the other small expenditure categories.Nevertheless, there is a suggestion that PR/sponsorship in Germany may be up this year against a backgroundof a largely steady or declining PR/sponsorship market this year in the other countries, and despite a substantialreduction in total marketing expenditure in Germany. This may be a result of sampling.
Over the two years 01/02 and 02/03, there is little difference in the trend for companies selling infrequentlyversus frequently purchased goods/services, but B2B companies are tending to cut back on PR/sponsorshipthis year while planning to rebuild this expenditure in 2003. Also, companies selling services are more cautiousthan those selling products (Table 7.2).
PR/sponsorship 49
Table 7.1: Year-on-Year % Change in PR/sponsorship Expenditure (Current local currencies)
Country 2002 vs 2001 2003 vs 2002 2003 vs 2001
USA (n = 228) 0.0 +2.3 +2.3
Japan (n = 116) +2.0 -1.0 +1.0
Germany (n = 93) +6.1 -2.0 +4.0
UK (n = 105) -6.0 +7.8 +1.3
France (n = 103) +3.8 +5.0 +9.0
Total (n = 645) +1.8 +2.2 +4.0
-7
-5
-3
-1
1
3
5
7
9
2002 vs 2001
2003 vs 2002
2003 vs 2001
USA (n = 228)Japan (n = 116)Germany (n = 93)UK (n = 105)France (n = 103)
% Change

7.2 Reasons for Increases/Decreases in Expenditure
Increases
Businesses made few comments about reasons for increases or decreases, reflecting the quantitative figuresshowing that the proportion of expenditure allocated to this category remained relatively stable.
Among those who did comment, the main reason given for increased spend on PR/sponsorship is its effecti-veness and value for money:
“PR stunts and activities are more cost effective than media advertising for us” (hotels/tourism/leisure,UK)
“Better value for money. No problem to reach the target market” (consumer electronics, Germany)
“Through events better positioning in the market, more image, we can stand out from our competitors”(transport/travel, Germany)
“Particular success here, so we wish to continue” (consumer/packaged goods, US)
“More value for the price” (consumer durables, Japan)
A few businesses gave strategic reasons for increasing PR/sponsorship spend:
“Products need more explanation” (OTC pharmaceuticals, Germany)
“Direct contact with our customers. Keeping them would be our first priority in the present economiccircumstances” (industrial products/systems, US)
For some, spend was increased because there were exhibitions or trade fairs in the relevant year:
“We have just had two very big trade fairs where we have invested one third of our budget” (consumerelectronics, Germany)
“We have a huge exhibition this year and we have to siphon money off our media budget”(consumer/packaged goods, Germany)
50 PR/sponsorship
Table 7.2: Year-on-Year % Change in PR/sponsorship Expenditure by Type of Product Market(Current local currencies)
Type of Product Market 2002 vs 2001 2003 vs 2002 2003 vs 2001
Low purchase frequency (n = 299) +1.5 +2.9 +4.4
High purchase frequency (n = 287) +3.0 +1.3 +4.3
B2B (n = 80) -5.4 +4.6 -1.1
B2C (n = 506) +4.4 + 1.5 +6.0
Products (n = 322) +4.0 +3.0 +7.2
Services (n = 264) -0.3 +0.8 +0.4
Total (n = 645) +1.8 +2.2 +4.0

“There is a trade show this year” (automotive, Japan)
And a few cited relaxation of budget restrictions allowing an increase in spend:
“Spending more money in total” (business/industrial services, UK)
“We have to increase this category again after cutting it this year” (consumer/packaged goods,Germany)
Decreases
Those businesses that were decreasing their PR/sponsorship spend were mainly doing so to allocate it toother categories of the marcoms mix, evenly spread across direct mail, media advertising and interactive, witha couple allocating it to sales promotions:
“We do not think we reach customers with such activities. We’re focussing more on media advertisingagain” (industrial products/systems, Germany)
“We are cutting back here to increase direct mail” (media/entertainment/culture, US)
“We will still be working on them but reduce a little as we’ll increase on DM” (hotels/tourism/leisure,Japan)
The next most frequent explanation was that businesses regarded PR/sponsorship as ineffective and/or poorvalue for money:
“Trade shows are really expensive and don’t pay back that well. Out of $75,000 spent last year, you mayonly get 300 leads, 3 deals closed last year. Is that good?” (business/industrial services, US)
“PR will be reduced due to value for money factor” (retail/mail order, UK)
“Associated costs are making us move away from trade shows and go more into interactive marketing”(industrial products/systems, US)
A few justified reduced spend by poor business performance, or simply the fact that the event sponsorshipthat they were involved with had terminated:
“Overall budget cuts” (consumer electronics, Germany)
“We are going to finish sports sponsorship. Motorshow will end” (automotive, Japan)
PR/sponsorship 51

8.InteractiveMarketing
5252 Interactive Marketing

8.1 Expenditure 2001-03
We define interactive marketing to include internet advertising, marketing websites and extranets, email mar-keting, and new media (eg iDTV, wireless). Table 8.1 and Figure 8.1 give the results. Again, the results forindividual years and countries are indicative only because of their limited statistical base.
The results amplify the conclusion in Section 3 that interactive marketing is the main growth area within themarketing expenditure mix, driven largely by sustained growth in the USA and UK, and to a lesser extent bystrong growth in France expected next year.
By any normal standards, this is a very fast-growing area of marketing. There are two reasons why manycommentators remain skeptical. First, interactive marketing was overhyped during the internet bubble, espe-cially by B2C dotcoms based on optimistic internet advertising business models. Second, internet advertisingper se (banners, pop-ups, etc) may well be declining due to lower clickthrough rates (reflected in lower mediaprices to advertisers) and consumer resistance to some of the newer, more intrusive formats. However, manyfirms are investing in improved websites and extranets, and especially in permission-based email marketing,leading to continuing growth in internet marketing as a whole.
Increasingly, the focus is on customer retention and relationship marketing, rather than on using the internetmainly for new customer acquisition. In addition, some companies are starting to experiment with other newmedia, mostly wireless and iDTV.
There were no significant differences in the results for companies in different types of product market(high/low purchase frequency, B2B vs B2C, products vs services). The growth in interactive marketing seemsto be happening across all main sectors.
Interactive Marketing 53
Table 8.1: Year-on-Year % Change in Interactive Marketing Expenditure (Current local currencies)
Country 2002 vs 2001 2003 vs 2002 2003 vs 2001
USA (n = 228) +11.3 +12.7 +25.3
Japan (n = 116) -0.6 + 7.4 +6.8
Germany (n = 93) -2.2 + 1.5 -0.8
UK (n = 105) +19.7 +23.3 +47.5
France (n = 103) -2.3 +14.2 +11.6
Total (n = 645) +6.6 +11.7 +19.1

Figure 8.1: Year-on-Year % Change in Interactive Marketing Expenditure
8.2 Reasons for Increases/Decreases in Expenditure
Increases
More businesses gave reasons for their increased spend in this category than in any other. The overwhelmingnumber focus on interactive marketing’s effectiveness, accountability and value for money:
“A more cost effective method, better targeted. We’ll be able to deliver more timely and relevant infor-mation this way. We’re looking to expand on our website, email, perhaps video streaming as well”(consumer/retail financial services, UK)
“It’s an inexpensive and targeted way of reaching people” (hotels/tourism/leisure, US)
“It was only to provide information. However, it has begun to be able to do direct sales on the net”(consumer/retail financial services, Japan)
“The backbone of marketing was traditionally direct mail. Very expensive to produce. Now a reliableway to provide information online means saving millions of dollars on postage costs. We have a websiteand we mean to expand” (media/entertainment/culture, US)
Many are expanding and redesigning their websites or increasing their use of e-mail marketing:
“A lot of emphasis was put on e-commerce in the beginning. Then there was a drop. Now we are begin-ning to reinvest into e-business structure in terms of dealing with retailers. It’s going to help to savecosts in the long term” (automotive, US)
“[Marketing and distribution] will be rolled over to interactive channels” (transport/travel, Germany)
“A redesign of our website” (consumer/packaged goods, UK)
“We are looking at more email campaigns. We can hold email addresses. It’s a quicker, more cost effec-tive way” (consumer/retail financial services, US)
54 Interactive Marketing
-10
0
10
20
30
40
50
2002 vs 2001
2003 vs 2002
2003 vs 2001
USA (n = 228)Japan (n = 116)Germany (n = 93)UK (n = 105)France (n = 103)
% Change

A few see themselves as needing to catch up with the trend towards interactivity:
“We are behind in our interactive marketing” (hotels/tourism/leisure, US)
“We feel that we need to catch up with the recent trend. Almost everybody’s on the net. It also appealsto the younger generation” (luxury/fashion products, Japan)
“With interactive marketing the problem is that we’ve only just got into it. We’re in the process of learning what works and how to utilize this area. There will be an emphasis to grow steadily in thisarea. We can see internet marketing works for others” (specialist service business, US)
Many cited (with varying degrees of fervor) the opportunities that the increased market take-up of interactivetechnologies offer. These comments predominantly related to increased spend for the year 2003:
“A whole new world. New media source. A new way to contact frequent users of our products” (DIY products manufacturer, US)
“It’s the market of the future, a new channel leading to growth” (consumer/retail financial services,Germany)
“To reflect where people are picking up information. More people are going online” (media/entertain-ment/culture, UK)
“Every year there are more and more people who have access to a computer. May increase every yearlittle by little” (retail/mail order, Japan)
Decreases
Few are cutting back on interactive marketing, so few reasons for doing so were given. However, some feltthat it was inefficient and that its potential had been overblown:
“The euphoria from at first gave way to a disillusionment. High costs per head” (OTC pharmaceuticals,Germany)
“We did not get the return on investment or the response from customers we expected from the webbanners, chat rooms, sponsor portals through Yahoo! etc that we spent up. So we decided to put thatmoney somewhere else” (automotive, US)
A few needed to allocate their spend elsewhere, although it was not clear the extent to which this was a tem-porary or permanent trend:
“To compensate for extra spending on media and direct mail” (consumer/packaged goods, US)
“Promoting short term sales, it’s a difficult time for our sector” (consumer/packaged goods, Germany)
One company had managed to achieve the best of both worlds and was getting its interactive marketing forfree:
“We still do direct mail and interactive marketing but we don’t spend any money on it due to goodcooperation” (consumer electronics, Germany)
Interactive Marketing 55

9.Organizationaland MarketContext
5656 Organizational and Market Context

The main focus of this study (Sections 2-8) is on changes in companies’ total marketing expenditure and inhow this is allocated across the five categories, as well as the reasons behind these changes. In Sections 4-6,we also reported some further results on direct response advertising, evaluating sales promotions, and out-sourcing direct mail.
In this section, we briefly put the earlier results into the businesses’ organizational and market context:
• Is the marketing function represented at board level? (Section 9.1)
• Marketing metrics (Section 9.2)
• Respondents’ comments on market trends (Section 9.3)
9.1 Is the Marketing Function Represented at Board Level?
Table 9.1 shows that the marketing function is represented at board level in 68% of the businesses, rangingfrom 59% in the USA to 81% in the UK.
Marketing was slightly more likely to be represented on the boards of multinational corporation subsidiariesthan on those of local companies (70% vs 66%) but there was no systematic relationship with the absolutesize of the marketing budget.
Out of 15 industry sectors, 13 had between 62% and 77% of respondents saying that marketing was represented on the board. The only exceptions were industrial products/systems (51%, n = 41) andhotels/tourism/leisure (87%, n = 38).
9.2 Marketing Metrics
Respondents were asked which of a list of six metrics were regularly reported to the Board and for whichthere were plans to do so in the near future. Tables 9.2 and 9.3 show the results for each country.
Organizational and Market Context 57
Total USA Japan Germany UK France
(n = 726) (n = 240) (n = 122) (n = 120) (n = 114) (n = 120)
68 59 68 79 81 63
Table 9.1: Is Marketing Represented at Board Level? (%)

A majority of the businesses say they already regularly report most of these metrics to the Board, specificallymarket share (79%), perceived product/service quality (77%), customer loyalty/retention (64%), customer/seg-ment profitability (64%) and relative price (63%). As many as 40% even say they regularly reportactual/potential customer or segment lifetime value.
There is significant variation by country. The results for Germany are above average for all six metrics, andespecially for market share (97%) and relative price (84%). Those for Japan are all below the average, especiallymarket share (57%) and customer/segment profitability (40%). The USA and UK are fairly close to the average- the UK a bit lower - while France is a bit high on market share (90%) and customer/segment lifetime value(58%).
Reporting of all six metrics is expected to increase in the near future, especially customer loyalty/retention(from 64% to 72%) and customer/segment lifetime value (40% up to 48%).
Businesses owned by multinationals tend to use more of these metrics than local companies, as do very largebusinesses spending over USD/euro 30m on marketing each year (Table 9.4). For businesses spending less thanthis, there was no relationship between annual expenditure and the use of metrics.
58 Organizational and Market Context
Table 9.2: Current Metrics Regularly Reported to the Board(% of those mentioning any now or planned)
Metric Total USA Japan Germany UK France
(n = 697) (n = 224) (n = 117) (n = 120) (n = 120) (n = 116)
Market share 79 73 57 97 80 90
Perceived prod/serv quality 77 77 68 84 71 75
Customer loyalty/retention 64 67 56 69 58 65
Customer/segment profitability 64 73 40 74 65 59
Relative price 63 65 48 84 53 63
Actual/potential LTV(1) 40 32 35 51 32 58
Average 64 64 51 77 60 68
(1) Customer or segment lifetime value
Table 9.3: Current or Planned Metrics to be Regularly Reported to the Board(% of those mentioning any now or planned)
Metric Total USA Japan Germany UK France
(n = 697) (n = 224) (n = 117) (n = 120) (n = 120) (n = 116)
Market share 81 75 60 98 84 96
Perceived product/service quality 79 79 68 88 82 79
Customer loyalty/retention 72 79 62 78 68 70
Customer/segment profitability 69 78 44 82 71 63
Relative price 66 66 50 84 60 69
Actual/potential LTV(1) 48 42 39 58 48 62
Average 69 70 54 81 69 73
(1) Customer or segment lifetime value

9.3 Respondents’ Comments on Market Trends
Finally, respondents were asked what they felt were the major trends in marketing in their sector and country.
The strongest trend by far was the role of new media, especially the internet, but also to a lesser extent SMS.New media were frequently mentioned along with interactive and/or personalized marketing. They were alsoreferred to in conjunction with cost-saving/efficiency drives:
“More on internet. Everybody is on the web, lower costs flexible to change. You can reach more people”(consumer/retail financial services, US)
“Eventually we will be increasing internet advertising. Our consumers used to come to the shop and lookthrough the window in old times, however now they require information from the internet and expect tobe focused before they come in” (other, Japan)
“Internet, email, electronic media will rise” (consumer electronics, Germany)
“To improve internet utilization for mailing direct” (consumer durables, France)
“The internet and other forms are getting a greater share. People are experimenting more. For example,text messaging is becoming more prevalent “ (consumer/packaged goods, UK)
“The interactive side will eventually take off and elements of the more traditional side will deteriorate.There’ll be more interaction with [consumers] as it’s a lot easier to talk to a customer via a website”(media/entertainment/culture, UK)
“The major trend is marketing interactively. We’re going for micro-marketing” (industrial products/systems,France)
Organizational and Market Context 59
Table 9.4: Current Metrics Regularly Reported to the Board by MarketingExpenditure and Ownership (% of those mentioning any now or planned).
Metric Marketing Expend (USD/€) Ownership
Total 1-5m 5-10m 10-30m 30m+ MNC Local(1)
(n = 697) (n=340) (n=140) (n=128) (n=89) (n=371) (n=326)
Market share 79 74 76 86 92 88 68
Perceived product/service quality 77 76 70 74 83 77 74
Customer loyalty/retention 64 61 64 63 76 65 62
Customer/segment profitability 64 63 64 62 71 64 63
Relative price 63 66 56 62 66 68 59
Actual/potential LTV(1) 40 38 41 39 47 43 36
Average 64 63 62 64 73 67 60
(1) Local: ≥ 75% of revenue generated in that country

There was, however, some concern about the failure of new media to deliver their earlier promises:
“We still need to learn how to make most of internet advertising, so it’ll probably continue to grow”(media/entertainment/culture, US)
Direct mail was the second most common trend reported, both on and offline:
“Increase in direct mail because of fragmentation of all other media. Direct mail gives you a 100% targetof potential customers” (automotive, US)
“Direct marketing will increase in all areas of B2B and B2C” (transport/travel, Germany)
“Far more direct marketing because it reduces cost and improves the sales response. In terms of salesperformance you can measure the impact of the marketing expenditure” (consumer/retail financial services, UK)
The rise of branding over general product marketing was a third common theme:
“Trend towards brand. There will be only branded or cheap” (consumer/packaged goods, Germany)
“More brand experience marketing” (consumer/packaged goods, UK)
“The mass popularization of brand names” (industrial products/systems, US)
Related to the comments on new media and interactive marketing, many also mentioned segmentation anddatabase management:
“More segmentation that I would define as micro-markets. Database management enables us to be veryprecise about our marketing” (industrial products/systems, US)
“Database management more aimed at specific customers” (transport/travel, Germany)
“Making sure the quality of your database is really good” (business/industrial services, US)
Sales promotion activities and point of sale marketing also received significant support:
“Sales promotion is getting stronger than others” (automotive, Japan)
“Strong support for our sales personnel which is reflected in our sales promotion budget” (OTC pharma-ceutical, Germany)
“More and more operational marketing (sales, display, shop demonstration) promotional campaign inshops so we get short term results” (business/industrial services, France)
All these items had regular support and little or no opposition. Looking at the strongest of the above trends,namely new media, direct mail and interactive, support did vary both by industry and by country.Consumer/packaged goods, media/entertainment/culture and consumer/retail financial services were the keenest supporters, as was the US as a whole. Japan however showed little interest in these areas and wasthe keenest on the role of TV advertising, which received the strongest specific support of the traditionalmedia:
60 Organizational and Market Context

“TV advertising, simply because it’s effective and the best” (OTC pharmaceuticals, Japan)
“TV adverts for increasing the profile” (telecoms products/services, Japan)
“TV advertising is still very strong for us, people want to see your product” (retail/mail order, US)
“The big trend is using TV and press communication” (consumer durables, France)
There were however some negative comments about TV (and similarly for other traditional media):
“The cost of TV advertising is going up so we get less for our money” (automotive, US)
“People are moving away from television and looking for alternatives” (media/entertainment/culture, UK)
Respondents were also asked whether the trends in their sector differed from those in other sectors in theircountry. Most felt that the main trends applied across their own and most other sectors, but some felt thattheir sector was different. For instance, some felt that their sector had been especially badly hit by recession:
“Yes because of the economics of the industry. It’s been hit pretty hard compared to most other sectors”(media, entertainment, culture, US)
“Of course yes. This crisis is only for [sector x] companies” (transport/travel, France)
The impact of regulation on the particular industry was also mentioned often:
“Yes because of the restraint caused by the laws on [this sector]” (consumer/packaged goods, France)
“Because of [product Y] marketing laws in France” (luxury/fashion products, France)
“Regulatory restrictions make it more difficult to promote our products than in more straightforwardindustry sectors” (consumer/packaged goods, US)
Some felt that their industry was more ‘conservative’ than others. There was not a great deal of agreementacross industries about this, but some of the individual responses are interesting:
“Everyone else is obsessed with trying to make their companies seem younger” (luxury/fashion products, UK)
“I think most of the sectors favor direct communication (internet etc) and direct mailing. Not us “ (trans-port/travel, France)
“Other sectors are not stifled by a lack of open competition. They can compete on the basis of innovationand differentiation “ (utilities, US)
“We don’t follow the fashion “ (other, Japan)
In contrast, some US and UK businesses saw themselves as being from industries that were less conservativethan the others:
“I reckon other sectors are more traditional in the way they advertise” (consumer/packaged goods, US)
Organizational and Market Context 61

“We are a bit more interactively oriented industry than the rest “ (industrial products/systems, US)
“Yes because we’re more customer focused “ (media/entertainment/culture, UK)
Some respondents however took the view that the trends in their sector were common across industries, butthere was no agreement as to what the trends would be:
“Yes there would be an increased use of direct marketing. People will try to measure the effect of theiradvertising spend and marketing budgets” (consumer/retail financial services, UK)
“Yes any form of productive business is going to the internet “ (hotels/tourism/leisure, US)
“Yes the trend is static or slightly down because of world recession” (consumer durables, UK)
“Yes I suppose the competition is for all sectors so all sectors must use a lot of media advertising”(consumer/packaged goods, France)
62

63

10.Conclusions
64 Conclusions

The overall conclusion of this report is that marketing expenditure in the top five global markets is likely to bemore-or-less static this year with a modest recovery in 2003. This conclusion is based on data collected inJuly/August 2002 but a follow-up call to 20% of the respondents in late October showed that their expecta-tions had changed little up to that point.
This conclusion is reinforced both by the “purchasing diffusion index” data (which ask whether firms plan toincrease, decrease, or not change their expenditure level) and by the many qualitative comments collected.The overwhelming majority of reasons given for cutbacks suggest that they are a temporary response to cur-rent financial and market conditions.
Underneath the general pattern, there are large differences between countries. These were reported in Table 2.1and Figure 2.1, reproduced here:
Fig 10.1: Year-on-Year % Change in Total Expenditure
Conclusions 65
-6
-4
-2
0
2
4
6
8
10
12
2002 vs 2001
2003 vs 2002
2003 vs 2001
USA (n = 237)Japan (n = 116)Germany (n = 104)UK (n = 120)France (n = 108)
% Change
Table 10.1: Year-on-Year % Change in Total Expenditure (Current local currencies)
Country 2002 vs 2001 2003 vs 2002 2003 vs 2001
USA (n = 237) + 2.0 + 4.4 + 6.5
Japan (n = 116) - 1.4 - 1.5 - 2.9
Germany (n = 104) - 4.5 + 1.3 - 3.4
UK (n = 120) + 4.2 + 5.3 + 9.7
France (n = 108) + 0.3 + 5.1 + 5.4
Total (n = 685) + 0.6 + 3.3 + 3.9

In the UK, USA, and France, a static or growing market in 2002 is followed by clear growth in 2003, leavingthese markets 5%-10% up over the two years (in current local currencies). In contrast, Germany is expectedto be sharply down in 2002 with little if any recovery in 2003 and Japan is expected to decline slightly in bothyears.
Within these expenditures, we are also seeing shifts in the proportion of resources allocated to each main category of marketing activity (Figure 3.1, reproduced as Figure 10.2). The main winner is interactive marketing,increasing from 6.1% of total expenditure in 2001 to 7.0% in 2003. Direct mail is the other category gainingshare (12.8% in 2001, 13.3% in 2003). The main loser is traditional media advertising (down from 45.4% to44.4% over the two years), followed by sales promotion (19.8% down to 19.4%). The share of PR/sponsorshipis roughly steady at around 12.8%.
Fig 10.2: Changes in % Allocation
In Sections 4-8 we combined the results for total expenditure and how it is allocated to show the implica-tions for each of the five categories. The main results for the total market are summarized in Table 10.2 (basedon the Total results in Tables 4.1, 5.1, 6.1, 7.1, and 8.1).
The qualitative comments make it clear that, unlike the cutbacks in total expenditure, the shifts in resourceallocation towards interactive marketing and direct mail appear to be permanent.
This study is designed to provide depth and insight rather than as a quantitative forecast of the market nextyear. We believe, however, that the trends reported here are real in terms of overall market sentiment and thedifferences between the five countries and the five categories.
66 Conclusions
-1.5
-1.0
-0.5
0.0
0.5
1.0
1.5
2001 vs 2002
2002 vs 2003
2001 vs 2003
% Change
Media advertising
Sales promotion
Direct mail
PR/sponsoring
Interactive marketing
Table 10.2: Year-on-Year % Change in Expenditure, by Category (current local currencies)
Category 2001 % of total 2002 vs 2001 2003 vs 2002 2003 vs 2001
Media advertising 45.4 -2.0 +3.6 +1.6
Sales promotion 19.8 +0.8 +0.6 +1.4
Direct mail 12.8 +3.8 +3.5 +7.4
PR/sponsorship 12.7 +1.8 +2.2 +4.0
Interactive marketing 6.1 +6.6 +11.7 +19.1
Total (incl. other) 100% +.06 +3.3 +3.9

In addition, the report includes many more detailed results about particular combinations of country andcategory, about different types of product market and ownership, and about other specific topics (directresponse advertising, sales promotion evaluation, direct mail outsourcing, whether the marketing function isrepresented at board level, and marketing metrics) together with qualitative comments from respondentsgiving the reasons behind the trends. We believe it paints a detailed and accurate picture of the state of themarket in these top five countries in 3Q02.
The main trends for each country are brought together in Appendix A. Selected results for 15 specific indus-trial sectors are presented in Appendix B.
In Conclusion, the Top-Line Results of the Study are:
1. Total marketing expenditure for the five countries taken together is expected to be flat in 2002 (in cur-rent local currencies) with modest growth in 2003.
2. At an individual country level, the US, UK and France show moderate growth in 2002, increasing in2003. Japan shows continuing, gradual decline. Marketing expenditure in Germany is projected to besharply down in 2002 with little if any recovery in 2003.
3. Qualitative data suggest that changes in total marketing expenditure are largely driven by short-term factors, mainly market and economic conditions.
4. Within marketing budgets, there is a shift in resource allocation from media advertising and, to a lesserextent, sales promotion towards interactive marketing and direct mail.
5. Qualitative data on resource allocation suggest that this shift is driven by long-term factors and there-fore likely to continue.
Conclusions 67
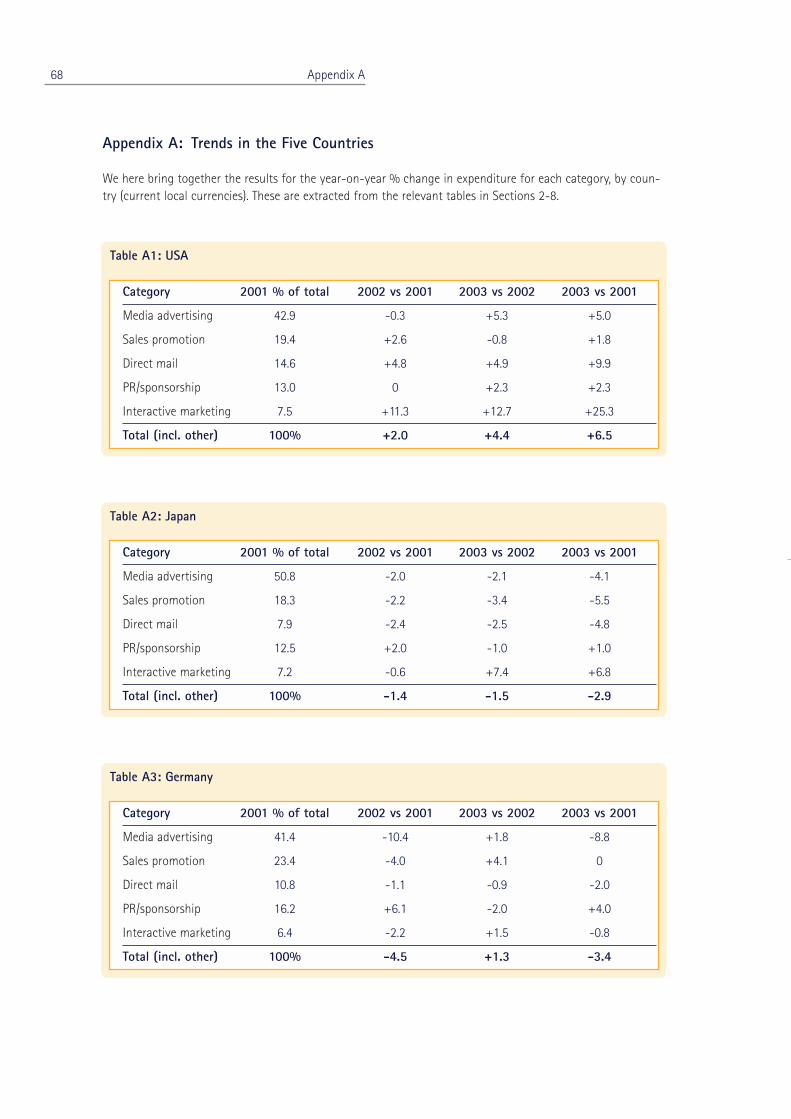
Appendix A: Trends in the Five Countries
We here bring together the results for the year-on-year % change in expenditure for each category, by coun-try (current local currencies). These are extracted from the relevant tables in Sections 2-8.
68 Appendix A
Table A1: USA
Category 2001 % of total 2002 vs 2001 2003 vs 2002 2003 vs 2001
Media advertising 42.9 -0.3 +5.3 +5.0
Sales promotion 19.4 +2.6 -0.8 +1.8
Direct mail 14.6 +4.8 +4.9 +9.9
PR/sponsorship 13.0 0 +2.3 +2.3
Interactive marketing 7.5 +11.3 +12.7 +25.3
Total (incl. other) 100% +2.0 +4.4 +6.5
Table A2: Japan
Category 2001 % of total 2002 vs 2001 2003 vs 2002 2003 vs 2001
Media advertising 50.8 -2.0 -2.1 -4.1
Sales promotion 18.3 -2.2 -3.4 -5.5
Direct mail 7.9 -2.4 -2.5 -4.8
PR/sponsorship 12.5 +2.0 -1.0 +1.0
Interactive marketing 7.2 -0.6 +7.4 +6.8
Total (incl. other) 100% -1.4 -1.5 -2.9
Table A3: Germany
Category 2001 % of total 2002 vs 2001 2003 vs 2002 2003 vs 2001
Media advertising 41.4 -10.4 +1.8 -8.8
Sales promotion 23.4 -4.0 +4.1 0
Direct mail 10.8 -1.1 -0.9 -2.0
PR/sponsorship 16.2 +6.1 -2.0 +4.0
Interactive marketing 6.4 -2.2 +1.5 -0.8
Total (incl. other) 100% -4.5 +1.3 -3.4
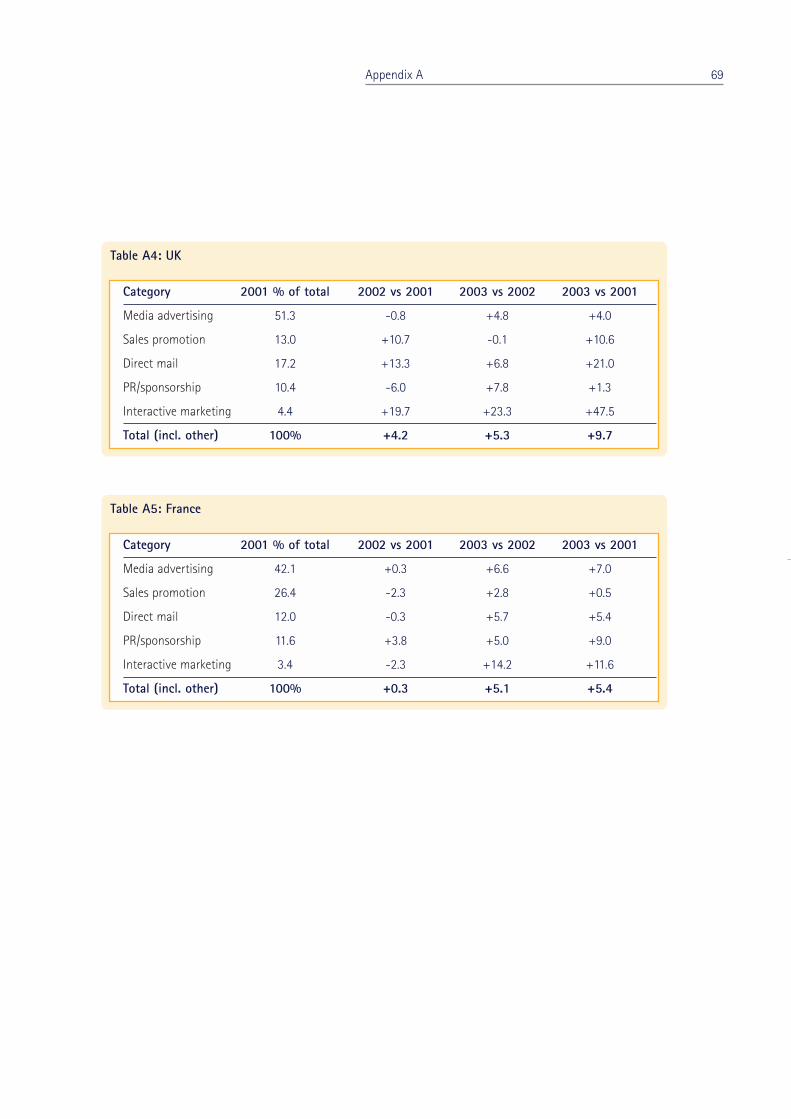
Appendix A 69
Table A4: UK
Category 2001 % of total 2002 vs 2001 2003 vs 2002 2003 vs 2001
Media advertising 51.3 -0.8 +4.8 +4.0
Sales promotion 13.0 +10.7 -0.1 +10.6
Direct mail 17.2 +13.3 +6.8 +21.0
PR/sponsorship 10.4 -6.0 +7.8 +1.3
Interactive marketing 4.4 +19.7 +23.3 +47.5
Total (incl. other) 100% +4.2 +5.3 +9.7
Table A5: France
Category 2001 % of total 2002 vs 2001 2003 vs 2002 2003 vs 2001
Media advertising 42.1 +0.3 +6.6 +7.0
Sales promotion 26.4 -2.3 +2.8 +0.5
Direct mail 12.0 -0.3 +5.7 +5.4
PR/sponsorship 11.6 +3.8 +5.0 +9.0
Interactive marketing 3.4 -2.3 +14.2 +11.6
Total (incl. other) 100% +0.3 +5.1 +5.4

Appendix B: Industry Sector Trends
70 Appendix B
Table B1: Automotive (n = 45)
Category 2001 % of total 2002 vs 2001 2003 vs 2002 2003 vs 2001
Media advertising 50.8 -9.9 +10.8 -0.2
Sales promotion 18.1 +3.7 +8.7 +12.7
Direct mail 10.4 +10.9 +11.1 +23.2
PR/sponsorship 12.5 +20.0 -5.4 +13.5
Interactive marketing 5.0 +14.0 +14.8 +30.8
Total (incl. other) 100% -0.1 +8.0 +7.9
Table B2: Business/Industrial services (n = 18)
Category 2001 % of total 2002 vs 2001 2003 vs 2002 2003 vs 2001
Media advertising 34.8 -7.8 -5.0 -21.9
Sales promotion 14.1 -6.6 -9.0 -15.1
Direct mail 19.6 -12.9 -0.2 -13.1
PR/sponsorship 18.9 -14.4 -5.9 -19.5
Interactive marketing 10 -0.7 -6.5 -7.1
Total (incl. other) 100% -5.0 -5.0 -13.4
Table B3: Consumer electronics (n = 26)
Category 2001 % of total 2002 vs 2001 2003 vs 2002 2003 vs 2001
Media advertising 43.3 -22.1 +1.3 -21.1
Sales promotion 19.7 -16.7 +16.7 -2.8
Direct mail 8.7 -10.5 +0.3 -10.2
PR/sponsorship 17.0 +17.1 0 +17.1
Interactive marketing 7.4 -14.7 +5.0 -10.4
Total (incl. other) 100% -12.4 +3.9 -9.0

Appendix B 71
Table B4: Consumer packaged goods (n = 87)
Category 2001 % of total 2002 vs 2001 2003 vs 2002 2003 vs 2001
Media advertising 48.9 +3.2 +7.6 +11.0
Sales promotion 31.6 +0.4 -0.9 -0.5
Direct mail 3.2 +11.9 +25.8 +40.8
PR/sponsorship 10.6 +5.5 +6.1 +12.0
Interactive marketing 4.0 +7.4 +13.8 +22.3
Total (incl. other) 100% +3.0 +5.4 +8.6
Table B5: Consumer/retail financial services (n = 69)
Category 2001 % of total 2002 vs 2001 2003 vs 2002 2003 vs 2001
Media advertising 47.4 -2.3 +7.1 +4.6
Sales promotion 13.7 +2.3 +5.9 +8.3
Direct mail 15.7 +10.4 +8.2 +19.5
PR/sponsorship 9.9 +9.5 +1.7 +11.4
Interactive marketing 7.0 -0.5 +15.9 +15.4
Total (incl. other) 100% +3.0 +7.3 9.5
Table B6: Hotels/tourism/leisure (n = 35)
Category 2001 % of total 2002 vs 2001 2003 vs 2002 2003 vs 2001
Media advertising 50.0 +4.2 +1.1 +5.3
Sales promotion 16.7 +1.7 +6.2 +8.1
Direct mail 14.0 +7.5 +4.9 +12.8
PR/sponsorship 9.9 -2.0 +3.4 +1.4
Interactive marketing 7.0 +6.2 +14.4 +21.5
Total (incl. other) 100% +3.7 +3.7 +7.5
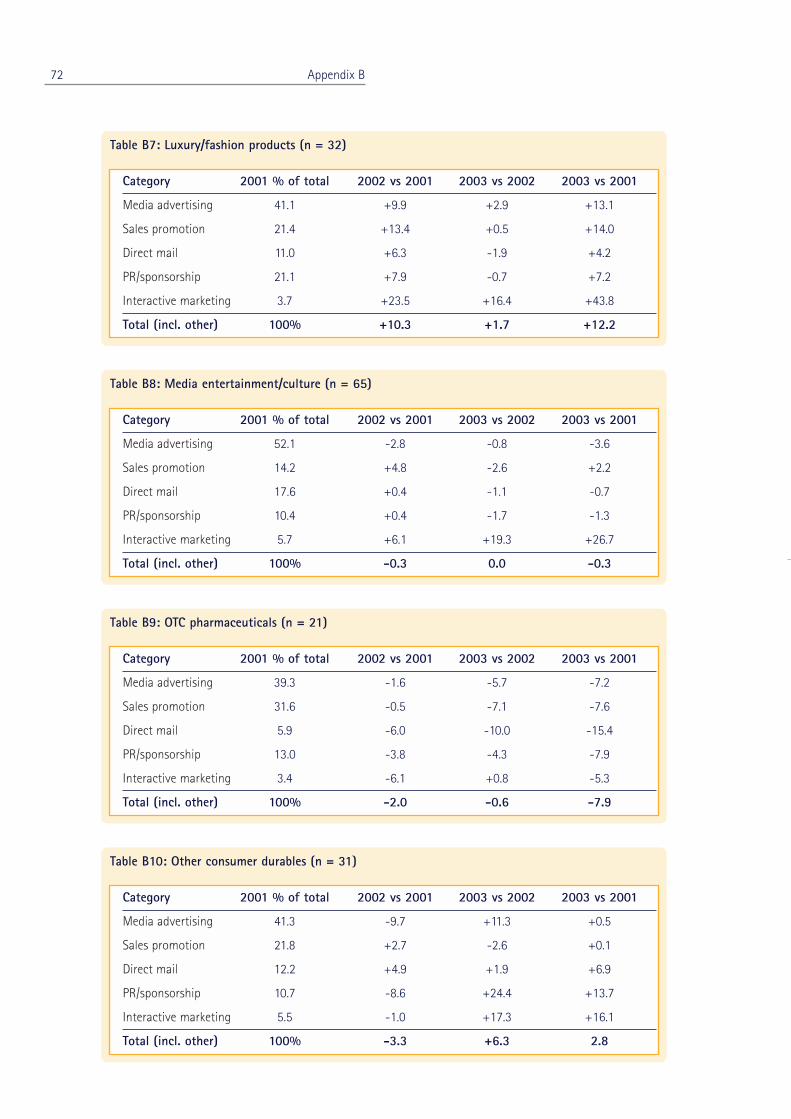
72 Appendix B
Table B7: Luxury/fashion products (n = 32)
Category 2001 % of total 2002 vs 2001 2003 vs 2002 2003 vs 2001
Media advertising 41.1 +9.9 +2.9 +13.1
Sales promotion 21.4 +13.4 +0.5 +14.0
Direct mail 11.0 +6.3 -1.9 +4.2
PR/sponsorship 21.1 +7.9 -0.7 +7.2
Interactive marketing 3.7 +23.5 +16.4 +43.8
Total (incl. other) 100% +10.3 +1.7 +12.2
Table B8: Media entertainment/culture (n = 65)
Category 2001 % of total 2002 vs 2001 2003 vs 2002 2003 vs 2001
Media advertising 52.1 -2.8 -0.8 -3.6
Sales promotion 14.2 +4.8 -2.6 +2.2
Direct mail 17.6 +0.4 -1.1 -0.7
PR/sponsorship 10.4 +0.4 -1.7 -1.3
Interactive marketing 5.7 +6.1 +19.3 +26.7
Total (incl. other) 100% -0.3 0.0 -0.3
Table B9: OTC pharmaceuticals (n = 21)
Category 2001 % of total 2002 vs 2001 2003 vs 2002 2003 vs 2001
Media advertising 39.3 -1.6 -5.7 -7.2
Sales promotion 31.6 -0.5 -7.1 -7.6
Direct mail 5.9 -6.0 -10.0 -15.4
PR/sponsorship 13.0 -3.8 -4.3 -7.9
Interactive marketing 3.4 -6.1 +0.8 -5.3
Total (incl. other) 100% -2.0 -0.6 -7.9
Table B10: Other consumer durables (n = 31)
Category 2001 % of total 2002 vs 2001 2003 vs 2002 2003 vs 2001
Media advertising 41.3 -9.7 +11.3 +0.5
Sales promotion 21.8 +2.7 -2.6 +0.1
Direct mail 12.2 +4.9 +1.9 +6.9
PR/sponsorship 10.7 -8.6 +24.4 +13.7
Interactive marketing 5.5 -1.0 +17.3 +16.1
Total (incl. other) 100% -3.3 +6.3 2.8
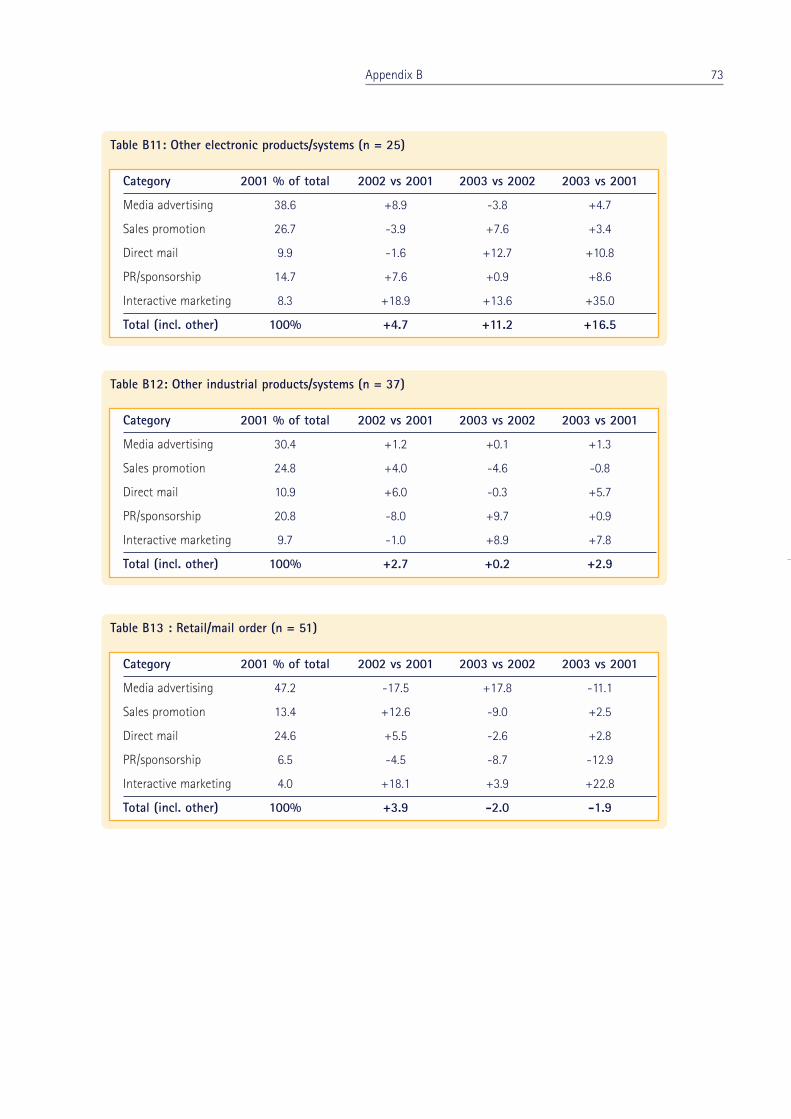
Appendix B 73
Table B11: Other electronic products/systems (n = 25)
Category 2001 % of total 2002 vs 2001 2003 vs 2002 2003 vs 2001
Media advertising 38.6 +8.9 -3.8 +4.7
Sales promotion 26.7 -3.9 +7.6 +3.4
Direct mail 9.9 -1.6 +12.7 +10.8
PR/sponsorship 14.7 +7.6 +0.9 +8.6
Interactive marketing 8.3 +18.9 +13.6 +35.0
Total (incl. other) 100% +4.7 +11.2 +16.5
Table B12: Other industrial products/systems (n = 37)
Category 2001 % of total 2002 vs 2001 2003 vs 2002 2003 vs 2001
Media advertising 30.4 +1.2 +0.1 +1.3
Sales promotion 24.8 +4.0 -4.6 -0.8
Direct mail 10.9 +6.0 -0.3 +5.7
PR/sponsorship 20.8 -8.0 +9.7 +0.9
Interactive marketing 9.7 -1.0 +8.9 +7.8
Total (incl. other) 100% +2.7 +0.2 +2.9
Table B13 : Retail/mail order (n = 51)
Category 2001 % of total 2002 vs 2001 2003 vs 2002 2003 vs 2001
Media advertising 47.2 -17.5 +17.8 -11.1
Sales promotion 13.4 +12.6 -9.0 +2.5
Direct mail 24.6 +5.5 -2.6 +2.8
PR/sponsorship 6.5 -4.5 -8.7 -12.9
Interactive marketing 4.0 +18.1 +3.9 +22.8
Total (incl. other) 100% +3.9 -2.0 -1.9

74 Appendix B
Table B14: Telecoms products/services (n = 17)
Category 2001 % of total 2002 vs 2001 2003 vs 2002 2003 vs 2001
Media advertising 37.7 -17.5 +7.8 -11.1
Sales promotion 16.1 -21.4 +2.8 -19.2
Direct mail 14.2 -13.4 +6.9 -7.4
PR/sponsorship 18.9 -19.4 +6.9 -13.8
Interactive marketing 11.8 -10.6 +9.4 -2.2
Total (incl. other) 100% -16.8 +6.9 -11.1
Table B15: Travel/transport (n = 21)
Category 2001 % of total 2002 vs 2001 2003 vs 2002 2003 vs 2001
Media advertising 49.8 -2.6 -0.1 -2.7
Sales promotion 17.5 -1.5 +0.9 -0.6
Direct mail 18.9 -2.1 -4.1 -6.2
PR/sponsorship 7.3 -15.5 +21.5 +2.6
Interactive marketing 6.4 +4.4 +23.4 +28.8
Total (incl. other) 100% -2.8 +2.2 -0.6
Table B16: Other (including utilities) (n = 65)
Category 2001 % of total 2002 vs 2001 2003 vs 2002 2003 vs 2001
Media advertising 45.4 -2.2 +1.1 -1.1
Sales promotion 16.8 -2.6 +2.4 -0.3
Direct mail 10.0 +3.8 +1.6 +5.4
PR/sponsorship 14.3 +2.9 -2.6 +0.2
Interactive marketing 7.0 +16.6 +8.6 +26.7
Total (incl. other) 100% -0.7 +2.1 +1.3

75

About the Authors
Patrick Barwise - London Business School
Patrick Barwise is Professor of Management and Marketing and Chairman of the Future Media ResearchProgramme at London Business School. He joined LBS in 1976 having spent his early career with IBM. Hismany publications include books on Television and its Audience, Accounting for Brands, Strategic Decisions,Predictions: Media (www.predictionsmedia.com), and Advertising in a Recession; a Harvard Business Reviewarticle Must Finance and Strategy Clash?; and numerous academic papers and practitioner articles, mostly onbrands, consumer/audience behavior, and new media. Most of his current research is about consumerresponse to digital technology and the implications for consumer marketing. Publications in this area includereports, articles, and book chapters on Permission-Based Mobile Advertising; Marketing and the Internet(www.marketingandtheinternet.com); TV, PC or Mobile?: Future Media for Consumer e-Commerce; Business.eu:Corporates vs Web Start-ups; and Consumer Responses to iDTV. Patrick Barwise also writes an occasionalcolumn for FT Creative Business on marketing, new media, and broadcasting policy.
Alan Styler – EHS Brann
Alan Styler is Strategy and Marketing Director at EHS Brann, the largest direct marketing agency in the UKand part of the Havas group. He began his marketing career in 1984 with the Sears retail conglomeratewhere he was responsible for retail format and store development strategy. Having gained further experienceworking in marketing consultancy he has spent the last ten years with the agency. Here he has worked withblue-chip clients, including Unilever, DHL, UDV, Microsoft, Cadbury Trebor Bassett, HSBC and British Airways.His experience has been gained in the UK, Continental Europe and North America where he has worked withclients, spoken at conferences and published articles on marketing strategy and relationship marketing.
76

London Business School, Havas, and Kudos Research
London Business School (www.london.edu)
Founded in 1965, London Business School is the University of London’s graduate school of business andmanagement, based in Regent’s Park in central London. Its mission is to generate important new ideas, knowledge and skills that will transform management practice; to create and execute learning opportunitiesfor current and future leaders and managers that will transform their futures; and to communicate its intellectual capital worldwide. It has 93 full-time faculty from 23 countries, 70% from outside the UK. 81nationalities are represented on the 2002 intake of full-time MBAs and the School has more than 15,000alumni in more than 100 countries. The School’s location in London, a global capital of business, finance,media, technology and culture, is a unique asset in the realization of its mission.
Havas (www.havas.com)
Havas (Euronext Paris: HAV.PA; Nasdaq: HAVS) is the world’s sixth largest communications group*.Headquartered in Paris, Havas has three principal operating divisions: Euro RSCG Worldwide which is headquartered in New York, Arnold Worldwide Partners in Boston, and Media Planning Group in Barcelona. A multicultural and decentralized group, Havas is present in over 65 countries through its networks of agencies located in more than 45 countries and contractual affiliations with agencies in over 20 additionalcountries. The Group offers a broad range of communications services, including traditional advertising,direct marketing, media planning and buying, corporate communications, sales promotion, design, humanresources, sports marketing, multimedia interactive communications and public relations. Havas employsapproximately 18,700 people.* Advertising Age Annual Agency Report ranking, April 22, 2002
Kudos Research (www.kudosresearch.com)
Kudos Research is one of the world’s leading international business data collection and analysis agencies.Interviewing around the world from the heart of London, Kudos is the invisible power feeding data toresearch organizations, management consultancies and multinational institutions and corporations. Clientsinclude Research International, Accenture, ABN AMRO and Xerox. In business to business research, Kudos setsthe standard for innovative solutions to data capture covering every language and every continent.
77

© London Business School and Havas 2002
Regent’s ParkLondon NW14SA - EnglandTel. +44 (0)20 7262 5050Fax +44 (0)20 7724 7875www.london.edu
84, rue de Villiers92683 Levallois-Perret CedexTel. +33 (0)1 41 34 30 00Fax +33 (0)1 41 34 12 48www.havas.com