MARKET WATCH - Infield Systems Ltd...The Subsea Well Intervention Market Report provides an in-depth...
16
The Subsea Well Intervenon Market Report provides an in-depth review of the market, including: a comprehensive analysis of data derived from Infield Systems’ detailed demand model for global and regional well intervenon and discussion about the impact of current industry trends, the latest technologies and availability of vessels and equipment. The well intervenon acvies of key operators are also examined, specifically, the way in which they are helping to shape global well intervenon demand. Infield Systems’ Subsea Well intervenon report to 2019 discusses the potenal requirement for intervenon services and analyses the driving factors behind the well intervenon market by applying a probability based model across the global mass of subsea wells. REPORT CONTENTS MARKET WATCH • Execuve Summary / Macro Market / Introducon - provides a brief history of key well intervenon acvies, along with details of the report methodology, an overview of the market sector from a macro perspecve and market survey informaon. • Well Intervenon Demand - Global & Regional Overview provides a detailed global and regional (Africa, Asia, Australasia, Europe, Lan America, Middle East & Caspian and North America) forecast for well intervenon and highlights the potenal growth in the use of well intervenon soluons. This secon provides analysis of current market dynamics and presents demand forecasts by: region/country, water depth, operator (current strategies & future projects) and by intervenon category and type. The number of subsea wells on-stream and operaonal wells are also analysed. • Well Intervenon Vessel Supply & Equipment - provides a fleet supply analysis and profiles the currently operaonal and forecast newbuild assets. This secon also examines vessel market cross over opportunity, equipment requirements and provides an assessment of the vessels capable of serving the industry. The key relaonships that exist between selected vessel operators and intervenon equipment providers are also highlighted. • Vessel Day Rate Analysis - assesses day rates by work scope, based on the recognion that some vessels are not used solely for well intervenon related acvies. The day rates provided in this secon are based on Infields’ Vessel Acvity Log, which includes data on the type of acvity in which each vessel is engaged, as well as supply and demand indicators which influence the level of ulisaon. Informaon about selected vessel contracts and availability is also presented. Many major operators sll do not have established subsea intervenon policies. This is, however, slowly changing as an increasing number of operators have begun to embrace the need for more regular intervenons on their growing porolios of subsea wells. Nonetheless, organisaonal structures and incenves for conducng intervenons typically remain insufficiently aligned to support full adopon of regular subsea intervenon programmes across global wellstocks. With the aging installed base of around 5,500 subsea wells at year-end 2014 set to surpass 7,000 by 2019, operators are exhibing a growing interest in improved recovery rates from exisng and future subsea wells. With a substanal gap in recovery rates between subsea and plaorm wells of between 25% and 40%, cost-efficient well intervenon soluons are increasingly in demand. Island Offshore (North Sea RLWI Alliance) and Helix Well Ops connue to lead the market for dedicated subsea well intervenon services. These two players have established strong track records and connue to hold the largest share of long-term contracts. However, a number of other companies such as Norshore are now also targeng the market – a market that has previously witnessed many failed aempts at market entry for a wide variety of reasons. An online survey was conducted to ensure that this report includes the perspecves of key industry stakeholders on the major issues, challenges and outlook for the subsea well intervenon industry. The overriding senment is posive, with over three quarters of those polled expecng the oil and gas industry to recover within two years. Images Courtesy of Helix ESG SUBSEA WELL INTERVENTION Market Report to 2019 www.infield.com
Transcript of MARKET WATCH - Infield Systems Ltd...The Subsea Well Intervention Market Report provides an in-depth...
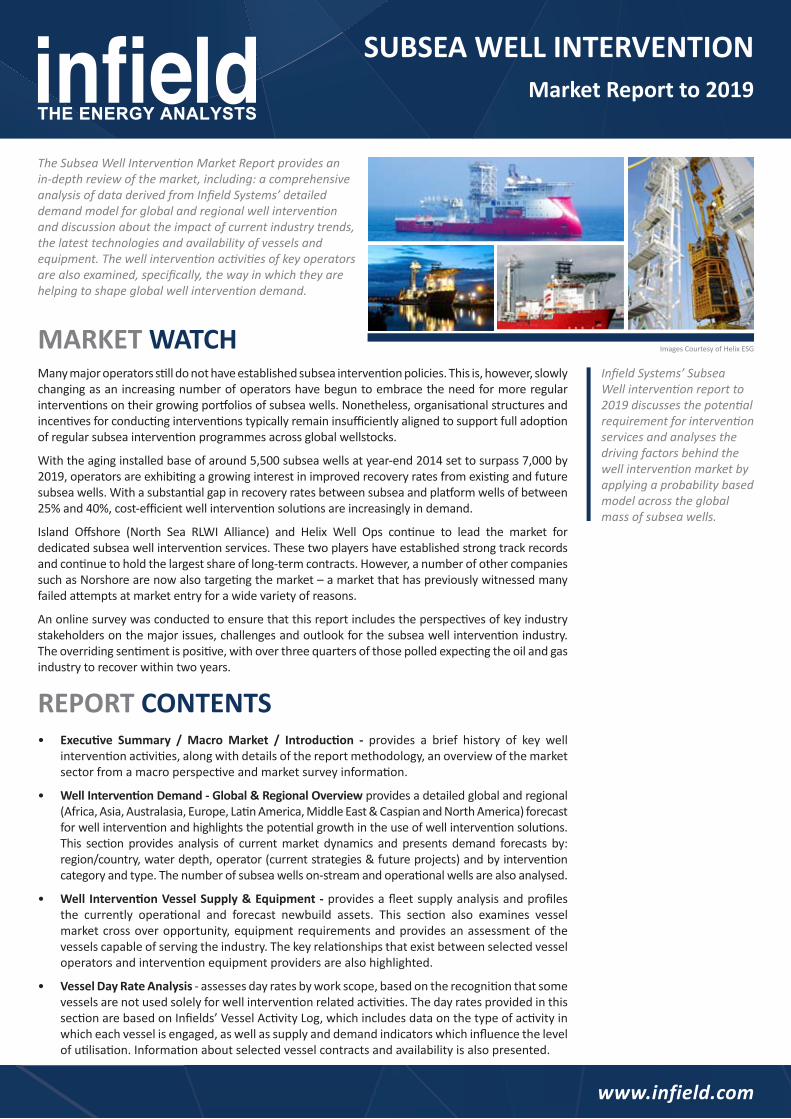
The Subsea Well Intervention Market Report provides an in-depth review of the market, including: a comprehensive analysis of data derived from Infield Systems’ detailed demand model for global and regional well intervention and discussion about the impact of current industry trends, the latest technologies and availability of vessels and equipment. The well intervention activities of key operators are also examined, specifically, the way in which they are helping to shape global well intervention demand.
Infield Systems’ Subsea Well intervention report to 2019 discusses the potential requirement for intervention services and analyses the driving factors behind the well intervention market by applying a probability based model across the global mass of subsea wells.
REPORT CONTENTS
MARKET WATCH
• Executive Summary / Macro Market / Introduction - provides a brief history of key wellinterventionactivities,alongwithdetailsofthereportmethodology,anoverviewofthemarketsectorfromamacroperspectiveandmarketsurveyinformation.
• Well Intervention Demand - Global & Regional Overview providesadetailedglobalandregional(Africa,Asia,Australasia,Europe,LatinAmerica,MiddleEast&CaspianandNorthAmerica)forecastforwellinterventionandhighlightsthepotentialgrowthintheuseofwellinterventionsolutions.This section provides analysis of currentmarket dynamics and presents demand forecasts by:region/country,waterdepth,operator(currentstrategies&futureprojects)andbyinterventioncategoryandtype.Thenumberofsubseawellson-streamandoperationalwellsarealsoanalysed.
• Well Intervention Vessel Supply & Equipment - providesafleetsupplyanalysisandprofilesthe currently operational and forecast newbuild assets. This section also examines vesselmarketcrossoveropportunity,equipmentrequirementsandprovidesanassessmentof thevesselscapableofservingtheindustry.Thekeyrelationshipsthatexistbetweenselectedvesseloperatorsandinterventionequipmentprovidersarealsohighlighted.
• Vessel Day Rate Analysis-assessesdayratesbyworkscope,basedontherecognitionthatsomevesselsarenotusedsolelyforwellinterventionrelatedactivities.ThedayratesprovidedinthissectionarebasedonInfields’VesselActivityLog,whichincludesdataonthetypeofactivityinwhicheachvesselisengaged,aswellassupplyanddemandindicatorswhichinfluencethelevelofutilisation.Informationaboutselectedvesselcontractsandavailabilityisalsopresented.
Manymajoroperatorsstilldonothaveestablishedsubseainterventionpolicies.Thisis,however,slowlychangingasanincreasingnumberofoperatorshavebeguntoembracetheneedformoreregularinterventionsontheirgrowingportfoliosofsubseawells.Nonetheless,organisationalstructuresandincentivesforconductinginterventionstypicallyremaininsufficientlyalignedtosupportfulladoptionofregularsubseainterventionprogrammesacrossglobalwellstocks.
Withtheaginginstalledbaseofaround5,500subseawellsatyear-end2014settosurpass7,000by2019,operatorsareexhibitingagrowinginterestinimprovedrecoveryratesfromexistingandfuturesubseawells.Withasubstantialgapinrecoveryratesbetweensubseaandplatformwellsofbetween25%and40%,cost-efficientwellinterventionsolutionsareincreasinglyindemand.
Island Offshore (North Sea RLWI Alliance) and Helix Well Ops continue to lead the market fordedicatedsubseawellinterventionservices.Thesetwoplayershaveestablishedstrongtrackrecordsandcontinuetoholdthelargestshareoflong-termcontracts.However,anumberofothercompaniessuchasNorshorearenowalsotargetingthemarket–amarketthathaspreviouslywitnessedmanyfailedattemptsatmarketentryforawidevarietyofreasons.
Anonlinesurveywasconductedtoensurethatthisreportincludestheperspectivesofkeyindustrystakeholdersonthemajorissues,challengesandoutlookforthesubseawellinterventionindustry.Theoverridingsentimentispositive,withoverthreequartersofthosepolledexpectingtheoilandgasindustrytorecoverwithintwoyears.
ImagesCourtesyofHelixESG
SUBSEA WELL INTERVENTIONMarket Report to 2019
www.infield.com
HEAD OFFICEInfieldSystemsLimitedSuite502,1AlieStreetLondonE18DE,UKT:+442074235000|F:+442074235050E:[email protected]|W:www.infield.com
ABERDEEN OFFICEInfieldSystemsLimitedUnitF6,EnterpriseCentreAberdeenEnergyPark,ExplorationDriveBridgeofDon,AberdeenAB238GX,UKT:+441224258150|F:+442074235050
WHY YOU SHOULD BUY THIS REPORT
ONLINE DATABASE ACCESS AND UPGRADES
REPORT & UPGRADES PRICE LIST
• ThereportcontainsdatadevelopedbyInfieldSystems’proprietarymarketmodellingprocess,OFFPEX,whichisbasedonaunique“bottomupapproach”toforecasting.OFFPEX’scomponentby component and project by project forecasting process is robust and has a proven trackrecord.
• Thisreportprovidesanindependentandcomprehensiveanalysisoftheissues,newtechnologicaldevelopmentsandrisks impactingtheWell Interventionmarketandthecompaniesofferingserviceswithinthissector.
• The report presents informationon the expecteddemand forWell Intervention vessels, byevaluatingtherequirementsoftheever-evolvingoperationalbaseofsubseawellsonaglobalandregionalbasisandlookingatthedemandcomingfromvariouscountriesandoilandgasoperators.
• ThereportprovidesadetailedassessmentofWellInterventionvesseldayratesandanoverviewoftheactivityofselectedvesselsbasedonInfieldSystems’VesselActivityLog.
www.infield.com/report/intervention
Report Formats & Online Access Upgrades Single Licence (£)
Additional Licence (£)
Corporate Licence (£)
SubseaWellInterventionMarketReportto2019(PrintedCopy) 3,950 1000 5,950
SubseaWellInterventionMarketReportto2019(ElectronicCopy) 3,950 1000 5,950
UpgradetoSpecialistVesselsDatabase(Standard)onlineaccess 1,250 625 2,500
UpgradetoSpecialistVessels(PSV&AHTS)Module 2,000 1,000 4,000
UpgradetoboththestandardandPSV&AHTSModules 2,600 1,300 5,200
Purchasers of the SubseaWell InterventionMarket Report to 2019 receive free access to theSpecialist Vessel Database (Well InterventionAssets)module for a twelve-month period,whichtracksthefollowingkeydatapointsabouteachvessel:
IMONumber,VesselName,PreviousName/s,Owner/Operator,CurrentStatus,Capabilities (Lay,Burial/Trenching,HeavyLift,HeavyTransport,Accommodation,Well Intervention,DiveSupport),VesselType,MaximumCapacities(Lift,Transportation,Diameter),Classification,YearBuilt,Progresson Delivery (Newbuilds and Conversions), Contracted Builder & Country, Hull Yard & Country,Attributes (Length, Width/Breadth/Depth, DWT, Total Deck Load, Strength Capacity, Deck AreaDimensions,TotalFreeDeckArea,HullType),TransitSpeed,Accommodation(Persons),Positioning,NewbuildCapex,SphereofOperations,DesignedLayingSpeeds,LaySystem,LayTypeCapabilities(RigidPipe,CoiledLinePipe,FlexiblePipe,Umbilical,BundledPipe,Pipe-In-Pipe,Cable)
Upgrade to Specialist Vessels Database Standard Module and PSV AHTS Module
• The Standard Module of the Specialist Vessels Database identifies the following types ofvessels: Accommodation, Dive Support, Pipe/Cable Lay, Pipe Burial/Trenching, Heavy Lift,HeavyTransport,Multi-Service,WellIntervention
• The PSV and AHTSModules of the Specialist Vessels Database identifies: Platform SupplyVessels,AnchorHandlingTugSupplyVessels
With data derived from two of Infield Systems’ proprietary databases, OFFPEX and the Specialist Vessels Database, the report presents both the supply and demand dynamics in this emerging market.
27/04/2015
www.infield.com
Global Perspectives Subsea Well Intervention Market Report to 2019
© Infield Systems Limited 2015 7
CONTENTS LIST
1 Executive Summary .................................................................................................................................................................................................................. 28
2 Macro Market .......................................................................................................................................................................................................................... 30
2.1 Oil Price Forecast (2015-2020) ...................................................................................................................................................................................................................................... 30
2.2 Global Oil Supply Dynamics .......................................................................................................................................................................................................................................... 31
2.3 Long-term Gas Price Dynamics ..................................................................................................................................................................................................................................... 32
2.4 Offshore Market Outlook (2015-2020) ......................................................................................................................................................................................................................... 33
2.5 Offshore CAPEX ............................................................................................................................................................................................................................................................. 34
2.6 Offshore Activity Indicators .......................................................................................................................................................................................................................................... 35
3 Introduction ............................................................................................................................................................................................................................. 36
3.1 Market Introduction ..................................................................................................................................................................................................................................................... 36
3.1.1 Brief History of the Subsea Well Intervention Market ................................................................................................................................................................ 37
3.1.2 Types of Well Intervention .......................................................................................................................................................................................................... 38
3.2 Brief Introduction to Intervention Activity Levels ........................................................................................................................................................................................................ 39
3.3 Intervention Methodology ........................................................................................................................................................................................................................................... 40
3.3.1 Estimation of Probability ............................................................................................................................................................................................................. 40
3.3.2 Types of Intervention................................................................................................................................................................................................................... 41
3.3.3 Limitations ................................................................................................................................................................................................................................... 42
3.4 Market Survey ............................................................................................................................................................................................................................................................... 43
3.4.1 About This Survey ........................................................................................................................................................................................................................ 43
3.4.2 Overview of Respondents & General Industry Sentiment .......................................................................................................................................................... 43
3.4.3 Views on Operator Focus on Improved Oil Recovery .................................................................................................................................................................. 44
3.4.4 Challenges & Outlook for Subsea Well Intervention ................................................................................................................................................................... 46
4 Well Intervention Demand – Global Overview ........................................................................................................................................................................... 48
4.1 Global Subsea Market Context ..................................................................................................................................................................................................................................... 48
Global Perspectives Subsea Well Intervention Market Report to 2019
© Infield Systems Limited 2015 8
4.1.1 Regional Developments ............................................................................................................................................................................................................... 48
4.1.2 Water Depth ................................................................................................................................................................................................................................ 49
4.1.3 Capex ........................................................................................................................................................................................................................................... 50
4.2 Global Analysis and Forecasts ....................................................................................................................................................................................................................................... 51
4.2.1 Introduction ................................................................................................................................................................................................................................. 51
4.2.2 Key Industry Dynamics................................................................................................................................................................................................................. 51
4.2.3 Demand by Region ....................................................................................................................................................................................................................... 52
4.2.4 Demand by Water Depth ............................................................................................................................................................................................................. 53
4.2.5 Demand by Intervention Category & Type .................................................................................................................................................................................. 54
5 Well Intervention Demand – Regional Overview ....................................................................................................................................................................... 55
5.1 Africa ............................................................................................................................................................................................................................................................................. 55
5.1.1 Market Overview ......................................................................................................................................................................................................................... 55
5.1.2 Subsea Wells On-Stream ............................................................................................................................................................................................................. 56
5.1.3 Operational Subsea Wells ............................................................................................................................................................................................................ 57
5.1.4 Demand by Country ..................................................................................................................................................................................................................... 58
5.1.5 Demand by Water Depth ............................................................................................................................................................................................................. 59
5.1.6 Demand by Operator ................................................................................................................................................................................................................... 60
5.1.7 Demand by Intervention Category .............................................................................................................................................................................................. 61
5.1.8 Demand by Intervention Type ..................................................................................................................................................................................................... 62
5.2 Asia ............................................................................................................................................................................................................................................................................... 63
5.2.1 Market Overview ......................................................................................................................................................................................................................... 63
5.2.2 Subsea Wells On-Stream ............................................................................................................................................................................................................. 64
5.2.3 Operational Subsea Wells ............................................................................................................................................................................................................ 65
5.2.4 Demand by Country ..................................................................................................................................................................................................................... 66
5.2.5 Demand by Water Depth ............................................................................................................................................................................................................. 67
5.2.6 Demand by Operator ................................................................................................................................................................................................................... 68
5.2.7 Demand by Intervention Category .............................................................................................................................................................................................. 69
5.2.8 Demand by Intervention Type ..................................................................................................................................................................................................... 70
5.3 Australasia .................................................................................................................................................................................................................................................................... 71
5.3.1 Market Overview ......................................................................................................................................................................................................................... 71
Global Perspectives Subsea Well Intervention Market Report to 2019
© Infield Systems Limited 2015 9
5.3.2 Subsea Wells On-Stream ............................................................................................................................................................................................................. 72
5.3.3 Operational Subsea Wells ............................................................................................................................................................................................................ 73
5.3.4 Demand by Country ..................................................................................................................................................................................................................... 74
5.3.5 Demand by Water Depth ............................................................................................................................................................................................................. 75
5.3.6 Demand by Operator ................................................................................................................................................................................................................... 76
5.3.7 Demand by Intervention Category .............................................................................................................................................................................................. 77
5.3.8 Demand by Intervention Type ..................................................................................................................................................................................................... 78
5.4 Europe ........................................................................................................................................................................................................................................................................... 79
5.4.1 Market Overview ......................................................................................................................................................................................................................... 79
5.4.2 Subsea Wells On-Stream ............................................................................................................................................................................................................. 80
5.4.3 Operational Subsea Wells ............................................................................................................................................................................................................ 81
5.4.4 Demand by Country ..................................................................................................................................................................................................................... 82
5.4.5 Demand by Water Depth ............................................................................................................................................................................................................. 83
5.4.6 Demand by Operator ................................................................................................................................................................................................................... 84
5.4.7 Demand by Intervention Category .............................................................................................................................................................................................. 85
5.4.8 Demand by Intervention Type ..................................................................................................................................................................................................... 86
5.5 Latin America ................................................................................................................................................................................................................................................................ 87
5.5.1 Market Overview ......................................................................................................................................................................................................................... 87
5.5.2 Subsea Wells On-Stream ............................................................................................................................................................................................................. 88
5.5.3 Operational Subsea Wells ............................................................................................................................................................................................................ 89
5.5.4 Demand by Country ..................................................................................................................................................................................................................... 90
5.5.5 Demand by Water Depth ............................................................................................................................................................................................................. 91
5.5.6 Demand by Operator ................................................................................................................................................................................................................... 92
5.5.7 Demand by Intervention Category .............................................................................................................................................................................................. 93
5.5.8 Demand by Intervention Type ..................................................................................................................................................................................................... 94
5.6 Middle East & Caspian Sea............................................................................................................................................................................................................................................ 95
5.6.1 Market Overview ......................................................................................................................................................................................................................... 95
5.6.2 Subsea Wells On-Stream ............................................................................................................................................................................................................. 96
5.6.3 Operational Subsea Wells ............................................................................................................................................................................................................ 97
5.6.4 Demand by Country ..................................................................................................................................................................................................................... 98
5.6.5 Demand by Water Depth ............................................................................................................................................................................................................. 99
Global Perspectives Subsea Well Intervention Market Report to 2019
© Infield Systems Limited 2015 10
5.6.6 Demand by Operator ................................................................................................................................................................................................................. 100
5.6.7 Demand by Intervention Category ............................................................................................................................................................................................ 101
5.6.8 Demand by Intervention Type ................................................................................................................................................................................................... 102
5.7 North America ............................................................................................................................................................................................................................................................103
5.7.1 Market Overview ....................................................................................................................................................................................................................... 103
5.7.2 Subsea Wells On-Stream ........................................................................................................................................................................................................... 104
5.7.3 Operational Subsea Wells .......................................................................................................................................................................................................... 105
5.7.4 Demand by Country ................................................................................................................................................................................................................... 106
5.7.5 Demand by Water Depth ........................................................................................................................................................................................................... 107
5.7.6 Demand by Operator ................................................................................................................................................................................................................. 108
5.7.7 Demand by Intervention Category ............................................................................................................................................................................................ 109
5.7.8 Demand by Intervention Type ................................................................................................................................................................................................... 110
5.8 Overview of Key Operators .........................................................................................................................................................................................................................................111
5.8.1 Summary of Key Operators ....................................................................................................................................................................................................... 111
5.8.2 Petrobras ................................................................................................................................................................................................................................... 112
5.8.3 Statoil ......................................................................................................................................................................................................................................... 113
5.8.4 Total ........................................................................................................................................................................................................................................... 114
5.8.5 Shell ........................................................................................................................................................................................................................................... 115
5.8.6 BP ............................................................................................................................................................................................................................................... 116
5.8.7 ExxonMobil ................................................................................................................................................................................................................................ 117
5.8.8 Chevron ...................................................................................................................................................................................................................................... 118
5.8.9 Eni .............................................................................................................................................................................................................................................. 119
6 Subsea Well Intervention Vessel Supply & Equipment ............................................................................................................................................................. 120
6.1 Introduction and Market Background ........................................................................................................................................................................................................................120
6.1.1 Well Intervention Vessels vs. MSVs ........................................................................................................................................................................................... 121
6.1.2 Intervention Vessel Work Scopes .............................................................................................................................................................................................. 122
6.1.3 The Vessel vs. The Equipment ................................................................................................................................................................................................... 123
6.1.4 Vessel Market Cross-Over Opportunity ..................................................................................................................................................................................... 124
6.2 Fleet Supply Analysis...................................................................................................................................................................................................................................................124
6.2.1 Global Potential Intervention Vessel Supply ............................................................................................................................................................................. 124
Global Perspectives Subsea Well Intervention Market Report to 2019
© Infield Systems Limited 2015 11
6.2.2 Segmented Well Intervention Supply ........................................................................................................................................................................................ 126
6.2.3 Overview of Key Vessel Operators ............................................................................................................................................................................................ 128
6.2.4 Fleet Specification & Age Profile Analysis ................................................................................................................................................................................. 130
6.2.5 Potential Intervention Supply .................................................................................................................................................................................................... 130
6.2.6 Selected Vessels ......................................................................................................................................................................................................................... 131
6.3 Equipment Requirements ...........................................................................................................................................................................................................................................132
6.4 Key Equipment Providers ............................................................................................................................................................................................................................................133
6.5 Selected Established Relationships .............................................................................................................................................................................................................................134
7 Vessel Dayrate Analysis .......................................................................................................................................................................................................... 136
7.1 Introduction ................................................................................................................................................................................................................................................................136
7.1.1 Dayrate Model ........................................................................................................................................................................................................................... 136
7.2 Global Multifunctional Dayrates .................................................................................................................................................................................................................................137
7.2.1 Multifunctional Dayrates by Work Scope .................................................................................................................................................................................. 138
7.2.2 Market Dynamics ....................................................................................................................................................................................................................... 139
7.3 Selected Vessel Contracts & Availability .....................................................................................................................................................................................................................142
8 Appendices & Notes ............................................................................................................................................................................................................... 143
8.1 Defined Regions/Countries List...................................................................................................................................................................................................................................143
8.2 References ..................................................................................................................................................................................................................................................................144
8.3 List of Acronyms & Abbreviations ...............................................................................................................................................................................................................................146
Global Perspectives Subsea Well Intervention Market Report to 2019
© Infield Systems Limited 2015 12
LIST OF FIGURES
Figure 1-1: Global Well Intervention Demand .................................................................................................................................................................................................... 29
Figure 1-2: Global Well Intervention Vessel Supply ............................................................................................................................................................................................ 29
Figure 3-1: Number of Survey Respondents by Company Type .......................................................................................................................................................................... 43
Figure 3-2: Number of Survey Respondents by Job Type .................................................................................................................................................................................... 43
Figure 3-3: Expectations on Oil & Gas Market Recovery (% Of Respondents - OR) ............................................................................................................................................ 44
Figure 3-4: Likelihood of Operators Looking to Optimise Production from Existing Assets (% OR) ................................................................................................................... 44
Figure 3-5: Perception of Oil Price Effect on Operator Focus on Production Optimisation (% OR) .................................................................................................................... 45
Figure 3-6: Average Importance of Factors Affecting Hydrocarbon Recovery Rates .......................................................................................................................................... 45
Figure 3-7: The Economic Case for LWI Vessels versus MODUs (% OR) .............................................................................................................................................................. 46
Figure 3-8: Average Importance of Factors Affecting Operator Subsea Well Intervention Decisions ................................................................................................................ 46
Figure 3-9: Average Significance of Constraints & Challenges for RLWI Adoption ............................................................................................................................................. 47
Figure 3-10: Expectation for Subsea Well Intervention Demand Growth by Vessel Type Over Next 5 Years (% OR) ........................................................................................ 47
Figure 4-1: No. of Subsea Wells On-Stream by Region 2010-2019 ..................................................................................................................................................................... 48
Figure 4-2: No. of Operational Subsea Wells by Region 2010-2019 ................................................................................................................................................................... 48
Figure 4-3: No. of Subsea Wells On-Stream by Water Depth 2010-2019 ........................................................................................................................................................... 49
Figure 4-4: No. of Operational Subsea Wells by Water Depth 2010-2019 .......................................................................................................................................................... 49
Figure 4-5 Global TIC (US$m) Subsea Wells by Region 2010-2019 ..................................................................................................................................................................... 50
Figure 4-6 Global TIC (US$m) Subsea Wells by Water Depth 2010-2019 ........................................................................................................................................................... 50
Figure 4-7 Global TIC (US$m) Subsea Wells by Build Process 2010-2019 ........................................................................................................................................................... 50
Figure 4-8: Graphical Illustration of Defined Regions.......................................................................................................................................................................................... 51
Figure 4-9: Global Well Intervention Demand (Vessel Days) by Region 2010-2019 ........................................................................................................................................... 52
Figure 4-10: Global Well Intervention Demand (Vessel Days) by Water Depth 2010-2019 ............................................................................................................................... 53
Figure 4-11: Global Well Intervention Demand (Vessel Days) by Intervention Category 2010-2019 ................................................................................................................. 54
Figure 4-12: Global Well Intervention Demand (Vessel Days) by Intervention Type 2010-2019 ....................................................................................................................... 54
Figure 5-1: Regional Graphic – Africa .................................................................................................................................................................................................................. 55
Figure 5-2: No. of Subsea Wells On-Stream by Country 2010-2019 ................................................................................................................................................................... 56
Figure 5-3: No. of Subsea Wells On-Stream by Water Depth 2010-2019 ........................................................................................................................................................... 56
Figure 5-4: No. of Subsea Wells On-Stream by Operator 2010-2019 ................................................................................................................................................................. 56
Figure 5-5: No. of Operational Subsea Wells by Country 2010-2019 .................................................................................................................................................................. 57
Global Perspectives Subsea Well Intervention Market Report to 2019
© Infield Systems Limited 2015 13
Figure 5-6: No. of Operational Subsea Wells by Water Depth 2010-2019 .......................................................................................................................................................... 57
Figure 5-7: No. of Operational Subsea Wells by Operator 2010-2019 ................................................................................................................................................................ 57
Figure 5-8: Well Intervention Demand (Vessel Days) by Country 2010-2019 ..................................................................................................................................................... 58
Figure 5-9: Well Intervention Demand (Vessel Days) by Water Depth 2010-2019 ............................................................................................................................................. 59
Figure 5-10: Well Intervention Demand Share by Water Depth 2010-2014 & 2015-2019 ................................................................................................................................. 59
Figure 5-11: Well Intervention Demand (Vessel Days) by Operator 2010-2019 ................................................................................................................................................. 60
Figure 5-12: Well Intervention Demand Share by Operator 2010-2014 & 2015-2019 ....................................................................................................................................... 60
Figure 5-13: Well Intervention Demand (Vessel Days) by Category 2010-2019 ................................................................................................................................................. 61
Figure 5-14: Well Intervention Demand Share by Category 2010-2014 & 2015-2019 ....................................................................................................................................... 61
Figure 5-15: Well Intervention Demand (Vessel Days) by Type 2010-2019 ........................................................................................................................................................ 62
Figure 5-16: Well Intervention Demand Share by Water Depth 2010-2014 & 2015-2019 ................................................................................................................................. 62
Figure 5-17: Regional Graphic – Asia ................................................................................................................................................................................................................... 63
Figure 5-18: No. of Subsea Wells On-Stream by Country 2010-2019 ................................................................................................................................................................. 64
Figure 5-19: No. of Subsea Wells On-Stream by Water Depth 2010-2019 ......................................................................................................................................................... 64
Figure 5-20: No. of Subsea Wells On-Stream by Operator 2010-2019 ............................................................................................................................................................... 64
Figure 5-21: No. of Operational Subsea Wells by Country 2010-2019 ................................................................................................................................................................ 65
Figure 5-22: No. of Operational Subsea Wells by Water Depth 2010-2019 ........................................................................................................................................................ 65
Figure 5-23: No. of Operational Subsea Wells by Operator 2010-2019 .............................................................................................................................................................. 65
Figure 5-24: Well Intervention Demand (Vessel Days) by Country 2010-2019 ................................................................................................................................................... 66
Figure 5-25: Well Intervention Demand (Vessel Days) by Water Depth 2010-2019 ........................................................................................................................................... 67
Figure 5-26: Well Intervention Demand Share by Water Depth 2010-2014 & 2015-2019 ................................................................................................................................. 67
Figure 5-27: Well Intervention Demand (Vessel Days) by Operator 2010-2019 ................................................................................................................................................. 68
Figure 5-28: Well Intervention Demand Share by Operator 2010-2014 & 2015-2019 ....................................................................................................................................... 68
Figure 5-29: Well Intervention Demand (Vessel Days) by Category 2010-2019 ................................................................................................................................................. 69
Figure 5-30: Well Intervention Demand Share by Category 2010-2014 & 2015-2019 ....................................................................................................................................... 69
Figure 5-31: Well Intervention Demand (Vessel Days) by Type 2010-2019 ........................................................................................................................................................ 70
Figure 5-32: Well Intervention Demand Share by Water Depth 2010-2014 & 2015-2019 ................................................................................................................................. 70
Figure 5-33: Regional Graphic – Australasia ........................................................................................................................................................................................................ 71
Figure 5-34: No. of Subsea Wells On-Stream by Country 2010-2019 ................................................................................................................................................................. 72
Figure 5-35: No. of Subsea Wells On-Stream by Water Depth 2010-2019 ......................................................................................................................................................... 72
Figure 5-36: No. of Subsea Wells On-Stream by Operator 2010-2019 ............................................................................................................................................................... 72
Global Perspectives Subsea Well Intervention Market Report to 2019
© Infield Systems Limited 2015 14
Figure 5-37: No. of Operational Subsea Wells by Country 2010-2019 ................................................................................................................................................................ 73
Figure 5-38: No. of Operational Subsea Wells by Water Depth 2010-2019 ........................................................................................................................................................ 73
Figure 5-39: No. of Operational Subsea Wells by Operator 2010-2019 .............................................................................................................................................................. 73
Figure 5-40: Well Intervention Demand (Vessel Days) by Country 2010-2019 ................................................................................................................................................... 74
Figure 5-41: Well Intervention Demand (Vessel Days) by Water Depth 2010-2019 ........................................................................................................................................... 75
Figure 5-42: Well Intervention Demand Share by Water Depth 2010-2014 & 2015-2019 ................................................................................................................................. 75
Figure 5-43: Well Intervention Demand (Vessel Days) by Operator 2010-2019 ................................................................................................................................................. 76
Figure 5-44: Well Intervention Demand Share by Operator 2010-2014 & 2015-2019 ....................................................................................................................................... 76
Figure 5-45: Well Intervention Demand (Vessel Days) by Category 2010-2019 ................................................................................................................................................. 77
Figure 5-46: Well Intervention Demand Share by Category 2010-2014 & 2015-2019 ....................................................................................................................................... 77
Figure 5-47: Well Intervention Demand (Vessel Days) by Type 2010-2019 ........................................................................................................................................................ 78
Figure 5-48: Well Intervention Demand Share by Water Depth 2010-2014 & 2015-2019 ................................................................................................................................. 78
Figure 5-49: Regional Graphic – Europe .............................................................................................................................................................................................................. 79
Figure 5-50: No. of Subsea Wells On-Stream by Country 2010-2019 ................................................................................................................................................................. 80
Figure 5-51: No. of Subsea Wells On-Stream by Water Depth 2010-2019 ......................................................................................................................................................... 80
Figure 5-52: No. of Subsea Wells On-Stream by Operator 2010-2019 ............................................................................................................................................................... 80
Figure 5-53: No. of Operational Subsea Wells by Country 2010-2019 ................................................................................................................................................................ 81
Figure 5-54: No. of Operational Subsea Wells by Water Depth 2010-2019 ........................................................................................................................................................ 81
Figure 5-55: No. of Operational Subsea Wells by Operator 2010-2019 .............................................................................................................................................................. 81
Figure 5-56: Well Intervention Demand (Vessel Days) by Country 2010-2019 ................................................................................................................................................... 82
Figure 5-57: Well Intervention Demand (Vessel Days) by Water Depth 2010-2019 ........................................................................................................................................... 83
Figure 5-58: Well Intervention Demand Share by Water Depth 2010-2014 & 2015-2019 ................................................................................................................................. 83
Figure 5-59: Well Intervention Demand (Vessel Days) by Operator 2010-2019 ................................................................................................................................................. 84
Figure 5-60: Well Intervention Demand Share by Operator 2010-2014 & 2015-2019 ....................................................................................................................................... 84
Figure 5-61: Well Intervention Demand (Vessel Days) by Category 2010-2019 ................................................................................................................................................. 85
Figure 5-62: Well Intervention Demand Share by Category 2010-2014 & 2015-2019 ....................................................................................................................................... 85
Figure 5-63: Well Intervention Demand (Vessel Days) by Type 2010-2019 ........................................................................................................................................................ 86
Figure 5-64: Well Intervention Demand Share by Water Depth 2010-2014 & 2015-2019 ................................................................................................................................. 86
Figure 5-65: Regional Graphic – Latin America ................................................................................................................................................................................................... 87
Figure 5-66: No. of Subsea Wells On-Stream by Country 2010-2019 ................................................................................................................................................................. 88
Figure 5-67: No. of Subsea Wells On-Stream by Water Depth 2010-2019 ......................................................................................................................................................... 88
Global Perspectives Subsea Well Intervention Market Report to 2019
© Infield Systems Limited 2015 15
Figure 5-68: No. of Subsea Wells On-Stream by Operator 2010-2019 ............................................................................................................................................................... 88
Figure 5-69: No. of Operational Subsea Wells by Country 2010-2019 ................................................................................................................................................................ 89
Figure 5-70: No. of Operational Subsea Wells by Water Depth 2010-2019 ........................................................................................................................................................ 89
Figure 5-71: No. of Operational Subsea Wells by Operator 2010-2019 .............................................................................................................................................................. 89
Figure 5-72: Well Intervention Demand (Vessel Days) by Country 2010-2019 ................................................................................................................................................... 90
Figure 5-73: Well Intervention Demand (Vessel Days) by Water Depth 2010-2019 ........................................................................................................................................... 91
Figure 5-74: Well Intervention Demand Share by Water Depth 2010-2014 & 2015-2019 ................................................................................................................................. 91
Figure 5-75: Well Intervention Demand (Vessel Days) by Operator 2010-2019 ................................................................................................................................................. 92
Figure 5-76: Well Intervention Demand Share by Operator 2010-2014 & 2015-2019 ....................................................................................................................................... 92
Figure 5-77: Well Intervention Demand (Vessel Days) by Category 2010-2019 ................................................................................................................................................. 93
Figure 5-78: Well Intervention Demand Share by Category 2010-2014 & 2015-2019 ....................................................................................................................................... 93
Figure 5-79: Well Intervention Demand (Vessel Days) by Type 2010-2019 ........................................................................................................................................................ 94
Figure 5-80: Well Intervention Demand Share by Water Depth 2010-2014 & 2015-2019 ................................................................................................................................. 94
Figure 5-81: Regional Graphic – Middle East & Caspian Sea ............................................................................................................................................................................... 95
Figure 5-82: No. of Subsea Wells On-Stream by Country 2010-2019 ................................................................................................................................................................. 96
Figure 5-83: No. of Subsea Wells On-Stream by Water Depth 2010-2019 ......................................................................................................................................................... 96
Figure 5-84: No. of Subsea Wells On-Stream by Operator 2010-2019 ............................................................................................................................................................... 96
Figure 5-85: No. of Operational Subsea Wells by Country 2010-2019 ................................................................................................................................................................ 97
Figure 5-86: No. of Operational Subsea Wells by Water Depth 2010-2019 ........................................................................................................................................................ 97
Figure 5-87: No. of Operational Subsea Wells by Operator 2010-2019 .............................................................................................................................................................. 97
Figure 5-88: Well Intervention Demand (Vessel Days) by Country 2010-2019 ................................................................................................................................................... 98
Figure 5-89: Well Intervention Demand (Vessel Days) by Water Depth 2010-2019 ........................................................................................................................................... 99
Figure 5-90: Well Intervention Demand Share by Water Depth 2010-2014 & 2015-2019 ................................................................................................................................. 99
Figure 5-91: Well Intervention Demand (Vessel Days) by Operator 2010-2019 ............................................................................................................................................... 100
Figure 5-92: Well Intervention Demand Share by Operator 2010-2014 & 2015-2019 ..................................................................................................................................... 100
Figure 5-93: Well Intervention Demand (Vessel Days) by Category 2010-2019 ............................................................................................................................................... 101
Figure 5-94: Well Intervention Demand Share by Category 2010-2014 & 2015-2019 ..................................................................................................................................... 101
Figure 5-95: Well Intervention Demand (Vessel Days) by Type 2010-2019 ...................................................................................................................................................... 102
Figure 5-96: Well Intervention Demand Share by Water Depth 2010-2014 & 2015-2019 ............................................................................................................................... 102
Figure 5-97: Regional Graphic – North America ................................................................................................................................................................................................ 103
Figure 5-98: No. of Subsea Wells On-Stream by Country 2010-2019 ............................................................................................................................................................... 104
Global Perspectives Subsea Well Intervention Market Report to 2019
© Infield Systems Limited 2015 16
Figure 5-99: No. of Subsea Wells On-Stream by Water Depth 2010-2019 ....................................................................................................................................................... 104
Figure 5-100: No. of Subsea Wells On-Stream by Operator 2010-2019 ........................................................................................................................................................... 104
Figure 5-101: No. of Operational Subsea Wells by Country 2010-2019 ............................................................................................................................................................ 105
Figure 5-102: No. of Operational Subsea Wells by Water Depth 2010-2019 .................................................................................................................................................... 105
Figure 5-103: No. of Operational Subsea Wells by Operator 2010-2019 .......................................................................................................................................................... 105
Figure 5-104: Well Intervention Demand (Vessel Days) by Country 2010-2019 ............................................................................................................................................... 106
Figure 5-105: Well Intervention Demand (Vessel Days) by Water Depth 2010-2019 ....................................................................................................................................... 107
Figure 5-106: Well Intervention Demand Share by Water Depth 2010-2014 & 2015-2019 ............................................................................................................................. 107
Figure 5-107: Well Intervention Demand (Vessel Days) by Operator 2010-2019 ............................................................................................................................................. 108
Figure 5-108: Well Intervention Demand Share by Operator 2010-2014 & 2015-2019 ................................................................................................................................... 108
Figure 5-109: Well Intervention Demand (Vessel Days) by Category 2010-2019 ............................................................................................................................................. 109
Figure 5-110: Well Intervention Demand Share by Category 2010-2014 & 2015-2019 ................................................................................................................................... 109
Figure 5-111: Well Intervention Demand (Vessel Days) by Type 2010-2019 .................................................................................................................................................... 110
Figure 5-112: Well Intervention Demand Share by Water Depth 2010-2014 & 2015-2019 ............................................................................................................................. 110
Figure 5-113: Global Operational Subsea Well Base by Operator 2010-2019 .................................................................................................................................................. 111
Figure 5-114: Global Intervention Demand (Vessel Days) by Operator 2010-2019 .......................................................................................................................................... 111
Figure 5-115: Global Intervention Demand Share by Operator 2010-2014 & 2015-2019 ................................................................................................................................ 111
Figure 5-116: Petrobras Well Intervention Demand (Vessel Days) by Region 2010-2019 ................................................................................................................................ 112
Figure 5-117: Petrobras Well Intervention Demand (Vessel Days) by Water Depth 2010-2019 ...................................................................................................................... 112
Figure 5-118: Petrobras Well Intervention Demand (Vessel Days) by Category 2010-2019 ............................................................................................................................ 112
Figure 5-119: Statoil Well Intervention Demand (Vessel Days) by Region 2010-2019 ..................................................................................................................................... 113
Figure 5-120: Statoil Well Intervention Demand (Vessel Days) by Water Depth 2010-2019 ........................................................................................................................... 113
Figure 5-121: Statoil Well Intervention Demand (Vessel Days) by Category 2010-2019 .................................................................................................................................. 113
Figure 5-122: Total Well Intervention Demand (Vessel Days) by Region 2010-2019 ....................................................................................................................................... 114
Figure 5-123: Total Well Intervention Demand (Vessel Days) by Water Depth 2010-2019 .............................................................................................................................. 114
Figure 5-124: Total Well Intervention Demand (Vessel Days) by Category 2010-2019 .................................................................................................................................... 114
Figure 5-125: Shell Well Intervention Demand (Vessel Days) by Region 2010-2019 ........................................................................................................................................ 115
Figure 5-126: Shell Well Intervention Demand (Vessel Days) by Water Depth 2010-2019 .............................................................................................................................. 115
Figure 5-127: Shell Well Intervention Demand (Vessel Days) by Category 2010-2019 .................................................................................................................................... 115
Figure 5-128: BP Well Intervention Demand (Vessel Days) by Region 2010-2019 ........................................................................................................................................... 116
Figure 5-129: BP Well Intervention Demand (Vessel Days) by Water Depth 2010-2019.................................................................................................................................. 116
Global Perspectives Subsea Well Intervention Market Report to 2019
© Infield Systems Limited 2015 17
Figure 5-130: BP Well Intervention Demand (Vessel Days) by Category 2010-2019 ........................................................................................................................................ 116
Figure 5-131: ExxonMobil Well Intervention Demand (Vessel Days) by Region 2010-2019 ............................................................................................................................. 117
Figure 5-132: ExxonMobil Well Intervention Demand (Vessel Days) by Water Depth 2010-2019 ................................................................................................................... 117
Figure 5-133: ExxonMobil Well Intervention Demand (Vessel Days) by Category 2010-2019 ......................................................................................................................... 117
Figure 5-134: Chevron Well Intervention Demand (Vessel Days) by Region 2010-2019 .................................................................................................................................. 118
Figure 5-135: Chevron Well Intervention Demand (Vessel Days) by Water Depth 2010-2019 ........................................................................................................................ 118
Figure 5-136: Chevron Well Intervention Demand (Vessel Days) by Category 2010-2019 ............................................................................................................................... 118
Figure 5-137: Eni Well Intervention Demand (Vessel Days) by Region 2010-2019 ........................................................................................................................................... 119
Figure 5-138: Eni Well Intervention Demand (Vessel Days) by Water Depth 2010-2019 ................................................................................................................................. 119
Figure 5-139: Eni Well Intervention Demand (Vessel Days) by Category 2010-2019 ....................................................................................................................................... 119
Figure 6-1: Generalised Well Intervention Vessel Work Scopes & Key Characteristics .................................................................................................................................... 122
Figure 6-2: The Vessel vs. The Equipment Overview ......................................................................................................................................................................................... 123
Figure 6-3: Current Global Potential Intervention Vessel Supply ...................................................................................................................................................................... 124
Figure 6-4: Global Potential Intervention Vessel Supply by Vessel Type 2010-2019 ........................................................................................................................................ 125
Figure 6-5: Global Potential Intervention Newbuilds by Vessel Type 2010-2019 ............................................................................................................................................. 125
Figure 6-6: Segmentation Criteria ..................................................................................................................................................................................................................... 126
Figure 6-7: Well Intervention Supply by Vessel Type 2010-2019 ...................................................................................................................................................................... 126
Figure 6-8: Well Intervention Supply by Dynamic Positioning Rating 2010-2019 ............................................................................................................................................. 127
Figure 6-9: Well Intervention Supply by Sphere of Operations 2010-2019 ...................................................................................................................................................... 127
Figure 6-10: Well Intervention Supply Ownership Dynamics ............................................................................................................................................................................ 128
Figure 6-11: Top 20 Vessel Operator Metrics .................................................................................................................................................................................................... 129
Figure 6-12: Current Well Intervention Supply Age Profile (Years) ................................................................................................................................................................... 130
Figure 6-13: Well Intervention Supply Age Profile (%) ...................................................................................................................................................................................... 130
Figure 6-14: Selected Vessels ............................................................................................................................................................................................................................ 131
Global Perspectives Subsea Well Intervention Market Report to 2019
© Infield Systems Limited 2015 18
LIST OF TABLES
Table 3-1: North Sea RLWI Alliance Vessel Operations 2004 – Present (Q3 2014) ............................................................................................................................................. 40
Table 4-1: Global Well Intervention Demand (Vessel Days) by Region 2010-2014 ............................................................................................................................................ 52
Table 4-2: Global Well Intervention Demand (Vessel Days) by Region 2015-2019 ............................................................................................................................................ 52
Table 4-3: Global Well Intervention Demand (Vessel Days) by Water Depth 2010-2014 ................................................................................................................................... 53
Table 4-4: Global Well Intervention Demand (Vessel Days) by Water Depth 2015-2019 ................................................................................................................................... 53
Table 4-5: Global Well Intervention Demand (Vessel Days) by Water Depth 2010-2014 ................................................................................................................................... 54
Table 4-6: Global Well Intervention Demand (Vessel Days) by Water Depth 2015-2019 ................................................................................................................................... 54
Table 5-1: Well Intervention Demand (Vessel Days) by Country 2010-2014 ...................................................................................................................................................... 58
Table 5-2: Well Intervention Demand (Vessel Days) by Country 2015-2019 ...................................................................................................................................................... 58
Table 5-3: Well Intervention Demand (Vessel Days) by Water Depth 2010-2014 .............................................................................................................................................. 59
Table 5-4: Well Intervention Demand (Vessel Days) by Water Depth 2015-2019 .............................................................................................................................................. 59
Table 5-5: Well Intervention Demand (Vessel Days) by Operator 2010-2014 .................................................................................................................................................... 60
Table 5-6: Well Intervention Demand (Vessel Days) by Operator 2015-2019 .................................................................................................................................................... 60
Table 5-7: Well Intervention Demand (Vessel Days) by Category 2010-2014 .................................................................................................................................................... 61
Table 5-8: Well Intervention Demand (Vessel Days) by Category 2015-2019 .................................................................................................................................................... 61
Table 5-9: Well Intervention Demand (Vessel Days) by Type 2010-2014 ........................................................................................................................................................... 62
Table 5-10: Well Intervention Demand (Vessel Days) by Type 2015-2019 ......................................................................................................................................................... 62
Table 5-11: Well Intervention Demand (Vessel Days) by Country 2010-2014 .................................................................................................................................................... 66
Table 5-12: Well Intervention Demand (Vessel Days) by Country 2015-2019 .................................................................................................................................................... 66
Table 5-13: Well Intervention Demand (Vessel Days) by Water Depth 2010-2014 ............................................................................................................................................ 67
Table 5-14: Well Intervention Demand (Vessel Days) by Water Depth 2015-2019 ............................................................................................................................................ 67
Table 5-15: Well Intervention Demand (Vessel Days) by Operator 2010-2014 .................................................................................................................................................. 68
Table 5-16: Well Intervention Demand (Vessel Days) by Operator 2015-2019 .................................................................................................................................................. 68
Table 5-17: Well Intervention Demand (Vessel Days) by Category 2010-2014 .................................................................................................................................................. 69
Table 5-18: Well Intervention Demand (Vessel Days) by Category 2015-2019 .................................................................................................................................................. 69
Table 5-19: Well Intervention Demand (Vessel Days) by Type 2010-2014 ......................................................................................................................................................... 70
Table 5-20: Well Intervention Demand (Vessel Days) by Type 2015-2019 ......................................................................................................................................................... 70
Table 5-21: Well Intervention Demand (Vessel Days) by Country 2010-2014 .................................................................................................................................................... 74
Table 5-22: Well Intervention Demand (Vessel Days) by Country 2015-2019 .................................................................................................................................................... 74
Global Perspectives Subsea Well Intervention Market Report to 2019
© Infield Systems Limited 2015 19
Table 5-23: Well Intervention Demand (Vessel Days) by Water Depth 2010-2014 ............................................................................................................................................ 75
Table 5-24: Well Intervention Demand (Vessel Days) by Water Depth 2015-2019 ............................................................................................................................................ 75
Table 5-25: Well Intervention Demand (Vessel Days) by Operator 2010-2014 .................................................................................................................................................. 76
Table 5-26: Well Intervention Demand (Vessel Days) by Operator 2015-2019 .................................................................................................................................................. 76
Table 5-27: Well Intervention Demand (Vessel Days) by Category 2010-2014 .................................................................................................................................................. 77
Table 5-28: Well Intervention Demand (Vessel Days) by Category 2015-2019 .................................................................................................................................................. 77
Table 5-29: Well Intervention Demand (Vessel Days) by Type 2010-2014 ......................................................................................................................................................... 78
Table 5-30: Well Intervention Demand (Vessel Days) by Type 2015-2019 ......................................................................................................................................................... 78
Table 5-31: Well Intervention Demand (Vessel Days) by Country 2010-2014 .................................................................................................................................................... 82
Table 5-32: Well Intervention Demand (Vessel Days) by Country 2015-2019 .................................................................................................................................................... 82
Table 5-33: Well Intervention Demand (Vessel Days) by Water Depth 2010-2014 ............................................................................................................................................ 83
Table 5-34: Well Intervention Demand (Vessel Days) by Water Depth 2015-2019 ............................................................................................................................................ 83
Table 5-35: Well Intervention Demand (Vessel Days) by Operator 2010-2014 .................................................................................................................................................. 84
Table 5-36: Well Intervention Demand (Vessel Days) by Operator 2015-2019 .................................................................................................................................................. 84
Table 5-37: Well Intervention Demand (Vessel Days) by Category 2010-2014 .................................................................................................................................................. 85
Table 5-38: Well Intervention Demand (Vessel Days) by Category 2015-2019 .................................................................................................................................................. 85
Table 5-39: Well Intervention Demand (Vessel Days) by Type 2010-2014 ......................................................................................................................................................... 86
Table 5-40: Well Intervention Demand (Vessel Days) by Type 2015-2019 ......................................................................................................................................................... 86
Table 5-41: Well Intervention Demand (Vessel Days) by Country 2010-2014 .................................................................................................................................................... 90
Table 5-42: Well Intervention Demand (Vessel Days) by Country 2015-2019 .................................................................................................................................................... 90
Table 5-43: Well Intervention Demand (Vessel Days) by Water Depth 2010-2014 ............................................................................................................................................ 91
Table 5-44: Well Intervention Demand (Vessel Days) by Water Depth 2015-2019 ............................................................................................................................................ 91
Table 5-45: Well Intervention Demand (Vessel Days) by Operator 2010-2014 .................................................................................................................................................. 92
Table 5-46: Well Intervention Demand (Vessel Days) by Operator 2015-2019 .................................................................................................................................................. 92
Table 5-47: Well Intervention Demand (Vessel Days) by Category 2010-2014 .................................................................................................................................................. 93
Table 5-48: Well Intervention Demand (Vessel Days) by Category 2015-2019 .................................................................................................................................................. 93
Table 5-49: Well Intervention Demand (Vessel Days) by Type 2010-2014 ......................................................................................................................................................... 94
Table 5-50: Well Intervention Demand (Vessel Days) by Type 2015-2019 ......................................................................................................................................................... 94
Table 5-51: Well Intervention Demand (Vessel Days) by Country 2010-2014 .................................................................................................................................................... 98
Table 5-52: Well Intervention Demand (Vessel Days) by Country 2015-2019 .................................................................................................................................................... 98
Table 5-53: Well Intervention Demand (Vessel Days) by Water Depth 2010-2014 ............................................................................................................................................ 99
Global Perspectives Subsea Well Intervention Market Report to 2019
© Infield Systems Limited 2015 20
Table 5-54: Well Intervention Demand (Vessel Days) by Water Depth 2015-2019 ............................................................................................................................................ 99
Table 5-55: Well Intervention Demand (Vessel Days) by Operator 2010-2014 ................................................................................................................................................ 100
Table 5-56: Well Intervention Demand (Vessel Days) by Operator 2015-2019 ................................................................................................................................................ 100
Table 5-57: Well Intervention Demand (Vessel Days) by Category 2010-2014 ................................................................................................................................................ 101
Table 5-58: Well Intervention Demand (Vessel Days) by Category 2015-2019 ................................................................................................................................................ 101
Table 5-59: Well Intervention Demand (Vessel Days) by Type 2010-2014 ....................................................................................................................................................... 102
Table 5-60: Well Intervention Demand (Vessel Days) by Type 2015-2019 ....................................................................................................................................................... 102
Table 5-61: Well Intervention Demand (Vessel Days) by Country 2010-2014 .................................................................................................................................................. 106
Table 5-62: Well Intervention Demand (Vessel Days) by Country 2015-2019 .................................................................................................................................................. 106
Table 5-63: Well Intervention Demand (Vessel Days) by Water Depth 2010-2014 .......................................................................................................................................... 107
Table 5-64: Well Intervention Demand (Vessel Days) by Water Depth 2015-2019 .......................................................................................................................................... 107
Table 5-65: Well Intervention Demand (Vessel Days) by Operator 2010-2014 ................................................................................................................................................ 108
Table 5-66: Well Intervention Demand (Vessel Days) by Operator 2015-2019 ................................................................................................................................................ 108
Table 5-67: Well Intervention Demand (Vessel Days) by Category 2010-2014 ................................................................................................................................................ 109
Table 5-68: Well Intervention Demand (Vessel Days) by Category 2015-2019 ................................................................................................................................................ 109
Table 5-69: Well Intervention Demand (Vessel Days) by Type 2010-2014 ....................................................................................................................................................... 110
Table 5-70: Well Intervention Demand (Vessel Days) by Type 2015-2019 ....................................................................................................................................................... 110
Table 7-1: Well Intervention Dayrates US$,000/day 2015-2019 ...................................................................................................................................................................... 140