MARKET VALUATION OF POSTEMPLOYMENT
74
MARKET VALUATION OF POSTEMPLOYMENT BENEFITS OTHER THAN PENSIONS By BARBARA J. ASKREN II Bachelor of Science in Business Administration University of Tulsa Tulsa, Oklahoma 1986 Master of Science University of Tulsa Tulsa, Oklahoma 1987 Submitted to the Faculty of the Graduate College of the Oklahoma State University in partial fulfillment of the requirements for the Degree of DOCTOR OF PHILOSOPHY December, 1991
Transcript of MARKET VALUATION OF POSTEMPLOYMENT
MARKET VALUATION OF POSTEMPLOYMENT
BENEFITS OTHER THAN PENSIONS
By
BARBARA J. ASKREN II
Bachelor of Science in Business Administration University of Tulsa
Tulsa, Oklahoma 1986
Master of Science University of Tulsa
Tulsa, Oklahoma 1987
Submitted to the Faculty of the Graduate College of the
Oklahoma State University in partial fulfillment of
the requirements for the Degree of
DOCTOR OF PHILOSOPHY December, 1991


Oklahoma HtRt~ IJniv. L.ibrary
C 0 P Y R I G H T
by
BARBARA J. ASKREN
1991

MARKET VALUATION OF POSTEMPLOYMENT
BENEFITS OTHER THAN PENSIONS
Thesis Approved:
bry. ~sis Advisor
a~c.~ Dean of the Graduate College
ii

ACKNOWLEDGMENTS
I wish to express sincere appreciation to Dr. Gary Meek
and all the members of my committee for their encouragement
and support throughout my graduate program. Without the
structure and scheduling that Dr. Meek enforced I would
surely still be working on my proposal. Special thanks go
to Dr. Lee Adkins, Dr. Lanny Chasteen, Dr. Charlotte Wright,
and Dr. Anne Gleason for their patience and many ideas that
greatly increased the quality of this research. Many thanks
also go to Dr. Dennis Patz, Dr. Janet Kimbrell, Dr. Torn
Wetzel, Dr. Chuck Ransom, Dr. Kevin Murphy, Dr. Michael
Thomas, Dr. Tim Kreibel, and all of the accounting faculty
for their inspiration and support during my years at
Oklahoma State University.
To my parents, Thomas and June Brockie, I extend thanks
for teaching me that nothing is achieved without hard work
and persistence. Last but certainly not least, I thank and
dedicate this work to my children, Ruth Ann and Elizabeth
Jane Askren, who perpetually remind me what life is all
about.
iii

TABLE OF CONTENTS
Chapter Page
I. THE RESEARCH QUESTION .. 1
Introduction. . . • . • . • . . • • 1 Principal Issues. • • • • • . . . • . . 4
Legal Issues . . . . . • . . . . . 5 Rational Expectations and
Efficient Markets. . . . • . . . 5 Capital Market Estimation. . • • . 8
Summary . . . . . . . . . . . . . . . . 9
II. RELATED RESEARCH 11
III.
Pension Research. . • • • . . . . . . . 11 Other Postretirement Benefits Research. 17 Conclusion. . . • • . • . • • • . • • • 22
METHODOLOGY •.. 25
Rationale for Approach. -. . • • . . . • 25 Theoretical Foundation. . . . • • . 2 7 Econometric Problem • . . • • • • . . . 32 Econometric Model . . . . • • • . • . . • • 33
IV. MODEL ESTIMATION AND RESULTS . 41
Data Collection Procedures and Test Period • • • • . . . • . . . . . 41
Estimation Results. . • • • . . . . . . 42
V. SUMMARY AND CONCLUSIONS •. 48
REFERENCES. 52
APPENDIXES •. 58
APPENDIX A - LIST OF SAMPLE FIRMS. 59
APPENDIX B - INDUSTRY MATURITY CLASSIFICATION OF FIRMS. . . . . . . . • . • . . • 61
APPENDIX C - INDUSTRY CLASSIFICATION OF FIRMS FOR MARKET VALUE OF ASSETS MODEL. • 65
iv
LIST OF TABLES
Table Page
I. Variables Used in Instrumental Variable Estimation of Market Value of Assets Model. . 35
II. Variables Used in Instrumental Variable
III.
Estimation of Other Postemployment Benefits Obligation Model. • • • • • . • • • . • • • . 38
Variables Used in Liability Valuation Equation and Predicted Signs of Estimated Coefficients ••••.•• 40
IV. Coefficients from the Instrumental Variable Estimation of Market Value of Assets. • • 43
V. Coefficients from the Two-Stage Least Squares Estimation of OPEBs Model and Market Value of Liabilities Model. • • • . • • • • • • • • 44
v

CHAPTER I
THE RESEARCH QUESTION
Introduction
In 1990 the Financial Accounting Standards Board (FASB)
issued Statement of Financial Accounting Standard (SFAS) No.
106, "Employers' Accounting for Postretirement Benefits
Other Than Pensions" (FASB, 1990) which requires accrual
accounting for the costs of retiree health benefits and life
insurance, beginning in 1992. The FASB states in SFAS No.
106 that the Board's conclusions
. result from the view that a defined postretirement benefit plan sets forth the terms of an exchange between the employer and the employee . • • It follows from the view that ... postretirement benefits are not gratui'iiies bu't·· are part of an employee's compensation for services rendered. Since payment is deferred, the benefits are a type of deferred compensation. The employer's obligation for that compensation is incurred as employees render the· services · necessary to earn their postretirement benefits (p. i).
Earlier accounting standards required that
postretirement costs be recorded when paid, with no
disclosure of a company's obligation for promised benefits.
SFAS No. 81 (FASB, 1984) required firms to disclose: a) a
description of the benefits provided and the employee groups
covered, b) a description of the employer's current
accounting and funding policies for those benefits, and
1

c) the cost of those benefits recognized for the period.
SFAS No. 81 was effective for periods ending after December
15, 1984. The FASB acknowledged that this disclosure did
not provide decision makers with adequate information, but
deferred further requirements until a task force appointed
by the FASB identified and addressed issues related to this
obligation. As a result of the research completed by the
task force the FASB issued an Exposure Draft of a proposed <
SFAS, "Employers' Accounting for Postretirement Benefits
2
Other Than Pensions" (FASB, 1989) that would require accrual
accounting for the costs of retiree health benefits and life
insurance, beginning in 1992. The Exposure Draft was
modified and SFAS No. 106, "Employers' Accounting for
Postretirement Benefits Other Than Pensions" (FASB, 1990)
was issued in December, 1990.
The notion to accrue the Other Postemployment Benefits
(OPEBs) obligation is controversial because it could have a
dramatically adverse effect on the financial statements of
many companies. Concerns expressed by groups such as the
Financial Executives Institute (FEI) and the Business
Roundtable, assert that accruing OPEBs would be too costly
for firms to implement. Actuaries are currently charging
small businesses anywhere from $10,000 to $20,000 a year to
calculate projected liabilities for retirees' medical costs
(Berton, 1991). Aside from the additional operational
expense of calculating the obligation, the reported
obligation and increase in current expense levels for OPEBs
could potentially project a weaker image for many firms.

Lee Seidler, an accounting specialist for and senior
managing director of Bear, Sterns and Co., warned that "If
this proposal [to accrue postretirement benefits] becomes a
rule, it could destroy the balance sheets and income
statements of U.S. companies" (Berton, 1989, p. A41).
3
SFAS No. 106 does provide some flexibility for
companies when they adopt the standard for the first time.
The liability associated with the unrecognized unfunded
accumulated postretirement benefit obligation--the
transition obligation--does not have to be immediately
accrued, but can either be immediately recognized as an
accounting change or it can be amortized over a plan
participant's future service periods, not to exceed 20
years. The FASB justifies allowing a choice in treatment of
the transitional obligation because of cost-benefit
considerations (Wall Street Journal, 12-24-90). However,
from the date of adoption onward, companies must recognize
each period's OPEBs cost on a full accrual basis.
The Securities and Exchange Commission (SEC) has issued
a requirement that employers that can measure what their
OPEBs obligation will be in January 1993 must disclose this
information to the SEC now (Rosenthal, 1990). Estimates of
the obligation vary. The Department of Labor places this
liability at $169 billion for all U.S. companies, a report
prepared for the House Select Committee on Aging puts the
aggregate obligation for the Fortune 500 companies alone at
nearly two trillion dollars (Employee Benefit Research
Institute, 1987), and the Wall Street Journal reports that

benefits analysts figure that the unfunded liability for
potential medical and insurance benefits for all U.S.
industries exceeds four billion dollars (Berton, 1989).
4
Many health benefit plans, a large component of OPEBs,
were instituted in the 1960s after the passage of Medicare.
At that time the plans were not very costly, but since the
1960s medical costs have risen dramatically. Some of the
reasons for these soaring costs are medical costs increasing
more rapidly than the overall rate of inflation, decreasing
Medicare reimbursements, the aging of the American work
force, longer life expectancy, and early retirement programs
which promise to pay health costs until Medicare takes
effect at age 65. Medicare has raised pre~iums and
deductibles in recent years, shifting more costs to
employers. Additionally, in some cases Medicare has become
the secondary payer, leaving employers primarily responsible
for the health care costs of beneficiaries.
Principal Issues
The FASB has expressed concern that the significant
obligation for OPEBs is not reflected in the financial
statements of firms that offer these OPEBs. The issues that
have yet to be resolved are whether this liability exists in
a legal sense (the FASB has determined that it does in an
accounting sense), whether the capital market is already
including an estimate of these liabilities in stock prices,
and whether reliable estimates of this liability can be made
(Searfoss and Erickson, 1988).

5
Legal Issues
The legally enforceable status of these obligations has
been contested in courts (e.g., United Steelworkers of
America, AFL-CIO v. Canron, Inc., Court of Appeals of New
Jersey, 1978; UAW v. Yard-Man, Inc., 1983; Eardman v.
Bethlehem Steel, Inc., 1983; Moore v. Metropolitan Life,
1988; Musto v. American General, 1988) and the courts have
found the employer's legal commitment to be very much
dependent on its verbal and written representations. At
this time the legal status of OPEBs is uncertain, as the
courts continue to consider the issue on a firm by firm
basis.
Rational Expectations and
Efficient Markets
The issue of whether capital markets are already
including an estimate of this obligation in pricing common
stock can be discussed in a rational expectations context.
The rational expectations hypothesis (REH) suggests that the
subjective probability distributions of economic actors
equal the objective probability distributions in the system.
Muth (1961), in formulating the REH, suggests that if
the underlying economic system changes, one would expect
economic actors, at least after a certain amount of time, to
change the way that they form their expectations. Muth's
rational expectations hypothesis equates two distinct
concepts: (1) the economic actors' subjective,

6
psychological expectation of economic variables, and (2) the
mathematical conditional expectation of those variables. In
other words, people's subjective expectations are, on
average, equal to the true values of the variable. According
to this approach, there is a connection between the beliefs
of individual economic actors and the actual stochastic
behavior of the system.
Muth also argues that individuals' expectations need
not be identical in order for economists to use the REH
since individuals' expectations should be distributed around
the true expected value of the variable to be forecasted
(Sheffrin, 198i) •
In this study, the "economic actors" are capital market
participants and the "variable to be forecasted" is the
"true" value of the firm. In modeling the OPEBs obligation,
the valuation at time t is conditional on the information
set available at time t-1. Since the current OPEBs
expenditure is disclosed by firms, market participants are
presumed to estimate the present value of the promised
future benefits based on this available information set.
The rational expectations hypothesis has be~n applied
to research in financial markets under the name of the
"efficient markets model." The efficient markets model
asserts that prices of securities are freely flexible and
reflect available information, and that prices are related
to conditional expectations (Sheffrin, 1983). If the price
of a security today is equal to the conditional expectations
of tomorrow's price, then the change in price between today

and tomorrow is analogous to a forecast error, which is
uncorrelated with any available information (Fama, 1970).
Grossman (1976) terms this a rational expectations
equilibrium, where the market clearing price summarizes all
the information available to market participants. Market
efficiency implies that capital market participants (i.e.,
buyers and sellers of common stock) quickly incorporate a
broad range of publicly available information in setting
stock prices. Publicly available information includes--but
is not limited to--the information disclosed in corporate
financial statements prepared by accountants. Fama (1970)
defines three major forms of market efficiency: weak,
semi-strong, and strong. There is substantial empirical
literature supporting the position the U.S. capital market
is efficient in the semi-strong form (e.g., Beaver (1968),
May (1971), Ball _and Brown (1968), Brown and Kennelly
7
(1972), Beaver, Lambert and Morse (1980), Lev and Ohlson
(1982), Patell and Wolfson (1984), and Ball (1990)).
However, testing the notion of market efficiency (a market
is efficient with respect to particular information if it
uses that information to "correctly" set prices) requires a
theory and test of the unobservable statistic "correct
prices." Critics (e.g., Grossman and Stiglitz, 1980) of
some of the studies of market efficiency assert that two
models are being jointly tested--the capital asset pricing
model (CAPM) and the efficient market model. The CAPM is a
model of expected returns that follows a two-parameter asset

pricing procedure (Sharpe, 1964; Lintner, 1965; Mossin,
1966). Anomalies have been found with tests of the CAPM by
Black (1972), Roll (1977), Ball (1978) and Watts (1978).
Capital Market Estimation
8
Cross-sectional capital market research in accounting
utilizes two primary models': (1) market models that examine
changes in security prices (i.e., returns) as they are
related to accounting earnings (e.g., Ball and Brown (1968),
Lipe (1990), and Ohlson (1991)), and (2) models that examine
levels of security prices as they are related to elements of
the firm (e.g., Landsman (1986), Shevlin (1991), and Barth
(1991)). The price change models normally rely on the
market model (Fama, 1970) to obtain their estimates; the
price level models do not (Landsman and Magliolo, 1988).
The price-level models measure assets and liabilities on a
before-tax basis, as present values of future cash flows.
The coefficients obtained by the regressions on some of
these variables are used as capitalization rates to obtain
an estimate of the market valuation of those variables
(Grant, 1989; Shevlin, 1991). This study assumes the
semi-strong form of market efficiency, adopts the Miller
(1977) model which assumes that the tax advantage of debt
need not be incorporated, and utilizes a price level model
which estimates the unobservable variable OPEBs as a
component of stock price.

9
Summary
An important implication of capital market studies,
such as Landsman (1986), Grant (1990), Shevlin (1991), and
Barth (1991), is that market participants price traded
stocks according to the market equilibrium value of the
components of the firm. The financial statements of firms
are a primary source of information about these
firm-specific components, but there are alternative sources
of information used in the valuation of common stock, such
as public announcements by firms in the financial press. As
such, there are off-balance sheet elements that the market
apparently includes in the valuation process (see, for /
example, Section 2.1 on pension research) that accounting
standards have not always required to be reported because of
either measurement uncertainties or conservatism. For
example, some accountants have questioned the value and
reliability of including the OPEBs obligation on balance
sheets, since the computation requires estimates of
uncertain future events. Others argue that this corporate
liability is both estimable and probable, meeting the
requirements for accruing a contingent liability (FASB,
1989) according to SFAS No. 5 (FASB, 1975). In SFAS. No.
106, the FASB acknowledges difficulties in measuring OPEBs,
but notes that "best estimates" are superior to implying--
by a failure to accrue--that no obligation exists prior to
the payment of benefits:
The board believes that failure to recognize an obligation prior to its payment impairs the usefulness and integrity of the employer's financial statements (p. i).

10
If capital markets are efficient with respect to
information about the obligation for OPEBs, then an estimate
of the OPEBs obligation should be included in the valuation
of fir~s by market participants, assuming rational
expectations. This study uses a system of equations to
estimate the unobservable OPEBs obligation for a sample of
100 firms for the years 1987, 1988, and 1989. It then tests
the OPEBs estimate as a component of stockholder's equity,
as measured by stock prices. This procedure produces an
econometrically consistent estimate of the OPEBs obligation
and tests whether this estimate is being used by capital
market participants in setting stock prices. The next
chapter discusses research related to the issue of valuation
of off-balance sheet obligations, specifically pension
obligations and OPEBs obligations.
CHAPTER II
RELATED RESEARCH
Pension Research
SFAS No. 106 is similar to the 1985 pronouncement on
accounting for pension obligations, SFAS No. 87 (FASB,
1985). Prior to SFAS No. 87, unfunded pension obligations
were not accrued as liabilities on corporate balance sheets.
Instead, certain characteristics were disclosed in the notes
to the financial statements. Accounting Principles Board
Opinion No. 8, "Accounting for the Cost of Pension Plans"
(APB, 1965) required companies to disclose the excess of the
actuarially computed value of vested benefits over the total
of the pension fund and any balance-sheet pension accruals,
less any pension prepayments or deferred charges. Statement
of Financial Accounting Standards No. 36 (FASB, 1980)
required that the amount of accumulated vested benefits, the
range of actuarial rates used in the valuation, the date of
valuation, and any material changes in the actuarial
assumptions be disclosed in the notes to the financial
statements.
Although these obligations were kept off the balance
sheet, financial analysts were incorporating estimates of
the pension obligation from firm disclosures in determining
11

the stock prices of firms with unfunded pension plans
(Oldfield, 1977; Gersovitz, 1980; Feldstein and Seligman,
1981; Feldstein and Morek, 1982; Morris, Nichols and
Niehaus, 1983; Landsman, 1986).
12
Oldfield (1977) examines the effect of the unfunded
vested benefit obligations (UVB) on the common stock value
of the firm and concludes that the UVB is viewed by the
capital market as a fairly accurate but somewhat understated
representation of the true obligation. Gersovitz (1980)
re-estimates Oldfield's model and finds the coefficient for
UVB obligations to be significantly higher in absolute value
for firms with a net worth sufficiently large to make them
liable for the entire unfunded obligation according to the
Employees Retirement Income Security Act (ERISA) of 1973.
ERISA holds the company liable for up to 30% of total net
worth for pension liabilities. Feldstein and Seligman
(1981) extend Oldfield's. model by utilizing inflation
adjusted data for corporate assets for 1976 and 1977. Their
estimated model utilizes Tobin's Q (Tobin and Brainard,
1977) where the market value of the firm (including both
debt and equity) is proportional to the replacement cost of
the underlying assets: V = Q * A, where V is the market
value of the net assets of the firm, A is the "tangible"
assets, or assets on the balance sheet, and the value of Q
depends on several factors, including the ability of the
firm to provide above-average earnings, the riskiness of the
firm, and such off-balance sheet obligations as the unfunded

vested pension liability (UVPL). Their results indicate
that pension liabilities reduce the market value of firms.
13
Feldstein and Morek (1982) examine the interest rate
assumptions used by firms to discount future pension benefit
obligations. Their study uses the Feldstein and Seligman
(1981) model of firm valuation discussed above where the
UVPL is re-estimated by using the reported discount rate, a
standard discount rate for all firms set to the current Baa
bond rate, and an average (for all firms) discount rate.
The choice of interest rates by firms reflects the funded
status of the firm's pension plan. Firms with underfunded
pension plans tend to choose low interest rate assumptions
in order to increase the tax advantages of early funding.
Investors seem to see through this strategy and value firms
as if the obligations are figured at an average interest
rate. The market appears to weight underfunded plans more
than overfunded plans, which this may be so because the firm
is liable for the net obligation but has no property rights
on the net assets of an overfunded plan, unless the plan is
terminated. Morris, Nichols and Niehaus (1983) also study
pension interest rates and find that the firm's pension
discount rate is unlikely to be used by the market in
calculating value because these rates are chosen by the
firms based on their pension fund's level of fundedness and
tax considerations. They conclude that the market uses a
common cross-sectional interest rate to calculate pension
liabilities.

14
Landsman's (1986) study examines whether pension fund
assets and liabilities are valued by the market as corporate
assets and liabilities. His results are consistent with the
notion that pension fund property rights lie fully with the
firm--i.e., the market prices pension fund assets and
liabilities as corporate assets and liabilities. His model
is based on the accounting identity price levels model
rather than on an earnings based model. His model
MVE = a 1MVA + a 2MVL + a 3PA + a 4PL (2.1)
is estimated with
MVE =market value of stockholders' equity (the stock price at year end times the number of common shares outstanding)
MVA = market value of corporate assets estimated by balance sheet values (using both historical and current cost)
MVL = market value of corporate liabilities estimated by balance sheet values (both historical and current cost)
PA = market value of pension assets obtained from the AICPA data base on corporate pensions
PL = pension liabilities obtained from the AICPA data base on corporate pensions, as given and adjusted for a common discount rate of ten percent assuming a 25-year annuity.
Landsman's use of book value of assets as a surrogate for
the market value of assets introduces the "errors in
variables" econometric problem and as a result his estimates
are biased and inconsistent. Landsman also suggests that
the presence of a large, non-zero, statistically significant
intercept term throughout the study may be capturing the
effect of a potentially correlated omitted variable. Since

15
the OPEBs obligation is correlated with pension obligation,
Landsman's intercept term may be incorporating some of the
effect of this omitted variable.
In a study related to Landsman, Barth (1991)
investigates the degree of measurement error in comparing
different measures of pension assets and liabilities. She
compares three pension asset alternatives: the fair value
of plan assets, the amount of pension asset recognized in
the balance sheet before the minimum liability provisions
became effective, and the asset to be recognized on the
balance sheet per SFAS No. 87, which takes into
consideration the additional minimum liability. Pension
liability alternative measures are also compared: the
accumulated benefit obligation, the vested benefit
obligation, the projected benefit obligation, the pension
liability recognized on the balance sheet before
consideration of the additional minimum liability, and the
balance sheet liability per SFAS No. 87 which takes into
consideration the additional minimum liability. The
measurement error is modeled by first taking Landsman's
(1986) assumption that if assets and liabilities were
measured without error, then the coefficients from the
regression
MVE = a 1MVA + a 2MVL + a 3PA + a 4PL
should be +1, -1, +1, and -1 respectively. Following
Landsman, she estimates
(2.1)
(2.2)
where BVA and BVL are the book values of total nonpension

assets and liabilities, and PA. and PL. are the ith 1 1
alternative measure of the pension asset and liability,
respectively. The estimates of o from equation (2.2) are m
16
biased estimates of the theoretical coefficient of 1 due to
measurement error. A difference term model developed by
Garber and Klepper (1980) is then used to calculate the
impact of the measurement error covariance structure on the
bias in the estimated regression coefficients. Equation
(2.2) is then estimated by setting o = 1- B , where B is m m m
the coefficient bias derived by the Garber and Klepper
difference model. The measurement error variance obtained
by each pension measure is then compared to the variance
obtained by the other measures. Her conclusions are that
(1) footnote disclosures about pensions are closer to those
assessed in market valuations than are the measures
recognized in the balance sheet and (2) investors appear to
include expectations about future salary progression in
assessing pension liabilities, but view the projected
pension benefit obligation measure as "noisy."
Barth's study directly addresses the issue of the
presence of measurement e~ror in using accounting data as a
surrogate for economic data. Her study extends Landsman's
in that her model uses the valuation model developed by
Landsman but takes into account the errors-in-variables
problem in her development of a ranking procedure for the
pension estimates. The present study also uses the
valuation model developed by Landsman and extends the model
by developing instrumental variables for the independent

17
variables that are measured with error. However, unlike
Barth, who uses a difference term model, the present study
employs a two-stage least squares simultaneous estimation
model.
Other Postretirement Benefits Research
Research in the area of OPEBs has just begun.
Discussed in this section are Grant's (1989) cross-sectional
study of the OPEBs obligation as a component of firm value,
and the Financial Executives Research Foundation's (FERF)
(1989) field study of the effect of the FASB's 1989 Exposure
Draft on 25 companies.
Grant (1989) adapts Landsman's model (i.e., Equation
2.1) to estimate the marketis valuation of OPEBs in 1984,
1985, and 1986. She incorporates a-measure of off-balance
sheet assets developed by Hirschey and Weygandt (1985),
along with an estimate of the OPEBs obligation. Her model
is also adapted from Feldstein and Seligman's (1981) study
referred to earlier, which incorporates Tobin's Q as a
measure of off-balance sheet assets. Tobin and Brainard
(1977) define the ratio Q as a measure of the firm's
potential to earn additional returns based on intangible
assets. 1
Hirschey and Weygandt (1985) hypothesize that the ratio
Q is a function of variables representing earnings, growth,
1The term "intangible" used here has a different meaning than it does in a traditional accounting context. It represents off-balance sheet assets, not assets on the balance sheet which lack a physical substance.

18
research and development, corporate debt, and beta (as a
risk measure). Grant utilizes Hirschey and Weygandt's
variables for intangible assets in her estimation of Q.
According to Grant, Q is considered to be a function of R&D
levels, advertising levels, a growth factor, and a risk
factor. In her model, the market value of total assets
(MVA) is equal to the replacement cost of tangible assets,
(MVT), multiplied by a proportionality factor, Q. Then,
MVA = (Q) * (MVT), and Q = MVA/MVT. (2.3)
The market value of the firm's equity (MVE) equals the
market value of its total assets (MVA) less its total
liabilities (MVL): MVE = MVA - MVL. By substitution,
MVE = [(Q) * (MVT)] - MVL. (2.4)
Incorporating the estimates for Q in equation (2.4) obtains
the model:
MVE = [a 0 + a 1 (R&D/Sales) + a 2 (ADV/Sales) +
a 3 (GROWTH) + a 4 (RISK) + E] * MVT- MVL. (2.5)
The market value of the firm's liabilities (MVL) includes
all obligations of the firm, both on- and off-balance sheet
components. The off-balance sheet long term liabilities
include obligations for employee retirement benefits, both
the pension obligation (PM) and OPEBs (which she refers to
as OPRBs), as well as other off-balance sheet liabilities,
which are assumed to be equal to zero. The pension
obligation is proxied by two different measures--the annual
pension expense and net pension liability, calculated as the
projected benefit obligation minus the fair value of pension
assets.

19
Grant estimates her model by the following regression
equation. She obtains the equation by assuming that MVT,
the replacement cost of tangible assets, equals the book
value of tangible assets, BVT, and then dividing equation
(2.5) by BVT:
MVE/BVT = s0 + S1 (R&D/Sales) + s2 (ADV/Sales) +
s3 (GROWTH) + s4 (RISK) + s5 (STL/BVT) +
86 (LTL/BVT) + 87 (PM/BVT) +
s8 <oPRB/BVT) + E. (2.6)
where:
MVE/BVT = market value of equity standardized by book value of tangible assets,
R&D/Sales = 5-year sum of research and development expenses divided by 5-year sum of sales,
ADV/Sales = 5-year sum of advertising expenses divided by 5-year sum of sales,
GROWTH = fthe 5th ropt of (current year sales/sales 5 years prior] -1 (the geometric average of the growth of sales) ,
RISK = !/coefficient of variation over 5-year period of annual changes in EPS,
STL/BVT = book value of short term liabilities, standardized by book value of tangible assets,
LTL/BVT = the sum of long term liabilities and capitalized preferred stock dividends, standardized by book value of tangible assets,
PM/BVT = pension measure,
OPRB/BVT = OPRB current expenditure standardized by book value of tangible assets, and
E = error term, assumed to be distributed iid normal.

20
The two samples selected for her study are firms chosen from
the SFAS No. 36 pension data tape (60 firms) for the years
1984, 1985, and 1986, and firms chosen from the 1986 Fortune
100 for the years 1984 and 1985. Overall, her results are
consistent with the association of OPRB expenditure
disclosures and firm market value. The coefficients of the
OPRB measure are consistent with the market's impounding
into firm valuation a measure of liabilities for
postretirement benefits other than pensions. However, her
method of estimating the OPEBs obligation (by using the
current year OPEB expense) and her surrogate for the market
value of tangible assets (book value of assets) introduce
measurement error into her model, which leads to
inconsistent and biased estimates of OPEBs. Grant's study
is the first empirical investigation into OPEBs as a
component of firm value.
The Financial Executives Research Foundation (FERF)
(1989) sponsored a field test study conducted by Coopers and
Lybrand to assess the impact of accounting for retiree
health benefits on the financial statements of firms. The
study used retirement benefit and current cost data from 25
companies, each of which had 1988 revenues in excess of $250
million, with most in excess of $1 billion.
The FERF study examines the impact of the Exposure
Draft (ED), "Employers' Accounting for Postretirement
Benefits Other Than Pensions." Results indicate that for
"highly mature" companies with almost as many retirees as
active employees, expenses range from less than two, to six

21
times current pay-as-you-go costs. For "mature" companies
(i.e., those with a significant number of retirees), OPEBs
expense under the ED ranges from two and one-half to greater
than seven times higher than under pay-as-you-go accounting.
For "immature" companies with few retirees, pay-as-you-go
costs are minimal and the multiple of pay-as-you-go costs is
much higher. Higher e~pense both increases recorded
liabilities and decreases net worth, affecting many
companies' key ratios, potentially placing them in default
of debt covenants and other restrictions. The OPEBs
liability is modeled under two scenarios: (1) by using the
methodology proposed in the ED, namely prospective
recognition of the transition obligation, and (2) by
analyzing the effect of immediate recognition of the
transition obligation on income, total liabilities and
stockholder's equity. The second scenario is consistent
with the rational expectations hypothesis that capital
market participants view the transition obligation as a
liability of the firm, regardless of the accounting
treatment. To account for the income tax effect under SFAS
No. 96, three alternative assumptions are applied to the
three scenarios:
(1) The higher expense under accrual accounting is
fully tax-effected using a 34% effective U.S.
federal tax rate, ignoring other taxes.
(2) One-half of the higher expense will be tax-effected
(34% rate); the other half would go directly to
reduce net income, dollar for dollar.

22
(3) None of the higher expense will be tax-effected but
will reduce net income dollar-for-dollar--the
so-called "naked debit" situation under SFAS No.
96.
The first assumption assumes that the current year expense
is fully tax-deductible in that year. The second assumption
assumes that the current year expense for OPEBs is not fully
tax-deductible, and reduces net income dollar for dollar.
Hypothetical companies are designed to simulate the two
scenarios and the three assumptions. The increase in the
companies' total liabilities under the ED ranges from less
than 0.5 percent to greater than 2 percent, with the median
effect between 0.5 and 1 percent. However, if the entire
accumulated postretirement benefit obligation is used, the
increase in total liabilities ranges from less than 3
percent to a high of 20 percent. The study finds that
immediate recognition of the transition obligation can
significantly reduce stockholders' equity and increase a
company's debt-to-equity ratio. The impact of the ED
approach is less drastic, but still very significant.
Conclusion
The pension related studies in this section are
consistent in finding that market participants include the
net pension obligation in valuing share prices before it was
required to be accrued on corporate balance sheets
(Oldfield, 1977; Gersowitz, 1980; Feldstein and Seligman,
1981; Feldstein and Morek, 1982; Landsman, 1986). Research

23
also suggests that the market weighs the unfunded net
pension obligation more than the net pension asset when the
pension plan is overfunded (Feldstein and Seligman, 1981;
Feldstein and Morek, 1982; Morris, Nichols and Niehaus,
1983). Footnote disclosures about pensions are found to be
closer to those assessed in market valuations than are the
measures recognized in the balance sheet, and investors
appear to include expectations about future salary
progression in assessing pension liabilities, but view the
projected benefit obligation measure as noisy (Barth, 1991).
The OPEBs related studies attempt to estimate the OPEBs
obligation. Grant examines the annual OPEBs expense (used
as a surrogate for the OPEBs liability) as a component of
firm value in her cro~s-sectional study for the years 1984,
1985, and 1986. The coefficient for the OPEBs expense
ranges from -13.64 to -30.52 but because of measurement
error in her model, the coefficients are inconsistent and
biased and are therefore suspect.
The FERF study attempts to estimate the obligation on a
firm-by-firm basis for a sample of 25 companies, and
estimates the effect that the ED would have on the current
year's expense and on total liabilities. Many different
assumptions and scenarios are modeled with the field test
results reported. Both studies illustrate the potential
impact that this ED can have on firms' net income and
published net worth. The information set available to
investors has changed considerably since these studies were
completed now that employers are keeping better statistics

on retiree costs and promised benefits (Searfoss and
Erickson, 1988).
24
In this study, the OPEBs obligation is estimated by a
system of equations using two-stage least squares. The
estimates are then tested for significance as components of
firm value. Unlike previous studies (e.g., Landsman (1986),
Grant (1989), and Barth (1991)) this estimation procedure
yields consistent coefficients of an off-balance sheet
liability, the OPEBs measure. The OPEBs obligation is
estimated and the market effects are tested for the years
1987, 1988, and 1989.

CHAPTER III
METHODOLOGY
Rationale for Approach
Grant (1989) assumes that capital market participants
use book value of tangible assets as the measure of market
value and that they use the current year OPEBs expense as
the measure of the OPEBs obligation. Using the book value
of assets and liabilities and the OPEBs expense as
surrogates for economic values results in a measurement
error problem. When independent variables in an ordinary
least squares (OLS) regression are measured with error, a
basic econometric assumption is violated, namely that
observations on independent variables can be considered
fixed in repeated samples. As a result, Grant's OLS
estimator for the OPEBs effect is biased and inconsistent.
When measurement error exists in right-hand-side
variables of a regression equation, the observed variables
are not independent of the error term. Each regressor
consists of two components, one of which is systematic, the
other of which is random. If the independent variables are
measured without error, then the expected value of the
random component of the regressor is zero. The reason for
25

26
the lack of consistency is that the observed regressor, X., J.
is correlated with the errors of the model. One solution to
this problem is to find a set of variables that are
correlated with the Xi and uncorrelated with the regression
errors. This set of instrumental variables is regressed on
the Xi and the predicted values from this equation are used
to replace the X .• This "two-stage" procedure yields J.
consistent and asymtopically unbiased estimates of the
effects of Xi on the mean of the dependent variable
(Zellner, 1970; Bowden and Turkington, 1984; Pagan, 1984).
The unobservable OPEBs obligation is estimated by
relating the unobservable variable to one or more observable
variables that are correlated with it. The correlated
variables are regressed on the closest measure that we have
of OPEBs--the OPEBs annual expense. The predicted value
from this equation is used as a measure of the OPEBs
obligation. This two-stage least squares procedure provides
consistent estimates of the OPEBs obligation on the market
value of firms.
The variables in the estimation procedure are items of
information that are publicly available. Though the FERF
(1989) field study uses company specific private data to
measure the OPEBs obligation, capital market participants do
not have access to private information relating to OPEBs.
Therefore, they must estimate the obligation by using
publicly available information, as this study does.

Theoretical Foundation
Equity can be defined as the difference between the
assets and liabilities of the firm. When assets and
liabilities are measured at market value, the equation
becomes:
27
MVE = MVA - MVL (3.1)
where
MVE = market value of equity,
MVA = market value of assets, and
MVL = market value of liabilities.
The market value of equity is determined by taking the
closing stock price times number of shares of common stock
outstanding at a point in time. The market values of assets
and liabilities are not observable: book values reported in
the financial statements are reported at historical cost
rather than at current market value, and may not contain all
of the assets and liabilities that the market considers in
valuing the firm. The OPEBs obligation is theorized to be
one such example of an off-balance sheet item. Since these
variables are unobservable, an instrumental variable
estimator is used in place of the unobservable variable in
order to obtain consistent estimation results. Instrumental
variables must be correlated with the unobservable variable,
but uncorrelated with other omitted effects and measurement
error which are usually captured in the equation's error
term.

28
Prior research has suggested that the valuation of
assets is dependent on the present value of cash flows
associated with the operations of the firms and many
accounting theorists believe that the discounted present
value of the expected net cash flows of an asset constitutes
the conceptually 'best' measure of an asset (Revsine, 1973).
Others have suggested adding factors of "Q," the ability of
the firm to provide above-average earnings, to the tangible
assets (assets listed on the balance sheet). The most
important fac~or~ identified in the literature representing
"Q" are capitalized R&D expenditures, capitalized
advertising expenditures, a growth factor for the firm, and
a risk factor. Peles (1970), Picconi (1977), Lindenberg and
Ross (1981), and Ross (1983) agree that factors representing
excess earnings of the firm, riskiness, R&D expenditures and
advertising should be included in the assets of the firm.
Hirschey and Weygandt (1985) and Etteredge and Bublitz
(1989) examine the relationship between firms' market value
and current period advertising and R&D outlays. Both
studies conclude that advertising and R&D are long-lived and
should be capitalized and amortized over time rather than
expensed when incurred. An industry effect is included to
account for other off-balance sheet assets particular to
industries such as the oil and gas industry. Therefore, the
following model for the market value of assets is developed
and utilized:
MVA = f(present value of net operating cash flows, capitalized R&D, capitalized advertising expenditures, growth, risk, and industry classification). (3.2)
29
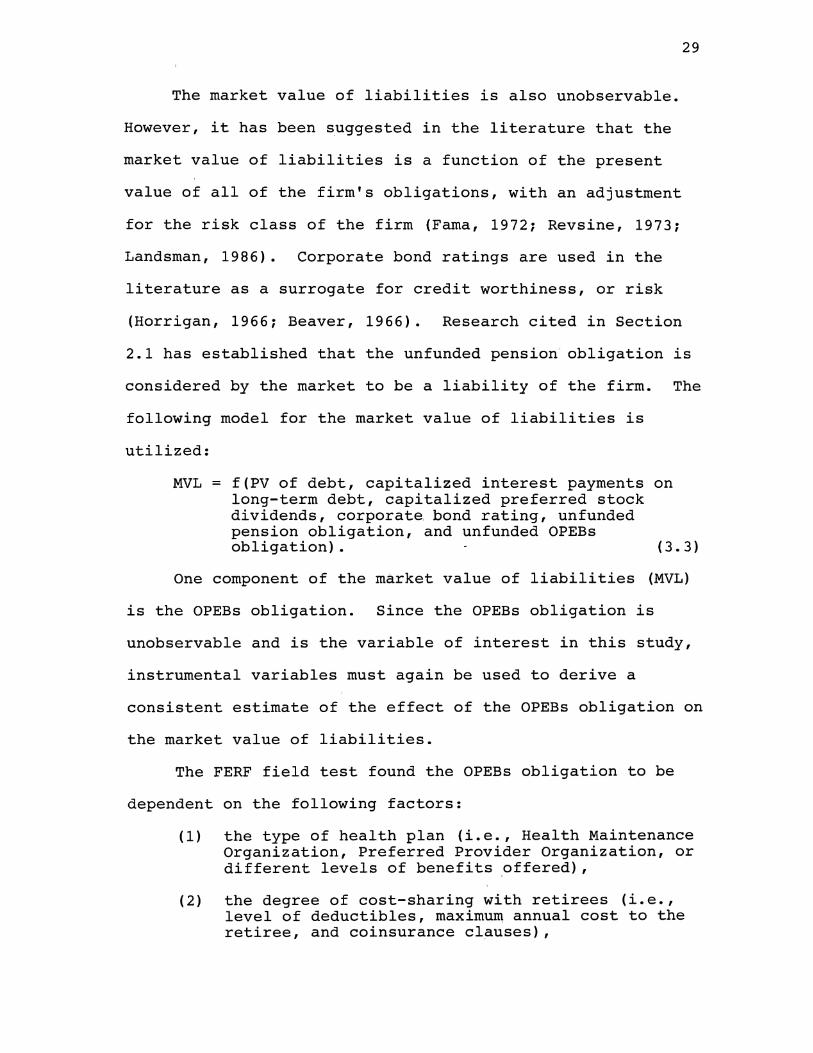
The market value of liabilities is also unobservable.
However, it has been suggested in the literature that the
market value of liabilities is a function of the present
value of all of the firm's obligations, with an adjustment
for the risk class of the firm (Fama, 1972; Revsine, 1973;
Landsman, 1986). Corporate bond ratings are used in the
literature as a surrogate for credit worthiness, or risk
(Horrigan, 1966; Beaver, 1966). Research cited in Section
2.1 has established that the unfunded pension obligation is
considered by the market to be a liability of the firm. The
following model for the market value of liabilities is
utilized:
MVL = f(PV of debt, capitalized interest payments on long-term debt, capitalized preferred stock dividends, corporate bond rating, unfunded pension obligation, and unfunded OPEBs obligation). (3.3)
One component of the market value of liabilities (MVL)
is the OPEBs obligation. Since the OPEBs obligation is
unobservable and is th~ variable of interest in this study,
instrumental variables must again be used to derive a
consistent estimate of the effect of the OPEBs obligation on
the market value of liabilities.
The FERF field test found the OPEBs obligation to be
dependent on the following factors:
(1) the type of health plan (i.e., Health Maintenance Organization, Preferred Provider Organization, or different levels of benefits ,offered),
(2) the degree of cost-sharing with retirees (i.e., level of deductibles, maximu~ annual cost to the retiree, and coinsurance clauses),

(3) Medicare reimbursement method (i.e., carve-out, coordination of benefits, or exclusion),
(4) the age and sex of retirees and dependents,
(5) the health care cost trend,
(6) the discount rate, and
30
(7) the ratio of the number of active employees to the number of retirees.
The ratio of the number of active employees to the
number of retirees was identified by the FERF study as one
of the most important factors in determining the magnitude
of the OPEBs obligation. The FERF study divided the 25
companies by maturity classes to assess the impact of the
FASB's 1989 ED. The three classes were highly mature (less
than two actives per retiree), mature (two to six actives
per retiree) and immature (more than six actives per
retiree) • The study found that the smaller the
active/retiree ratio, the larger the firm's OPEBs
obligation.
Most of the factors identified by the FERF study
relating to the OPEBs obligation are not publicly available
and rarely available even privately. This is because most
companies have third-party administrators (TPAs) who take
care of their medical claims, and the TPAs have only
collected information from the companies that directly
affect the payment of claims. Therefore, because of data
restrictions, it is assumed that the market is estimating
the OPEBs obligation based on publicly available information
only. To estimate the OPEBs obligation it is necessary to
relate the unobservable variable, OPEBs, to observable

factors that are correlated with OPEBs. Information
concerning the first four factors above are generally
unavailable. The health care cost trend rate and the
discount rate are not firm-specific factors, and thus are
systematic variables that would be constants in a
regression. The ratio·of retired to active employees is
also unavailable but can be estimated by the following
factors:
31
(1) The age of a business - the older a business, the
more retirees it is likely to have; therefore, the
larger the OPEBs obligation.
(2) The labor intensiveness of a firm - estimated by
the proportion of employee compensation expense to
total operating expense. The more labor intensive
a firm, the larger the OPEBs obligation.
(3) The industry cl~ssification of the firm - this
effect may be important in estimating the OPEBs
obligation because of industry-wide b~nefit
patterns and retiree health costs. For example,
industries that expose workers to dangerous
chemicals will have higher health costs, and a
larger OPEBs obligation.
(4) The unionization of the firm - unions increase the
probability that firms offer OPEBs and the level
of benefits because of the union's bargaining
power on behalf of the employees. The more
unionized a firm, the larger the OPEBs obligation.

32
(5) The current year pension expense - the higher the
annual pension expense, the higher the
retiree/active employee ratio, and the larger the
OPEBs obligation.
Therefore the following model for the OPEBs obligation is
utilized:
OPEBs obligation = f(age of business, labor intensiveness, industry, unionization~ and pension expense)
Econometric Problem
The econometric objective is ~o use available
information to estimate the effect of OPEBs on MVE. By
holding MVA constant the effects of OPEBs on MVL can be
(3.4)
evaluated. While reliable data on MVE are available, (the
closing stock price times common shares outstanding), MVA as
well as MVL are not observable. The closest accounting
information about MVA and MVL that is available is the book
value of assets (BVA) and the book value of liabilities
(BVL). Therefore, it can be posited that:
MVA = BVA + error (3.5)
and that the error term contains the omitted effects of
market value. By rewriting (3.5):
BVA = MVA - error (3.6)
the model for MVA is obtained.
MVL is calculated by utilizing the identity:
MVE = MVA - MVL, or
MVL = MVA- MVE (3.7)
33
These models are used to estimate the effects of OPEBs on
MVE holding MVA constant, and hence the effects on MVL.
The OPEBs obligation is also unobservable. The only
data reported by fi~ms that directly relates to the OPEBs
obligation is the current year's OPEBs expense. This
variable can be used as a measure of the OPEBs obligation,
measured with error:
OPEBs obligation = OPEBs expense + error, or
OPEBs expense = OPEBs obligation - error. ( 3. 8)
Econometric Model
The following three equations developed above plus the
identity (Equity = Assets - L'iabilities) form a model which
is estimated using two-stage least squares:
BVA = MVA + error
MVL = MVA - MVE
OPEBs expense = OPEBs obligation + error
Substituting (3.2) into (3.9) yields:
(1) BVA = a. O + a. 1 (PVCF) + a. 2 (ADV) + a. 3 (R&D) +
a. 4 (IND) + a. 5 (GROW) + a. 6 (RISK) + u
where:
( 3. 9)
(3.10)
(3.11)
(3.12)
PVCF = Present value of net operating cash flows, as estimated by operating income,
ADV=
R&D =
Capitalized advertising (5-year sum of advertising expenses)
Capitalized research and development (5-year sum of research and development expenses) ,

IND =
GROW =
RISK =
u =
Industry by dummy variable grouping firms into major industry classes, and
Geometrical rate of return over 5 years of sales,
Corporate bond rate,
Error term, assumed to be distributed iid with~= 0 and variance a2.
34
MVA is estimated by using the least squares predictions from
(3.12), denoted MVA. Research and development expenses and
advertising expenses are divided by sales to allow for
greater comparability across firms. The corporate bond
rate, as reported by COMPUSTAT is used as a measure for
risk. The growth in sales of the sample firms is estimated
by taking the geometric average rate of return for five
years of sales (Grant, 1989). Industry groupings follow the
industry classification system on the COMPUSTAT database
(see Appendix C). Natural resource firms comprise the first
category of industries, computer and software development
firms comprise the second category, and all other firms
comprise the third category. This categorization attempts
to identify industries that may have significant off-balance
sheet assets. The error term includes measurement error
associated with BVA as well as omitted effects from (3.2) in
~ estimating MVA. Table I summarizes variable definitions for
the BVA model.
Consistent estimation of the effect of the OPEBs
obligation on the market value of the firm requires a
measure of OPEBs which is not correlated with the errors in
the regression equation in which it appears as an

TABLE I
VARIABLES USED IN INSTRUMENTAL VARIABLE ESTIMATION OF MARKET VALUE OF ASSETS MODEL
35
VARIABLE DEFINITION
BVA
PVCF
ADV
R&D
IND
GROW
RISK
u
Book value of total assets
Present value of net operating flows, as estimated by operating income
Capitalized advertising (5-year sum of advertising expenses)
Capitalized research and development (5-year sum of research and development expenses)
IND1 = 1 (Categorical variable for natural resource firms), and IND2 = 1 (Categorical variable for firms in high-tech industries)
Geometrical rate of return over 5 years of sales
Corporate bond rate
Error term, assumed to be distributed iid with ~ = 0 and variance

36
independent variable. The estimation of the OPEBs
obligation and the use of this generated regressor as an
independent variable in the liability valuation model can be
viewed as a two-stage least squares (2SLS) procedure
simultaneously estimated. The OPEBs obligation is estimated
using the least squares prediction from the following
equation:
(2) OPEBs expense = 00 + 01 (AGE) + 02 (LA,BOR) +
o3 (IND) + o4 (UNION) + c; 5 (PENSION) + w
where:
AGE = Age of firm,
LABOR = Labor intensiveness of a firm
(3.13)
IND = Industry by dummy variable grouping firms into major industry class,
UNION = Unionization percentage,
PENSION = Pension expense for the current year,
w = Error term, assumed to be distributed iid with l.l =0 and a.2.
The age of the firms are collected from the 1981
through 1990 editions of Moody's Industrial Manual. Labor
intensiveness for each firm is estimated by dividing
employee expense by total operating income. The companies
are grouped into three major industry classifications based
on the relative maturity of the industries and are
categorized as dummy variables in the regression. These
categories are: (OLDIND = 1) for highly mature industries;
(OLDIND = 0; NEWIND = 0) for mature industries; and (NEWIND
= 1) for immature industries. The Standard and Poor's
Industry Index Composites are used to classify the firms.

37
Appendix B summarizes the assignment of firms to industry
classifications based on SIC codes.
Unionization groupings are developed from a study
published by Kokkelenberg and Sockell (1985) on union
membership in the United States during the years 1973-1981.
The study assigns unionship percentages to firms according
to their industry categories based on the three-digit SIC
code. Since unionship percentages are not given for
individual firms, the industry percentage is assigned to
firms based on their three-digit SIC code. Pension expense
is included because it is highly correlated with the
retiree/active employee ratio across firms, which is in turn
highly correlated with the level of the OPEBs obligation.
Table II summarizes the variable definitions for the
OPEBs model. The predicted value from this regression,
~s, is then used in (3.14):
where: ./"'-... MVA-MVE
PVL =
./""-... OPEBs =
v =
The market val~ of liabilities as estimated by (MVA) minus the market value of equity (closing stock price * common shares outstanding)
(PV of L-T liabilities) + (current liabilities) + (capitalized interest payments on L-T debt) + (capitalized preferred stock dividends) + (the unfunded pension obligation) ,
Estimated OPEBs obligation, and
( 3. 14)
Error term, assumed to be distributed iid with ll=O and a2.

TABLE II
VARIABLES USED IN INSTRUMENTAL VARIABLE ESTIMATION OF OTHER POSTEMPLOYMENT BENEFITS OBLIGATION MODEL
VARIABLE
OPEBs
AGE
LABOR
IND
UNION
PENSION
w
DEFINITION
Other postemployment benefits expense for the current year
Age of firm
Labor intensiveness of a firm - estimated by the proportion of employee compensation expense to total operating income
OLDIND = 1 (Categorical variable for firms in mature industries), and NEWIND = 1 (Categorical variable for firms in immature industries)
Unionization percentage
Pension expense for the current year
Error term, assumed to be distributed iid with =0 and
38

39
The present value of liabilities is calculated by assuming
the long-term debt has a duration of ten years and is
discounted at the 10 percent discount rate (Shevlin, 1991;
Grant, 1989; Landsman, 1986). Interest payments on
long-term debt, as well as preferred stock dividends, are
treated as a perpetuity discounted at 10 percent. The
unfunded pension obligation is collected as a COMPUSTAT data
item. Table III summarizes the variable definitions and
. ............. expected s1gns for the MVA-MVE model.
It is hypothesized that s2 will be positive, that an
increase in the OPEBs obligation will in turn increase the
market's assessment of the liabilities of the firm. The
OPEBs obligation represents off-balance sheet debt and
should have a direct effect on the market value of the
liabilities of the firm. The null hypothesis tested is that
the OPEBs obligation has no effect on MVL against the
alternative hypothesis that it has a positive effect.
H0 : s2 = o
HA: Sz > 0

TABLE III
VARIABLES USED IN LIABILITY VALUATION EQUATION AND PREDICTED SIGNS OF ESTIMATED COEFFICIENTS
40
VARIABLE DEFINITION EXPECTED
SIGN
./'. MVL The estimated market value of liabilities
PVL
/"-... OPEB.s
v
calculated by subtracting the market value of equity (closing price of common stock times shares outstanding) from the~ estimated market value of assets (MVA - MVE)
Present value of liabilities, calculated + by adding (current liabilities) + (long-term liabilities and interest payments on long-term debt capitalized at 10%· for 10 years) + (preferred stock dividends capitalized as a perpetuity at 10%) + (unfunded pension obligation)
The estimated value from the other post- + employment benefits equation
Error term, assumed to be distributed iid with 11=0 and a2

CHAPTER IV
MODEL ESTIMATION AND RESULTS
Data Collection Procedures and Test Period
One hundred companies (Appendix A) are randomly chosen
from the Fortune 500 companies that disclosed the annual
OPEBs expense and are listed on the 1990 COMPUSTAT data
tape. The 1990 COMPUSTAT data tape is used to gather data
for the years 1987, 1988, and 1989, along with the NAARS
(Mead Data Central) data base of annual reports for those
years. Since the issue of accruing OPEBs is relatively
recent, and market analysts have greater access to
information about large (Fortune 500) companies, only
Fortune 500 companies that are available on COMPUSTAT for
the years 1984-1989 are examined. The expenditure for OPEBs
is taken from the footnotes to the financial statements
which appear on the NAARS database.
Companies are selected by using a random number table
limited to the range 1 through 500. If the companies
selected do not disclose the OPEBs annual expense they are
taken off the list and another random number is selected.
Approximately 25% of the companies originally selected in
the sample did not disclose the OPEBs expense for the year
1989, and therefore were taken off the list. Since only
41

42
companies disclosing OPEBs expense were selected, there is a
possibility of selection bias. Further research is needed
to address the issue of whether the companies that do
disclose the OPEBs expense are systematically different from
those that do not. Data are then collected from the 1990
COMPUSTAT database and other published sources (Moody's
Industrial Guide, 1990; Kokkelenberg and Sockell, 1985).
Estimation Results
...............
The results of the estimation of the MVA model are
summarized in Table IV. ../"-..
The R-square for the MVA model for
1987 is .9484, for 1988 is .9352, and for 1989 is .9474.
The F-test indicates that the models were significantly
different from zero at the .05 level for all three years. /""-....
The results of the simultaneous estimation of OPEBs and ./".. MVL are summarized in Table V. The generated regressor for
the OPEBs obligation (~s) and the market value of
liabilities (M\TL) are estimated simultaneously using the
Statistical Analysis System (SAS V.6) procedure MODEL 2SLS.
The OPEB model has an R-square of .6696 in 1987, .4051 in
1988, and .3104 in 1989. The F-test indicates the models
were significantly different from zero at the .05 level for
all three years.
All the variables in the 1987, 1988, and 1989 MVL model
are significant at the .05 level except for the intercept,
which is not significantly different from zero, and PVL,
which is significant at the .10 level for 1988. All the
signs are positive, as predicted. The MVL model has an

TABLE IV
COEFFICIENTS FROM THE INSTRUMENTAL VARIABLE ESTIMATION OF MARKET VALUE OF ASSETS
43
Variable 1987 1988 1989
INTERCEPT -1368.3100 -1882.3047 -2469.9962 (749.075) (1354.264) (1216.127)
-1.827 -1.390 -2.031
PVCF 5.3202 7.1900 7.9979 (0.315) (0.453) (0.403) 16.880 15.855 19.842
ADV 0.5046 0.4744 0.9355 (0.389) (0.620) (0.539) 1. 296 0.765 1. 733
R&D 1. 2850 0.2909 -0.5540 (0.246) (0.462) (0.401) 5.218 0.630 -1.381
IND1 4543.0595 -4265.6868 -3540.4629 (1383.891) (2320.745) (2148.393)
3.283 -1. 838 -1.648
IND2 -3050.3777 -2411.1489 740.6446 (1217.317) (2255.304) (2225.049)
-2.506 -1.069 0.333
GROW -56.0438 59.9870 67.6122 (77.068) (137.302) (131.244) -0.727 0.437 0.515
RISK 147.5917 123.7895 204.7621 (68.313) (131.263) (120.858)
2.161 0.943 1. 694
R-SQUARE 0.9484 0.9352 0.9474 F VALUE 7 92 241.480 189.835 236.797
' Note: Standard errors appear in parentheses with
t-statistics directly following the standard e~rors. The 5% critical value from the F 7 92 distribution for the MVA model is 2.11. '

44
TABLE V
COEFFICIENTS FROM THE TWO-STAGE LEAST SQUARES ESTIMATION OF OPEBs MODEL AND MARKET VALUE OF LIABILITIES MODEL
Variable 1987 1988 1989
OPEBs Model
INTERCEPT 7.082 2.373 -78.736 (24.282) (37.112) (59.649)
0.29 0.06 -1.32
LABOR 1. 819 16.617 11.789 (1.840) (8.104) (12.972) 0.99 2.05 0.91
INDUSTRY Highly Mature 10.573 35.777 -3.993
(17.079) (26.376) (42.225) 0.62 1. 36 -0.09
Immature -23.801 -48.140 -18.738 (21. 217) (33.795) (54.203) -1.12 -1.42 -0.35
UNION -0.257 -0.227 -0.441 (0.359) (0.555) (0.903) -0.72 -0.41 -0.49
AGE 0.190 0.153 1. 677 (0.239) (0.356) (0.575) 0.80 0.43 2.91
PENSION EXP 0.617 0.607 0.683 (0.049) (0.090) (0.128) 12.50 6.74 5.33
R-SQUARE 0.6696 0.4051 0.3104 F VALUE6 88 29.9923 10.2126 6.7715
'
45
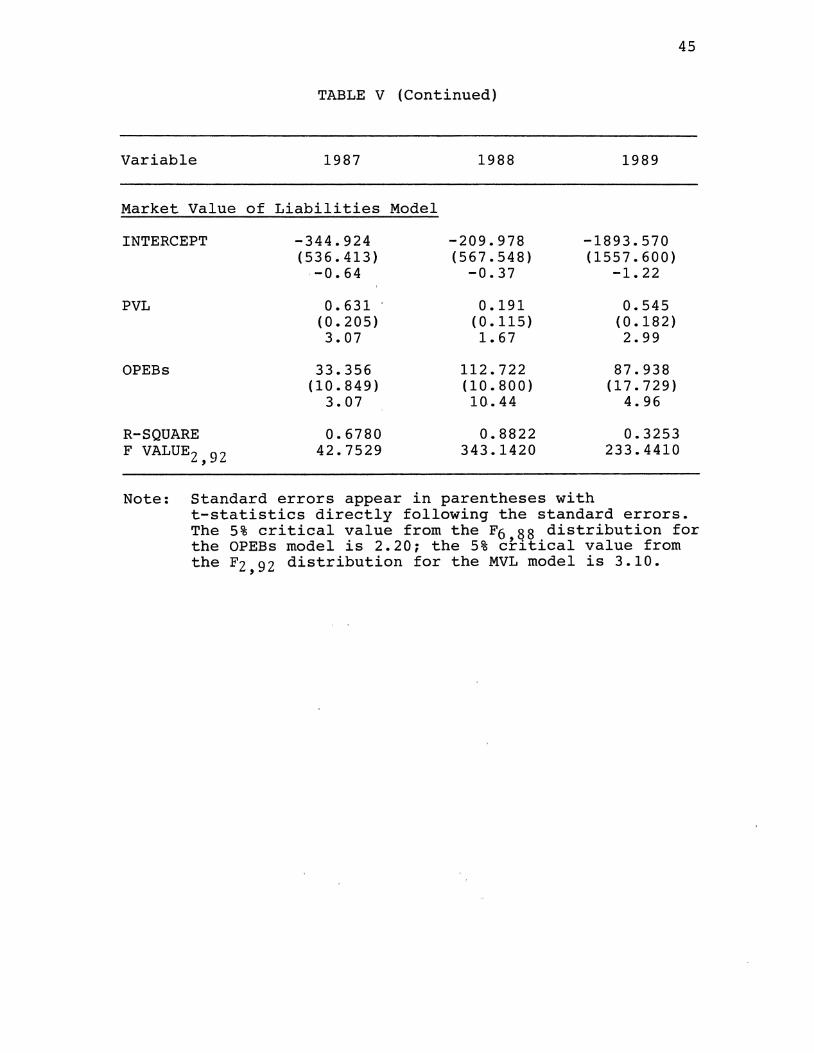
TABLE V (Continued)
Variable 1987 1988 1989
Market Value of Liabilities Model
INTERCEPT -344.924 -209.978 -1893.570 (536.413) (567.548) (1557.600)
-0.64 -0.37 -1.22
PVL 0.631, 0.191 0.545 (0.205) (0.115) (0.182) 3.07 1. 67 2.99
OPEBs 33.356 112.722 87.938 (10.849) (10.800) (17.729)
3.07 10.44 4.96
R-SQUARE 0.6780 0.8822 0.3253 F VALDEz 92 42.7529 343.1420 233.4410
' Note: Standard errors appear in parentheses with
t-statistics directly following the standard errors. The 5% critical value from the F6 88 distribution for the OPEBs model is 2.20; the 5% critical value from the Fz 92 distribution for the MVL model is 3.10.
'
46
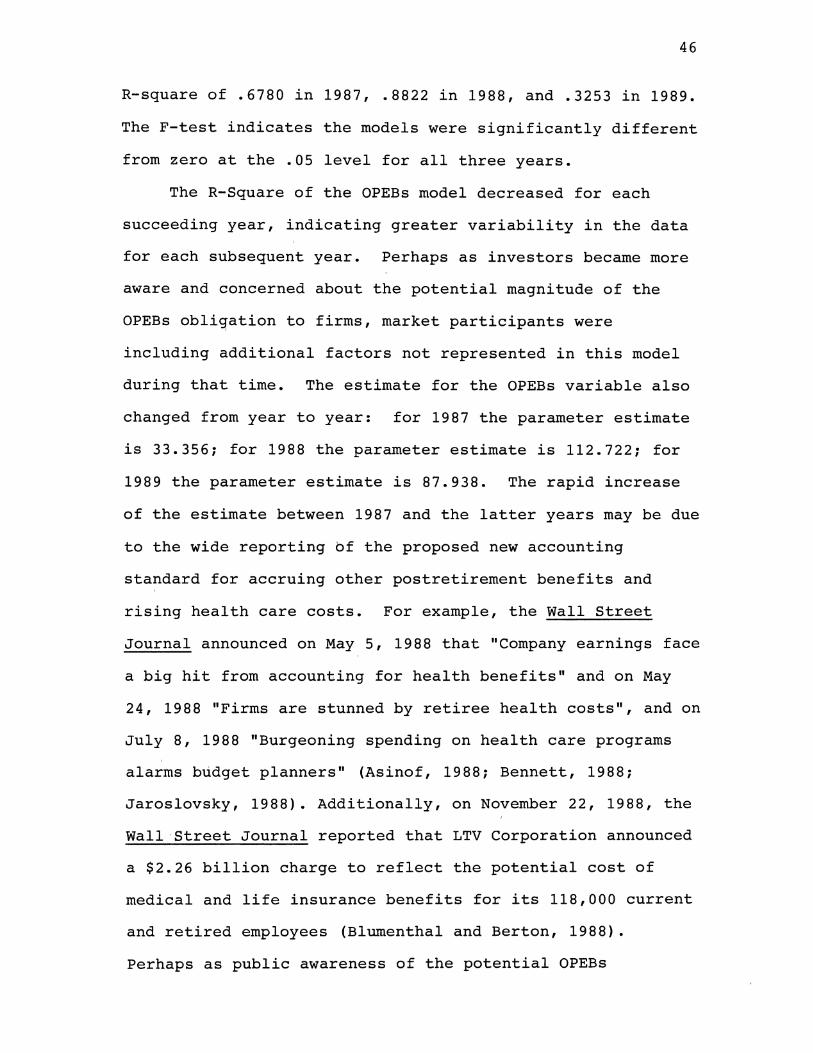
R-square of .6780 in 1987, .8822 in 1988, and .3253 in 1989.
The F-test indicates the models were significantly different
from zero at the .05 level for all three years.
The R-Square of the OPEBs model decreased for each
succeeding year, indicating greater variability in the data
for each subsequent year. Perhaps as investors became more
aware and concerned about the potential magnitude of the
OPEBs obli~ation to firms, market participants were
including additional factors not represented in this model
during that time. The estimate for the OPEBs variable also
changed from year to year: for 1987 the parameter estimate
is 33.356; for 1988 the parameter estimate is 112.722; for
1989 the parameter estimate is 87.938. The rapid increase
of the estimate between 1987 and the latter years may be due
to the wide reporting bf the proposed new accounting
standard for accruing other postretirement benefits and
rising health care costs. For example, the Wall Street
Journal announced on May 5, 1988 that "Company earnings face
a big hit from accounting for health benefits" and on May
24, 1988 "Firms are stunned by retiree health costs", and on
July 8, 1988 "Burgeoning spending on health care programs
alarms budget planners" (Asinof, 1988; Bennett, 1988;
Jaroslovsky, 1988). Additionally, on November 22, 1988, the
Wall Street Journal reported that LTV Corporation announced
a $2.26 billion charge to reflect the potential cost of
medical and life insurance benefits for its 118,000 current
and retired employees (Blumenthal and Berton, 1988).
Perhaps as public awareness of the potential OPEBs

47
obligation grew in 1988 and 1989, and companies were engaged
in re-negotiating employee benefits to reduce their OPEBs
obligation, more "noise" was introduced into the estimation
procedure in the latter years. Additional research could
test this hypothesis as firms are required to disclose their
OPEBs obligation in their financial statements.

CHAPTER V
SUMMARY AND CONCLUSIONS
This research project has discussed issues related to
the identification of, legality of, and valuation of the
other postemployments benefits obligation (OPEBs). These
benefits consist primarily of health and life insurance
benefits promised to employees after retirement. The FASB
has identified the OPEBs obligation as an obligation of the
firm and has required firms to estimate and accrue the
liability associated with OPEBs for fiscal years beginning
after December 15, 1992. The legal obligation of the firm
to the retirees .is still being decided by the courts on a
firm-by-firm basis. The valuation of the OPEBs obligation
by investors is difficult because this information is either
privately held or not compiled by firms at all. However,
assuming efficient markets and rational investors, an
estimate of this obligation should be included in the market
valuation of firms.
A model is developed of how the OPEBs obligation is
being determined by market participants. Using this model,
the effect of the OPEBs obligation on the market value of
the firm is consistently estimated. Previous research
(Landsman, 1986, Grant, 1989) has identified the
errors-in-measurement problem in using balance sheet data as
a surrogate for the market value of assets and liabilities.
48

49
Instrumental variables for assets and liabilities are used
in this research to circumvent the errors-in-measurement
problem that has existed in prior research. The model
developed identifies the variables OPEBs expense, age of the
firm, labor intensiveness of the firm, industry maturity
classification, percentage of unionship within industries,
and pension expense for the current period as those closely
associated with the level of the OPEBs obligation. A
two-stage least squares regression is utilized to estimate
the OPEBs obligation and simultaneously estimate the
significance of the OPEBs instrument as a factor in firm
valuation. The procedure followed is to first develop a
model of the market value of assets. The market value of
assets is determined by the book value of assets, the
present value of net operating cash flows, capitalized
advertising expenditures, capitalized research and
development expenditures, industry classification, a growth
factor, and a risk factor. These variables are assumed to
be closely associated with the capital market's valuation of
firm assets, and when regressed against the book value of
assets, provide predicted values of the market value of
assets that are not correlated with the error term. The
market value of stockholder's equity is then subtracted from
the market value of assets to obtain the dependent variable,
market value of liabilities. The effect of the OPEBs
obligation on the market value of liabilities is then
estimated by regressing the present value of the balance
sheet liabilities and the OPEBs obligation on the market

50
value of liabilities. This procedure provides consistent
estimates of the effect of OPEBs on the market value of the
firm.
An empirical estimation is presented of the effect of
the OPEBs obligation on the market value of liabilities.
Cross-sectional data for 1987, 1988 and 1989 are used to
first estimate the market value' of assets, and then to
estimate a two-stage least squares regression valuation
model that simultaneously estimates the OPEBs obligation
model and the liability valuation model. The OPEBs
obligation is positively and significantly associated with
the market value of liabilities for all three years. The
estimated coefficients are consistent with the market's
assessment of the OPEBs obligation as an obligation of the
firm. The size of the coefficients jumps between 1987 and
the latter years. During 1988 the press reported the FASB
proposal to accrue the other postemployment benefits
obligation. At that time, public awareness was focused on
the tremendous potential liability that firms had
accumulated but not recorded. When this information was
fully incorporated in stock prices, it could explain the
increase in the size of the OPEBs coefficient.
Future research is indicated to compare the firms that
disclose their OPEBs expense with those who do not. A
search for systematic differences between the two groups
will identify any potential bias inherent in this study. If
no systematic difference is found between the two groups,
then perhaps an examination of the decision regarding the

materiality of the OPEBs expense and whether or not to
disclose this expense is indicated.
51
This dissertation presents an estimation of the other
postemployment benefits obligation and tests the effect of
the OPEBs obligation on the market value of the firm.
Results are presented that suggest a consistent and
significant association between the OPEBs obligation and the
market value of the firm. These results implicitly support
the notion of market efficiency in that investors and other
capital market participants ar~ utilizing publicly available
information in estimating the OPEBs obligation for large
publicly held firms, and consequently support the
requirements of SFAS No. 106 that the OPEBs obligation
should be disclosed in the notes to the financial statements
and accrued in the statement of financial position.
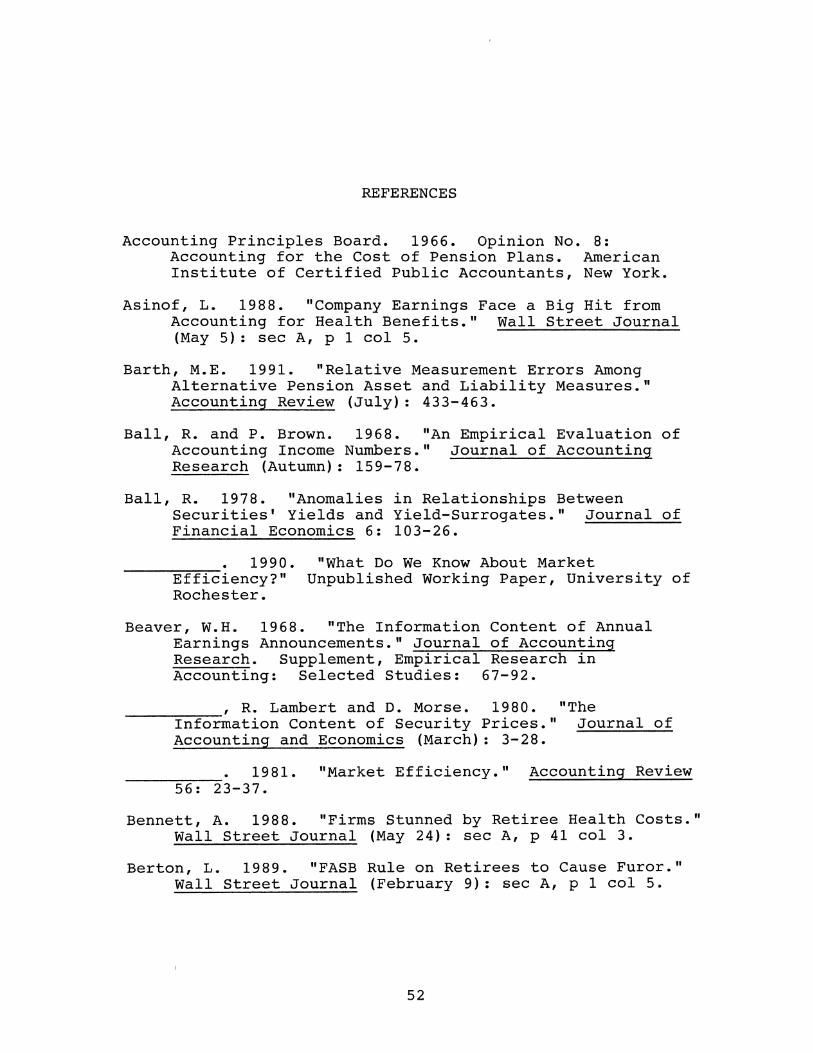
REFERENCES
Accounting Principles Board. 1966. Opinion No. 8: Accounting for the Cost of Pension Plans. American Institute of Certified Public Accountants, New York.
Asinof, L. 1988. "Company Earnings Face a Big Hit from Accounting for Health Benefits." Wall Street Journal (May 5): sec A, p 1 col 5.
Barth, M.E. 1991. "Relative Measurement Errors Among Alternative Pension Asset and Liability Measures." Accounting Review (July): 433-463.
Ball, R. and P. Brown. 1968. "An Empirical Evaluation of Accounting Income Numbers." Journal of Accounting Research (Autumn): 159-78.
Ball, R. 1978. "Anomalies in Relationships Between Securities' Yields and Yield-Surrogates." Journal of Financial Economics 6: 103-26.
1990. Efficiency?" Rochester.
"What Do We Know About Market Unpublished Working Paper, University of
Beaver, W.H. 1968. "The Information Content of Annual Earnings Announcements." Journal of Accounting Research. Supplement, Empirical Research in Accounting: Selected Studies: 67-92.
, R. Lambert and D. Morse. 1980. "The -----,::---::---
Information Content of Security Prices." Journal of Accounting and Economics (March): 3-28.
1981. 56: 23-37.
"Market Efficiency." Accounting Review
Bennett, A. 1988. "Firms Stunned by Retiree Health Costs." Wall Street Journal (May 24): sec A, p 41 col 3.
Berton, L. 1989. "FASB Rule on Retirees to Cause Furor." Wall Street Journal (February 9): sec A, p 1 col 5.
52
53
1991. "New Benefits-Accounting Rule Yields Fresh Red Tape." Wall Street Journal (January 29): sec B, p 2 col 3.
Black, F. 1972. "Capital Market Equilibrium with Restricted Borrowing." Journal of Business, (July): 444-55.
Blumenthal, K. and L. Berton. 1988. "LTV to Reserve $2.26 Billion For Retirees." Wall Street Journal (November 22): sec A, p 03 col 4.
Bowden, R.J. and D.A. Turkington. 1984. Instrumental Variables; Econometric Society Monographics in Quantitative Economics. Cambridge University Press, Cambridge, U. K.
Brown, P. and J.W. Kennelly. 1972. "The Informational Content of Quarterly Earnings: An Extension and Some Further Evidence." Journal of Business (July): 403-15.
Bowman, R. G. 1980. "The Debt Equivalency of Leases: An Empirical Investigation." Accounting Review 55 (April): 237-53.
Coopers and Lybrand. 1989. Retiree Health Benefits: Field Test of the FASB Proposal. Financial Executives Research Foundation, Morristown, New Jersey.
Dhaliwal, D.S. 1986. "Measurement of Financial Leverage in the Presence of Unfunded Pension Obligations." Accounting Review (October): 651-661.
Employee Benefit Research Institute. 1987. Measuring and Funding Corporate Liabilities for Retiree Health Benefits. Washington D.C.: Employee Benefit Research Institute.
Etteredge, M. and B. Bublitz. 1989. "The Information in Discretionary Outlays: Advertising, Research, and Development." Accounting Review (January): 108-24.
Fama, E.F. 1970. "Efficient Capital Markets: A Review of Theory and Empirical Work." Journal of Finance (May): 383-417.
"FASB Takes Steps to Address Firms' Concerns," The Wall Street Journal, 24 December 1990, A2.
Feldstein, M. and R. Morek. 1982. "Pension Funding Decisions, Interest Rate Assumptions and Share Prices." National Bureau of Economic Research, Working Paper No. 938. NBER, Cambridge, MA.

1983. "Pension Funds and the Value of Equities." Financial Analysts Journal (September-October): 29-39.
54
--------~-' and S. Seligman. 1981. Prices and National Savings."
"Pension Funding, Share Journal of Finance
(September): 801-824.
Financial Accounting Standards Board (FASB). 1975a. Discussion Memorandum: Accounting and Reporting for Employee Benefit Plans (October). Stamford, CT: FASB.
1975b. Standards No. Stamford, CT:
Statement of Financial Accounting 5: Accounting for Contingencies (March).
FASB.
1978. Objectives of Financial Reporting by Business Enterprises. Statement of Financial Accounting Concepts No. 1 (November). Stamford, CT: FASB.
1980a. Qualitative Characteristics of Accounting Information. Statement of Financial Accounting Concepts No. 2 (May). Stamford, CT: FASB.
1980b. Statement of Financial Accounting Standards No. 35: Accounting and Reporting by Defined Benefit Pension Plans (March). Stamford, CT: FASB.
1980c. Statement of Financial Accounting Standards No. 36: Disclosure of Pension Information, An Amendment of APB Opinion No. 8 (March). Stamford, CT: FASB.
1984. Statement of Financial Accounting Standards No. 81: Disclosure of Postretirement Health Care and Life Insurance Benefits (November). Stamford, CT: FASB.
1985. Statement of Financial Accounting Standards No. 87: Employers' Accounting for Pensions (December). Stamford, CT: FASB.
1989. Employers' Accounting for Postretirement Benefits Other than Pensions, Exposure Draft (February). Stamford, CT: FASB.
1990. Statement of Financial Accounting Standards No. 106: Employers' Accounting for Postretirement Benefits Other than Pensions (December). Stamford, CT: FASB.
Garber, S. and S. Klepper. 1980. "Administered Pricing" or Competition Coupled with Errors of Measurement?" International Economic Review (June): 413-435.

55
Gersowitz, M. 1980. Economic Consequences of Unfunded Vested Pension Benefits. National Bureau of Economic Research (NBER) Working Paper No. 480. Cambridge, MA: NBER.
Grant, J.E. 1989. Non-Pension Retirement Benefits. Unpublished Doctoral Dissertation, Cornell University (May) .
Grossman, S.J. and J.E. Stiglitz. 1976. "Information and American Economic Review Competitive Price Systems."
66: 246-53.
1980. "The Impossibility of Informationally Efficient Markets." American .Economic Review 70: 393-408.
Hirschey, M. and J.J. Weygandt. 1985. "Amortization Policy for Advertising and Research apd Development Expenditures." Journal of Accounting Research, Vol. 23, No. 1 (Spring): 326-335.
Jaroslovsky, R. 1988. "Burgeoning Spending on Health Care Programs Alarms Budget Planners." Wall Street Journal (July 8): sec A, p 1 col 5.
Johnston, J. 1984. Econometric Methods, 3rd. Ed. New York: McGraw-Hill Book Company.
Jensen, M. 1978. "Some Anomalous Evidence Regarding Market Journal of Financial Economics 6: 95-101. Efficiency."
Kennedy, P. 1989. A Guide to Econometrics, 2nd. Ed. Cambridge, Massachusetts: The MIT Press.
Kmenta, J. 1986. Elements of Econometrics, 2nd. Ed. New MacMillan Publishing. York:
Landsman, W.L. 1986. "An Empirical Investigation of Pension Fund Property Rights." Accounting Review (October): 662-691.
, and J. Magliolo. 1988. "Cross-Sectional ---=--""-7-:-Capital Market Research and Model Specification."
Lev,
Accounting Review (October): 586-604.
B. and J. Ohlson. 1982. "Market-Based Empirical Research in Accounting: A Review, Interpretation, and Extension. " .;:J..::o~u~r~n~a~l=---=o-=f:.....:.A:.:c::.:c::.:o=-u=n-=t-=i~n:.ogii-....:R~e=s-=e-=a-=r~c;.:;.:;h, Supplement: 249-322.
Lindenberg, E.B. and S.A. Ross. 1981. "Tobin's q Ratio and Industrial Organization." Journal of Business (January): 1-32.

56
Lintner, J. 1965. "The Valuation of Risk Assets and the Selection of Risky Investments in Stock Portfolios and Capital Budgets." Review of Economics and Statistics 47: 13-37.
Lipe, R. 1990. "The Relation between Stock Returns and Accounting Earnings Given Alternative Information." Accounting Review (January): 49-71.
May, R.G. 1971. "The Influence of Quarterly Earnings Announcements on Investor Decisions as Reflected in Common Stock Price Changes." Journal of Accounting Research, Supplement (Vol. 9): 119-163.
Morris, M., w. Nichols, and G. Niehaus. 1983. "Considerations Driving Interest Rate Assumptions Changes." Financial Analysts' Journal (November-December): 13-15.
Mossin, J. 1966. "Equilibrium in a Capital Asset Market." Econometrica 34: 768-83.
Muth, J.F. 1961. "Rational Expectations and the Theory of Price Movements." Econometrica 29: 315-35.
Oldfield, G.S. 1977. Pension System." 9: 48-43.
"Financial Aspects of the Private Journal of Money, Credit and Banking
Pagan, A. 1984. "Econometric Issues in the Analysis of Regressions with Generated Regressors." International Economic Review (February): 221-247.
Patell, J.M. and M.A. of Adjustment of Announcements." 223-252.
Wolfson. 1984. "The Intraday Speed Stock Prices to Earnings and Dividend Journal of Financial Economics 13:
Peles, Y. 1970. "Amortization of Advertising Expenditures in the Financial Statements." Journal of Accounting Research (Spring): 128-37.
Picconi, M.J. 1977. "A Reconsideration of the Recognition of Advertising Assets on Financial Statements." Journal of Accounting Research (Autumn): 317-26.
Revsine, L. 1973. Replacement Cost Accounting. Englewood Cliffs, New Jersey: Prentice-Hall, Inc.
Roll, R. 1977. "A Critique of the Asset Pricing Theory's Test~ Part I: On Past and Potential Testability of the Theory." Journal of Financial Economics 4: 129-76.
Rosenthal, E. 1990. "FASB's Scott Outlines Final OPEB Statement." Tax Notes Today (13 December): 252-4.

Ross, S .A. Review
1983. "Accounting and Economics." (April): 375-80.
Accounting
Searfoss, D.G. and N. Erickson. 1988. "The Big Unfunded Liability: Postretirement Healthcare Benefits." Journal of Accountancy (November): 117-161.
57
Sharpe, W.F. 1964. "Capital Asset Prices: A Theory of Market Equilibrium Under Conditions of Risk." Journal of Finance 19: 425-42.
Sheffrin, S.M. 1983. Rational Expectations. Cambridge Surveys of Economic Literature. Cambridge University Press, Cambridge.
Tobin, J. and W. Brainard. 1977. "Asset Markets and the Cost of Capital." Economic Progress, Private Values, and Public Policy: Essays in Honor of William Fellner eds. R. Nelson, B. Balassa. New York: Elsevier-North Holland.
Watts, R. L. 1978. "Systemic 'Abnormal' Returns After Quarterly Earnings Announcements." Journal of Financial Economics 6: 127-50.
Zellner, A. 1970. "Estimation of Regression Relationships Containing Unobserved Variables." International Economic Review (October): 441-454.

APPENDIXES
58

APPENDIX A
LIST OF SAMPLE FIRMS
59

60
-- --.. ... ••=----••aa•a.-•aw,. ...................................... a••===~= CCMPUSTAT COMPANY COMPUSTAT COMPANY COMPUSTAT COMPANY CNUM NAME CHUM NAME CHUM NAME ........... a ... •••--•••••••====z•• ... •••••••••••••••••••==-•--• ..... •••aa••aaa••••=••••=••
22249 ALCOA 25321 AMERICAN CYANAMID 26609 AMERICAN HOME PROD 31905 AMOCO 43413 ASARCO 44540 ASHLAND OIL & COAL 48825 ATLANTIC RICHFIELD 54303 AVON PROD 87509 BETHLEHEM STEEL 97383 BOISE CASCADE 99599 BORDEN
115637 BROWN FORMAN 121897 BURLINGTON NORTHERN 158525 CHAMPION INTERNTNL 166751 CHEVRON 171196 CHRYSLER 181396 CLARK EQUIP 212363 CONTROL DATA 228255 CROWN CORK & SEAL 235851 DANAHER 237688 DATA GENERAL 244199 DEERE & CO 247361 DELTA AIRLINES 253849 DIGITAL 260543 DOW CHEMICAL 261597 DRESSER 269803 EAGLE·PICHER IND 277461 EASTMAN KODAK 278058 EATON 302290 EXXON 313549 FEDERAL-MOGUL 302491 FMC 351604 FOXBORO 368682 GENCORP 369550 GENERAL DYNAMICS 369604 GENERAL ELECTRIC 370442 GENERAL MOTORS 370838 GENERAL SIGNAL 440452 GEO A HORMEL 375766 GILLETTE 382550 GOODYEAR 362320 GTE 410522 HANNA M A
423074 HEINZ 427056 HERCULES 428236 HEWLETT-PACKARD 459200 IBM 452308 ILLINOIS TOOL WORKS 456866 INGERSOLL-RAND 457472 INLAND STEEL 470349 JAMES RIVER 492386 KERR•MCGEE 539821 LOCKHEED 502210 LTV 559177 MAGMA COPPER 565020 MANVILLE 573275 MARTIN MARIETTA 578592 MAYTAG 580037 MCDERMOTT 580169 MCDONNEL DOUGLAS 580645 MCGRAW·HILL 589433 MEREDITH 604059 MINNESOTA MINING & M 607059 MOBIL 611662 MONSANTO 619331 MORTON 620076 MOTOROLA 629853 NALCO CHEMICAL 638901 NAVISTAR INTER 628862 NCR 651192 NEWELL 666807 NORTHRUP 701094 PARKER·HANNIFIN 718592 PHILLIPS-VAN HEUSEN 731095 POLOROID 742718 PROCTOR & GAMBLE 747402 QUAKER OATS 747633 QUANTUM CHEMICAL 751277 RALSTON PURINA 761695 REYNOLDS & REYNOLDS
74960L RJR NABISCO 774347- ROCKWELL 775371 ROHM & HAAS 824348 SHERWIN·WILLIAMS 835495 SONOCO PROOUCTS 860000 SQUIBB
867323 SUNDSTRAND 879335 TELEDYNE 881694 TEXACO 882508 TEXAS INSTRUMENTS 883203 TEXTRON 89604 7 TRIBUNE CHICAGO 896678 TRINOVA 905530 UNION CAMP 905581 UNION CARBIDE 908640 UNION TEXAS PETRO 909214 UNISYS 902905 usx 960402 WESTINGHOUSE 984121 XEROX

APPENDIX B
INDUSTRY MATURITY CLASSIFICATION OF FIRMS
61

62
s & p SIC Industry Industry # of Maturity Composite Code Firms Category
Oil Com;eosite 1311 2912 2913 6 Highly Mature
Metal Com;eosite 1000 1031 1042 3310 3331 3334 8 Highly Mature
Machinery/Auto Com;eosite 3511 3522 3531 3533 3540 3550 3554 3555 3560 3711 3713 3714 3717 3720 3728 16 Highly Mature
Trans;eortation Com;eosite 4011 4210 4511 4700 4712 2 Highly Mature
Energy Com;eosite 1211 1381 2911 2912 2913 3533 4 Highly Mature
Highly Mature Total 36
Foods Composite 2000 2001 2010 2020 2030 2063

s & p Industry Composite
Foods Composite (cont.)
Textiles/Paper
Health Care Composite
Chemical Composite
Building Composite
Retail Stores Composite
Other
Mature Total
SIC Industry # of
Code Firms
2065 2082 2085 2086 7
2200 2300 2320 2400 2510 2600 2650 2670 2700 2711 9
2830 2837 8050 8060 1
2800 2851 2890 11
2949 2950 3241 3430 3431 0
5311 5399 5411 5912 5999 0
2844 2851 3011 3060 3221 3630 3760 3823 3861 4810 17
45
Maturity Category
Mature
Mature
Mature
Mature
Mature
Mature
Mature
63

64
s & p SIC Industry Industry # of Maturity Composite Code Firms Category
Hig:h Tech Com12osite 3570 3660 3664 3670 3673 3674 3687 3721 7370 19 Immature
Immature Total 19
Total Firms 100

APPENDIX C
INDUSTRY CLASSIFICATION OF FIRMS FOR MARKET
VALUE OF ASSETS MODEL
65

=====·=·==·===·=-====•==========·================-==-========····====
OIL
INDUSTRY GROUP
MINERALS
LUMBER
HIGH TECH
OTHER
INDUSTRY # OF CODE FIRMS
1311 2912 2913 1211 1381 2911 2912 2913 1000 1031 1042 3310 3331 3334 2400 2600
3570 3660 3664 3670 3673 3674 3687 372.1 7370
3511 3522 3531 3533 3540 3550 3554 3555 3560 3711 3713
3714 3717 3720 3728 4011 4210 4511 4700 4712 3533 3630
3760 3823 3861
'4810
INDUSTRY CLASSIFICATION
NATURAL RESOURCES INDUSTRIES
HIGH-TECH INDUSTRIES
66

VITA
Barbara J. Askren
Candidate for the Degree of
Doctor of Philosophy
Thesis: MARKET VALUATION OF POSTEMPLOYMENT BENEFITS OTHER THAN PENSIONS
Major Field: Accounting
Biographical:
Personal Data: Born in Detroit, Michigan, December 29, 1952, the daughter of Thomas H. and June K. Brockie.
Education: Graduated from West Carrollton Senior High School, West Carrollton, Ohio, in May, 1971; received Bachelor of Science degree in Business Administration from University of Tulsa in May, 1986; received Master of Science degree in Accounting from University of Tulsa in August, 1987; completed requirements for the Doctor of Philosophy degree at Oklahoma State University in December, 1991.
Professional experience: Adjunct Professor, School of Accounting, University of Tulsa, Summer, 1987; Teaching Assistant, School of Accounting, Oklahoma State University, August, 1987, to May, 1989; Assistant Professor, Business Division, Phillips University, Enid, Oklahoma, August, 1989, to May, 1991; Instructor, Accounting Department, Loyola University Chicago, July, 1991, to present.