Market Update - May 2016 Edition
11
MARKET UPDATE A nother one for the record books! In April in the Greater Victoria Area , we recorded a total of 1,286 MLS sales, representing a 53% in- crease in sales compared to this same time last year. This unprecedent- ed sales volume coupled with an outright shortage of listing inventory continues to fuel a market that is a delight for sellers yet a source of frustration to buyers. April produced some 2,594 active listings; 34% fewer than this time last year and 42% fewer than the five year average of April listings. Essentially, there are only about half as many listings this year as there have been in April these last five years! Historically, the summer months of May through July see the highest levels of inventory. It will be interesting to see if a spike in active listings occurs from Sellers mov- ing to take advantage of these higher prices. The benchmark price for a single family home in the Greater Victoria Area was $568,100 in April, up from $500,400 this same time last year. Condos and Townhouses are up as well compared to this time last year with benchmark prices of $326,800 and $442,200. On the Saanich Peninsula, the April benchmark price for a single family home in each municipality was $739,000 in North Saanich, $514,400 in Sidney, and $590,900 in Central Saanich. Victoria benchmark prices have also increased; single family homes in April were $806,800 in Cadboro Bay, $808,600 in Cordova Bay, $813,200 in Sunnymead, $704,500 in Mt. Doug, $761,700 in Gordon Head, $804,700 in Arbutus, $1.14M in Ten Mile Point, and $967,700 in Oak Bay. In the luxury market, there were a total of 108 sales over $1M. Of those, only 11 were between $2-3M and 5 over $3M. The highest priced sale in April was $3.22M and was in North San- nich. There were 52 waterfront properties sold last month. Jan Feb Mar Apr May Jun Jul Aug Sep Oct Nov Dec 2013 294 394 483 615 659 664 583 540 487 512 412 355 2014 342 412 575 664 714 680 681 609 565 602 465 389 2015 351 542 734 840 905 910 796 741 704 734 573 465 2016 539 772 1121 1286 200 400 600 800 1000 1200 1400 Number of Sales Monthly Sales Comparison Greater Victoria - (2013-2016) 1,286 MAY 2016 Holmes Realty Ltd. 2481 Beacon Ave. Sidney, BC V8L 1X9 250-656-0911 WWW.HOLMESREALTY.COM
-
Upload
holmes-realty-ltd -
Category
Documents
-
view
215 -
download
0
description
Presented by: Holmes Realty www.HolmesRealty.com 1-877-656-0911
Transcript of Market Update - May 2016 Edition

MARKET UPDATE
Another one for the record books! In April in the Greater Victoria Area , we recorded a total of 1,286 MLS sales, representing a 53% in-
crease in sales compared to this same time last year. This unprecedent-ed sales volume coupled with an outright shortage of listing inventory continues to fuel a market that is a delight for sellers yet a source of frustration to buyers.
April produced some 2,594 active listings; 34% fewer than this time last year and 42% fewer than the five year average of April listings. Essentially, there are only about half as many listings this year as there have been in April these last five years! Historically, the summer months of May through July see the highest levels of inventory. It will be interesting to see if a spike in active listings occurs from Sellers mov-ing to take advantage of these higher prices.
The benchmark price for a single family home in the Greater Victoria Area was $568,100 in April, up from $500,400 this same time last year. Condos and Townhouses are up as well compared to this time last year with benchmark prices of $326,800 and $442,200.
On the Saanich Peninsula, the April benchmark price for a single family home in each municipality was $739,000 in North Saanich, $514,400 in Sidney, and $590,900 in Central Saanich.
Victoria benchmark prices have also increased; single family homes in April were $806,800 in Cadboro Bay, $808,600 in Cordova Bay, $813,200 in Sunnymead, $704,500 in Mt. Doug, $761,700 in Gordon Head, $804,700 in Arbutus, $1.14M in Ten Mile Point, and $967,700 in Oak Bay.
In the luxury market, there were a total of 108 sales over $1M. Of those, only 11 were between $2-3M and 5 over $3M. The highest priced sale in April was $3.22M and was in North San-nich. There were 52 waterfront properties sold last month. Jan Feb Mar Apr May Jun Jul Aug Sep Oct Nov Dec
2013 294 394 483 615 659 664 583 540 487 512 412 355
2014 342 412 575 664 714 680 681 609 565 602 465 389
2015 351 542 734 840 905 910 796 741 704 734 573 465
2016 539 772 1121 1286
200
400
600
800
1000
1200
1400
Num
ber
of
Sale
s
Monthly Sales Comparison Greater Victoria - (2013-2016)
1,286
MAY
2016
Holmes Realty Ltd. 2481 Beacon Ave.
Sidney, BC V8L 1X9
250-656-0911
WWW.HOLMESREALTY.COM

CAPITAL REGION SALES
An absorption rate is the rate at which avail-able homes are in a specific market area during a given period of time.
This is calculated by dividing the average number of sales into the number of homes currently on the market.
The rate shows how many months it will take to exhaust the supply of homes. A value be-tween 5 and 6 months is considered to indi-cate a healthy, balanced market. A value over 6 is considered a Buyers market, and values under 5 are generally a Sellers market.
HOW TO INTERPRET ABSORPTION RATES
10.6
11.5 11.9
11.2 10.5
9.3
8.4
7.8 7.7 7.5 7.5 7.4
7.9
9.0 9.3
9.6
9.2
8.3
7.4
6.6 6.5 6.1 6.0
5.8
6.6
7.2 7.3 7.1
6.4
5.6
5.0 4.5 4.3 4.0 4.0
3.8 3.9 4.1
3.7 3.3
2
3
4
5
6
7
8
9
10
11
12
January
February
March
April
May
June
July
August
September
October
Novem
ber
Decem
ber
Mon
ths
of Inv
ento
ry
Absorption Rate Greater Victoria Area - (2013-2016)
2013 2014 2015 2016

SINGLE FAMILY DETACHED
North Saanich Central Saanich SidneyListed Sold Listed Sold Listed Sold
$0 – $499K 2 0 2 5 2 1
$500K – $799K 13 10 11 17 12 13
$800K – $999K 5 7 6 2 0 2
$1000K – $1999K 18 6 11 4 1 0
$2000K + 12 2 11 1 1 0
CONDOS & TOWNHOMES
PENINSULA Listed Sold
$0 – $199K 2 2
$200K – $399K 31 26
$400K – $799K 17 18
$800K – $999K 4 1
$1000K + 2 1
MANUFACTURED
PENINSULA Listed Sold
$0 – $99K 0 2
$100K – $149K 2 0
$150K – $199K 2 3
$200K – $249K 1 3
$250K + 3 1
SFD WATERFRONT
PENINSULA Listed Sold
$0 – $999K 1 1
$1000K – $1499K 5 3
$1500K – $1999K 4 0
$2000K – $2999K 8 0
$3000K + 8 2
LOTS & LAND
PENINSULA Listed Sold
$0 – $299K 1 4
$300K – $499K 4 8
$500K – $699K 2 1
$700K – $999K 7 4
$1000K + 7 3
“Listed” : The number of MLS listings presently on the market at the end of the month indicated.“Sold” : The number of MLS listings with unconditional offers in the month indicated.
PENINSULAINVENTORY VS SALES
(By Price Range) - April 2016

10.6
11.5
11.9
11.2
10.5
9.3
8.4
7.8
7.7
7.5
7.5
7.4
7.9
9.0
9.3
9.6
9.2
8.3
7.4
6.6
6.5
6.1
6.0
5.8
6.6
7.2
7.3
7.1
6.4
5.6
5.0
4.5
4.3
4.0
4.0
3.8
3
.9
4.1
3
.7
3.3
23456789
10
11
12
January
February
March
April
May
June
July
August
September
October
November
DecemberMonths of Inventory
Ab
sorp
tion R
ate
G
reate
r V
icto
ria A
rea - (2
01
3-2
01
6)
20
13
20
14
20
15
20
16
0
10
00
20
00
30
00
40
00
50
00
Active L
istings
/ N
um
ber
of
Sale
s G
reate
r V
icto
ria - (la
st 2
4 m
onth
s)
Act
ive
List
ings
Num
ber
of S
ales

Jan
Feb
Mar
Apr
May
Jun
Jul
Aug
Sep
Oct
Nov
Dec
20
13
29
43
94
48
36
15
65
96
64
58
35
40
48
75
12
41
23
55
20
14
34
24
12
57
56
64
71
46
80
68
16
09
56
56
02
46
53
89
20
15
35
15
42
73
48
40
90
59
10
79
67
41
70
47
34
57
34
65
20
16
53
97
72
11
21
12
86
200
400
600
800
1000
1200
1400
Number of Sales M
onth
ly S
ale
s C
om
pariso
n
Gre
ate
r V
icto
ria - (2013-2
016)
1.0
2
1.0
6
1.4
5
0.8
0
1.5
0
0.9
2
1.7
0
2.1
2
3.3
7
1.1
2
3.7
5
1.4
2
1.9
4
4.9
6
4.8
4
0.0
0
1.0
0
2.0
0
3.0
0
4.0
0
5.0
0
6.0
0
Months of Inventory A
bso
rption R
ate
s - S
ingle
Fam
ily D
eta
ched
April 2
016
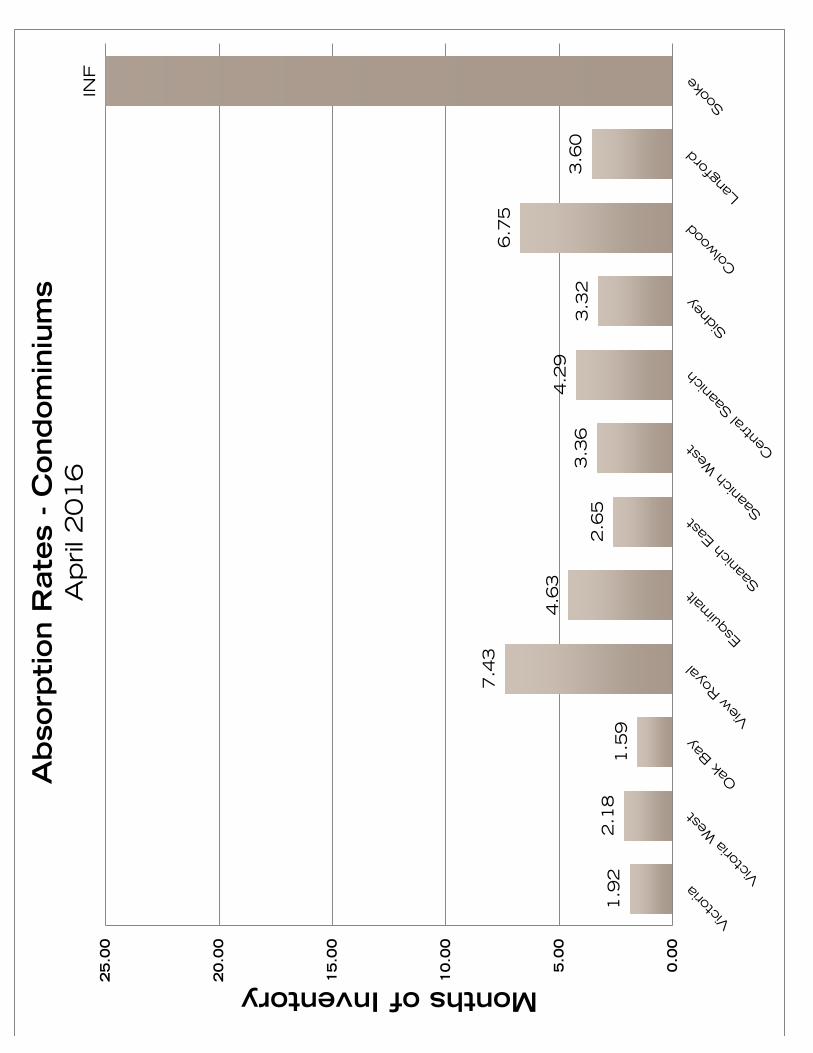
1.9
2
2.1
8
1.5
9
7.4
3
4.6
3
2.6
5
3.3
6
4.2
9
3.3
2
6.7
5
3.6
0
0.0
0
5.0
0
10
.00
15
.00
20
.00
25
.00
Months of Inventory A
bso
rption R
ate
s - C
ond
om
iniu
ms
April 2
016
INF

1.5
4
0.8
6
1.2
0
0.4
8
1.1
7
1.0
0
0.5
0
0.7
7
0.0
0
1.0
6
2.4
5
3.4
3
11.5
4
0.0
0
2.0
0
4.0
0
6.0
0
8.0
0
10
.00
12
.00
14
.00
Months of Inventory A
bso
rption R
ate
s - T
ow
nhouse
s A
pril 2
016
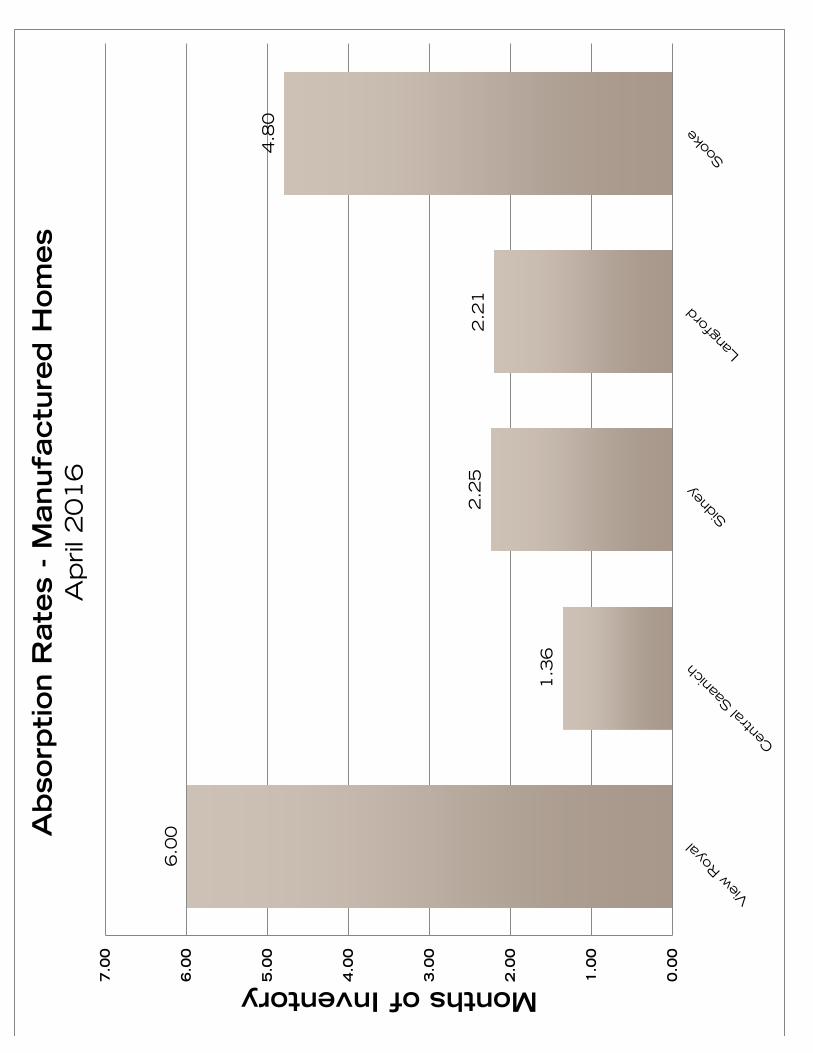
6.0
0
1.3
6
2.2
5
2.2
1
4.8
0
0.0
0
1.0
0
2.0
0
3.0
0
4.0
0
5.0
0
6.0
0
7.0
0
Months of Inventory A
bso
rption R
ate
s - M
anufa
ctu
red
Hom
es
April 2
016
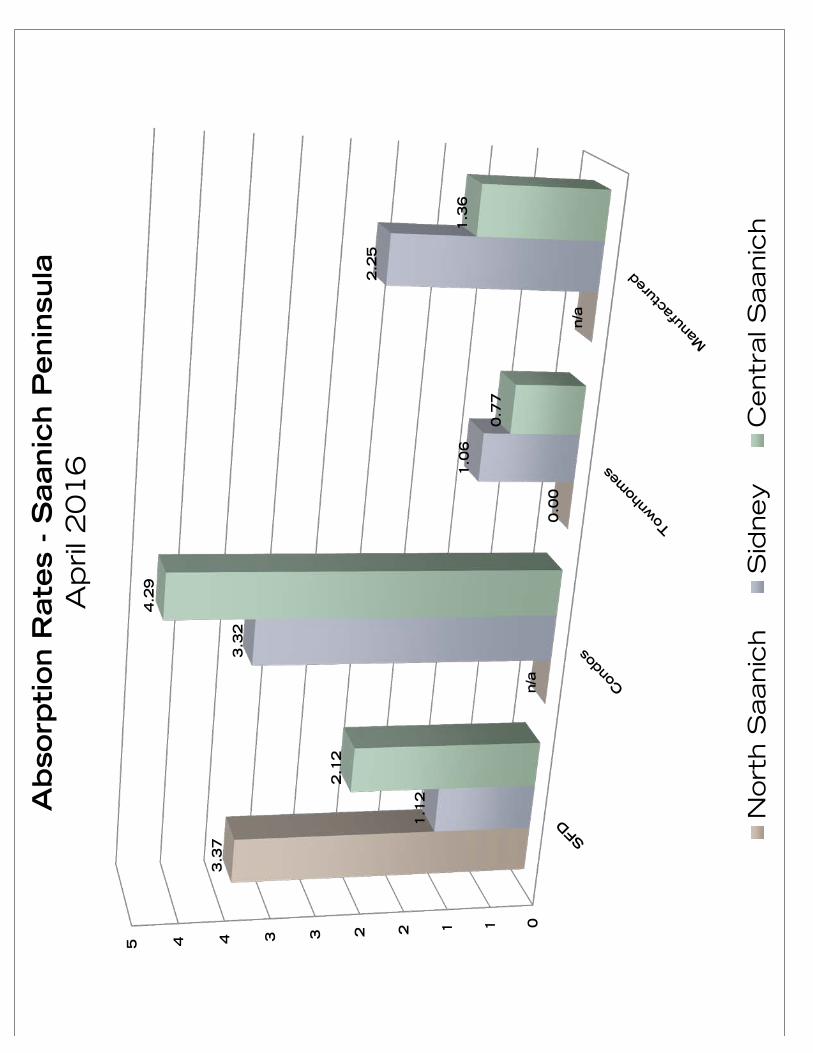
0112233445
3.3
7
n/a
0.0
0
n/a
1.1
2
3.3
2
1.0
6
2.2
5
2.1
2
4.2
9
0.7
7
1.3
6
Ab
sorp
tion R
ate
s - S
aanic
h P
enin
sula
A
pril 2
01
6
Nort
h S
aanic
hS
idney
Centr
al S
aanic
h