MARKET TRENDS IN RENEWABLE ENERGY AND ENERGY ACCESS · ONSHORE WIND LCOE BY COUNTRY ($/MWH) 0 100...
80
MARKET TRENDS IN RENEWABLE ENERGY AND ENERGY ACCESS SREP Pilot Countries Meeting Takehiro Kawahara 1 February 2017
Transcript of MARKET TRENDS IN RENEWABLE ENERGY AND ENERGY ACCESS · ONSHORE WIND LCOE BY COUNTRY ($/MWH) 0 100...

MARKET TRENDS IN RENEWABLE ENERGY AND ENERGY ACCESS
SREP Pilot Countries Meeting
Takehiro Kawahara
1 February 2017

1
LEVERAGING THE POWER OF BLOOMBERG
Since 1981
Over 15,000 employees
in 192 locations
Generating 5,000 news stories
per day from 150 bureaus
320,000 global clients
Since 2004
200 employees
in 15 locations on six continents
Generating over 700 Insight
reports annually
2,500 global clients
2
200 EXPERTS ACROSS SIX CONTINENTS
San
Francisco
Washington DC
Sao Paulo
Cape Town Sydney
Singapore
Zurich
Munich
London
New DelhiHong
Kong
Tokyo
Beijing
Seoul
New York
North America
40
SouthAmerica
5
Europe90
Africa30
AsiaPacific
35

3
Europe, Middle East
& Africa
Asia PacificAmericas
PRODUCTS TO HELP YOU UNDERSTAND THE FUTURE OF ENERGY
Solar WindOther
Renewables
Advanced
Transport
Energy Smart
TechnologiesGas
Carbon &
RECs Markets

4
TABLE OF CONTENTS
Renewable energy market trend in emerging countries
Off-grid solar
Policy
Summary

1. RENEWABLE ENERGY MARKET TREND IN EMERGING COUNTRIES

KEY FINDINGS FROM CLIMATE SCOPE PROJECT
7
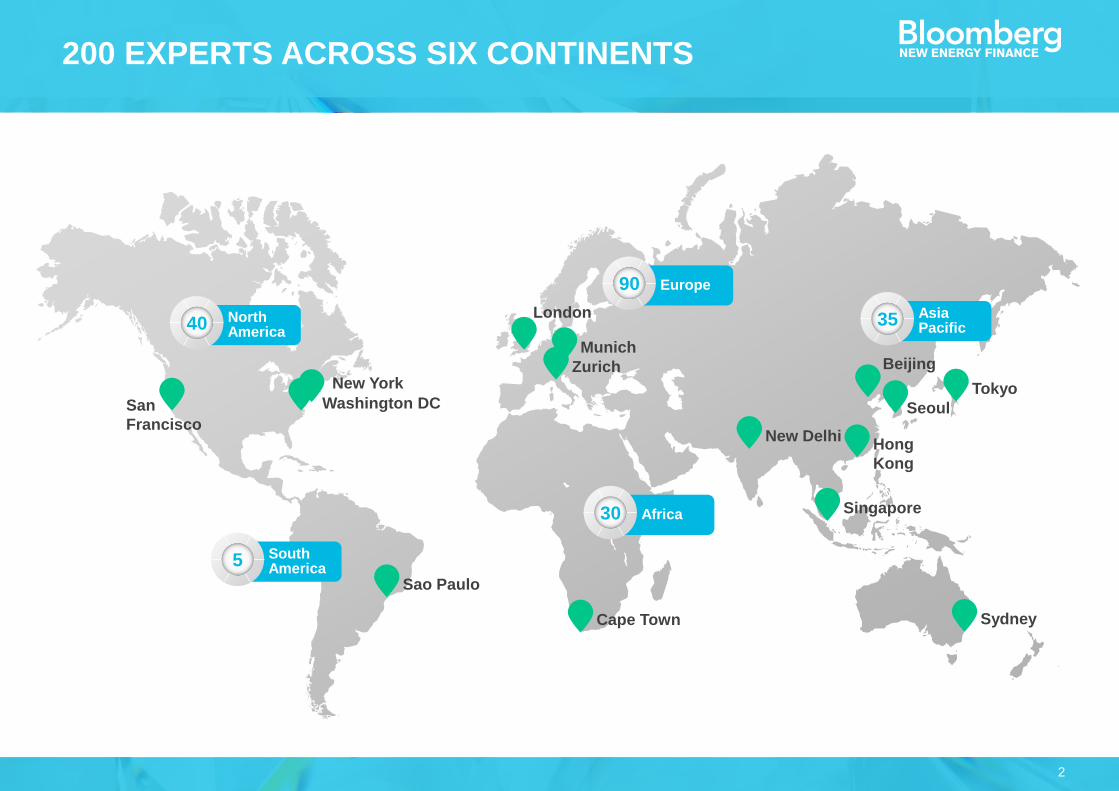
CLIMATESCOPE 2016 - OVERVIEW
FOUR PARAMETERS – Enabling framework, investment,
low carbon business, GHG management
26 COUNTRIES IN LATIN AMERICA AND THE
CARIBBEAN
19 COUNTRIES IN SUB-SAHARAN AFRICA
10 COUNTRIES IN ASIA, 6 INDIAN STATES
UDPATED OFF-GRID METHODOLOGY AND QUARTERLY
OFF-GRID MARKET UPDATES
3 COUNTRIES IN THE MIDDELA EAST AND NORTH
AFRICA
UDPATED WEBSITE

8
CLIMATESCOPE COUNTRY COVERAGE
58 developing nations and 6 Indian states

9
Note: Climatescope and OECD countries account for more than 95% of global annual Source: Climatescope 2016
ANNUAL CLEAN ENERGY CAPACITY ADDITIONS, CLIMATESCOPE VS OECD COUNTRIES (GW), 2011-2015
20.5 18.5 17.928.2
39.52.3 2.111.6
13.4
19.63.2
8.0
29.7
47.5
27.6
56.5
37.244.3
48.451.6
69.8
59.2
CS OECD CS OECD CS OECD CS OECD CS OECD
2011 2012 2013 2014 2015
OECD
Other
Biomass
Small hydro
Solar
Wind
10
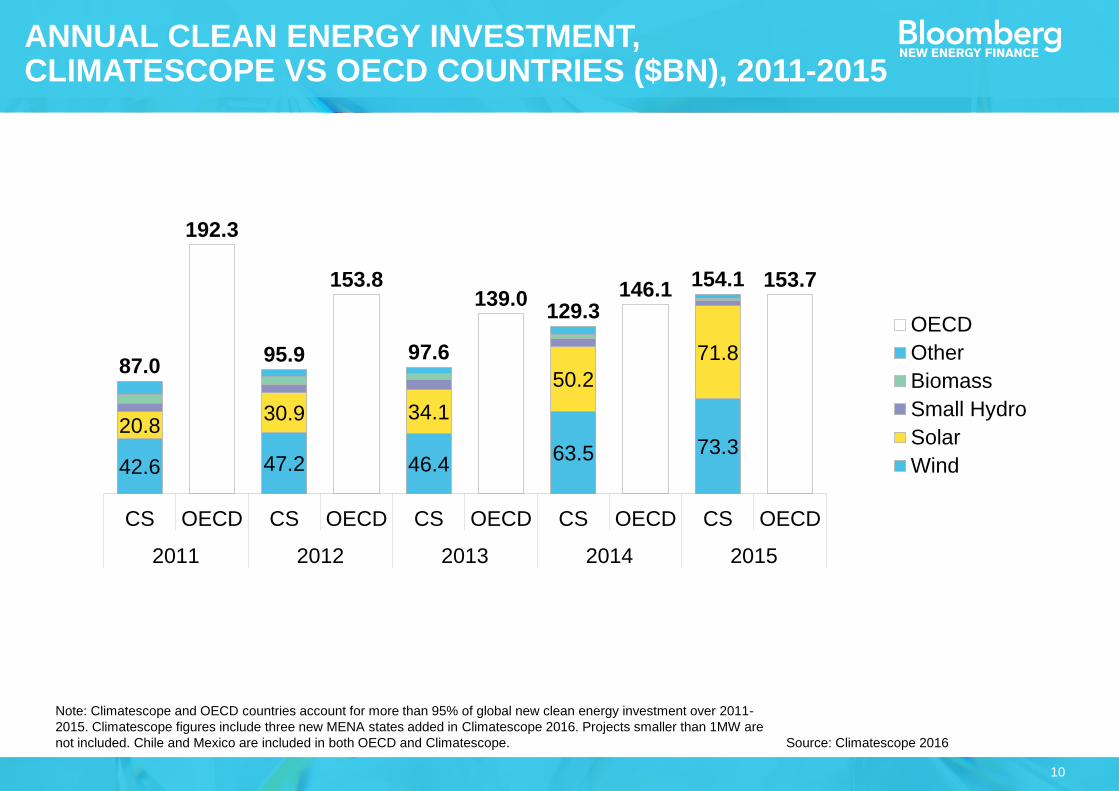
Note: Climatescope and OECD countries account for more than 95% of global new clean energy investment over 2011-
2015. Climatescope figures include three new MENA states added in Climatescope 2016. Projects smaller than 1MW are
not included. Chile and Mexico are included in both OECD and Climatescope. Source: Climatescope 2016
ANNUAL CLEAN ENERGY INVESTMENT, CLIMATESCOPE VS OECD COUNTRIES ($BN), 2011-2015
42.6 47.2 46.463.5 73.3
20.830.9 34.1
50.2
71.887.0
192.3
95.9
153.8
97.6
139.0129.3
146.1154.1 153.7
CS OECD CS OECD CS OECD CS OECD CS OECD
2011 2012 2013 2014 2015
OECD
Other
Biomass
Small Hydro
Solar
Wind

11
Source: Climatescope 2016
NON-OECD VS OECD SHARE OF CLEAN ENERGY INVESTMENT INTO CLIMATESCOPE COUNTRIES (%), EXCLUDES INVESTMENT IN CHINA), 2010-2015
59.0%65.4% 59.2% 54.9%
47.0% 45.8%
13.6%10.2%
8.9%7.5%
6.9% 5.2%
20.7% 18.2%24.9%
24.1%31.2% 40.9%
6.8% 6.2% 7.0%13.5% 14.9%
8.0%
2010 2011 2012 2013 2014 2015
Development banks - OECD
OECD
Development banks non-OECD
Non-OECD

12
Source: Climatescope 2016
AVERAGE DISCLOSED CAPEX FOR ONSHORE WIND AND PV PROJECTS IN CLIMATESCOPE COUNTRIES ($M/MW)
1.77 1.892.15 2.23 2.18 2.02
5.52
4.104.54
2.68 2.72
2.15
2010 2011 2012 2013 2014 2015
Solar PV
Onshore wind
COST OF RENEWABLES

14
LEVELISED COST OF ELECTRICITY (LCOE): DEFINITION
15
y = 3,582.42x-0.30
R² = 0.91
16
32
64
128
256
512
1,024
100 1,000 10,000 100,000 1,000,000
1985
2025
2016
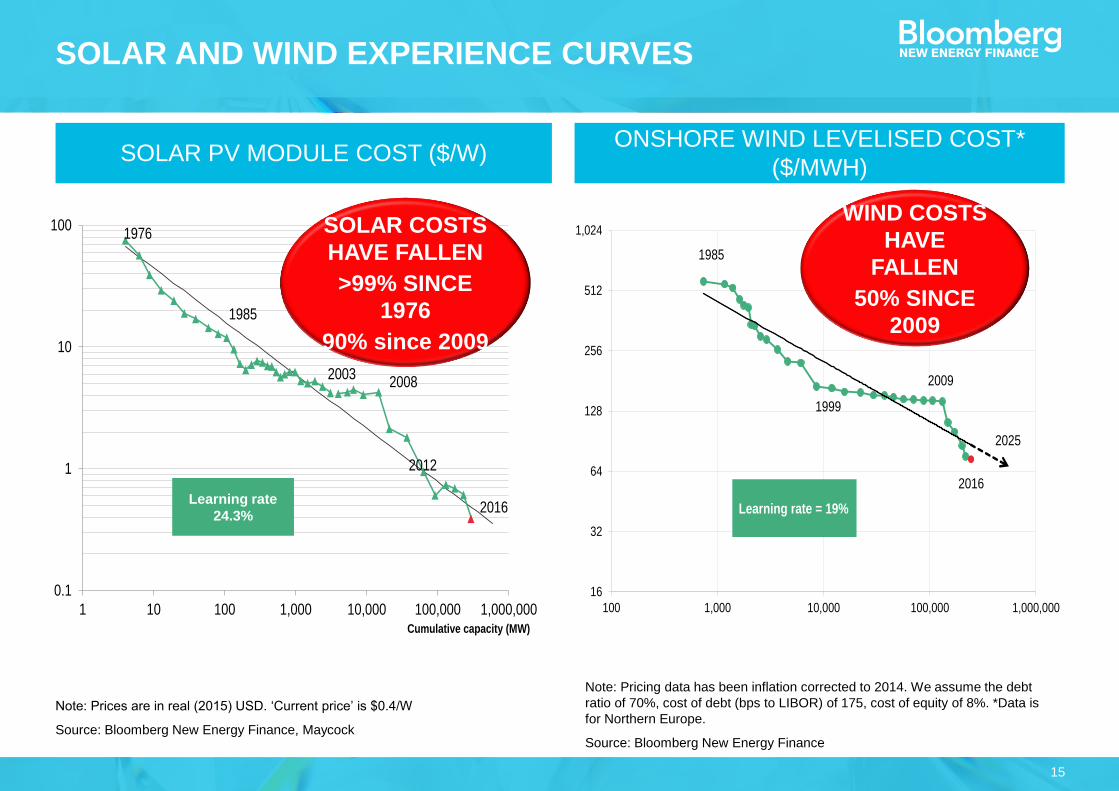
Learning rate = 19%
1999
2009
WIND COSTS
HAVE
FALLEN
50% SINCE
2009
SOLAR AND WIND EXPERIENCE CURVES
Note: Prices are in real (2015) USD. ‘Current price’ is $0.4/W
Source: Bloomberg New Energy Finance, Maycock
Note: Pricing data has been inflation corrected to 2014. We assume the debt
ratio of 70%, cost of debt (bps to LIBOR) of 175, cost of equity of 8%. *Data is
for Northern Europe.
Source: Bloomberg New Energy Finance
0.1
1
10
100
1 10 100 1,000 10,000 100,000 1,000,000
1976
1985
2003
2012
Cumulative capacity (MW)
2016
2008
Learning rate
24.3%
SOLAR COSTS
HAVE FALLEN
>99% SINCE
1976
90% since 2009
SOLAR PV MODULE COST ($/W)ONSHORE WIND LEVELISED COST*
($/MWH)

16
FORECAST OF INTEGRATED PRODUCTION COST FOR C-SI MODULE (US CENT/W)

17
Note: The reduction magnitude is our best indicative estimate of the potential impact. The magnitude could vary
depending on the technological advancements and efficiency improvements. Source: Bloomberg New Energy Finance
WIND PROJECT CAPITAL EXPENDITURE COST (PER MW NAMEPLATE CAPACITY) REDUCTION DRIVERS (%)
Rotor Drivetrain, nacelle Tower BoP & development cost
100% -0.3% -6%1% -4%
91%
2015 Rotor Drivetrain, nacelle Tower Balance of plant &development cost
2025
18
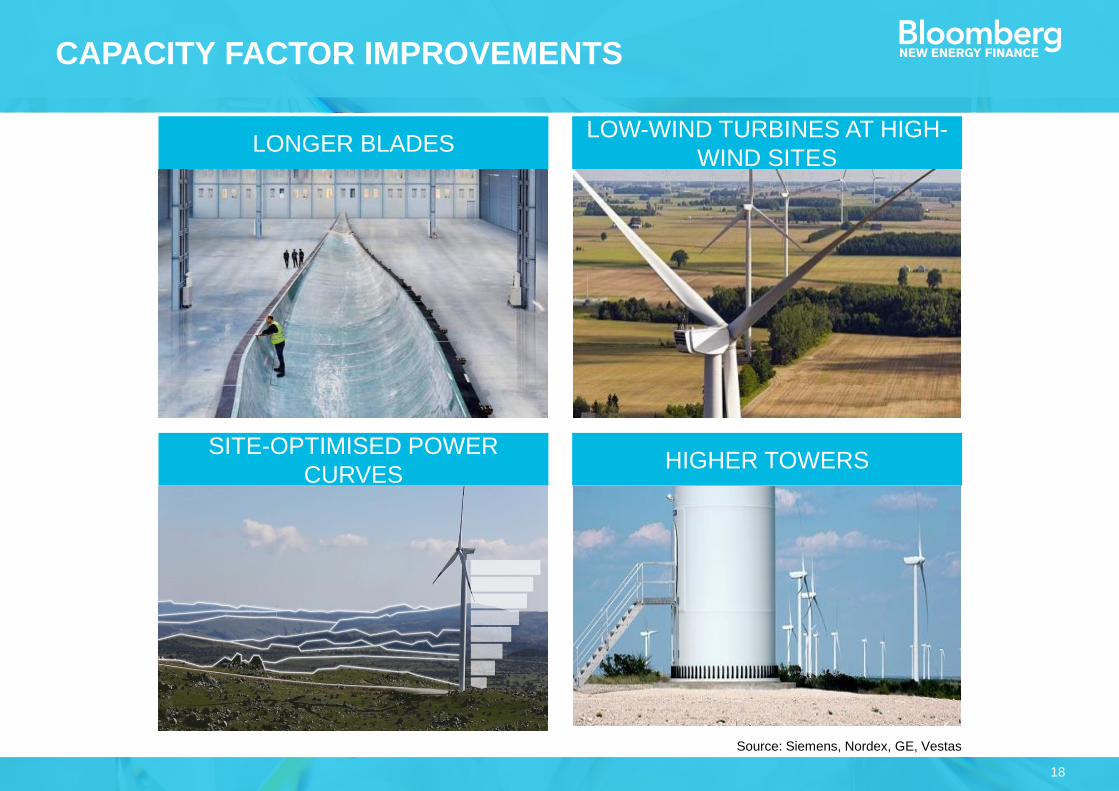
CAPACITY FACTOR IMPROVEMENTS
LONGER BLADESLOW-WIND TURBINES AT HIGH-
WIND SITES
SITE-OPTIMISED POWER
CURVESHIGHER TOWERS
Source: Siemens, Nordex, GE, Vestas

19
Note: Averages are capacity-weighted. We calculate the capacity factor with our proprietary Wind Farm
Capacity Factor Tool using real project data and wind resource data provided by 3TIER by Vaisala. We
assume P90 value in the capacity factor tool.
Source: Bloomberg New Energy
Finance
GLOBAL (EX. CHINA) ONSHORE WIND CAPACITY FACTOR IMPROVEMENTS, 1997-2015 (%)
0%
10%
20%
30%
40%
50%
60%
1980 1984 1988 1992 1996 2000 2004 2008 2012 2016 2020
Germany Denmark UK Spain US Canada
299MW

20
ONSHORE WIND LCOE BY COUNTRY ($/MWH)
0 100 200 300 400 500 600
IndiaSouth AfricaMozambique
MalawiKyrgyzstan
EthiopiaYemen
SomaliaZimbabwe
ZambiaTajikistanTanzania
LiberiaGhana
PakistanNepal
MyanmarAfghanistan
DRCNigeriaKenya
UgandaSudan
PalestineSouth SudanBangladesh
RwandaSierra Leone
LCOE Range Mid

21
SOLAR PV LCOE BY COUNTRY ($/MWH)
0 100 200 300 400 500 600 700
IndiaSouth Africa
PakistanMyanmar
YemenEthiopia
UgandaZimbabweTanzania
Kenya
NepalBangladesh
NigeriaGhana
ZambiaMalawi
Tajikistan
KyrgyzstanSudan
RwandaSierra Leone
Liberia
South SudanMozambique
Somalia
PalestineDRC
Afghanistan
LCOE Range Mid

22
SMALL HYDRO LCOE BY COUNTRY ($/MWH)
0 50 100 150 200 250
IndiaNepal
MyanmarTajikistanTanzania
South AfricaGhana
DRCBangladesh
UgandaMozambique
ZimbabweKyrgyzstan
KenyaMalawiYemenZambiaNigeria
AfghanistanLiberia
PakistanSierra Leone
RwandaSudan
EthiopiaSouth Sudan
SomaliaPalestine
LCOE Range Mid

23
BIOMASS INCINERATION LCOE BY COUNTRY ($/MWH)
0 50 100 150 200 250 300 350 400
IndiaTajikistan
BangladeshPakistan
South AfricaGhana
KyrgyzstanDRC
ZimbabweKenya
NigeriaEthiopia
LiberiaTanzaniaMyanmar
Sierra LeoneNepal
SudanMozambique
YemenMalawi
South SudanZambiaUganda
AfghanistanRwandaSomalia
Palestine
LCOE Range Mid
24
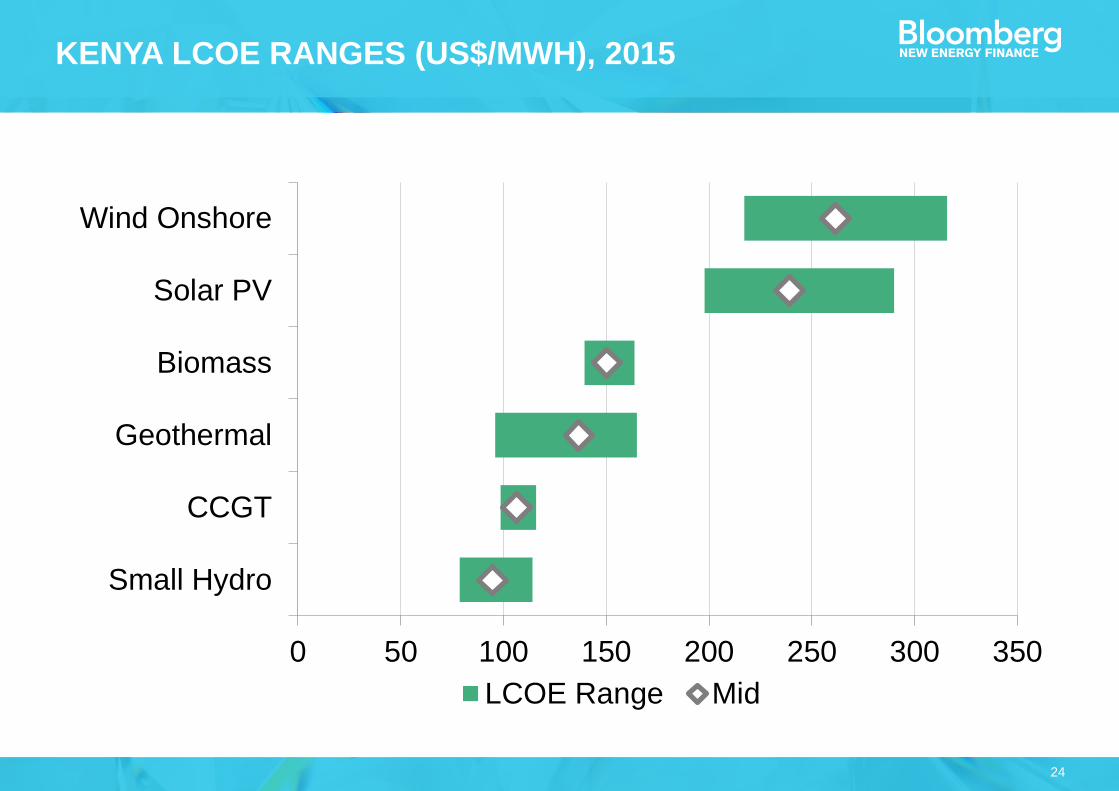
KENYA LCOE RANGES (US$/MWH), 2015
0 50 100 150 200 250 300 350
Small Hydro
CCGT
Geothermal
Biomass
Solar PV
Wind Onshore
LCOE Range Mid
25
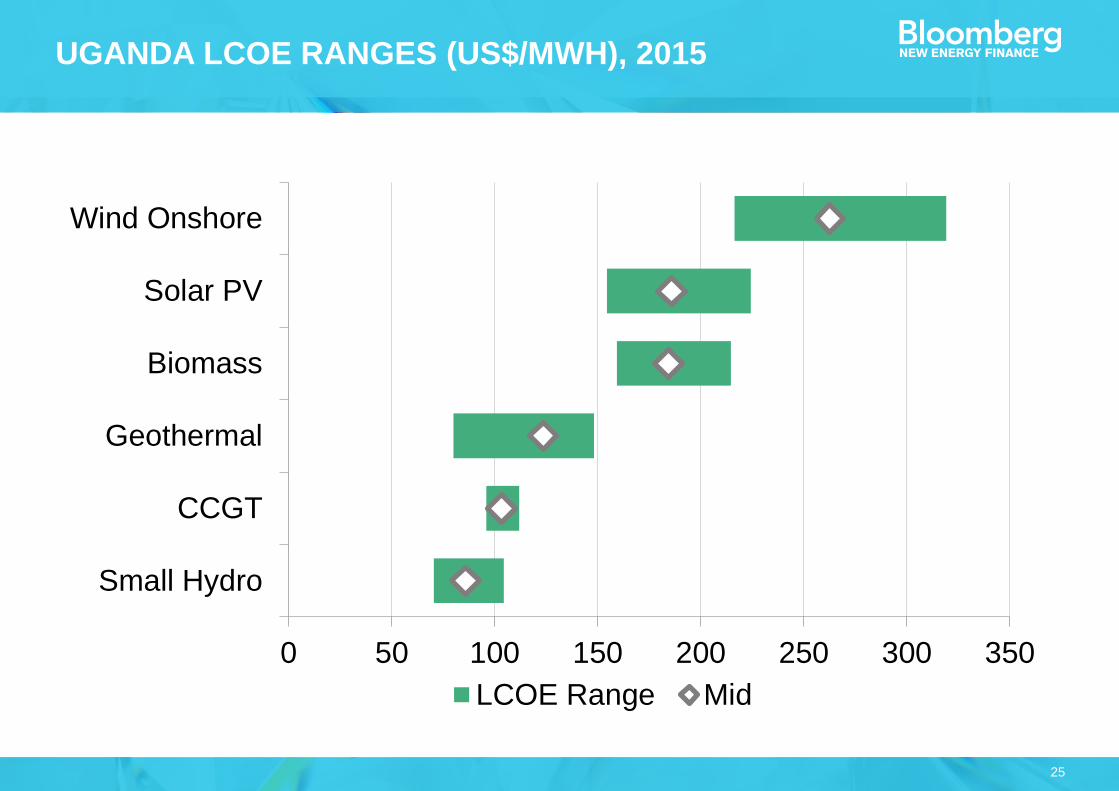
UGANDA LCOE RANGES (US$/MWH), 2015
0 50 100 150 200 250 300 350
Small Hydro
CCGT
Geothermal
Biomass
Solar PV
Wind Onshore
LCOE Range Mid
26
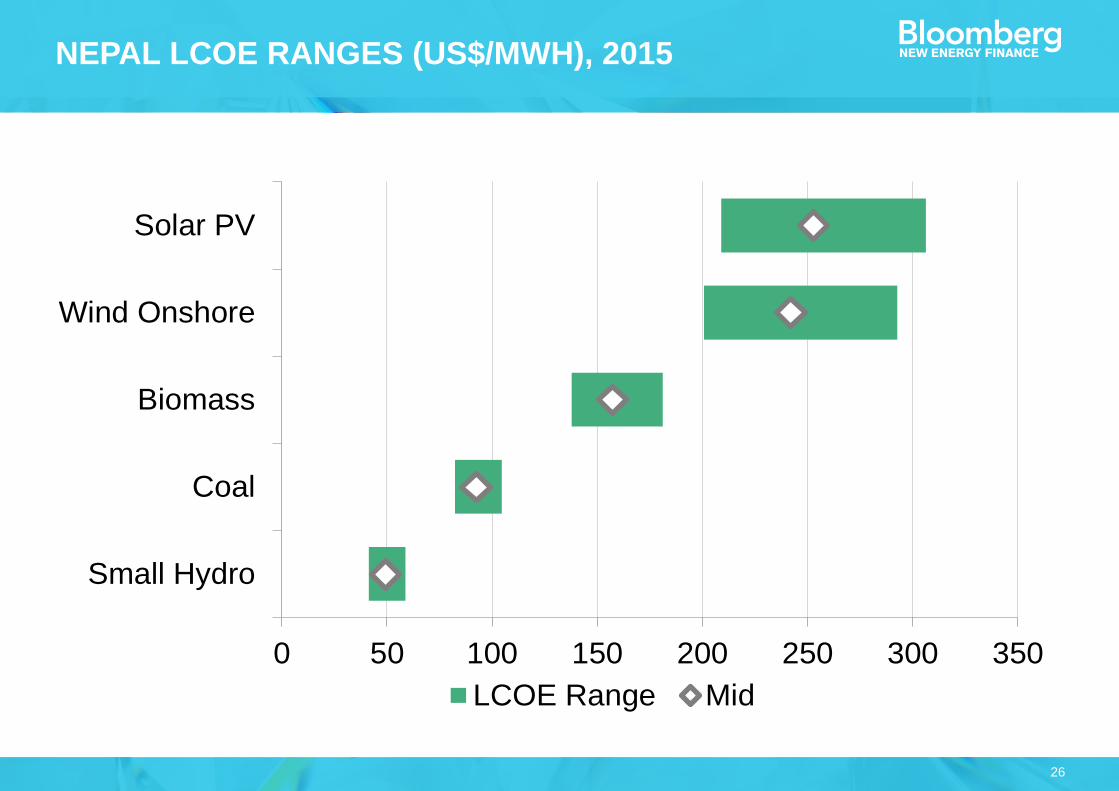
NEPAL LCOE RANGES (US$/MWH), 2015
0 50 100 150 200 250 300 350
Small Hydro
Coal
Biomass
Wind Onshore
Solar PV
LCOE Range Mid

27
Kenya LCOE ranges (US$/MWh), 2015
KENYA
Source: Bloomberg New Energy Finance
Kenya capacity mix, 2014
● Around 32% of Kenya's installed capacity comes from oil. These plants were
commissioned in the 1980s and 1990s when diesel was relatively cheap. As
oil prices rose, other technologies such as geothermal (25%) and hydro
(38%) and more recently wind have been developed.
● Kenya plans to make clean energy a significant part of its ambitious 'Least
Cost Power Development Plan' which targets 22.7GW of capacity by 2033
● Capex for wind is still high in Kenya at around $2.6m/MW. This figure is
based on disclosed data from the Isiolo I wind farm. Recently a number of
other projects were financed, including the 310MW Lake Turkana wind farm.
● The country has good potential for small hydro as well as significant
geothermal resources (estimated at 10GW) which is to undergo a fast track
development plan by the government owned Geothermal Development
Company (GDC).
● Solar has struggled to gain a footing in Kenya despite the country’s feed-in-
tariff, as the rate offered has proven to be too low for project developers.
● Kenya has no proven domestic reserves of natural gas or coal however it
does have some existing natural gas capacity which suggests supply is
available.
Coal CCGT
Wind
Onshore Solar PV
Small
Hydro Geothermal Biomass
Capex ($m/MW) - 1.41 2.60 2.12 2.66 4.04 2.34
Capacity factor - 75% 21% 19% 60% 80% 80%
Fixed O&M ($/MW/yr) - 29,797 38,000 35,000 70,000 60,616 58,000
Debt ratio - 72% 70% 70% 70% 70% 70%
Cost of debt - 11.6% 12.1% 12.6% 12.1% 13.6% 12.6%
Cost of equity - 14.6% 15.1% 15.6% 15.1% 16.6% 15.6%
LCOE ($/MWh) - 106.4 261.6 239.4 94.7 136.8 150.4
0 50 100 150 200 250 300 350
Small Hydro
CCGT
Geothermal
Biomass
Solar PV
Wind Onshore
LCOE Range Mid
32%
33%
5%
25%
Coal
Oil
Gas
Nuclear
Large Hydro
Small Hydro
Solar PV
Solar Thermal
Biomass & Waste
Geothermal
Onshore Wind
Offshore Wind
2,193MW
28
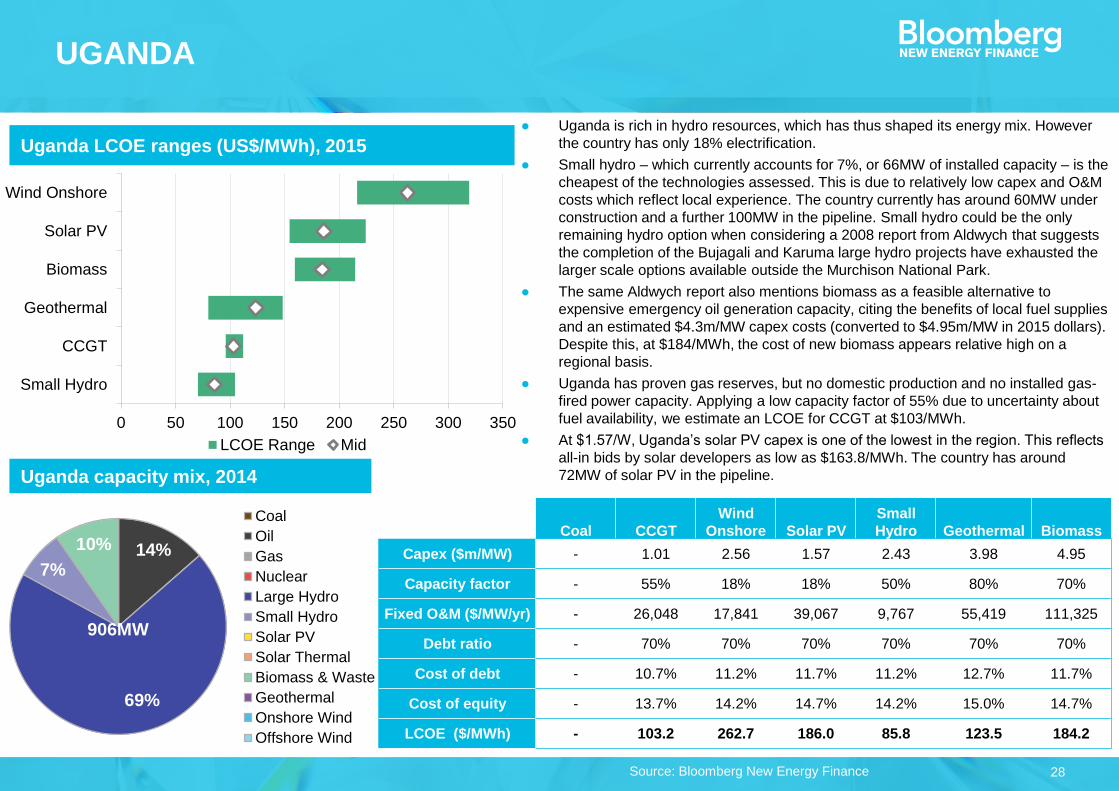
Uganda LCOE ranges (US$/MWh), 2015
UGANDA
Source: Bloomberg New Energy Finance
Uganda capacity mix, 2014
Coal CCGT
Wind
Onshore Solar PV
Small
Hydro Geothermal Biomass
Capex ($m/MW) - 1.01 2.56 1.57 2.43 3.98 4.95
Capacity factor - 55% 18% 18% 50% 80% 70%
Fixed O&M ($/MW/yr) - 26,048 17,841 39,067 9,767 55,419 111,325
Debt ratio - 70% 70% 70% 70% 70% 70%
Cost of debt - 10.7% 11.2% 11.7% 11.2% 12.7% 11.7%
Cost of equity - 13.7% 14.2% 14.7% 14.2% 15.0% 14.7%
LCOE ($/MWh) - 103.2 262.7 186.0 85.8 123.5 184.2
0 50 100 150 200 250 300 350
Small Hydro
CCGT
Geothermal
Biomass
Solar PV
Wind Onshore
LCOE Range Mid
● Uganda is rich in hydro resources, which has thus shaped its energy mix. However
the country has only 18% electrification.
● Small hydro – which currently accounts for 7%, or 66MW of installed capacity – is the
cheapest of the technologies assessed. This is due to relatively low capex and O&M
costs which reflect local experience. The country currently has around 60MW under
construction and a further 100MW in the pipeline. Small hydro could be the only
remaining hydro option when considering a 2008 report from Aldwych that suggests
the completion of the Bujagali and Karuma large hydro projects have exhausted the
larger scale options available outside the Murchison National Park.
● The same Aldwych report also mentions biomass as a feasible alternative to
expensive emergency oil generation capacity, citing the benefits of local fuel supplies
and an estimated $4.3m/MW capex costs (converted to $4.95m/MW in 2015 dollars).
Despite this, at $184/MWh, the cost of new biomass appears relative high on a
regional basis.
● Uganda has proven gas reserves, but no domestic production and no installed gas-
fired power capacity. Applying a low capacity factor of 55% due to uncertainty about
fuel availability, we estimate an LCOE for CCGT at $103/MWh.
● At $1.57/W, Uganda’s solar PV capex is one of the lowest in the region. This reflects
all-in bids by solar developers as low as $163.8/MWh. The country has around
72MW of solar PV in the pipeline.
14%
69%
7%
10%
Coal
Oil
Gas
Nuclear
Large Hydro
Small Hydro
Solar PV
Solar Thermal
Biomass & Waste
Geothermal
Onshore Wind
Offshore Wind
906MW
29
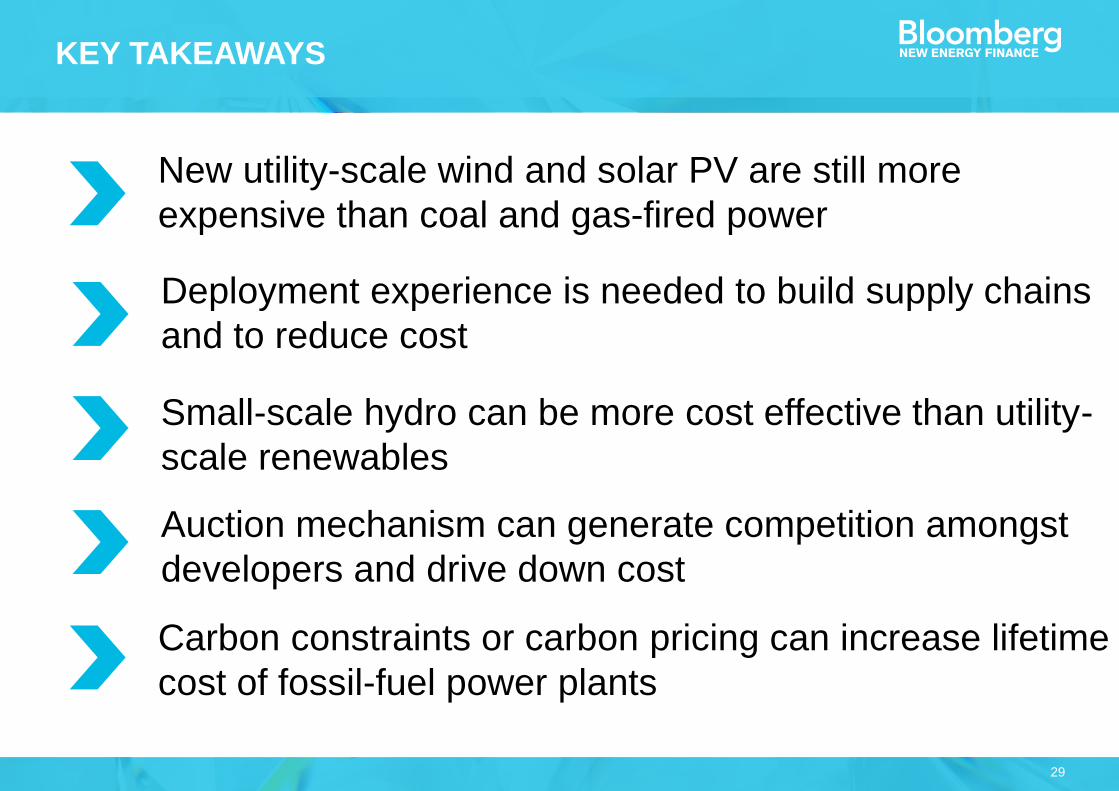
Deployment experience is needed to build supply chains
and to reduce cost
KEY TAKEAWAYS
Small-scale hydro can be more cost effective than utility-
scale renewables
Auction mechanism can generate competition amongst
developers and drive down cost
Carbon constraints or carbon pricing can increase lifetime
cost of fossil-fuel power plants
New utility-scale wind and solar PV are still more
expensive than coal and gas-fired power

2. OFF-GRID SOLAR

31
Note: Figures refer to 2012 data.
Source: Bloomberg New Energy Finance,
World Bank, GOGLA, IFC Lighting Global
SHARE OF POPULATION WITHOUT GRID ACCESS(% OF TOTAL)
0% Lowest
50% Mid
99% Highest

32
Source: Bloomberg New Energy Finance,
Climatescope
NATIONAL ELECTRIFICATION RATES(% OF TOTAL POPULATION)
0
20
40
60
80
100
Uganda Rwanda Kenya Tanzania Ethiopia Senegal Nigeria
0
20
40
60
80
100
Myanmar Nepal Bangladesh Pakistan India Indonesia Sri Lanka
2010 2011 2012 2013 2014 2015
0
20
40
60
80
100
Nicaragua Suriname Guatemala Panama Peru Honduras Colombia
33
Photo credits: Lighting Global, Wikipedia
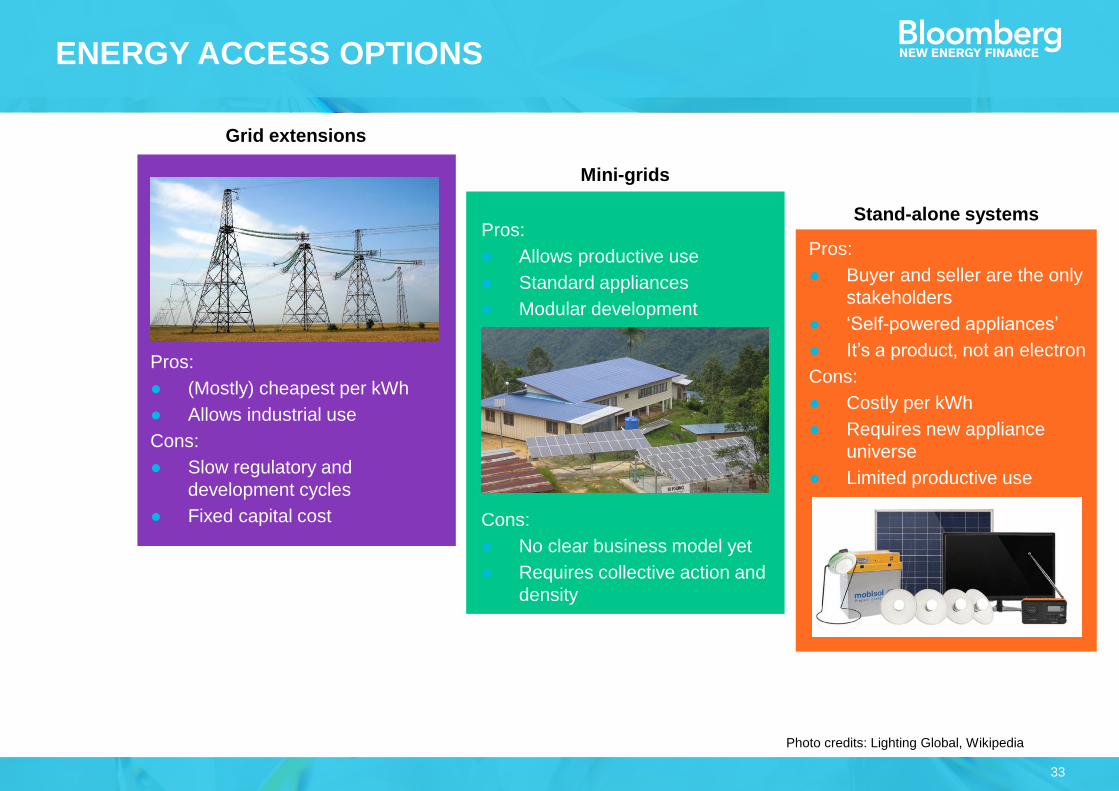
ENERGY ACCESS OPTIONS
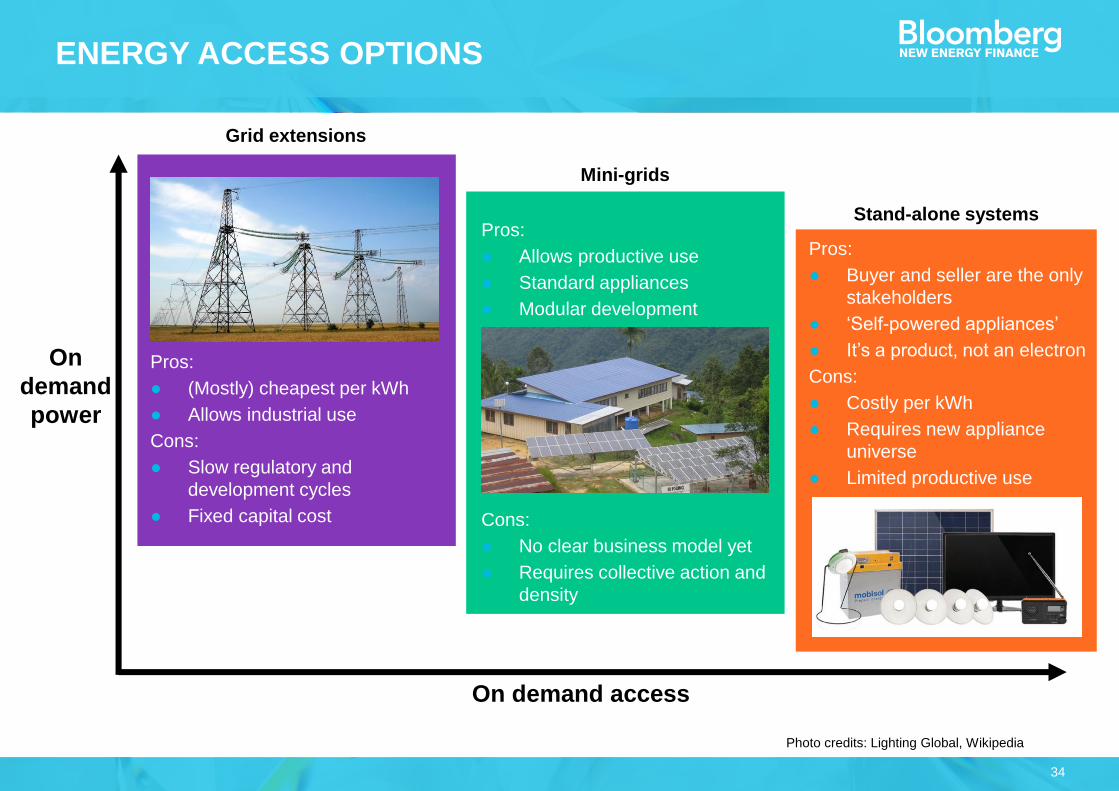
Pros:
● Allows productive use
● Standard appliances
● Modular development
Cons:
● No clear business model yet
● Requires collective action and
density
Pros:
● (Mostly) cheapest per kWh
● Allows industrial use
Cons:
● Slow regulatory and
development cycles
● Fixed capital cost
Pros:
● Buyer and seller are the only
stakeholders
● ‘Self-powered appliances’
● It’s a product, not an electron
Cons:
● Costly per kWh
● Requires new appliance
universe
● Limited productive use
Grid extensions
Mini-grids
Stand-alone systems
34
Photo credits: Lighting Global, Wikipedia
ENERGY ACCESS OPTIONS
On demand access
On
demand
power
Pros:
● Allows productive use
● Standard appliances
● Modular development
Cons:
● No clear business model yet
● Requires collective action and
density
Pros:
● (Mostly) cheapest per kWh
● Allows industrial use
Cons:
● Slow regulatory and
development cycles
● Fixed capital cost
Pros:
● Buyer and seller are the only
stakeholders
● ‘Self-powered appliances’
● It’s a product, not an electron
Cons:
● Costly per kWh
● Requires new appliance
universe
● Limited productive use
Grid extensions
Mini-grids
Stand-alone systems

35
Note: Prices are in real (2015) USD. ‘Current price’ is $0.61/W
Source: Bloomberg New Energy Finance, Maycock
PV MODULE COST EXPERIENCE CURVE (USD/W)
0.1
1
10
100
1 10 100 1,000 10,000 100,000 1,000,000
1976
1985
2003
2012
Cumulative capacity (MW)
2016
2008
36
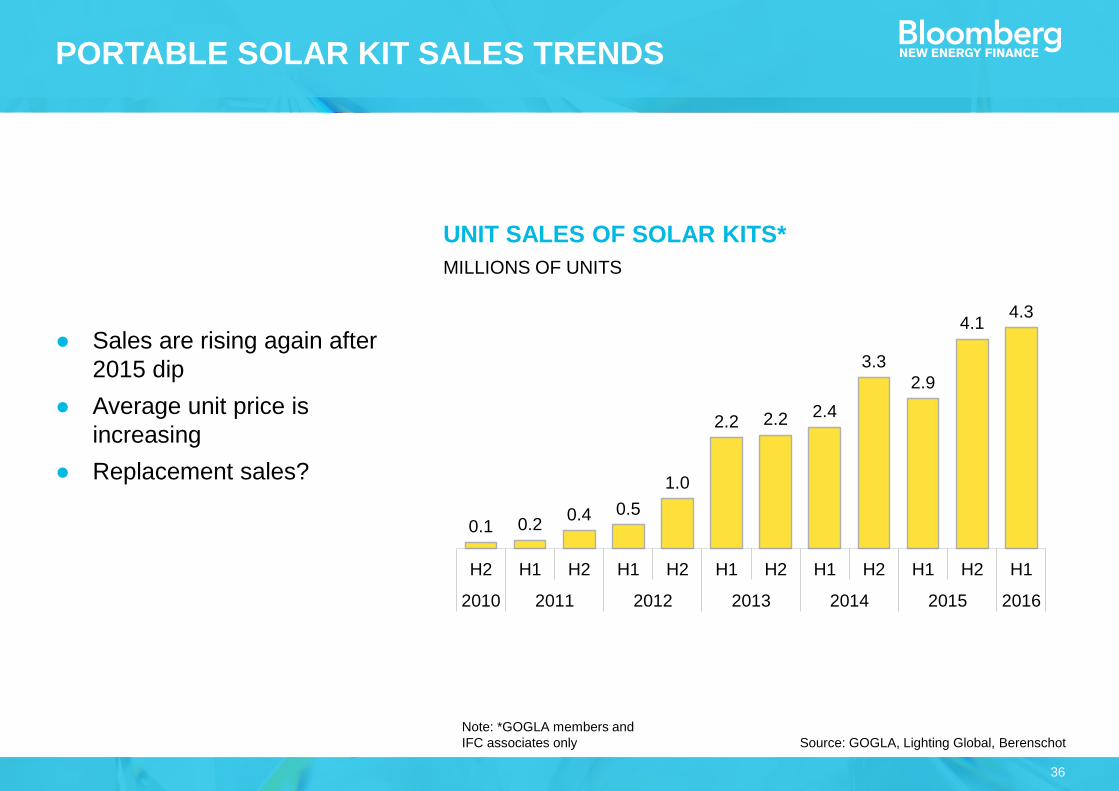
PORTABLE SOLAR KIT SALES TRENDS
● Sales are rising again after
2015 dip
● Average unit price is
increasing
● Replacement sales?
Note: *GOGLA members and
IFC associates only Source: GOGLA, Lighting Global, Berenschot
UNIT SALES OF SOLAR KITS*
MILLIONS OF UNITS
0.1 0.20.4 0.5
1.0
2.2 2.2 2.4
3.3
2.9
4.14.3
H2 H1 H2 H1 H2 H1 H2 H1 H2 H1 H2 H1
2010 2011 2012 2013 2014 2015 2016

37
Source: Ignite Power survey. N=250
WHO BUYS SOLAR HOME SYSTEMS?SURVEY DATA FROM RWANDA
Previously used technology…
17%
26%
35%
22%
Candles Kerosenelamp
Torch Other
3.9
3.6 3.6
4.2
Candles Kerosenelamp
Torch Other
…and its cost (USD/month for
median user)
38
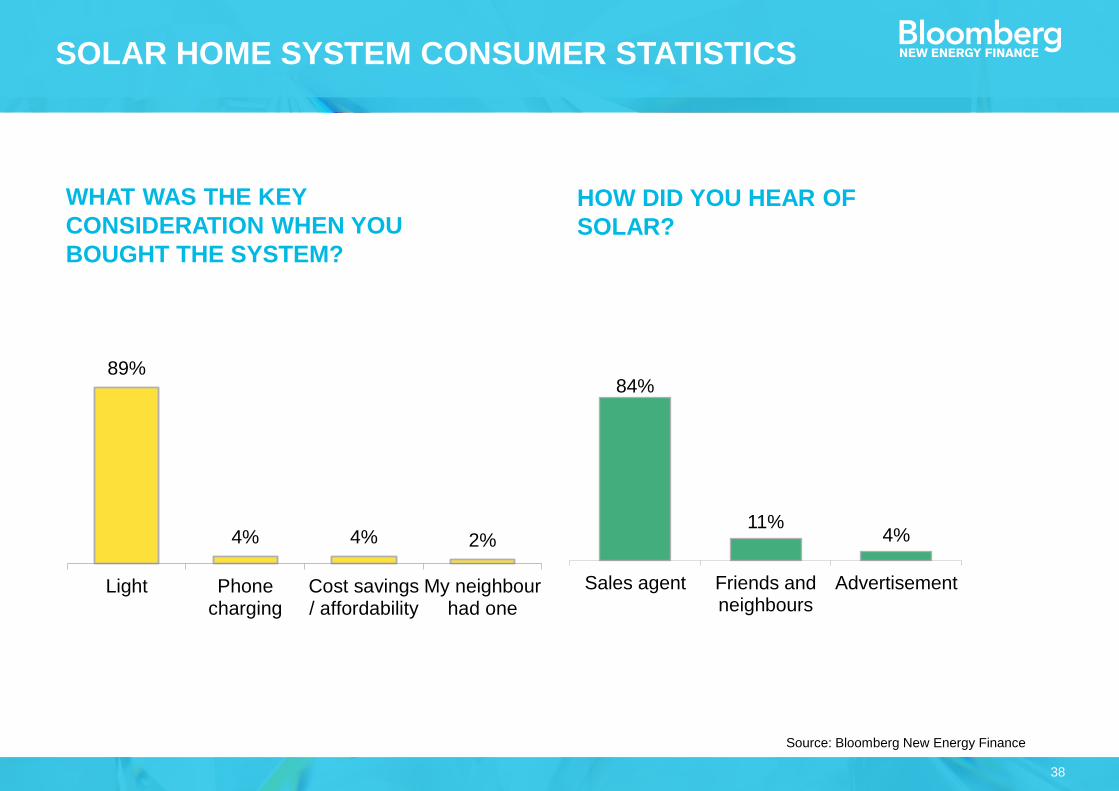
Source: Bloomberg New Energy Finance
SOLAR HOME SYSTEM CONSUMER STATISTICS
HOW DID YOU HEAR OF
SOLAR?
84%
11%4%
Sales agent Friends andneighbours
Advertisement
Total
WHAT WAS THE KEY
CONSIDERATION WHEN YOU
BOUGHT THE SYSTEM?
89%
4% 4% 2%
Light Phonecharging
Cost savings/ affordability
My neighbourhad one
Total
39
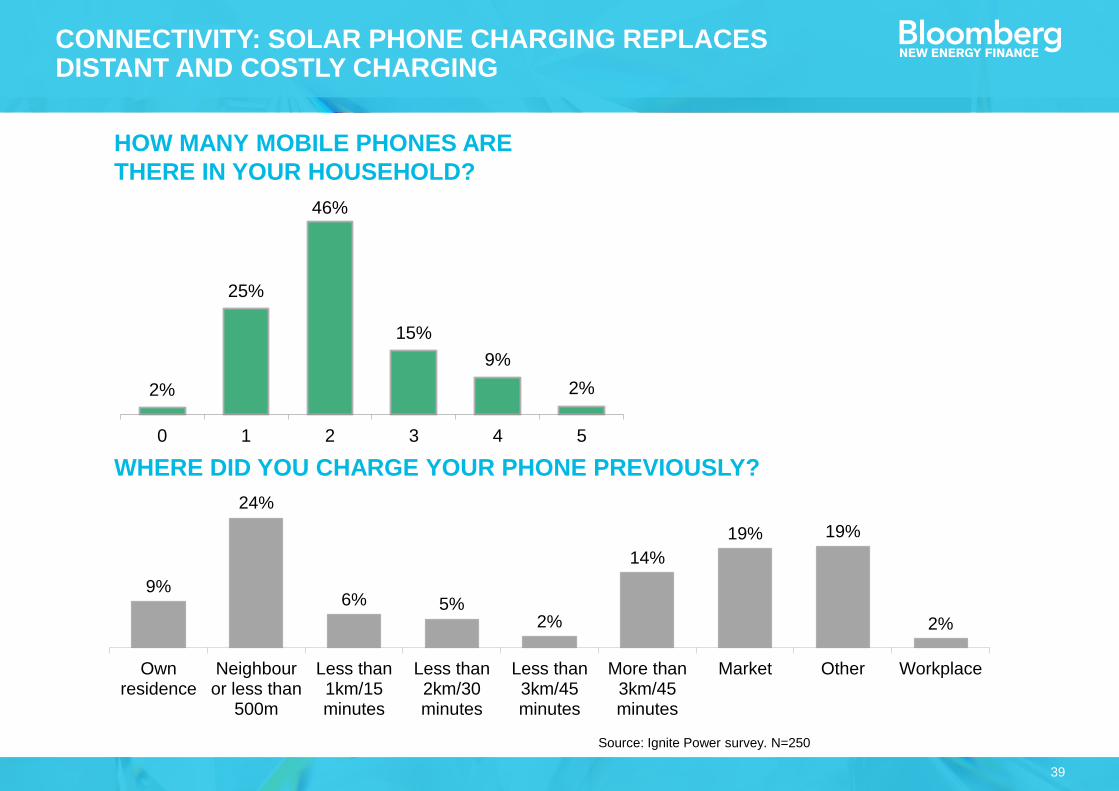
CONNECTIVITY: SOLAR PHONE CHARGING REPLACES DISTANT AND COSTLY CHARGING
HOW MANY MOBILE PHONES ARE
THERE IN YOUR HOUSEHOLD?
Source: Ignite Power survey. N=250
WHERE DID YOU CHARGE YOUR PHONE PREVIOUSLY?
2%
25%
46%
15%
9%
2%
0 1 2 3 4 5
9%
24%
6% 5%2%
14%
19% 19%
2%
Ownresidence
Neighbouror less than
500m
Less than1km/15minutes
Less than2km/30minutes
Less than3km/45minutes
More than3km/45minutes
Market Other Workplace
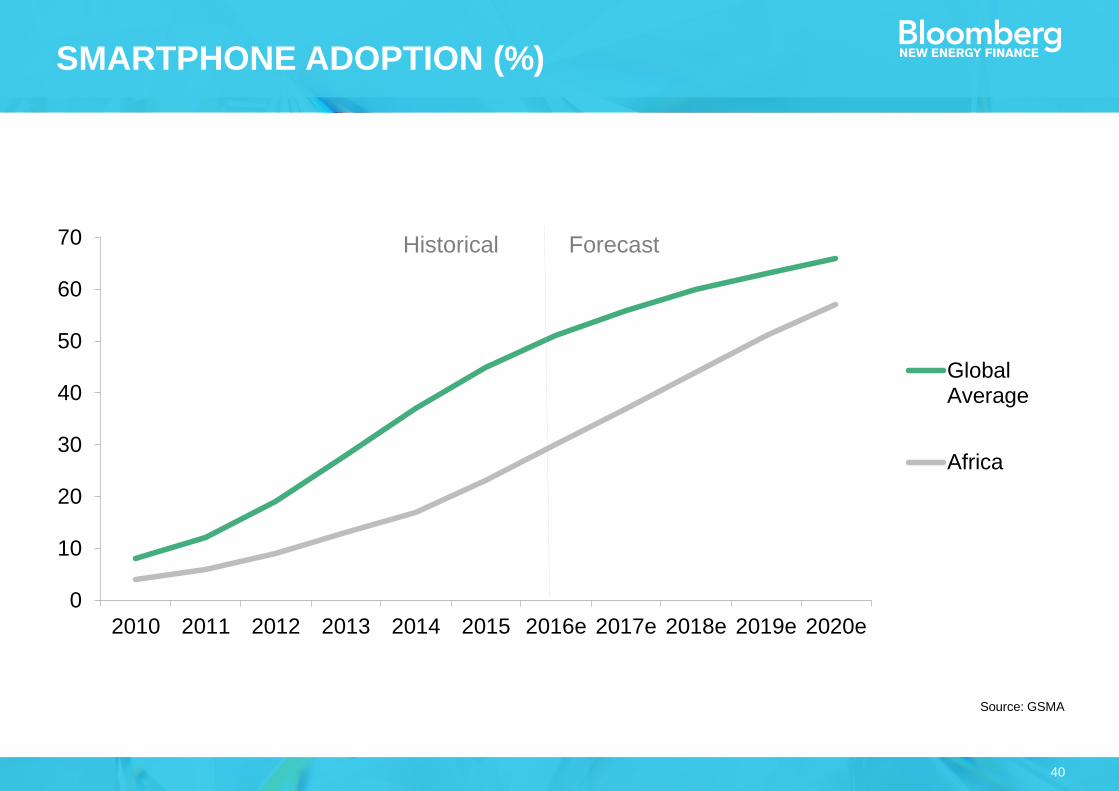
40
0
10
20
30
40
50
60
70
2010 2011 2012 2013 2014 2015 2016e 2017e 2018e 2019e 2020e
GlobalAverage
Africa
Historical Forecast
SMARTPHONE ADOPTION (%)
Source: GSMA

41
0
100
200
300
400
2014(super-
efficient)
PV Battery Balance ofsystem
Lights Appliances 2020
PRODUCTION COST DEVELOPMENTS, NOMINAL $ PER UNIT
Source: Powering a Home with Just 25 Watts of Solar PV: SuperEfficient Appliances
Can Enable Expanded Off-Grid Energy Service Using Small Solar Power Systems,
Dalberg, EERE Solid-State Lighting Programme, Bloomberg New Energy Finance ,
GOGLA, IFC Lighting Global
0
5
10
15
20
2014 PV Battery Balance ofsystem
Light 2020
Entry-level portable light,
eg d.light S2
Solar home system with
TV, radio, lights
-29%-10% -11%-3%
-50%
-8% -28%
-9% -4%Large portable light,
eg d.light s300
-45%-7%
-7% -3% -3% -26%
-5%
0
1
2
3
4
5
2015 PV Battery Balance ofsystem
LEDs 2020

PAY-AS-YOU-GO
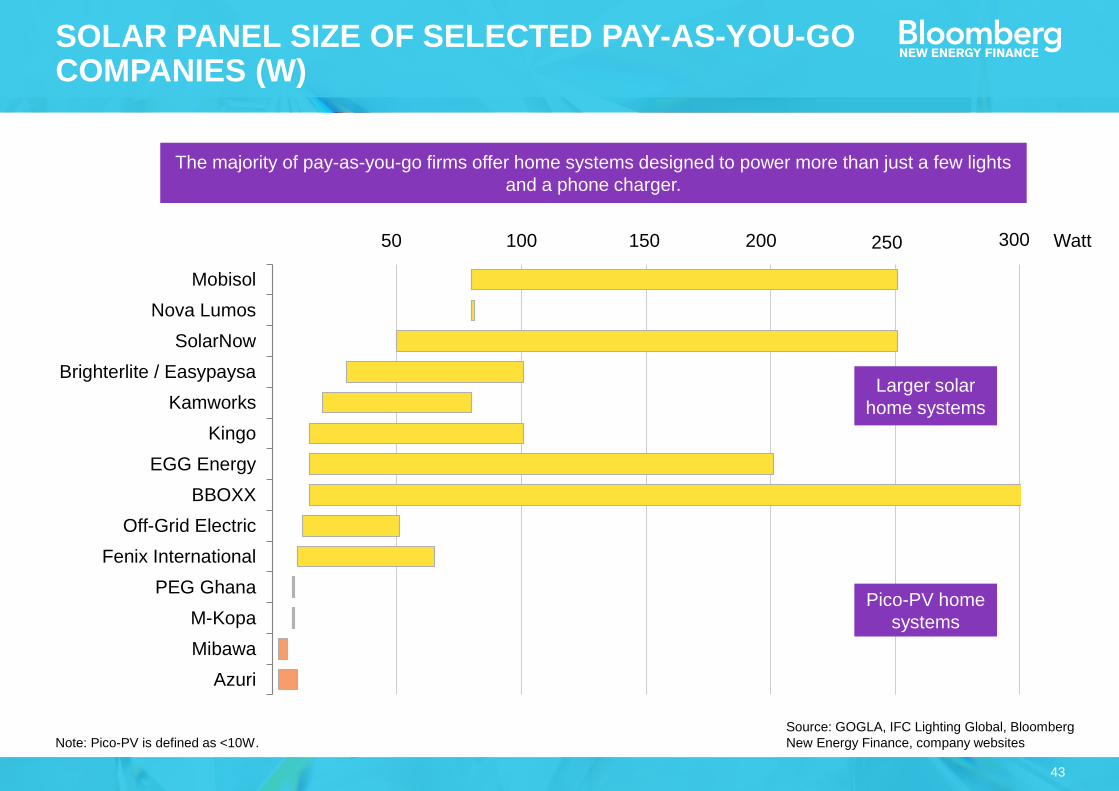
43
Azuri
Mibawa
M-Kopa
PEG Ghana
Fenix International
Off-Grid Electric
BBOXX
EGG Energy
Kingo
Kamworks
Brighterlite / Easypaysa
SolarNow
Nova Lumos
Mobisol
Note: Pico-PV is defined as <10W.
Source: GOGLA, IFC Lighting Global, Bloomberg
New Energy Finance, company websites
SOLAR PANEL SIZE OF SELECTED PAY-AS-YOU-GO COMPANIES (W)
50 100 150 200 250 300 Watt
The majority of pay-as-you-go firms offer home systems designed to power more than just a few lights
and a phone charger.
Pico-PV home
systems
Larger solar
home systems

44
Note: The list of companies represents a sample and does not claim to be comprehensive.
Source: GOGLA, IFC Lighting Global,
Bloomberg New Energy Finance
THE SHIFT TO PAYG CHANGES THE DYNAMICS BETWEEN THE CUSTOMER AND THE PROVIDER
Technology risk
Data
Higher value
services
Service guarantee
Stronger relationships between customer and provider
Financing
Upsell opportunity
45
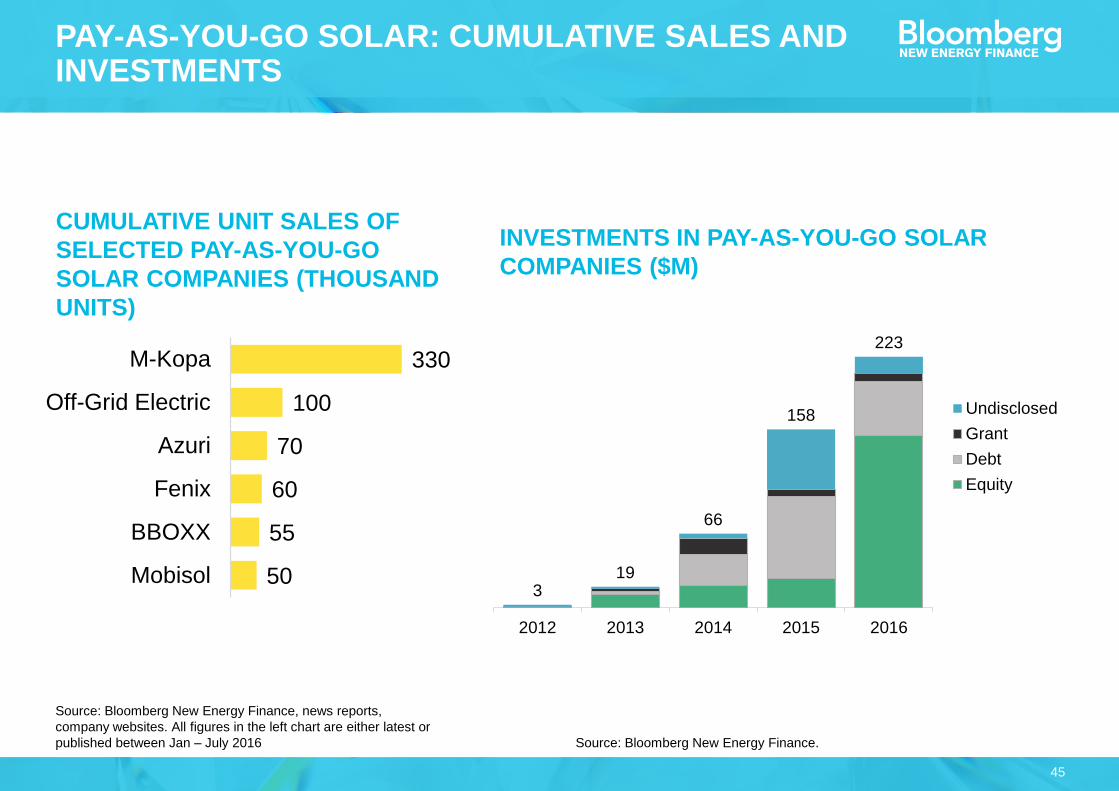
PAY-AS-YOU-GO SOLAR: CUMULATIVE SALES AND INVESTMENTS
50
55
60
70
100
330
Mobisol
BBOXX
Fenix
Azuri
Off-Grid Electric
M-Kopa
Source: Bloomberg New Energy Finance, news reports,
company websites. All figures in the left chart are either latest or
published between Jan – July 2016 Source: Bloomberg New Energy Finance.
CUMULATIVE UNIT SALES OF
SELECTED PAY-AS-YOU-GO
SOLAR COMPANIES (THOUSAND
UNITS)
INVESTMENTS IN PAY-AS-YOU-GO SOLAR
COMPANIES ($M)
319
66
158
223
2012 2013 2014 2015 2016
Undisclosed
Grant
Debt
Equity

46
Product design
OperationsConsumer financing
Retail distribution
Upselling to DC
appliances
Source: GOGLA, IFC Lighting Global,
Bloomberg New Energy Finance
PAY-AS-YOU-GO BUSINESS STRATEGIES
Product developer
Pure-play distributor
Service platform
developers
Integrated service
providers

47
Note: *H1 2016 is estimated at 1.5x data reported up to May 2016. Source: Bloomberg New Energy Finance, IDCOL.
SALES OF SHS UNDER THE IDCOL PROGRAMME BY COMPANY, H1 2006–H1 2016* (UNITS)
17k 20k 32k 38k53k 51k
64k
104k
142k
183k
244k225k
313k330k
453k
400k404k
321k
284k
167k
120k
0m
1m
2m
3m
4m
5m
0.0m
0.1m
0.2m
0.3m
0.4m
0.5m
H1 H2 H1 H2 H1 H2 H1 H2 H1 H2 H1 H2 H1 H2 H1 H2 H1 H2 H1 H2 H1
2006 2007 2008 2009 2010 2011 2012 2013 2014 2015 '16*
Other
AVA
SRIZONY
RDF
BGEF
SEF
HFSKS
RSF (Rahimafrooz)
Grameen Shakti
Total, cumulative(right-hand axis)
48
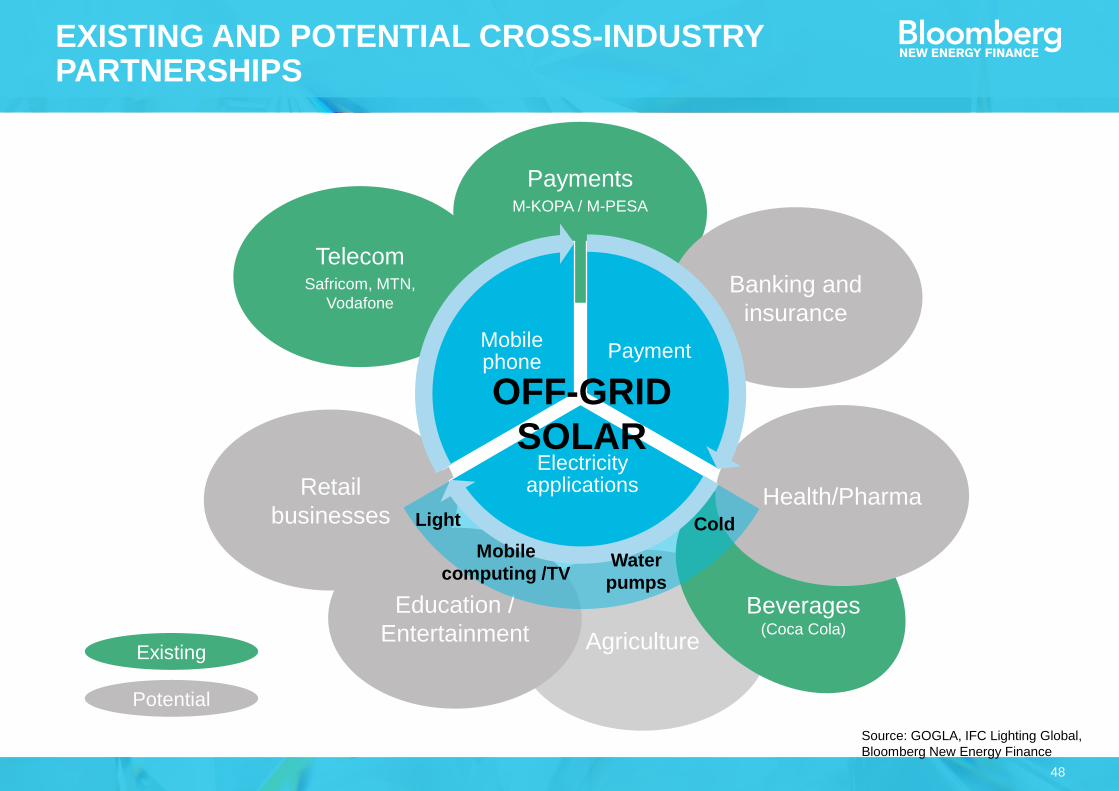
Agriculture
EXISTING AND POTENTIAL CROSS-INDUSTRY PARTNERSHIPS
PaymentsM-KOPA / M-PESA
Education /
Entertainment
Retail
businessesHealth/Pharma
Banking and
insurance
TelecomSafricom, MTN,
Vodafone
Payment
Electricity applications
Mobile phone
Cold
Mobile
computing /TV
Light
Beverages(Coca Cola)
OFF-GRID
SOLAR
Existing
Potential
Water
pumps
Source: GOGLA, IFC Lighting Global,
Bloomberg New Energy Finance

49
CHALLENGES TO THE PAYG INDUSTRY
● Long lead time for building the company infrastructure
● Geographical differences in terms of business environment (eg.,
mobile-money infrastructure)
● Demand for debt financing will continue to outstrip supply for the
foreseeable future

MINI-GRID

51
MINI-GRID DEVELOPMENT MODELS
Grid-quality power
Partial power
Top-down
developmentBottom-up
development
Characteristics:
● DC power
● Grid uptime <24/7
● Grant financed through
government development
agencies
● Focus on residential rural
customers
Characteristics:
● 24/7 AC power
● Formal agreement with
government agency or utility
● Anchor or dominant off-taker
common
● Steady cash flows
● Grid connection/ distribution grid
may already be established
● Diesel replacement common
Characteristics:
● DC power
● Grid uptime <24/7
● Solar + storage assets
● Company manages all aspects
of mini-grid value chain and
develops retail network
● Focus on residential rural
customers
● High exposure to payment risks
Characteristics:
● 24/7 AC power
● Solar + storage + diesel
generator assets
● Company manages many
aspects of mini-grid value chain
and develops retail network
● Focus on productive consumers /
businesses to balance exposure
to payment risks from residential
customers
Source: Bloomberg New Energy Finance
52
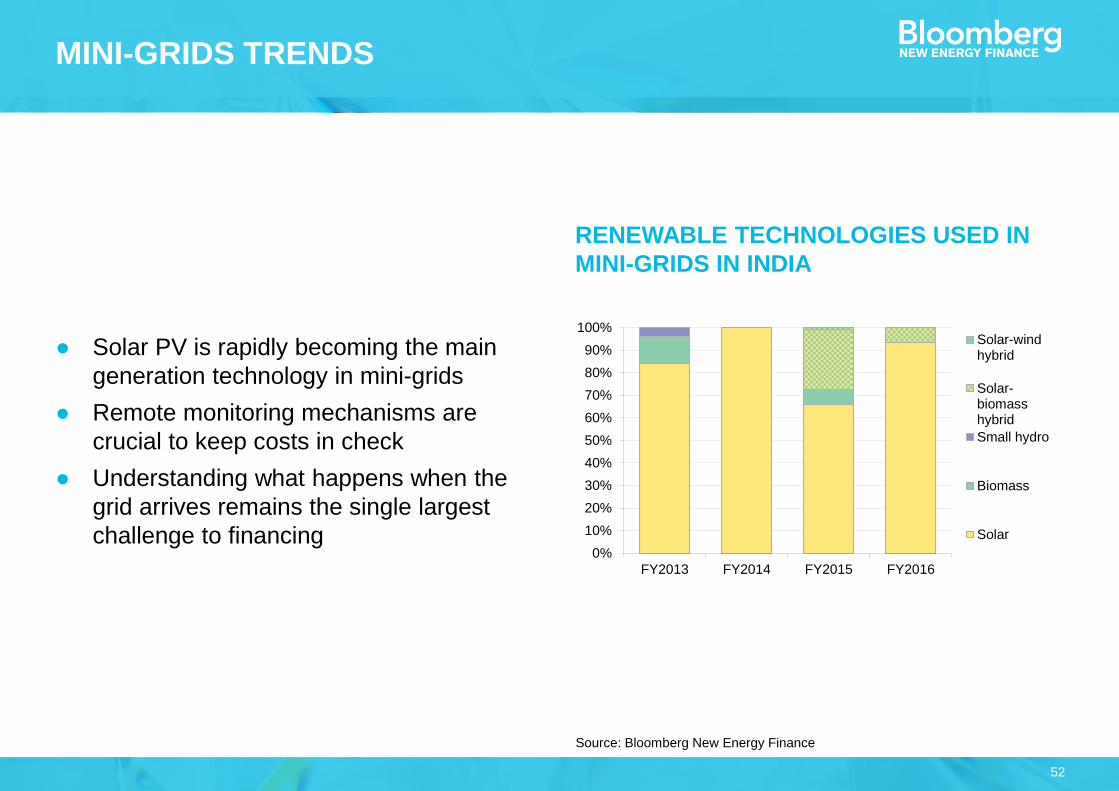
MINI-GRIDS TRENDS
● Solar PV is rapidly becoming the main
generation technology in mini-grids
● Remote monitoring mechanisms are
crucial to keep costs in check
● Understanding what happens when the
grid arrives remains the single largest
challenge to financing
Source: Bloomberg New Energy Finance
RENEWABLE TECHNOLOGIES USED IN
MINI-GRIDS IN INDIA
0%
10%
20%
30%
40%
50%
60%
70%
80%
90%
100%
FY2013 FY2014 FY2015 FY2016
Solar-windhybrid
Solar-biomasshybrid
Small hydro
Biomass
Solar
53
Consumers are willing to pay premium tariffs
KEY TAKEAWAYS
Simple technologies create a highly competitive market
Distribution relationships open up-sell opportunities
Future grid arrival remains the largest challenge to
finance mini-grids
3. SUCCESSFUL POLICY CASES
CASE 1: RENEWABLE ENERGY AUCTION

56
Note: bids are reflective of lowest bid in each country. China’s auction programme is currently on hold but may be re-
introduced in the near future. Tenders have been used infrequently at a state level rather than nationwide in the US and
Australia. Dollar values are nominal and converted using exchange rate on the day of the result announcement. Source: Climatescope 2016
COUNTRIES WITH CLEAN ENERGY TENDER PROGRAMMES AND SELECT RECENT LOWEST CLEARING PRICES, H1 2016

57
ONSHORE WINDSOLAR PV
Location:
Bidder:
Signed:
Construction:
Price:
Morocco
Enel Green Power
January 2016
2018
US$ 3.0 c/kWh
Location:
Bidder:
Signed:
Construction:
Price:
Peru
Enel Green Power
February 2016
2017
US$ 4.8 c/kWh
2016 UNSUBSIDISED CLEAN ENERGY 2016WORLD RECORDS
Source: Bloomberg New Energy Finance; ImagesSiemens; Wikimedia Commons

58
ONSHORE WIND
Location:
Bidder:
Signed:
Construction:
Price:
Morocco
Enel Green Power
January 2016
2018
US$ 3.0 c/kWh
Location:
Bidder:
Signed:
Construction:
Price:
Coahuila, Mexico
Enel Green Power
March 2016
2018
US$ 3.6 c/kWh
2016 UNSUBSIDISED CLEAN ENERGY 2016WORLD RECORDS
Source: Bloomberg New Energy Finance; ImagesSiemens; Wikimedia Commons
SOLAR PV

59
ONSHORE WINDSOLAR PV
Location:
Bidder:
Signed:
Construction:
Price:
Morocco
Enel Green Power
January 2016
2018
US$ 3.0 c/kWh
Location:
Bidder:
Signed:
Construction:
Price:
Dubai
Masdar Consortium
May 2016
2019
US$ 2.99 c/kWh
2016 UNSUBSIDISED CLEAN ENERGY 2016WORLD RECORDS
Source: Bloomberg New Energy Finance; ImagesSiemens; Wikimedia Commons

60
ONSHORE WINDSOLAR PV
Location:
Bidder:
Signed:
Construction:
Price:
Morocco
Enel Green Power
January 2016
2018
US$ 3.0 c/kWh
Location:
Bidder:
Signed:
Construction:
Price:
Chile
Solarpack Corporation
August 2016
2019
US$ 2.91 c/kWh
2016 UNSUBSIDISED CLEAN ENERGY 2016WORLD RECORDS
Source: Bloomberg New Energy Finance; ImagesSiemens; Wikimedia Commons

61
Source: Bloomberg New Energy Finance
PRICE IMPACT OF SWITCH FROM FIT TO AUCTIONS, SELECTED COUNTRIES (NORMALISED)
SOLAR PV
(unit price normalised to 100 at date of first auction)
ONSHORE WIND
(unit price normalised to 100 at date of first auction)
: non-tariff
price signals
: tariffs
: auctions
KEY
EMEA
Other LatAm
Brazil
India
South Africa0
20
40
60
80
100
120
140
160
+3+2+10-1-2-3
- 30% - 50%
0
20
40
60
80
100
120
140
160
+3+2+10-1-2-3
- 35% - 60%

62
PRICE AND COMPETITION LEVEL OF SOUTH AFRICA’S RENEWABLE ENERGY AUCTIONS ($/KWH)
R1
R2R3
R4
Round (R) 1
R2
R3
R4
0
5
10
15
20
25
30
35
40
0 1 2
Wind
PV
Undersubsribed / low competition Oversubsribed / high competition
63
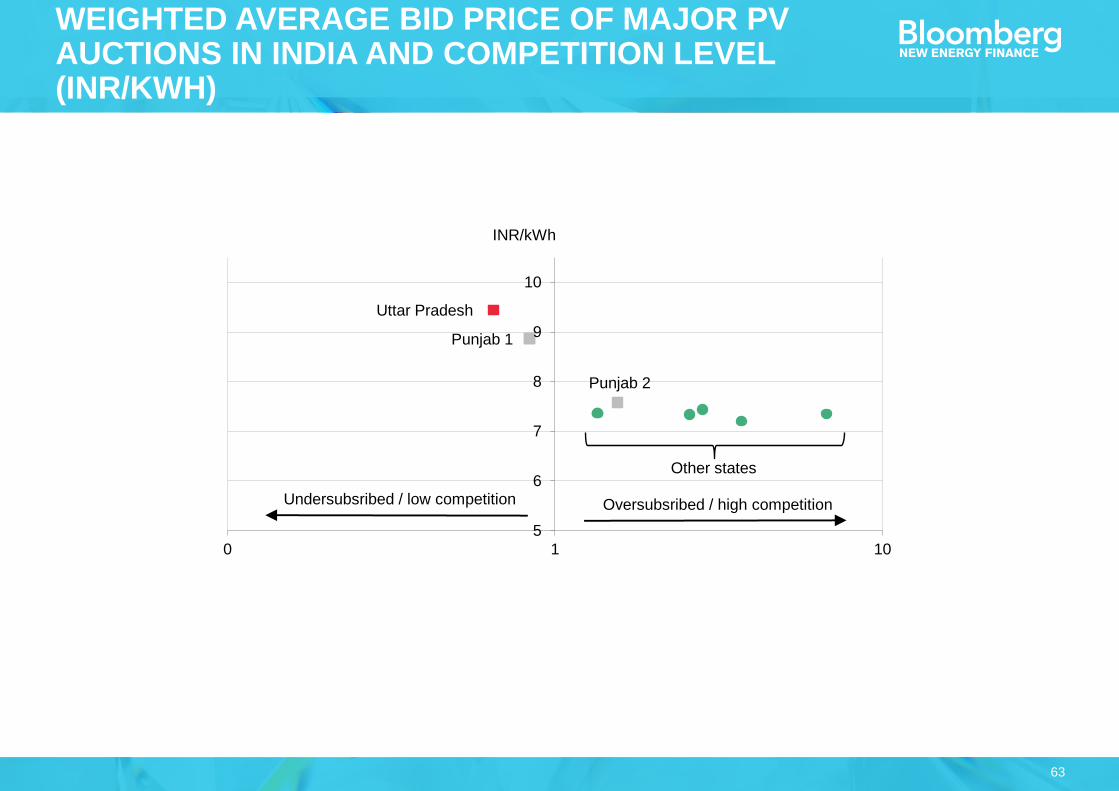
WEIGHTED AVERAGE BID PRICE OF MAJOR PV AUCTIONS IN INDIA AND COMPETITION LEVEL (INR/KWH)
Punjab 1
Uttar Pradesh
Punjab 2
5
6
7
8
9
10
0 1 10
Undersubsribed / low competition Oversubsribed / high competition
Other states
INR/kWh

CASE 2: ELECTRIFICATION PROGRAMME IN PERU
65
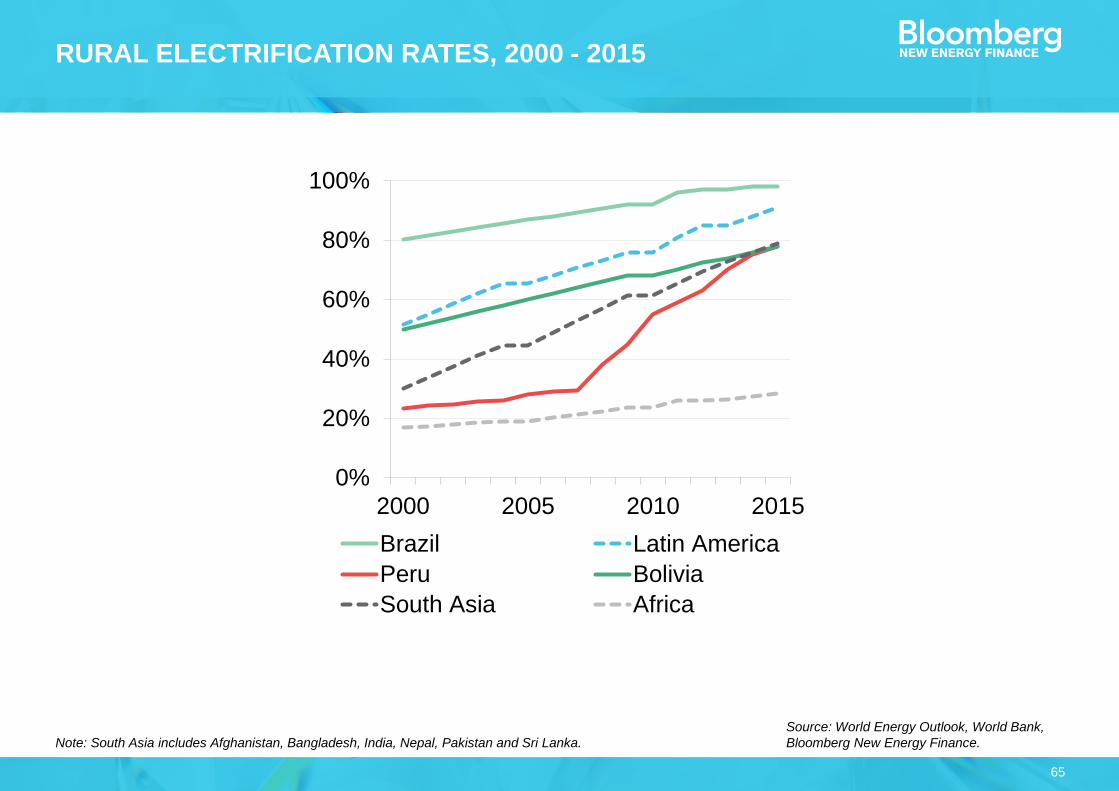
RURAL ELECTRIFICATION RATES, 2000 - 2015
Note: South Asia includes Afghanistan, Bangladesh, India, Nepal, Pakistan and Sri Lanka.
Source: World Energy Outlook, World Bank,
Bloomberg New Energy Finance.
0%
20%
40%
60%
80%
100%
2000 2005 2010 2015
0%
100%
2000 2005 2010 2015
Brazil Latin America
Peru Bolivia
South Asia Africa

66
PERU’S RURAL ELECTRIFICATION BUDGET AND ELECTRIFICATION RATES, 2000-2025
Note: 2006-2015 budget break down was estimated based on PNER 2004-2013 and PNER 2009-2018.
Source: OSINERGMIN, Bloomberg New
Energy Finance.
41 45
13
44 38 4736
8498
176
223
183
149 154
116 113
403
279
178 186
101
4464
25 25 26
Rural electrification rate
National eletrification rate
10%
20%
30%
40%
50%
60%
70%
80%
90%
100%
-
50
100
150
200
250
300
350
400
450
2000 2002 2004 2006 2008 2010 2012 2014 2016 2018 2020 2022 2024
Total invested - mix of technologies Mini-grids Grid extension PV systems Small hydro plants Wind Investment in utilities
Pre General Rural Electrification Law
Post General Rural Electrification Law

67
HOUSEHOLDS ELECTRIFIED PER $1M INVESTED BY THE GOVERNMENT, 2006 - 2025
Source: OSINERGMIN, Bloomberg New
Energy Finance
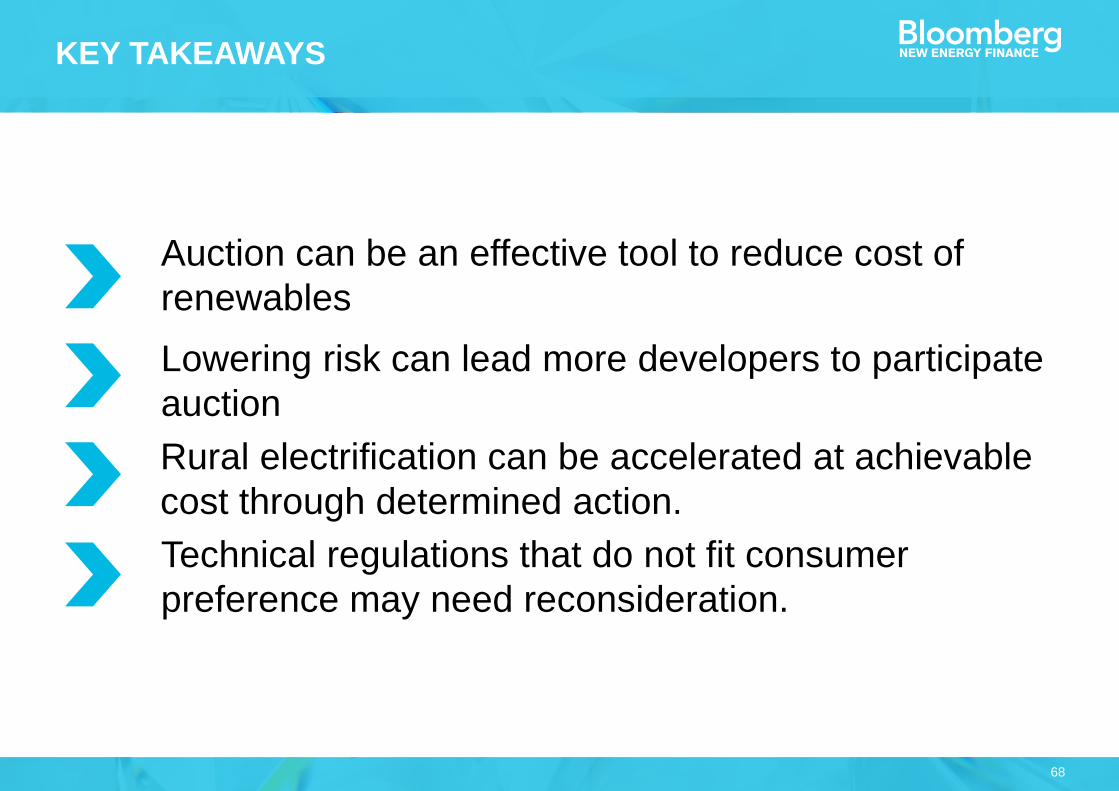
68
Auction can be an effective tool to reduce cost of
renewables
KEY TAKEAWAYS
Lowering risk can lead more developers to participate
auction
Rural electrification can be accelerated at achievable
cost through determined action.
Technical regulations that do not fit consumer
preference may need reconsideration.
SUMMARY
70
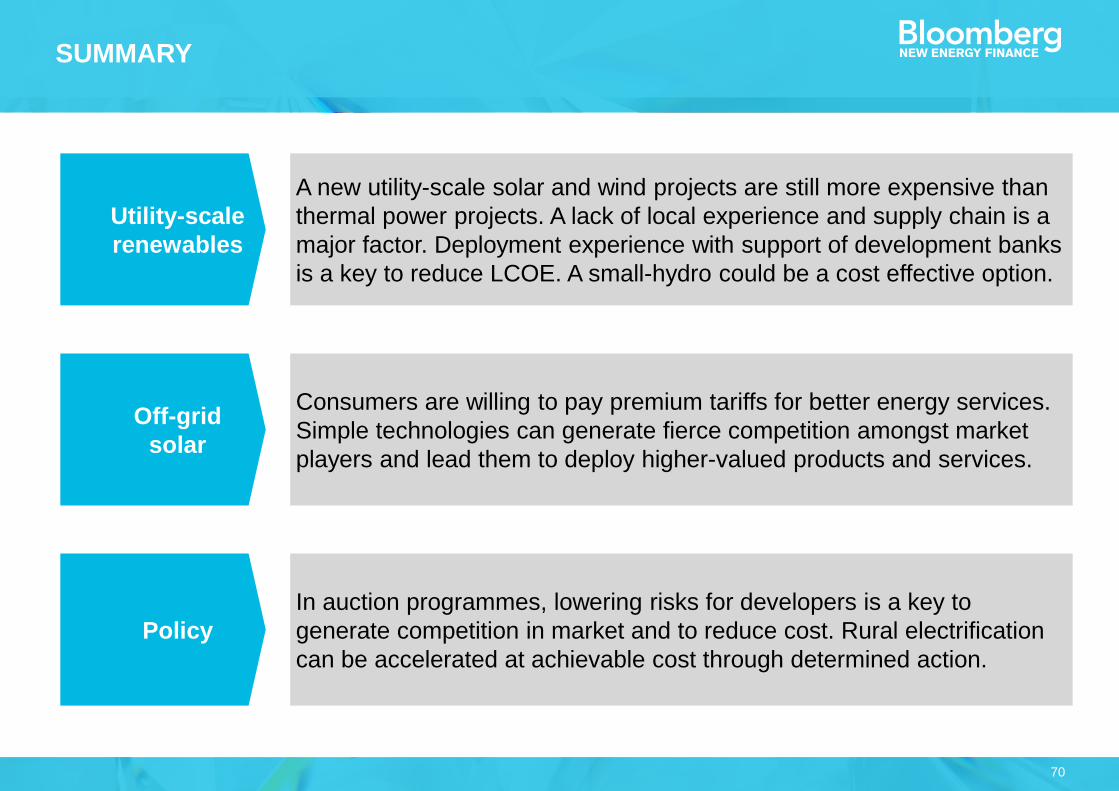
SUMMARY
● Utility-scale
renewables
A new utility-scale solar and wind projects are still more expensive than
thermal power projects. A lack of local experience and supply chain is a
major factor. Deployment experience with support of development banks
is a key to reduce LCOE. A small-hydro could be a cost effective option.
In auction programmes, lowering risks for developers is a key to
generate competition in market and to reduce cost. Rural electrification
can be accelerated at achievable cost through determined action.
Consumers are willing to pay premium tariffs for better energy services.
Simple technologies can generate fierce competition amongst market
players and lead them to deploy higher-valued products and services.
● Off-grid
solar
● Policy

BNEF COVERAGE OF FRONTIER POWER

72
FURTHER READING
Sample reports

73
RESEARCH SCOPE FOR BNEF FRONTIER POWER
Solar lanterns
Solar home systems
DC micro grids
Irrigation and agriculture mechanisation
(Back-up) diesel replacement
C&I energy in emerging markets
Grid improvements
Off-grid Weak grid
24/7 AC mini-grids
Grid extensions
Communication and critical infrastructure
Uninterrupted power supply
74
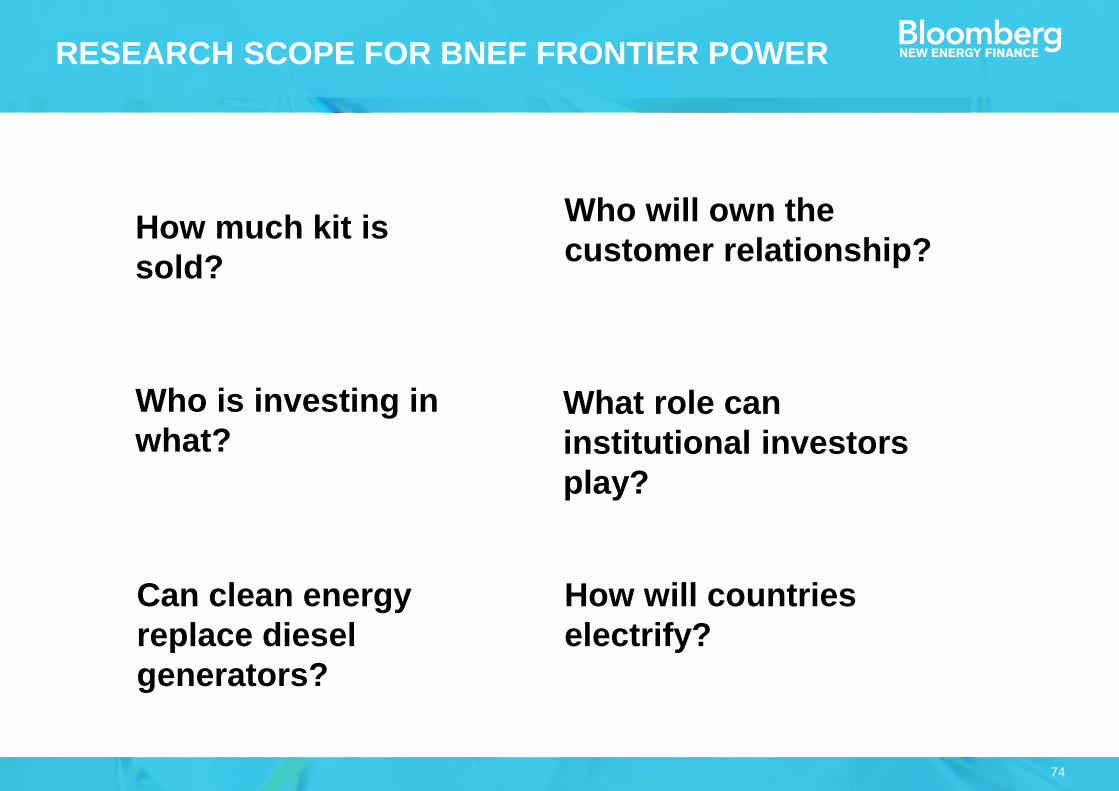
How much kit is
sold?
How will countries
electrify?
Who will own the
customer relationship?
What role can
institutional investors
play?
Can clean energy
replace diesel
generators?
Who is investing in
what?
RESEARCH SCOPE FOR BNEF FRONTIER POWER

7530 January 2017
THE TEAM
Itamar Orlandi
Head of Frontier
Power
Michael Wilshire
Head of Strategy
Takehiro Kawahara
Lead Analyst
Raksha Gosai
Data researcher
Isabelle Edwards
Analyst
Ankit Agarwal
Analyst

76
REFERENCE
Climate Scope 2016
(http://global-climatescope.org/en/)
UK DFID LCOE Study
(https://www.gov.uk/dfid-research-outputs/levelised-cost-of-electricity)
Off-grid Solar Market Trend 2016
(https://about.bnef.com/blog/off-grid-solar-market-trends-report-2016/)
Off-Grid and Mini-Grid: Q1 2017 Market Outlook
(https://about.bnef.com/blog/off-grid-mini-grid-q1-2017-market-outlook/)
78
This publication is the copyright of Bloomberg New Energy Finance. No portion of this document may be photocopied,
reproduced, scanned into an electronic system or transmitted, forwarded or distributed in any way without prior consent of
Bloomberg New Energy Finance.
The information contained in this publication is derived from carefully selected sources we believe are reasonable. We do
not guarantee its accuracy or completeness and nothing in this document shall be construed to be a representation of such
a guarantee. Any opinions expressed reflect the current judgment of the author of the relevant article or features, and does
not necessarily reflect the opinion of Bloomberg New Energy Finance, Bloomberg Finance L.P., Bloomberg L.P. or any of
their affiliates ("Bloomberg"). The opinions presented are subject to change without notice. Bloomberg accepts no
responsibility for any liability arising from use of this document or its contents. Nothing herein shall constitute or be
construed as an offering of financial instruments, or as investment advice or recommendations by Bloomberg of an
investment strategy or whether or not to "buy," "sell" or "hold" an investment.
COPYRIGHT AND DISCLAIMER
Unique analysis, tools and data for decision-makers
driving change in the energy system
MARKETS Renewable Energy
Energy Smart Technologies
Advanced Transport
Gas
Carbon and RECs
SERVICESAmericas Service
Asia Pacific Service
EMEA Service
Applied Research
Events and Workshops
Takehiro Kawahara