MARKET TRENDS - gis.cushwakenm.com
4
Navigating the Minneapolis/St. Paul Commercial Real Estate Market EXECUTIVE SUMMARY / JULY 2020 VACANCY RATE 10.7% NEW CONSTRUCTION 1.0M SF MARKET TRENDS ABSORPTION 1.26M SF
Transcript of MARKET TRENDS - gis.cushwakenm.com

Navigating the Minneapolis/St. Paul Commercial Real Estate Market
EXECUTIVE SUMMARY / JULY 2020
VACANCY RATE10.7%
NEW CONSTRUCTION1.0M SF
MARKET TRENDS
ABSORPTION1.26M SF

The first half of 2020 started strong with record-setting sales and positive absorption. Uncertainty from COVID-19 caused a pause in most sales and leases in Q2, but companies continue to plan for the future and explore opportunities..
INDUSTRIAL
LANDHOTEL
MEDICAL OFFICE
COMPASS EXECUTIVE SUMMARY / JULY 20202
- Mike Ohmes, Managing Principal, Minneapolis-St. Paul Office, Cushman & Wakefield
Twin Cities industrial vacancy continued to tighten even as leasing and construction momentum slowed by mid-year. The first-half direct vacancy rate of 7.0% represented a minimal increase of 20 basis points (bps) from year-end 2019, though the rate was an 80-bps drop from the 7.8% recorded at mid-year 2019.
INDUSTRIAL SECTOR HIGHLIGHTS• Lease activity remained stable in the early months of 2020, and
most new construction projects delivered with tenants in place, contributing to the positive absorption total.
• New deliveries totaled just over 640,000 sf and were concentrated in the Northwest, led by a pair of speculative bulk warehouse projects by Scannell Properties and Opus.
• As rental rates continued to increase, and moving and material costs trended upward, tenants became more deliberate in their long-term facilities planning.
1H Industrial Absorption
Modest Slowdown in Leasing, Constructionas Market Remains Tight
Landlords Push Rates Modestly Across Market
COVID-19 Disrupts Care Delivery,Accelerates Trends
COVID-19 forced healthcare providers to deploy telemedicine practices on a large scale. Widespread limitations on in-person care in the first half had a major financial impact across the industry. Leasing activity, particularly on-campus, centered on extensions of critical leases, and off-campus development activity continued at a measured pace.
MEDICAL OFFICE SECTOR HIGHLIGHTS• With wide deployment of telehealth, employers are evaluating job
functions that could be converted to full-time work-from-home in the new model, which will inform long-term real estate decisions.
• Convenience of on-campus locations remains a priority for larger health systems that are consolidating branding and services. Same-day providers shift toward off-campus product given cost savings on real estate and a more straightforward patient experience.
• Tenants will require more flexibility in lease terms as the business impact of the pandemic and long-term space needs become clearer.
Industrial & Residential RegainMomentum Following Pause
Twin Cities’ land deals progressed at a slower pace following the pause in activity during the early spring, but overall completed deal activity in the first half exceeded expectations.
LAND SECTOR HIGHLIGHTS• In-fill industrial product with outdoor storage continued to drive
demand, particularly among eCommerce users, as access and location remained the keys to industrial land deals.
• Office and retail remained largely on hold, and most recent deal activity among these product types has been user-driven.
• Developers have been more creative with remaining residential sites in the market, including increasing focus on townhome product as well as single-family developments specifically for renters.
Preferences Rapidly Evolving
Long Road to Recovery Began in May
The growth of new supply in the Twin Cities, which in recent years outpaced record demand, has contributed to uncertainty in the development pipeline going forward. More liquidity in the market compared to previous recessions will support resumed deal activity as the market recovers and enters pricing discovery.
HOTEL SECTOR HIGHLIGHTS• New projects that had broken ground prior to the pandemic
shutdown have proceeded with construction activity.
• The extended up-cycle in prior years brought unprecedented levels of new supply to the market.
• Extended stay, economy, midscale and select leisure-oriented properties showed improved performance starting in May.
Daily Airline Travelers In Mid-April2M FEWER
$19.60PSF 885K SF
SINGLE & MULTI-FAMILY
OFFICE
MULTIFAMILYINVESTMENT & CAPITAL MARKETS
3
Navigating the Minneapolis-St. Paul Commercial Real Estate Market
RETAIL
COMPASS EXECUTIVE SUMMARY / JULY 2020
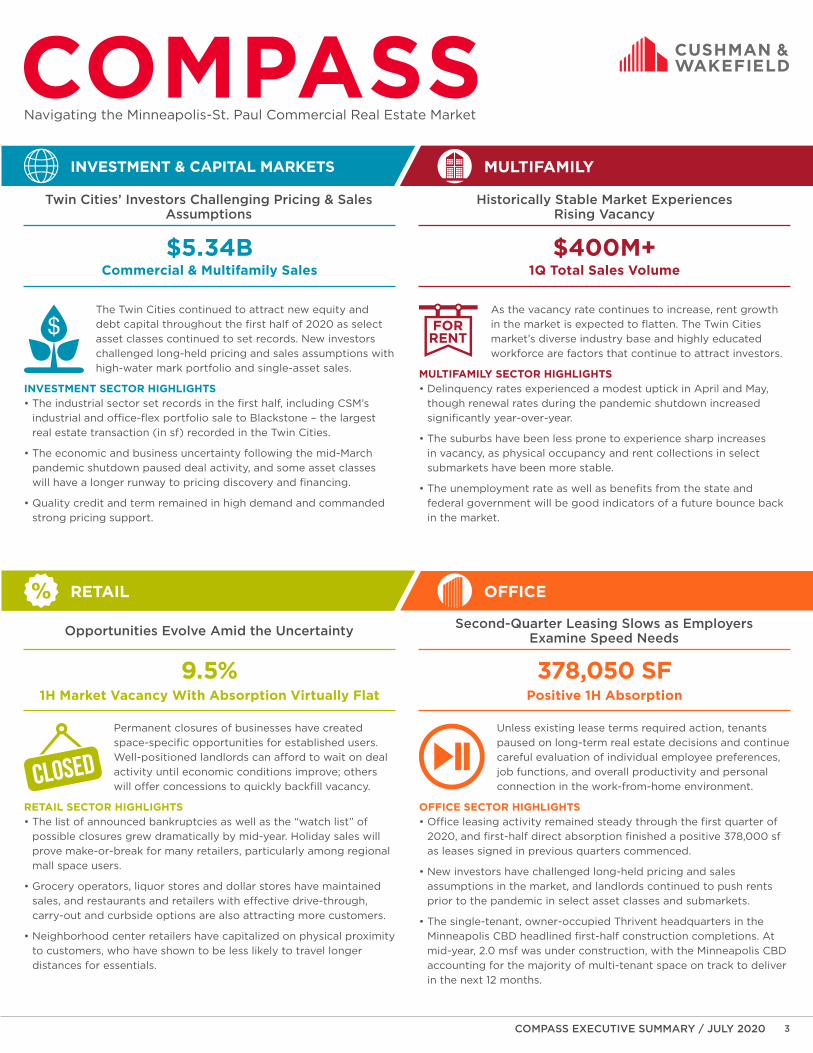
1Q Total Sales Volume
Historically Stable Market ExperiencesRising Vacancy
As the vacancy rate continues to increase, rent growth in the market is expected to flatten. The Twin Cities market’s diverse industry base and highly educated workforce are factors that continue to attract investors.
MULTIFAMILY SECTOR HIGHLIGHTS• Delinquency rates experienced a modest uptick in April and May,
though renewal rates during the pandemic shutdown increased significantly year-over-year.
• The suburbs have been less prone to experience sharp increases in vacancy, as physical occupancy and rent collections in select submarkets have been more stable.
• The unemployment rate as well as benefits from the state and federal government will be good indicators of a future bounce back in the market.
Opportunities Evolve Amid the Uncertainty
Permanent closures of businesses have created space-specific opportunities for established users. Well-positioned landlords can afford to wait on deal activity until economic conditions improve; others will offer concessions to quickly backfill vacancy.
RETAIL SECTOR HIGHLIGHTS• The list of announced bankruptcies as well as the “watch list” of
possible closures grew dramatically by mid-year. Holiday sales will prove make-or-break for many retailers, particularly among regional mall space users.
• Grocery operators, liquor stores and dollar stores have maintained sales, and restaurants and retailers with effective drive-through, carry-out and curbside options are also attracting more customers.
• Neighborhood center retailers have capitalized on physical proximity to customers, who have shown to be less likely to travel longer distances for essentials.
1H Market Vacancy With Absorption Virtually Flat Positive 1H Absorption
Second-Quarter Leasing Slows as EmployersExamine Speed Needs
Unless existing lease terms required action, tenants paused on long-term real estate decisions and continue careful evaluation of individual employee preferences, job functions, and overall productivity and personal connection in the work-from-home environment.
OFFICE SECTOR HIGHLIGHTS• Office leasing activity remained steady through the first quarter of
2020, and first-half direct absorption finished a positive 378,000 sf as leases signed in previous quarters commenced.
• New investors have challenged long-held pricing and sales assumptions in the market, and landlords continued to push rents prior to the pandemic in select asset classes and submarkets.
• The single-tenant, owner-occupied Thrivent headquarters in the Minneapolis CBD headlined first-half construction completions. At mid-year, 2.0 msf was under construction, with the Minneapolis CBD accounting for the majority of multi-tenant space on track to deliver in the next 12 months.
The Twin Cities continued to attract new equity and debt capital throughout the first half of 2020 as select asset classes continued to set records. New investors challenged long-held pricing and sales assumptions with high-water mark portfolio and single-asset sales.
INVESTMENT SECTOR HIGHLIGHTS• The industrial sector set records in the first half, including CSM’s
industrial and office-flex portfolio sale to Blackstone – the largest real estate transaction (in sf) recorded in the Twin Cities.
• The economic and business uncertainty following the mid-March pandemic shutdown paused deal activity, and some asset classes will have a longer runway to pricing discovery and financing.
• Quality credit and term remained in high demand and commanded strong pricing support.
Commercial & Multifamily Sales
Twin Cities’ Investors Challenging Pricing & Sales Assumptions
9.5% 378,050 SF
$5.34B $400M+
THE COMPASS REPORTCopyright © 2020 Cushman & Wakefield. All rights reserved. The information contained within this report is gathered from multiple sources considered to be reliable. The information may contain errors or omissions and is presented without any warranty or representations as to its accuracy. It is our intent to provide the best possible information while leaving the reader the responsibility of further verification before using this report for business and/or financial decisions. The report was created by experts using Twin Cities commercial property data from 2019. The Compass report includes information for multi-tenant office, industrial and retail projects greater than 20,000 SF and multifamily for-rent properties. Not included are owner occupied, government or single-tenant buildings. Not all information and insights we’ve collected can be published in any given issue.
CUSHMAN & WAKEFIELDCushman & Wakefield (NYSE: CWK) is a leading global real estate services firm that delivers exceptional value for real estate occupiers and owners. Cushman & Wakefield is among the largest real estate services firms with approximately 53,000 employees in 400 offices and 60 countries. In 2019, the firm had revenue of $8.8 billion across core services of property, facilities and project management, leasing, capital markets, valuation and other services. To learn more, visit www.cushmanwakefield.com or follow @CushWake on Twitter.
MINNEAPOLIS-ST. PAUL OFFICE
#1 Commercial Real Estate Brokerage Firm - Minneapolis/St Paul Business Journal
More than $4 billion in annual transaction value
80+ Brokers
300+ Properties & 30MSF managed
Employs nearly 500 professionals
3500 American Blvd W Suite 200Minneapolis, MN 55431+1 952 831 1000 | cushmanwakefield.com
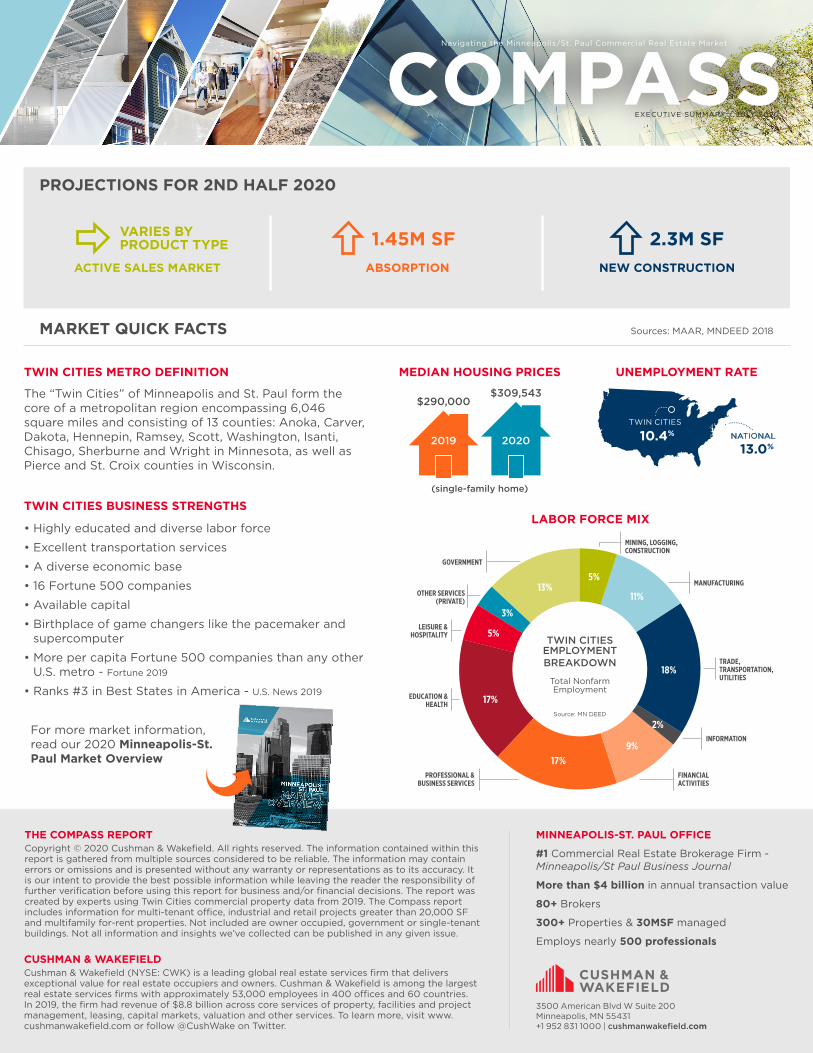
10.4%TWIN CITIES
13.0%
TWIN CITIES BUSINESS STRENGTHS
MEDIAN HOUSING PRICESTWIN CITIES METRO DEFINITION UNEMPLOYMENT RATE
LABOR FORCE MIX
(single-family home)
Sources: MAAR, MNDEED 2018
$309,543
2019 2020
$290,000
• Highly educated and diverse labor force
• Excellent transportation services
• A diverse economic base
• 16 Fortune 500 companies
• Available capital
• Birthplace of game changers like the pacemaker and supercomputer
• More per capita Fortune 500 companies than any other U.S. metro - Fortune 2019
• Ranks #3 in Best States in America - U.S. News 2019
ABSORPTION
VARIES BY PRODUCT TYPE
NEW CONSTRUCTIONACTIVE SALES MARKET
PROJECTIONS FOR 2ND HALF 2020
MARKET QUICK FACTS
The “Twin Cities” of Minneapolis and St. Paul form the core of a metropolitan region encompassing 6,046 square miles and consisting of 13 counties: Anoka, Carver, Dakota, Hennepin, Ramsey, Scott, Washington, Isanti, Chisago, Sherburne and Wright in Minnesota, as well as Pierce and St. Croix counties in Wisconsin.
MINING, LOGGING, CONSTRUCTION
MANUFACTURING
TRADE, TRANSPORTATION, UTILITIES
INFORMATION
FINANCIAL ACTIVITIES
PROFESSIONAL & BUSINESS SERVICES
EDUCATION & HEALTH
LEISURE & HOSPITALITY
OTHER SERVICES (PRIVATE)
GOVERNMENT
17%9%
2%
18%
11%13%
3%
5%
5%
17%
TWIN CITIESEMPLOYMENT BREAKDOWN
Total NonfarmEmployment
Source: MN DEED
4
Navigating the Minneapolis/St. Paul Commercial Real Estate Market
EXECUTIVE SUMMARY / JULY 2020
For more market information, read our 2020 Minneapolis-St. Paul Market Overview
2.3M SF1.45M SF