Market Trends - fmm-magazin.de Income Strategy Despite better economic data and upward adjustments...
8
Market Trends Summary September 2009 Global View During the summer months, financial markets continued to improve markedly as equities rose and credit spreads tight- ened much further. Main driver was the improved outlook for the global economy. Led by China, economic activity in Asia rebounded strongly. Even in the Western Industrialized World, there were coun- tries able to register some growth. We expect the positive tone of the incoming macroeconomic data to remain in place over the coming weeks so that mar- kets can stay underpinned. Longer-term, we continue to see significant risks. Equities The “reflationary” actions continue to be in place and the earnings momentum has bottomed. This cycle could last for some months at least but what is important is that the economic news flow will remain positive for the time being: We expect positive equity returns. Japan could deserve some nice surprise after the elections. We don’t exclude a set-back that’s why our allocation is neu- tral and not overweighting equities. Still valid: Winter-half 2009/2010, reality check: double dip or strong earnings recovery? Bonds/Fixed Income Strategy Despite better economic data and upward adjustments of growth forecasts bond yields fell over the summer months. Credit spreads benefited from the improvement of market sentiment and continued to tighten. In light of the recovery we forecast yields to rise again in the weeks to come. Credits should remain well supported by the higher certainty about the near-term growth outlook and the ongoing search for a yield pickup. Our long duration stance performed very well since June. As we expect a significant increase in yields going forward, we reduce our duration aggressively. The positive sentiment supported our recommendations. All trades increased their gains or reduced the cumulated loss- es. As we see a further normalization of market conditions, ■ ■ ■ ■ ■ ■ ■ ■ ■ ■ ■ going forward, we keep our views and adjust targets accord- ingly. Currencies We expect the greenback to weaken further against the euro, mainly because of ongoing falling risk aversion. The yen meandered strongly around a slight appreciation trend but is expected to lose again against the US-dollar. ■ ■
Transcript of Market Trends - fmm-magazin.de Income Strategy Despite better economic data and upward adjustments...

Market Trends
Summary
September 2009
Global View During the summer months, financial markets continued to improve markedly as equities rose and credit spreads tight-ened much further.Main driver was the improved outlook for the global economy. Led by China, economic activity in Asia rebounded strongly. Even in the Western Industrialized World, there were coun-tries able to register some growth.We expect the positive tone of the incoming macroeconomic data to remain in place over the coming weeks so that mar-kets can stay underpinned. Longer-term, we continue to see significant risks.
Equities The “reflationary” actions continue to be in place and the earnings momentum has bottomed. This cycle could last for some months at least but what is important is that the economic news flow will remain positive for the time being: We expect positive equity returns. Japan could deserve some nice surprise after the elections.We don’t exclude a set-back that’s why our allocation is neu-tral and not overweighting equities. Still valid: Winter-half 2009/2010, reality check: double dip or strong earnings recovery?
Bonds/Fixed Income Strategy Despite better economic data and upward adjustments of growth forecasts bond yields fell over the summer months. Credit spreads benefited from the improvement of market sentiment and continued to tighten.In light of the recovery we forecast yields to rise again in the weeks to come. Credits should remain well supported by the higher certainty about the near-term growth outlook and the ongoing search for a yield pickup.Our long duration stance performed very well since June. As we expect a significant increase in yields going forward, we reduce our duration aggressively.The positive sentiment supported our recommendations. All trades increased their gains or reduced the cumulated loss-es. As we see a further normalization of market conditions,
■
■
■
■
■
■
■
■
■
■
■
going forward, we keep our views and adjust targets accord-ingly.
Currencies We expect the greenback to weaken further against the euro, mainly because of ongoing falling risk aversion. The yen meandered strongly around a slight appreciation trend but is expected to lose again against the US-dollar.
■
■

� | September 2009
Table 1
Growth Inflation
�008e �009f �010f �008e �009f �010f
USA 0.5 -2.8 1.5 3.8 -0.5 1.5
Euro Area 0.6 -3.8 0.8 3.3 0.3 1.3
Japan -0.7 -5.3 0.9 1.4 -1.1 -0.7
UK 0.8 -4.1 1.3 3.6 2.1 2.8
World 2.7 -1.4 2.7 4.0 0.6 1.7
Global ViewDuring the summer months, financial markets improved quite markedly. Apart from a fairly brief spell in late June/early July, risky assets rose unabatedly. Since the time of our last writing, US stocks were able to register an impressive gain of 17%. In the euro area, equities rose even by 21%. Likewise, credit spreads tightened much further. In the euro area, the non-finan-cial corporate spread continued its unprecedented rally as it fell to less than 150 bps. This is just 50 bps above the historic norm. In October last year, the spread had reached a high of 354 bps.
Main driver of this continued strong rally in risky assets is the improved perception about the global economy. Many indicators have in recent weeks not only confirmed that the recession is winding down, some regions and indicators rose to an extent that hopes for a strong, v-shaped recovery emerged. Most notable is the improvement in Asia, where several economies advanced at an annualized rate of more than 10% in Q2. Likewise, key lead-ing indicators showed a turn to the better in the developed world. In the US, house prices rose for the first time since May 2006 and in the euro area, France and Germany were able to grow at an annualized rate of just over 1% in Q2. For the coming weeks, we expect the economic rebound to con-tinue as the forces which have brought it about will continue to be at work. Above all, fiscal stimulus packages are still pushing demand in many regions, above all in China, but also in the US (“cash for clunkers”) and in Japan (strong impulse in Q3 and Q4 this year). In addition, there is now a turn in the inventory cycle.
In many regions, production was low-ered so drastically, that even the strongly reduced demand levels had to be filled with products from the shelf. For GDP growth to benefit from the turn in the inventory cycle, it is not
necessary for companies to restock. Just a slower pace of inven-tory liquidation would boost growth quite significantly already. Finally, international trade is picking up again. In part, this is driv-en by higher growth and, hence, import demand in Asia (even though imports have not kept pace with the rapid increase in GDP growth which could be a first sign that Asia is trying to engi-neer a shift towards a more domestically driven economies). What is also stimulating international trade is the unlocking of a
I Improved growth prospects to underpin financial markets near-termI Improved growth prospects to underpin financial markets near-term
Table 2
Bonds current 1M 1�M
10Y Treasuries (USA) 3.46 3.60 3.70
10Y Bunds (Germany) 3.26 3.40 3.50
10Y JGBs (Japan) 1.32 1.40 1.50
Corporate Bonds current 1M 1�M
IBOXX Corporates 148 145 120
Non Fin
Forex current 1M 1�M
USD/EUR 1.43 1.45 1.48
JPY/USD 94 96 107
GBP/EUR 0.88 0.88 0.82
Equities current 1M 1�M
S&P 500 1028 880 970
MSCI EMU 85 86 80
Current values = Average of the last five trading days
freeze in trade finance which had built up in the aftermath of the Lehman Brothers failure. With growth accelerating again, confi-dence among businesses and households is rising so that – in the short-run – the upturn could increasingly look like the typical, strong rebound after a deep recession.
“V” unlikelyWe doubt that this is the case. The turn of the global economy is certainly very good news. Just six months ago, quite some mar-ket participants (excluding ourselves) thought that a rerun of the Great Depression was a distinct possibility. Yet, the latest global slump was not a normal, garden-variety recession. It was a full-blown financial crisis which did not turn into a systemic crisis just as the result of the unprecedented policy responses. History has shown that financial crises lead to economic downturns which are deeper and longer than normal. We expect this time to be no different. Massive de-leveraging still to be done in former bubble economies and the need to fully
repair a damaged financial system make a weak recovery still our base case. With public policy slowly with-drawing the stimulus, we expect a “reality check” for markets at some point in the first half of 2010 at the
latest. This believe is reflected in our financial market forecasts. We see equities rising near-term but predict lower levels on a 12-month view. Long-term yields, which have so far barely risen, are expected to remain extremely low over the forecast horizon.
EquitiesSome performance back-up:Since June equities were strongly up, by 12% US, 15% Europe and only 4% Japan (ytd performance is more aligned). Emerging markets were not relatively stronger also because the real sur-prise came from the west side of the world in terms of the eco-nomic cycle bottoming out. In the first days of July there was a
I “Reality check” likely in the first half of �010 at the latestI “Reality check” likely in the first half of �010 at the latest

September 2009 | �
one. In the very short term the disposable income could stabilize as wages are being positively influenced by new auto hiring, increased working hours and by base effects concerning trans-fers in yoy terms. But for the reminder of the year the direction seems clear on the downside.
Earnings momentumFor the time being as the charts in the previous page shows only US experienced a positive EPS revision index so far, surpassing the zero line, meaning that EPS stopped falling less and they are actually increasing. We think that in Europe the same phenom-enon will happen but with the usual delay as has been true since 30 years. One caveat could be that at the moment unit labor costs are sensibly lower in the US than in Europe but we sus-pect that big European companies could have been more ag-gressive in slashing costs than data which refer to the overall economy show. That said, we will try to measure more in detail the cost base of big European companies going forward.
Risks Our colleagues from Thalia built an indicator (“Bassi Periscope”) which shows net equity exposure of best hedge funds we have in our portfolios. Usually they anticipate quite well market moves. The short-term trend seems still encouraging as equity exposure is stabilizing on higher percentages. That said, the Fed model adjusted, short term models and sentiment indicators are stretched.
Equities - EuropeIn an environment of better than expected earnings announce-ments for the second quarter and further signs of an ongoing economic recovery European equity markets finished consolidat-ing at the beginning of Q3 and afterwards continued their upward move which had started at the beginning of March. After a brief period of underperformance, the MSCI EMU outpaced US and Japanese markets quite distinctively, reaching new highs for the current year. For all of 2009, the market has more than compen-sated for the steep fall of the first quarter. It is now 16.6% higher compared to the level at the beginning of the year.
Foreign demand is picking up steam…Above all, better-than-expected economic data led to a further lowering of risk awareness due to rising hopes for a stronger
Earnings FY1 EuroStoxx and S&P 500
16
18
20
22
24
26
28
30
32
34
Oct-05 Apr-06 Oct-06 Apr-07 Oct-07 Apr-08 Oct-08 Apr-0955
60
65
70
75
80
85
90
95
100
EuroStoxx (lhs) S&P 500
Earnings FY1 EuroStoxx and S&P 500
16
18
20
22
24
26
28
30
32
34
Oct-05 Apr-06 Oct-06 Apr-07 Oct-07 Apr-08 Oct-08 Apr-0955
60
65
70
75
80
85
90
95
100
EuroStoxx (lhs) S&P 500
retrenchment by 5% but then the market was quick to recover. In the meantime the economic news flow improved and the rally continued.
From leading indicators to real economyAlthough more subdued than in the past, the real economy is nevertheless improving and we are still at the early stage of a new cycle. For the time being the recovery is concentrated on the supply side but also consumers will benefit a little bit going forward.
What is important on this topic is that given the reduced base of fixed costs (in US especially) firms will be able to benefit even from small increases in revenues. Also the fiscal package stimu-lus has still to show its full contribution to growth while monetary
policy remains accommodative over-all. The QE has not be extended in the US but in general the monetary environment is still favorable to risky assets. It seems increasingly clear
that the Fed does not want to repeat the bad ’37 experience, when Roosevelt increased taxes and lowered public expenses too early and the economy went in blues till the 2nd WW. Obama has to fight with Republicans in order to maintain a relaxed fiscal policy but the Fed orientation seems clear. Also banks seem to have cut their deposit facilities at the central banks as they should earn less going forward and this move seems also con-tributing to maintain low government yield as banks buy govies in substitution. This trend could last for a while maintaining 10-year rates quite low in the very short term (but with increasing risks on the upside). Finally, there is a chance to expect a second stimu-lus package in favor of US consumers by the end of the year. Disposable income is indeed decreasing yoy and this is coherent with the fact that the supply side is particularly enjoying in this phase while consumers continue to suffer. Going forward the stress should increase as the disposable income is going into negative territory.
By the end of the year as transfers and lower taxes will have diminished sensibly their positive contribution, consumers will be left with a weak labor market, low wages, only stabilizing housing markets, eventually higher mortgage rates and still high debt. At that point the ’37 specter could provoke a second package ap-proval even if we think the amount should be lower than the last
I More positive hard data are fuelling equity markets I More positive hard data are fuelling equity markets
Stock Performanceschange since 06/30/2009
16,5%
14,7%
14,9%
11,9%
15,5%
4,3%
10,6%
0,0% 2,0% 4,0% 6,0% 8,0% 10,0% 12,0% 14,0% 16,0% 18,0% 20,0%
TOKYOSE
NASCOMP
S&PCOMP
SWISSMI
FTSE100
MS EMU
DAXINDX
Stock Performanceschange since 06/30/2009
16,5%
14,7%
14,9%
11,9%
15,5%
4,3%
10,6%
0,0% 2,0% 4,0% 6,0% 8,0% 10,0% 12,0% 14,0% 16,0% 18,0% 20,0%
TOKYOSE
NASCOMP
S&PCOMP
SWISSMI
FTSE100
MS EMU
DAXINDX

� | September 2009
than expected economic recovery next year. With 49.5 and 47.9 respectively the services and manufacturing PMI for the euro area in August already reached the pre-Lehman levels seen last year. The ifo business climate rose for the fifth month in a row, although again mainly driven by a rise of the expectations com-ponent. It has also to be taken into account that production within the manufacturing sector is just bottoming and the second quar-ter is on average still more than 18% lower compared to the pre-vious year.
… but margin pressure is fading slowlyThe main difference to the US remains the comparably unfavora-ble development of unit labor costs (ULC). While in the US, the sharply reduced employment led to significant cost-cutting ef-fects (Q2 ULC -0.7% yoy), the European companies are lagging
this trend by far (Q2 ULC +4.8% yoy). As a result, the negative consensus trend of expected earnings for the DJ EuroStoxx also shows some signs of bottoming, but – in sharp contrast to the US – remained down so far. Abso-
lute valuation figures for European equity markets are less com-fortable than two months ago, but remain attractive in compari-son to low yielding bond and money markets. With more positive news from the economy and companies ahead, we see some room for further improvement during the weeks ahead but expect the current outperformance of the MSCI EMU against the S&P 500 to run out of steam.
Equities - European sectorsSince the last MP at the end of June diversified financials outper-formed together with insurance (were a buy) while non- food retail underperformed (sell). All in all those bets compensated the underperfomance of media and pharma (which were rated buy). Materials were flat. The EPS revisions are still negative in Eu-rope but as the table shows, banks, chemicals, food, pharma and tech have already positive upgrades and on top of that US revisions are already in positive territory.
Sector scoring systemWe analyzed sectors from three major points of view. First of all the sector relationship with macro leading indicators (IFO and ISM), second the earnings momentum (relative EPS strength
I European earn-ings lagging due to rising unit labor costsI European earn-ings lagging due to rising unit labor costs
Overview EuroStoxx Sectorsas of August 25th, 2009
PER-4w -4w -4w FY1
Autos -1.1 -7.2 -7.7 0.0Banks 17.5 4.5 1.3 17.2Basics 7.4 -104.0 -5.6 0.0Chemicals 10.3 1.0 1.4 17.5Constr. 16.1 -4.6 -2.6 15.1Fin. Serv. 4.3 -17.7 -6.1 15.5Food/Bev. 3.9 1.2 0.8 14.8Health Care 1.8 1.7 2.2 10.3Industrials 12.3 -2.8 -1.1 15.5Insurance 13.5 -5.6 -7.3 11.3Media 6.9 -0.2 -1.3 10.5Oil / Gas 2.4 -5.5 -2.7 11.9Cons. Goods 10.1 -1.9 -0.9 21.9Retail 3.1 -1.1 0.1 14.5Technology 5.8 5.4 -0.1 30.5Telecom 5.8 -0.1 -0.1 11.2Travel/Leisure 11.3 -37.3 -15.5 44.2Utilities 11.2 -0.4 -0.8 11.6
EuroStoxx 9.6 -2.0 -1.6 15.4Source: Thomson Reuters Datastream
Price Earn. FY1 Earn. FY2
and relative EPS revision index) and finally “long-term” valuation (PE and PB relative gap versus history) and additionally the de-gree of earnings decline from 2007 peak and gap between earn-ings estimates in 2011 and the same 2007 peak (the larger the gap the lesser the hypothetical additional EPS downgrade). The new this month is that we also calculated the score giving much more weight to the earnings momentum as profits seem having bottomed out and from now on the speed of revisions could drive more than before the price performance. We added also the rela-tionship with corporate spread as tighter credit risk continues to be a relevant factor behind equity performance.
Conclusions Among the buys we confirm Financials (including real estate, British Land being good on earnings relative), Media (WPP Viv
endi and Pearson being three candi-dates judging by relative EPS strength). Second tier buys include tlc, tech and chemicals (the latter purely on EPS momentum and credit
spread relationship). Sells are food, retail and auto. Second tier sells are capital goods. Banks are neutral on the usual scoring system but they are rated +2 on EPS momentum, they have also a chance to outperform the market till the ISM is growing (our expectation for the next 2 months) and as the corporate spread remains tight.
Bonds/Fixed Income StrategyLong-term yields on both sides of the Atlantic have remained in their trading range since the end of June. However, the general direction for yields was moderately downwards and yields have
now approached the lower bound of their trading range. In the US the 10-year government bond yield fell to 3.46% (from 3.61%) and in the euro area the yield dropped to 3.26% (from
3.42%). The decline is surprising, given the fact that over the summer months economic data surprised, all in all, on the upside and confirmed the view that the world economy will regain some strength in the second half of the year.
I Financials and Media remain a good betI Financials and Media remain a good bet
I Long-term yields at the lower bound of trading rangesI Long-term yields at the lower bound of trading ranges
Euro Area Bond Market Volatility
5%
10%
15%
20%
25%
30%
35%
40%
Mar-05 Sep-05 Mar-06 Sep-06 Mar-07 Sep-07 Mar-08 Sep-08 Mar-09 Sep-095%
10%
15%
20%
25%
30%
35%
40%
Realized volatility 10-year yields Implied volatility 1-year fwd. 10-year swaption
Euro Area Bond Market Volatility
5%
10%
15%
20%
25%
30%
35%
40%
Mar-05 Sep-05 Mar-06 Sep-06 Mar-07 Sep-07 Mar-08 Sep-08 Mar-09 Sep-095%
10%
15%
20%
25%
30%
35%
40%
Realized volatility 10-year yields Implied volatility 1-year fwd. 10-year swaption
September 2009 | �
Real yield level appears too lowDecomposing the development of nominal long-term yields into inflation expectations and a real yield component (including a risk premium) shows that in the euro area the lower nominal yield can be ascribed completely to a lower real yield whereas inflation expectations have remained unchanged. In the US, both the real yield and inflation expectations dropped moderately.
The lower real yield does not look sustainable as the near-term eco-nomic outlook has brightened and forthcoming data should underpin the view that the world economy is back
on track. A real long-term yield of 1% does not seem appropriate in this environment. In contrast, inflation expectations which are currently close to the historical average appear fair given the fact that headline inflation rates will soon rise in positive territory again and that there is a high degree of uncertainty about the longer-term outlook. One reason for central banks to address exit strategies - although a first hike is still far away - is to assure markets that they are aware of the inflation potential of their li-quidity measures and to keep inflation expectations subdued. In light of further upward adjustments of growth forecasts and economic releases which raise hopes of a V-shaped recovery the real (and nominal) yield is forecast to go up considerably in the weeks to come. This does not mean that this trend will con-tinue in the coming months as the uncertainty about the period when the stimuli will have petered out remains high and resource utilization rates are expected to stay on low levels for the time being. Consequently, as core inflation rates remain subdued the low yield environment should prevail for the time being.
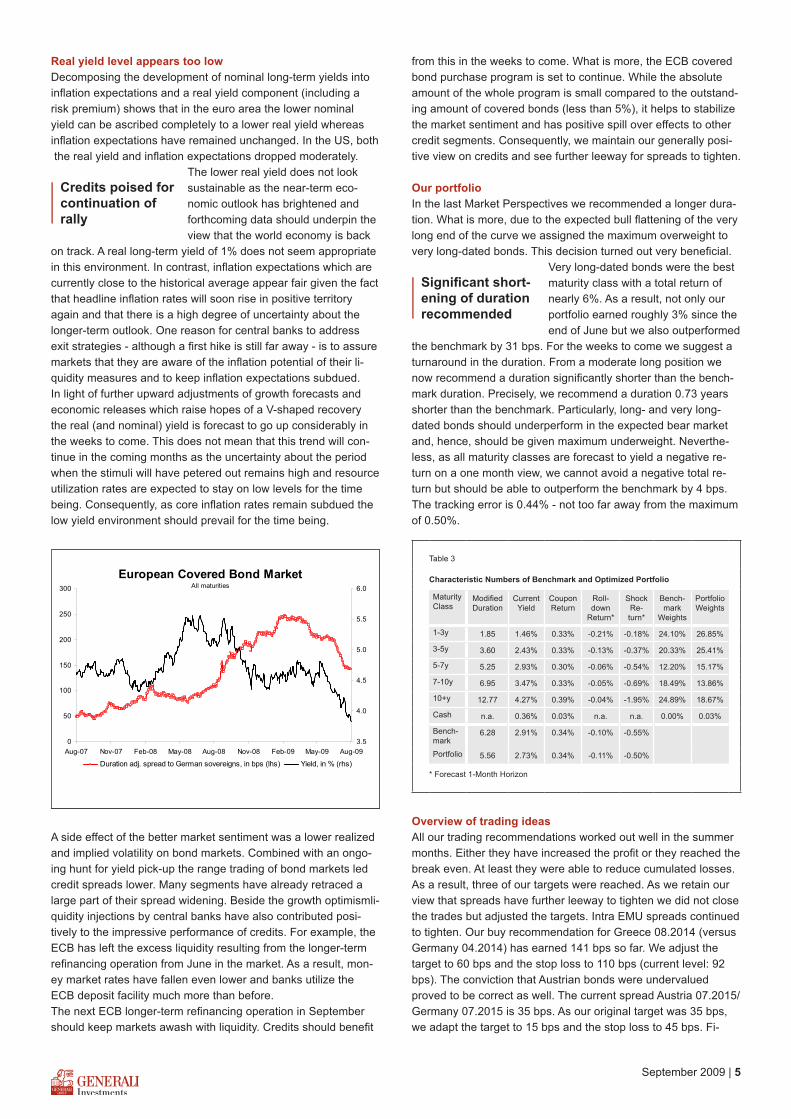
A side effect of the better market sentiment was a lower realized and implied volatility on bond markets. Combined with an ongo-ing hunt for yield pick-up the range trading of bond markets led credit spreads lower. Many segments have already retraced a large part of their spread widening. Beside the growth optimismli-quidity injections by central banks have also contributed posi-tively to the impressive performance of credits. For example, the ECB has left the excess liquidity resulting from the longer-term refinancing operation from June in the market. As a result, mon-ey market rates have fallen even lower and banks utilize the ECB deposit facility much more than before. The next ECB longer-term refinancing operation in September should keep markets awash with liquidity. Credits should benefit
I Credits poised for continuation of rallyI Credits poised for continuation of rally
European Covered Bond MarketAll maturities
0
50
100
150
200
250
300
Aug-07 Nov-07 Feb-08 May-08 Aug-08 Nov-08 Feb-09 May-09 Aug-093.5
4.0
4.5
5.0
5.5
6.0
Duration adj. spread to German sovereigns, in bps (lhs) Yield, in % (rhs)
European Covered Bond MarketAll maturities
0
50
100
150
200
250
300
Aug-07 Nov-07 Feb-08 May-08 Aug-08 Nov-08 Feb-09 May-09 Aug-093.5
4.0
4.5
5.0
5.5
6.0
Duration adj. spread to German sovereigns, in bps (lhs) Yield, in % (rhs)
from this in the weeks to come. What is more, the ECB covered bond purchase program is set to continue. While the absolute amount of the whole program is small compared to the outstand-ing amount of covered bonds (less than 5%), it helps to stabilize the market sentiment and has positive spill over effects to other credit segments. Consequently, we maintain our generally posi-tive view on credits and see further leeway for spreads to tighten.
Our portfolioIn the last Market Perspectives we recommended a longer dura-tion. What is more, due to the expected bull flattening of the very long end of the curve we assigned the maximum overweight to very long-dated bonds. This decision turned out very beneficial.
Very long-dated bonds were the best maturity class with a total return of nearly 6%. As a result, not only our portfolio earned roughly 3% since the end of June but we also outperformed
the benchmark by 31 bps. For the weeks to come we suggest a turnaround in the duration. From a moderate long position we now recommend a duration significantly shorter than the bench-mark duration. Precisely, we recommend a duration 0.73 years shorter than the benchmark. Particularly, long- and very long-dated bonds should underperform in the expected bear market and, hence, should be given maximum underweight. Neverthe-less, as all maturity classes are forecast to yield a negative re-turn on a one month view, we cannot avoid a negative total re-turn but should be able to outperform the benchmark by 4 bps. The tracking error is 0.44% - not too far away from the maximum of 0.50%.
Table 3
Characteristic Numbers of Benchmark and Optimized Portfolio
Maturity Class
Modified Duration
Current Yield
Coupon Return
Roll-down
Return*
Shock Re-turn*
Bench-mark
Weights
Portfolio Weights
1-3y 1.85 1.46% 0.33% -0.21% -0.18% 24.10% 26.85%
3-5y 3.60 2.43% 0.33% -0.13% -0.37% 20.33% 25.41%
5-7y 5.25 2.93% 0.30% -0.06% -0.54% 12.20% 15.17%
7-10y 6.95 3.47% 0.33% -0.05% -0.69% 18.49% 13.86%
10+y 12.77 4.27% 0.39% -0.04% -1.95% 24.89% 18.67%
Cash n.a. 0.36% 0.03% n.a. n.a. 0.00% 0.03%
Bench-mark
6.28 2.91% 0.34% -0.10% -0.55%
Portfolio 5.56 2.73% 0.34% -0.11% -0.50%
* Forecast 1-Month Horizon
Overview of trading ideasAll our trading recommendations worked out well in the summer months. Either they have increased the profit or they reached the break even. At least they were able to reduce cumulated losses. As a result, three of our targets were reached. As we retain our view that spreads have further leeway to tighten we did not close the trades but adjusted the targets. Intra EMU spreads continued to tighten. Our buy recommendation for Greece 08.2014 (versus Germany 04.2014) has earned 141 bps so far. We adjust the target to 60 bps and the stop loss to 110 bps (current level: 92 bps). The conviction that Austrian bonds were undervalued proved to be correct as well. The current spread Austria 07.2015/Germany 07.2015 is 35 bps. As our original target was 35 bps, we adapt the target to 15 bps and the stop loss to 45 bps. Fi-
I Significant short-ening of duration recommendedI Significant short-ening of duration recommended

� | September 2009
nally, our buy recommendation for medium-term German cov-ered bonds versus German sovereigns has reached its initial target (50 bps) as well. On the back of the ECB covered bond purchase program we see room for even tighter spreads. Ac-cordingly, we adjust the target level to 30 bps and to secure gains we revise the stop loss to 60 bps. Finally, we open a new trade. Short-dated euro area swap spreads have retraced part of their tightening since the end of May (from 31 bps to 52 bps). We regard this as fundamentally not justified. The high amount of liquidity in the market, bond issuance activity by governments, a forecast further drop in volatility and an increase in swapping activity after the summer break should lead swap spreads lower again. Therefore, we open a 2-year euro area swap tighter with a target of 35 bps and a stop loss at 65 bps.
Table 4
Current Trading Recommendations
Intiation Date
Start Level
Target Stop Loss
Current Level
Gain/Loss
Buy BTPi 09/2017 26.02.2009 94 bps 190 bps 120 bps 174 bps 80 bps
Buy Greece 08.2014/Sell Germany 04.2014
09.04.2009 234 bps 60 bps 110 bps 92 bps 142 bps
Buy 3-mth Euro$ Dec 2010
19.05.2009 98.07 99 97.5 97.84 -23 bps
iBoxx 5-7yr: Buy Pfandbriefe/Sell Germ. Sov.
19.05.2009 83 bps 30 bps 60 bps 47 bsp 36 bps
Buy Austria 07.2015/Sell Germany 07.2015
26.05.2009 56 bps 15 bps 45 bps 35 bps 21 bps
Buy EUR 10-yr/30-yr flattener
25.06.2009 85 bps 65 bps 95 bps 73 bps 12 bps
Buy EA 10-yr swap spread
25.06.2009 28 bps 10 bps 40 bps 20 bps 8 bps
Buy EA 2-yr swap spread
28.08.2009 52 bps 32 bsp 65 bsp 52 bsp 0 bsp
CurrenciesOver the foregone two months the greenback lost against the euro, in contrast to our expectation. The major driver behind this development was rising equity markets in the aftermath of sur. prisingly good earnings and macro data. As a result, risk aver
USD/EUR and Volatility25
27
29
31
33
35
3726/05/2009 09/06/2009 23/06/2009 07/07/2009 21/07/2009 04/08/2009 18/08/2009
1.35
1.36
1.37
1.38
1.39
1.40
1.41
1.42
1.43
1.44
1.45
VSTOXX (lhs) USD/EUR (rhs)
corr -0.64
USD/EUR and Volatility25
27
29
31
33
35
3726/05/2009 09/06/2009 23/06/2009 07/07/2009 21/07/2009 04/08/2009 18/08/2009
1.35
1.36
1.37
1.38
1.39
1.40
1.41
1.42
1.43
1.44
1.45
VSTOXX (lhs) USD/EUR (rhs)
corr -0.64
sion and the demand for safe haven investments receded there-by weakening the US dollar (see top graph)Investors probably tended to open US based carry trades in higher-yielding assets abroad. Moreover, surprisingly strong global macro data fostered the expectation that the recession will soon be over. This indeed turned out to be correct so that the fundamentals should now come more into the market focus again. Here, the euro area’s generally more moderate fiscal position, the lack of true quantita-tive easing and the short-term interest spread all favour a strong
er euro. For the coming month ongo-ing equity market gains together with the mentioned fundamental factors should weaken the US dollar towards 1.45 USD/EUR.
Yen to re-depreciate Since the beginning of March the yen meandered strongly around a weak appreciation trend. In general, a rise in risk aver-sion had consistently led to an appreciation of the yen and vice versa. Consequently, the temporary bout of international rising risk aversion setting in in mid August showed the expected re-sults. However, this period was short-lived, so one would have-expected a re-depreciation towards the end of the month but the yen failed to change directions. Instead, it moved in line with falling long-term yields on Japanese government bonds which in turn paralleled the development in the US long-term Treasury market. The decline in long-term yields was by itself also surpris-ing, given the stock market recovery and the more and more confirmed view, that the international recovery will gain traction in the second half of 2009. The reason is likely to be a season-ally low international bond supply exacerbated by Asian specific factors. Despite more and more optimistic views on the inter-national scale, the East Asian situation is being reconsidered, as there are signs that China is about to fine tune its economic sup-port and the first push in export recovery seems to be over. How-ever, we expect international yields to rise again. Moreover, dis-cussions about US monetary exit strategies will gain prominence and additionally favor a re-depre-ciation of the yen to levels about 96 JPY/USD.
Authors:
Global View: Klaus Wiener , Ph.D.Phone: +49 221/4203-5340E-mail: [email protected]
Equities/ Eq. Europe/ European sector:
dott. Michele Morganti Dietmar Wiggermann
Phone: + 39 040/671-599 + 49 221/4203-5349
E-mail: [email protected]@geninvest.de
Bonds/ Fixed Income Strategy:
Dr. Florian Späte, CIIA
Phone: +49 221/4203-5367E-mail: [email protected]
Currencies: Dr. Christoph Siepmann Dr. Martin Wolburg, CIIA
Phone: +49 221/4203-5342/-5346E-mail: [email protected]
I US dollar to weaken against euro due to rising risk appetite I US dollar to weaken against euro due to rising risk appetite

September 2009 | �
Table 5
Development of Bonds, Exchange Rates and Commodities
actual 1 M. � M. 1� M. YE* �008
Last update: 31.08.2009
Money Market Rates
US 3 M Libor 0.35 0.48 0.66 2.81 1.43
EUR Eonia 0.34 0.36 0.83 4.36 2.35
EUR 1M Libor 0.43 0.49 0.92 4.50 2.59
EUR 3M Libor 0.80 1.86 1.27 4.96 2.89
JPN 3M Libor 0.39 0.41 0.52 0.88 0.83
UK 3M Libor 0.69 1.89 1.28 5.75 2.77
SWI 3M Libor 0.32 0.36 0.40 2.75 0.66
Bonds
2Y Treasuries 0.98 0.13 0.92 2.36 0.76
5Y Treasuries 2.39 2.53 1.35 3.07 1.55
10Y Treasuries 3.40 3.50 3.47 3.81 2.25
2Y Bunds 1.25 1.27 1.32 4.11 1.74
5Y Bunds 2.37 2.40 2.64 4.09 2.32
10Y Bunds 3.25 3.30 3.55 4.17 2.94
2Y JGBs 0.23 0.28 0.34 0.72 0.37
5Y JGBs 0.61 0.70 0.81 1.97 0.68
10Y JGBs 1.31 1.41 1.48 1.41 1.17
2Y Gilts 1.84 1.21 1.06 4.49 1.08
5Y Gilts 3.60 3.09 2,82 4.46 2.51
10Y Gilts 3.56 3.80 3.75 4.47 3.09
2Y Bonds SWI 0.39 0.33 0.46 1.58 0.45
5Y Bonds SWI 1.16 1.11 1.37 2.56 1.37
10Y Bonds SWI 2.02 2.00 1.41 2.88 2.06
10-Year Swap Spreads
USA 23 24 21 68 38
EUR 20 20 12 50 79
Euro Corporate Spreads
JPM Credit Industrials 140 152 204 164 342
Emerging MarketBond Spreads
EMBI Latin America 428 433 514 344 746
EMBI Asia 300 304 551 295 596
Euro EMBI Europe 226 260 281 103 348
Forex
USD/EUR 1.43 1.43 1.42 1.47 1.40
JPY/USD 93 95 95 109 91
GBP/EUR 0,88 0.86 0.88 0.81 0.97
CHF/EUR 1.52 1.53 1.51 1.62 1.48
Commodities
Gold $/Oz 948 934 960 835 862
Crude Oil Brent $/Barrel 69 70 65 113 37
Source: Thomson Reuters Datastream, Bloomberg, own calculations * YE = Year end
Table 6
Development of Equity Markets
Equities actual 1 M. � M. 1� M. YTD*
Last update: 31.08.2009
World
MCSI World 777 3.5% 10.8% -19.4% 14.6%
USA
S&P 500 1021 3.4% 11.0% -20.4% 13.0%
Dow Jones 9496 3.5% 11.7% -17.7% 8.2%
Nasdaq 2009 1.5% 13.2% -15.1% 27.4%
Europe
DJ Euro Stoxx TMI Large 229 5.3% 13.2% -19.6% 13.3%
DJ Euro Stoxx 50 2775 5.2% 13.2% -17.5% 13.4%
MCSI EMU 150 5.5% 13.0% -19.8% 15.4%
DJ Stoxx 600 236 4.9% 13.3% -18.1% 19.0%
DJ Stoxx 50 2402 4.8% 13.0% -17.6% 15.2%
MCSI Europe 1046 5.6% 12.8% -16.6% 14.8%
CAC40 3654 6.6% 11.5% -18.5% 13.5%
DAX30 5465 2.5% 10.6% -14.9% 13.6%
MIB30 22420 9.0% 12.8% -22.1% 15.2%
FTSE100 4909 6.5% 11.1% -12.9% 10.7%
SMI 6217 4.5% 16.2% -14.1% 12.3%
Japan
Topix 966 1.6% 7.6% -23.0% 12.4%
Asia ex Japan
MCSI AC Asia ex Jp 508 -2.9% 8.4% -0.5% 45.2%
Source: Thomson Reuters Datastream, Bloomberg, own calculations * YTD = Year to date

8 | September 2009
Table 5
Development of Equity Sectors
European MSCI Sectors actual 1 M. � M. 1� M. YTD*
Last update: 31.08.2009
Basic Materials 183 2.9% 10.8% -27.3% 34.4%
Energy 150 5.1% 0.8% -13.7% 4.9%
Oil & Gas 150 5.2% 0.2% -12.6% 2.6%
Industrials 119 5.6% 14.0% -30.0% 18.0%
Consumer Discretionary 70 0.4% 10.7% -12.1% 15.6%
Automobiles 71 -10.6% 5.5% -20.4% 9.7%
Media 55 6.1% 7.8% -14.4% 2.2%
Retail 92 -3.2% 17.4% 20.9% 40.6%
Consumer Staples 123 1,9% 11.4% -3.6% 8.5%
Food & Drug Retailing 76 1.2% 2.2% -4.5% 7.0%
Food Products 114 1.2% 13.6% -6.6% 6.0%
Household Products 249 1.1% 11.2% 2,5% 13.9%
Health Care 87 0,9% 12.1% -10.2% 0.8%
Pharmaceuticals 84 0,8% 12.2% -9.6% -0.2%
Telekommunications 64 3.4% 14.3% -7.2% -0.5%
Utilities 123 7.9% 6.9% -22.2% -1.8%
Financials 66 12.1% 23.6% -21.5% 34.5%
Bank 79.7 13.4% 28.8% -20.4% 46.1%
Diversified Financials 53 8.1% 14.4% -42.0% 31.3%
Insurance 41.7 9.9% 17.6% -20.5% 5.9%
Information Technology 44 4.2% 3.9% -27,0% 12.3%
IT-Services 13.8 3.5% 21.1% -18,0% 28.1%
Software 79.2 4.5% 9.6% -11.4% 30.1%
Communication Equipment 44.4 3.7% -5.0% -34.6% -0.5%
Computer and Peripherals 32.8 8.4% 30.2% -33.8% 19.2%
Semiconductor Equipment 65.0 6.8% 25.8% -25.8% 36.6%
Source: Thomson Reuters Datastream, Bloomberg, own calculations * YTD = Year to date
ImprintHead of Research:Klaus Wiener, Ph.D. (Phone+49 221/4203-5340)
Team:dott. Fabrizio Barbini (Phone: +39 040 / 671-386)dott. Marco Giovannini (Phone: +39 040 / 671-549)Dr. Thomas Hempell (Phone: +49 221/4203-5341)Thomas Jacob (Phone: +49 221/4203-5318)dott. Michele Morganti (Phone: +39 040 / 671-599)Vladimir Oleinikov, CFA (Phone: +49 221/4203-5317)Frank Ruppel (Phone: +49 221/4203-5347)
Dr. Thorsten Runde (Phone: +49 221/4203-5364)Dr. Christoph Siepmann (Phone: +49 221/4203-5342)Dr. Florian Späte, CIIA (Phone: +49 221/4203-5367)Dietmar Wiggermann (Phone: +49 221/4203-5349)Dr. Martin Wolburg, CIIA (Phone: +49 221/4203-5346)
E-mails Germany: [email protected] Italy: [email protected]
Edited by: Elisabeth Weinberg (Phone: +49 221/4203-5354) Issued by:Generali Investments Research DepartmentCologne, Germany · Trieste, ItalyUnter Sachsenhausen 27, D-50667 CologneVersion completed on: August 31th, 2009Sources for charts and tables: Thomson Reuters Datastream, Bloomberg, own calculations.
Generali Investments, Cologne/Trieste 2009 · Generali Investments Research has done careful research and verified the information contained in this publication.The information and opinion contained in this document are considered as reliable by Generali Investments but no representation or warranty, express or implied, is made that such information is accurate or complete. Opinions constitute only the judgement of Generali Investments and may be subject to any change without notification. They are not to be taken for providing the evalua-tion of any strategy or any investment in financial instruments. This document does not constitute an offer or solicitation to buy or to sell financial instruments. Any reproduction, total or partial, of this document is prohibited without prior consent.
Generali Investments Deutschland Kapitalanlagegesellschaft mbH
Unter Sachsenhausen 27 D-50667 Cologne, Germany Phone: +49 221/4203-5555 E-mail: [email protected]
Generali InvestmentsItaly S.p.A. SGR
Via Ugo Bassi, 6 20159 Milano- IT Phone.: +39 02 6076 5839 E-mail: [email protected]
Generali Investments France
7 Boulevard Haussmann F-75309 Paris Cedex 09 Phone: +33 1 58 38 18 74 E-mail: [email protected]
Generali InvestmentsLuxembourg S.A.
5, Allée Scheffer,L-2520 Luxembourg Phone: +352 26 92 30 47 22 E-mail: [email protected]