Market-to-Revenue Multiples in Public and Private Capital ...
59
University of Pennsylvania University of Pennsylvania ScholarlyCommons ScholarlyCommons Accounting Papers Wharton Faculty Research 4-2011 Market-to-Revenue Multiples in Public and Private Capital Markets Market-to-Revenue Multiples in Public and Private Capital Markets Christopher S. Armstrong University of Pennsylvania Antonio Davila George Foster John R. M. Hand Follow this and additional works at: https://repository.upenn.edu/accounting_papers Part of the Accounting Commons, Business Administration, Management, and Operations Commons, and the Finance and Financial Management Commons Recommended Citation Recommended Citation Armstrong, C. S., Davila, A., Foster, G., & Hand, J. M. (2011). Market-to-Revenue Multiples in Public and Private Capital Markets. Australian Journal of Management, 36 (1), 15-57. http://dx.doi.org/10.1177/ 0312896211401682 This paper is posted at ScholarlyCommons. https://repository.upenn.edu/accounting_papers/90 For more information, please contact [email protected].
Transcript of Market-to-Revenue Multiples in Public and Private Capital ...

University of Pennsylvania University of Pennsylvania
ScholarlyCommons ScholarlyCommons
Accounting Papers Wharton Faculty Research
4-2011
Market-to-Revenue Multiples in Public and Private Capital Markets Market-to-Revenue Multiples in Public and Private Capital Markets
Christopher S. Armstrong University of Pennsylvania
Antonio Davila
George Foster
John R. M. Hand
Follow this and additional works at: https://repository.upenn.edu/accounting_papers
Part of the Accounting Commons, Business Administration, Management, and Operations Commons,
and the Finance and Financial Management Commons
Recommended Citation Recommended Citation Armstrong, C. S., Davila, A., Foster, G., & Hand, J. M. (2011). Market-to-Revenue Multiples in Public and Private Capital Markets. Australian Journal of Management, 36 (1), 15-57. http://dx.doi.org/10.1177/0312896211401682
This paper is posted at ScholarlyCommons. https://repository.upenn.edu/accounting_papers/90 For more information, please contact [email protected].

Market-to-Revenue Multiples in Public and Private Capital Markets Market-to-Revenue Multiples in Public and Private Capital Markets
Abstract Abstract The behavior and determinants of market-to-revenue ratios in public and private capital markets is examined. Three samples are analysed: (1) all publicly traded stocks listed at some time on the New York Stock Exchange/American Stock Exchange/National Association of Securities Dealers Automated Quotation System in the 1980—2004 period; (2) sample of over 300 so-called ‘internet companies’ in the 1996—2004 period; and (3) over 5500 privately held venture capital-backed companies in the 1992—2004 period. Both company size and the most recent revenue growth rate are found to explain significant variation across companies in their market-to-revenue multiples — smaller companies and companies with higher recent revenue growth rates have higher multiples. We also document how the capital market appears to use a broad-based information set when setting market-to-revenue multiples for companies with negative revenue growth rates — transitory revenue growth components appear to be identified (in a probabilistic sense) by the capital market. Contrary to much anecdotal comment, we present evidence that the capital market behaved directionally along the lines predicted by capital market theory in the pricing of internet stocks in the 1996—2004 period.
Keywords Keywords internet companies, market-to-revenue multiple, price/sales ratio, private companies, public companies, transitory revenue, venture capital
Disciplines Disciplines Accounting | Business Administration, Management, and Operations | Finance and Financial Management
This journal article is available at ScholarlyCommons: https://repository.upenn.edu/accounting_papers/90

Electronic copy available at: http://ssrn.com/abstract=1798610
1
January 2011
MARKET-TO-REVENUE MULTIPLES
IN PUBLIC AND PRIVATE CAPITAL MARKETS*
BY
Christopher S. Armstronga, Antonio Davila
b, George Foster
c and John R.M. Hand
d
a Christopher S. Armstrong, Assistant Professor of Accounting, The Wharton School,
University of Pennsylvania, USA. b Antonio Davila, Professor of Entrepreneurship and Accounting and Control, IESE,
Spain. c George Foster, Wattis Professor of Management and Dhirubhai Ambani Faculty Fellow
in Entrepreneurship, Graduate School of Business, Stanford University, USA. d John R.M. Hand, H. Allen Andrew Distinguished Professor of Entrepreneurship,
Finance and Accounting, Kenan-Flagler Business School, University of North
Carolina, USA.
* Correspondence to [email protected]
Christopher Armstrong is grateful for financial support from the Dorinda and Mark
Winkelman Distinguished Scholar Award. George Foster thanks the support of the Center
for Entrepreneurial Studies at the Graduate School of Business, Stanford University. The
comments of Ray Ball, Bill Beaver, Philip Brown, Ron Kasznik and Charles Lee and
participants at workshops at Stanford University and the University of New South Wales
are greatly appreciated.
© Armstrong et al, 01/24/2011

Electronic copy available at: http://ssrn.com/abstract=1798610
2
ABSTRACT
The behavior and determinants of market to revenue ratios in public and private capital
markets is examined. Three samples are analyzed : (1) all publicly traded stocks listed at
some time on the NYSE/AMEX/NASDAQ in the 1980 to 2004 period, (2) sample of
over 300 so-called ―internet companies‖ in the 1996 to 2004 period, and (3) over 5,500
privately held venture capital backed companies in the 1992 to 2004 period. Both
company size and the most recent revenue growth rate are found to explain significant
variation across companies in their market to revenue multiples—smaller companies have
higher multiples and companies with higher recent revenue growth rates have higher
multiples. We also document how the capital market appears to use a broad based
information set when setting market to revenue multiples for companies with negative
revenue growth rates—transitory revenue growth components appear to be identified (in
a probabilistic sense) by the capital market. Contrary to much anecdotal comment, we
present evidence that the capital market behaved directionally along the lines predicted
by capital market theory in the pricing of internet stocks in the 1996 to 2004 period.
KEY WORDS: MARKET TO REVENUE MULTIPLE, PRICE/SALES RATIO,
PUBLIC COMPANIES, PRIVATE COMPANIES, VENTURE CAPITAL, INTERNET
COMPANIES, TRANSITORY REVENUE

Electronic copy available at: http://ssrn.com/abstract=1798610
3
I. Introduction
The market capitalization to revenue ratio (sometimes called price/sales ratio) is of central
interest in many areas of capital market investment analysis and research. These areas include
fundamental analysis, acquisition analysis, and examination of returns from quantitative
investment trading strategies.1 Revenue forecasts now are part of most security analyst reports.
2
This paper provides an extensive analysis of market capitalization to revenue multiples (hereafter
MKTt/REVt) and their drivers. We examine MKTt/REVt multiples for three samples, each of
which is of much interest in its own right. Sample One includes all publicly-traded stocks listed at
some time on the NYSE, AMEX or NASDAQ over the 1980 to 2004 period. Sample Two
comprises roughly 300 publicly-traded ―Internet companies;‖ the sample has most of its
observations in the 1996-2004 period. Sample Three comprises over 5,500 privately-held,
venture-backed companies from primarily the 1992-2004 period. Comparisons across the three
samples strengthens the reliability of the inferences we draw about the behavior and determinants
of MKTt/REVt multiples.
Key findings in this paper include: (1) Company size is a significant predictor of MKTt/REVt
ratios with smaller companies having higher MKTt/REVt ratios; (2) Past revenue growth is a
significant predictor of the level of the MKTt/REVt ratio; and (3) the capital market takes into
account transitory components of revenue when setting MKTt/REVt ratios. Underlying factors
explaining these findings are examined. The use of data pre, during, and post the 1998 to 2000
period also enables us to explore factors associated with the so-called ―internet bubble‖ period.
Our results are consistent with the capital market behaving in this period more rationally along
the predictions of capital market theory than many observers are willing to recognize.
1 See, for instance, O‘Hara and Lowry (2009).
2 IBES started reporting security analyst revenue forecasts approximately 20 years after it started reporting
EPS forecasts. It started reporting one-year ahead and two-year ahead revenue (EPS) forecasts in 1996
(1976). It started reporting long term revenue (EPS) growth forecasts in 1999 (1981). By 2004,
85.18%/83.68% of companies in the IBES sample of companies had one-year ahead/two-year ahead
security analyst revenue forecasts; the comparable percentages for one-year ahead/two-year ahead EPS
forecasts were 90.87%/89.50%. Ertimur, Mayew, and Stubben [2011] probe explanations for the issuance
of revenue and expense forecasts by security analysts.

4
II. Importance of Research and Literature Review
The findings in this paper have relevance for multiple research areas, including capital market
valuation research, management of reported financial numbers research, capital market 1998-
2001 ―bubble‖ research, and early-stage company research.
Capital Market Valuation Research
Much valuation research using market multiples has emphasized market (price) to earnings or
market to book value. MKTt/REVt analysis is also important in valuation research. Analysis of
market-to-revenue multiples can be motivated by both the revenue variable itself being an
informative signal about future value-relevant parameters and by revenues being a ―substitute‖
variable for situations in which negative earnings or book value are encountered.
A growing number of studies have documented the differential or incremental information
content of revenue vis-à-vis other variables. Ertimur, Livnat, and Martikainen [2003] report that a
dollar of surprise in revenues has higher capital market information content than a dollar of
surprise in expenses. Hypothesized explanations include a persistence explanation, a homogeneity
explanation, and an earnings management explanation. Berger [2003] argues that the persistence
explanation – ―investors react more strongly to a [revenue] surprise because these are less
transitory than expense surprises‖ (p. 213) – is the most credible explanation of the three
proposed. Ghosh, Gu, and Jain [2005], using an earnings response coefficient (ERC)
methodology, report that ―relative to the cost reduction firms, earnings for the revenue-growth
firms are more persistent… revenue-supported earnings growth is likely to be more sustainable
because revenue is the key value driver and its growth often reflects the underlying product
differentiation strategy‖ (p. 19). Keung [2010] reports incremental information content to analyst
revenue forecasts when they simultaneously make changes to their earnings and revenue
forecasts. The research in this paper provides systematic evidence to support the revenue
persistence / momentum argument. We also document across multiple samples that companies
with higher positive revenue growth in the most recent year have higher MKTt/REVt multiples.

5
Many valuation studies on market multiples, by their choice of variable(s) to examine, exclude
sizable numbers of interesting and important observations. For example, research on market
(price) to earnings multiples invariably deletes observations with non-positive earnings. This
deletion can have sizable impacts on the generalizability of the results. Appendix A of this paper
reports the percentages of NYSE, AMEX, and NASDAQ companies with negative net income.
The following percentages relate to the ―high-technology‖ subsample (covering the computer
hardware, software, telecom, and biotech/pharmaceuticals industries) and the ―all other‖
subsample of companies listed on these exchanges:
1985 1990 1995 2000 2004
High-Tech Companies 30.3% 37.2% 39.1% 56.8% 50.3%
All Other Companies 16.3% 23.1% 17.2% 22.3% 22.7%
Companies listed on NASDAQ (on average, smaller and younger) have a higher percentage of
negative net income than companies listed on the NYSE and AMEX. Core, Guay, and Van
Buskirk [2003], in a study of market to book value multiples, report losing 5,355 observations
(4.7%) from their sample when requiring companies to have positive book value. They note that
―deleting firms with negative book value of equity removes a greater percentage of young (7.5%)
and high-technology (5.6%) firms‖ (p. 51).
Research that compares the relative ―performance‖ of MKTt/REVt vis-à-vis other market
multiples highlights the potentially severe deletion that can occur in traditional MKTt/INCt or
MKTt/BVt multiple studies. Consider the Liu, Nissim, and Thomas [2002] study which adopted a
―horse-race‖ ranking methodology in which the ability of alternative accounting variables to
predict the current stock price was compared. The variables included six historical series (cash
flow, cash flow from operations, EBITDA, revenues (sales), earnings, and book value of equity)
and two forward-looking series (analyst forecasts of EPS and long-term growth in EPS). The

6
conclusion was that ―despite the importance of top-line revenues, its value-relevance is limited
until it is matched with expenses‖ (pp. 137-138). The sample examined had sizable reductions –
they excluded ―firm-years with negative values for any value driver‖ and ―firms not covered by
IBES, typically firms with low and medium market capitalization.‖ The authors noted that their
―results may not be descriptive of startup firms reporting losses and high growth firms with
negative operating cash flows‖ (p. 138).
The research in this paper examines MKTt/REVt multiples. The observations we delete due to
non-positive denominators are minimal vis-à-vis studies on MKTt/INCt or MKTt/BVt multiples.3
Moreover, we present results for different samples, some of which represent companies with
below average representation in previous research on market multiples (namely technology and
smaller companies). The privately-held venture-backed company sample we examine has only
recently been the subject of empirical research. Our results highlight how companies with either
negative net income or negative book value can still be the subject of capital market multiple
research as opposed to being ignored in a ―deleted observations‖ subsample.
“Management” of Reported Financial Numbers
The earnings management literature has examined multiple dimensions, including analysis of the
revenue series, various expense series, balance sheet items, and cash flow items. Stubben [2010]
examines the ability of revenue and accrual models to detect simulated and actual earnings
management. Callen, Robb, and Segal [2004] illustrate research with a focus on the revenue
series. They report finding that ―revenues are value relevant in explaining market value of equity
whereas earnings are not significant in explaining the market value of equity for firms reporting
negative earnings. Given our assumption that revenue manipulation flows though accounts
receivable, we show that firms with a more extreme string of past and anticipated losses report
higher accounts receivable to sales ratio‖ (p. 30). Bowen, Davis, and Rajgopal [2002] study
3 An analysis of Compustat companies listed on the NYSE, AMEX, or NASDAQ finds only 15 negative
annual revenue observations over the 1980-2004 period. We examined the respective 10K‘s of each of the
15 negative revenue observations – 3 were errors in Compustat.

7
revenue reporting policies of internet companies. They report that ―the pressure to seek external
financing influences Internet managers‘ choices to report barter and/or grossed-up revenue.‖ The
transitory revenue results in Section VIII of this paper provide further insight into how the
reported revenue series may differ from that which the capital market views as value relevant.
Analysis of 1998-2000 Capital Market “Bubble”
Phrases such as ―bubble period,‖ ―irrational exuberance,‖ and ―Internet euphoria‖ have been used
to describe the 1998 to 2000 capital market period. There were major swings in the market
capitalization of many companies in this period. Multiple studies have been undertaken of the
valuation of Internet companies in this period (see for example, Trueman, Wong, and Zhang
[2000, 2001] and Hand [2001, 2003]). These studies typically analyze companies in the era when
stock prices were increasing or at historically ex post high levels. Core, Guay, and Van Buskirk
[2003] examine the determinants of market to book value multiples for several samples (all firms,
high-tech and young firms) in the 1975 to 1999 period. They conclude that while the regression
models‘ ―explanatory power decline in the New Economy subperiod… the regression model‘s
structure during the New Economy subperiod is not unusual compared to other subperiods‖ (p.
43).
We analyze the 1980 to 2004 period, which includes the subsequent dramatic reductions in
market capitalization of many stocks as well as their prior sizable runups. This coverage provides
a stronger foundation to make inferences about the 1998-2000 period vis-à-vis other periods.
Moreover, we examine venture-backed privately-held companies as well as publicly-traded
companies. This sample provides further insight into the so-called ―bubble period‖ as many
public companies with dramatic increases in market capitalizations in the 1998-2000 period came
from our venture-backed sample of companies.
Early-Stage Company Valuation and Growth

8
There is an emerging literature on how early stage companies grow over time and the factors that
affect their valuation. One stream of this literature has focused on the valuation and financial
evolution of privately-held venture capital backed companies (see, for example, Davila, Foster,
and Gupta [2003], Hand [2005], and Armstrong, Davila, and Foster [2006]). Another stream of
research examines revenues and revenue forecasts of these companies (see, for example,
Armstrong, Davila, Foster, and Hand [2007]). A third stream examines the evolution of the
management control systems (including revenue/sales budgeting) of early-stage companies – see,
for example, Davila [2005], Davila and Foster [2005, 2007], Sandino [2007], Davila, Foster and
Li [2009], and Davila, Foster and Jia [2010]. Research is also focusing on the financial statements
prepared or released by start-up or privately held ventures – see Cassar [2009] and Allee and
Yohn [2009]. Hand [2011] documents how, for a sample of 1,133 venture-backed companies,
both financial (current year revenues) and non-financial (patents, headcount, etc.) explain one-
year-ahead revenue forecasts. Extensive evidence on the revenue growth rates of early-stage
companies in many countries is in Foster, Davila, Haemmig, He, Jia, von Bismarck and Wellman
[2011]. The research in this paper extends this literature by examining factors that explain
differences in the revenues of early-stage companies as well as the drivers of early-stage company
valuation.
III RESEARCH HYPOTHESES EXAMINED
We examine the following three hypotheses:
Hypothesis One. Smaller companies have higher MKTt/REVt ratios. Smaller companies are
hypothesized to have greater potential for future higher revenue growth rates. There is strong
evidence supporting Hypothesis One. This finding highlights the impact that sample deletion
procedures can play in excluding interesting and important observations. Smaller companies, on
average, are more likely to have negative net income or negative book value. They are also less
likely to have extensive analyst coverage. In our samples, smaller companies are more likely to
come from the high technology sector where intangible assets are of much interest. Revenues for

9
such companies potentially are an important signal that they are converting ―investments‖ in
intangible assets (ideas, innovations, discoveries, development of a sales force, etc.) into
products/services commercially valued by customers or partners.
Hypothesis Two. Companies with higher recent positive revenue growth rates will have
higher MKTt/REVt ratios than companies with lower recent positive revenue growth rates. Past
revenue growth is hypothesized to have significant momentum (i.e., persistence) such that the
higher the most recent year‘s revenue growth, the higher the likely future revenue growth. There
is strong evidence supporting Hypothesis Two.
Hypothesis Three. Companies with negative reported revenue growth and higher
MKTt/REVt ratios have a higher likelihood of negative transitory revenue. Transitory revenue is
the difference between reported revenue and underlying revenue. The capital market is
hypothesized to use a broad information set (certainly larger than just the most recent revenue
growth observation) and is able to identify the companies whose current reported revenue
contains a higher negative transitory component. There is strong evidence supporting Hypothesis
Three.
IV. Samples of Companies Examined
Three samples of companies are examined in this paper. These three samples were chosen to
ensure sizable cross-sectional and time-series differences in MKTt/REVt multiples of the
companies examined. They were also chosen to gain insight into the 1998-2000 period where
MKTt/REVt multiples for large numbers of publicly and privately traded companies reached
levels not previously encountered.
IV.A. Sample One: Publicly Traded Companies in Selected SIC Industries on NASDAQ
and NYSE/AMEX

10
Companies of particular interest in our research are those with extreme movements in market
capitalization. Extreme variation in the numerator of the revenue multiple enables the research to
probe the magnitude of any associated variation in the denominator of the market-to-revenue
multiple. The 1998-2001 period is a recent period with very large variations in market
capitalizations. Focusing on this period, we used the following criteria to identify two subgroups
with differing variations in market capitalization.
First, we calculated the sequence of end-of-month aggregate market capitalizations from January,
1998 to December, 2001 of all companies on the NASDAQ, AMEX, and NYSE exchanges in
every three-digit SIC code. For each three-digit SIC industry, we then found the:
(1) High value of that three-digit SIC industry group‘s market capitalization,
(2) Low value before the date of the high value but after January, 1998, and
(3) Low value after the date of the high value but before December, 2001.
Second, we then calculated the ratio of high-to-low market capitalizations (a) before the peak
(from (1) and (2)), and (b) after the peak (from (2) and (3)). The average of the two ratios from
(a) and (b) measures the relative increase and decrease in aggregate value of the three-digit SIC
industry group during the 1998-2001 period. We next ranked all SIC industries using the average
ratio and chose the top six industries with a peak individual aggregate market capitalization of at
least $1 trillion. These six SIC industries we put into four industry groups—computer hardware
(SIC codes 357, 366 and 367), computer software (737), telecommunications (481), and
biotechnology/pharmaceutical (283).4
4 The analysis used to identify the two Sample One sub-samples is conducted at the three-digit SIC industry
level and not the company level. Our industry market capitalization amounts are based on all companies
listed at the chosen date of interest. As new companies list or existing companies delist, there will be a
changing number of companies underlying the aggregate industry market capitalizations at different dates.

11
Table 1 (Panel A) reports the aggregate market capitalization information (as of 1/1/1998,
3/10/2000, and 12/31/2001) and the number of companies (as of 3/10/2000) for the following
groups:5
I. All Companies
II. Pooled Selected SIC Industries (II.A + II.B + II.C + II.D)
II.A. Computer Hardware (357, 366, 367)
II.B. Computer Software (737)
II.C. Telecommunications (481)
II.D. Biotechnology/Pharmaceuticals (283)
III. All Other Companies (in I. but not in II).
At the March 10, 2000 peak, our four selected industry groups comprised approximately 50% of
the total market capitalization of the NYSE/AMEX/ NASDAQ. NASDAQ firms in Group II
made up 57.6% of the total NASDAQ market capitalization. NYSE/AMEX firms in Group II
made up 42.4% of NYSE/AMEX total market capitalization.
Although the Sample One selection criteria focused only on the 1998-2001 period, it is interesting
to note that our Selected SIC industries subsample has differed from the All Other Companies
subsample on several key risk related variables for many years prior to the 1998-2001 period.
Appendix A reports that from at least 1985, companies in the Selected SIC Industries subsample
have had (a) higher security market risk (measured by both the Beta and standard deviation of
security returns), and (b) a higher percentage of companies with negative net income vis-à-vis the
All Other Companies subsample. Some key differences we find between subsamples II and III in
the 1998-2001 period are by construction of the research design. However, differences we
observe both pre-1998 and post-2001 are not by construction.
5 March 10, 2000 is the date when the NASDAQ reached its peak value (up through December 31, 2004).

12
IV.B. Sample Two: Publicly Traded Internet Companies
In the late 1990‘s and early 2000‘s the phrase ―internet company‖ was used to describe many
new companies where the internet played a key role in user engagement or revenue yield.
Revenues rather than net income was the more frequently used financial statement item in
valuation analysis of these so-called Internet companies. This was in part due to most such
companies not having positive net income, especially in the 1998-2001 period. Sample Two
comprises publicly traded Internet companies drawn from a database on Jay Ritter‘s website
(used in Loughran and Ritter [2004]). The database is built from a merging of ―Internet
identifications of Thompson Financial Securities Data, Dealogic, and IPOMonitor.com‖ (p.1).6
To facilitate comparisons with our SIC industry analysis, we cross-classified the Internet sample
with our SIC based groupings. The overlap is strongest for computer software, computer
hardware, and telecommunications industries. However, one other three digit SIC industry (738 –
Miscellaneous Business Services) accounted for over 10 % of the Internet sample (as of
3/10/2001).
Table 1 (Panel B) lists the aggregate market capitalizations (as of 1/1/1998, 3/10/2000, and
12/31/2001) and the number of companies (as of March 10, 2000) for the following groups:
I. All Internet Companies
II. Pooled Selected Internet-SIC Industries (II.A + II.B + II.C + II.D)
II.A. Internet-Computer Hardware
6 There is no universally agreed upon definition of an Internet company. The accounting literature has
relied heavily on the InternetStockList™ (ISL) reported on www.internet.com. The ISL was billed by
www.internet.com as a complete list of all publicly traded Internet stocks. An Internet stock was
operationally defined as a stock that existed because of the Internet – that is, had there been no Internet, the
stock would not be in existence. Papers that use the ISL include Trueman, Wong and Zhang (2000, 2001),
Demers and Lev (2001), Hand (2001), Bartov, Mohanram and Seethamraju (2002), Davis (2002), Demers
and Lewellen (2003), Keating, Lys and Magee (2003), and Bauman, Bauman and Das [2010]. Depending
on whether the authors were targeting all Internet firms or just a subset (e.g., only B2C firms), sample sizes
these papers analyzed range between 24 and 261. The finance literature approach appears to be to identify
which new IPOs have an internet connection. The Ritter database has this approach as does Schultz and
Zaman [2001], Ljungqvist and Wilhem [2003], and Ofek and Richardson [2002, 2003]. The samples in
these papers ranged from 393 to 538.

13
II.B. Internet-Computer Software
II.C. Internet-Telecommunications
II.D. Internet-(Miscellaneous) Business Services
III. All Other Internet Companies (in I. but not in II.)
The ―All Other Internet Companies‖ group (III) consists of Internet companies from many SIC
industry groupings. However, no SIC industry group in (III) has more than 4% of the All Internet
Company group (I).
The Internet sample is dominated by companies that went public after 1995.7 In contrast, Sample
One includes companies of many different IPO and age vintages. The Internet sample is almost
exclusively traded on NASDAQ. On March 10, 2000, 96.2% of the total companies in Sample
Two were listed on NASDAQ. The NASDAQ internet companies made up 97.8% of the total
NASDAQ/NYSE/AMEX Internet market capitalization on that date.
IV.C. Sample Three: Privately-Held Venture-Backed Companies
Revenues are a pivotal variable for valuing privately-held venture-backed companies. Venture
capital exists, in part, to finance early-stage companies whose rapid growth aspirations often
result in their having negative operating cash flow (and often negative income) in their early
years. Our Sample Three draws on a VentureOne database. VentureOne is a commercial
organization that collects and sells information about venture-backed companies and their
investors. The focus is on each company up to the time of an IPO, a trade sale or some other exit.
For each company included in its database, information on private financing rounds (such as
dates of funding rounds, amounts raised, and pre-money valuations) as well as details about the
company‘s management and investors is available. Several financial statement-based numbers
(revenue and net income) are also included for a subset of these companies. The database is at its
7 The Internet list includes 4.1% that went IPO prior to 1996. One notable company included in the list is
Cisco Systems (IPO in 1990).

14
most comprehensive from the early 1990‘s onwards. Data are provided to VentureOne by
companies and their investors on a voluntary basis. Where possible, VentureOne uses additional
sources to verify the reported numbers (such as obtaining pre-money valuation numbers from the
company itself, from individual investors, tracking business press reports on the company‘s
financing, and publicly available regulatory reports such as S-1 filings with the SEC).
VentureOne provides its own industry classifications (16 in total) for the companies in its
database. The top eight industry classifications cover 86.5% of the 13,765 companies in the
database. We use these eight industries as our Sample Three, grouping them into five broader
industries:
I. All Companies in Sample Three
I.A Software
I.B Consumer-Business Services
I.C Communications
I.D Biopharmaceuticals
I.E Hardware/Equipment
Table 1 (Panel C) summarizes the composition of these VentureOne industry groups. Of the
11,910 companies in Table 1 (Panel C), 1,262 had gone IPO by March 2005. We also report the
number of these IPO companies that were classified as Internet companies using the Sample Two
Internet company listing (from Jay Ritter‘s website). Approximately 18.9% (or 239 companies) of
this 1,262 IPO Sample became publicly-listed Internet companies, with most (92.8%) of these
having their IPO between 1996 and 2000. At the time of their public listing, the majority
(55.25%) of the Venture One companies with IPO‘s are classified into the six 3-digit SIC code
industries that comprise our Selected SIC Industry group in Sample One.

15
V. Time-Series and Cross-Sectional Distribution of MKT/REV Multiples
Figure 1 presents time-series plots from 1980-2004 for the MKTt/REVt (the ratio of market
capitalization of common equity to the most recent annual revenue) multiple for Samples One to
Three. Each plot has the 90th, 70
th, 50
th, 30
th, and 10
th percentiles of the annual cross-sectional
distribution. These percentiles are computed on a year-by-year basis. Sample One has two
subsamples. Both have similar scales (0 – 100) in Figure 1 to facilitate comparability. The
Selected SIC Industries subsample was selected based on high market capitalization variation in
the 1998-2001 period vis-à-vis the All Other Companies subsample. There are dramatic
MKTt/REVt multiple differences across these two subsamples in Figure 1. The 90th and 70
th
percentiles of the Selected SIC Industries subsample are consistently higher than that of the
comparable deciles for the All Other Companies subsample. The MKTt/REVt plots for Samples
Two and Three are scaled (0 to 350) higher than for Sample One to reflect the sizably higher 90th
MKTt/REVt percentile values, especially in the 1999 to 2000 period. Specific values for the 90th
percentile across the different samples for selected years are:
1985 1995 1998 1999 2000 2001 2002 2004
Sample One: NASDAQ/NYSE/AMEX
Selected SIC Industries 6.6 20.2 18.6 80.3 46.1 27.4 13.9 41.7
All Other Companies 5.1 5.1 4.6 5.9 6.1 5.4 4.4 7.2
Sample Two: Internet Companies - - 85.6 233.1 33.5 9.1 5.5 11.6
Sample Three: Venture-Backed
Companies - 78.3 142.5 161.0 332.5 149.8 233.4 100.0
In subsequent sections of this paper, we examine hypotheses that pertain to these time-series or
cross-sectional differences in MKTt/REVt multiples.8
8 One caveat on the sizably higher levels of the Sample Three MKTt/REVt multiples is that VentureOne
uses as one of its information sources the S-1 filings of companies attempting to have an IPO. This may
bias the private company sample to the more successful venture-backed private companies. However, many
non-IPO exits for such private companies are in trade-sales (acquisitions) for which market competition can
be intense. See Appendix A of Armstrong, Davila and Foster [2006] for discussion and evidence of

16
VI. Hypothesis One: Company Size and MKT/REV Ratios
Hypothesis One is that smaller companies have higher MKT/REV ratios. Theoretical valuation
models often include a growth term. For example, in the classic Miller-Modigliani [1961]
framework, growth was defined as investments with returns greater than their cost of capital – see
Fama and Miller [1972]. Much subsequent valuation research has used the Black-Scholes [1973]
option-theoretic framework to incorporate growth options into equity valuation. Hypothesis One
rests on smaller companies providing higher growth potential than larger companies. At an
extreme level, high compound growth rates over extended periods will constrain larger
companies before smaller companies due to theoretical limits imposed by the size of the market,
industry or economy in which the company operates. For any innovative product that creates a
given new market demand, the relative effect on a company‘s revenue or net income will be
greater for a smaller company than for a larger company. Smaller companies may also encounter
fewer regulatory obstacles in their early growth strategies.
Figure 2 shows the 90th, 70
th, 50
th, 30
th, and 10
th percentiles of distribution for the MKT/REV ratio
for five company size categories. These five categories (in $ millions of revenues) and the
percentage of observations in each category for the three samples we examine are:
I
$0-$5
II
$5-$25
III
$25-$100
IV
$100-$1000
V
> $1000
Sample One: NASDAQ/NYSE/AMEX
Selected SIC Industries 17.5% 23.7% 24.8% 23.8% 10.2%
All Other Companies 10.8% 16.4% 21.6% 34.1% 17.4%
Sample Two: Internet Companies 10.5% 27.3% 31.7% 26.2% 4.3%
SampleThree:Venture-Backed Companies 32.8% 40.1% 21.1% 5.9% 0.1%
possible biases from a sample that is exclusively comprised of venture-backed private companies that filed
for an IPO.

17
Not surprisingly, Sample Three (VC-backed private companies) contains the highest percentage
of observations in each of the two smallest company size categories ($0 - $5 million and $5 - $25
million in revenue) and the lowest percentage in the largest company size category (> $1,000
million in revenue). The All Other Companies subsample of Sample One has the lowest
percentage of observations in the two smallest categories and the highest percentage in the largest
category. The Selected SIC Industries subsample has 41.2% of observations in the $0 - $25
million revenue size range compared to 27.2% of observations for the All Other Companies
subsample of Sample One.
Figure 2 (Panel A) shows the Sample One MKTt/REVt distribution over the 1980 to 2004 period
for the five company size categories. The vertical MKTt/REVt scalings on the five size categories
are as follows: $0-$5 million (scale of 0-400); $5-$25 million (0-35); $25-$100 million (0-20);
$100-$1000 million (0-20); > $1000 million (0-15). The 90th percentile MKTt/REVt value for the
smallest company group ($0-$5 million) is consistently, over time, higher than the 90th percentile
MKTt/REVt value of the other four company size categories for both the Selected SIC Industries
subsample and the All Other Companies subsample. Figure 2 (Panel B) shows company size
breakdowns for Samples Two and Three. Results are shown only for a subset of years and a
subset of company size categories due to either zero or minimal observations in some years or
company size categories. For example, it is only since (approximately) 1996 that a sizable
number of Internet companies have been publicly listed. Very few VC-backed companies with
over $100 million of revenues have remained private stand-alone companies. The vertical
MKTt/REVt scalings in Panel B on the five size categories are $0-$5 million (scale of 0-2,500);
$5-$25 million (0-300); $25-$100 million (0-120); $100-$1000 million (0-70); > $1000 (0-25).
The most extreme MKTt/REVt values plotted in Figure 2 (Panel B) are those for the smallest
company size category for both Samples Two and Three.
In Section IX of this paper we include company size (revenues) as an independent variable in a
multivariate regression analysis with MKTt/REVt as the dependent variable. The company size

18
variable consistently has a negative coefficient that is highly statistically significant across all
samples examined. In the next section of this paper we explore the recent revenue growth
hypothesis and highlight how company size also is central to understanding the relative effect of
recent revenue growth on MKT/REV ratios.
VII. Hypothesis Two: Recent Revenue Growth and MKT/REV Ratios
Hypothesis Two is that companies with higher recent positive revenue growth rates will have
higher MKTt/REVt ratios than companies with lower recent positive revenue growth rates. Its
rationale is that the most recent revenue growth is a value-relevant predictor of future revenue
growth or other value-relevant variables. The early literature on the time-series properties of
accounting numbers focused on earnings. The key conclusion from multiple studies was that the
first differenced earnings series was either serially uncorrelated or in some studies exhibited
statistically significant negative serial correlation – see, for example, Ball and Watts [1972].9 In
contrast, the revenue series shows statistically significant evidence of positive serial correlation.
We computed autocorrelations for lags 1 to 4 for the first differenced annual revenue series for
companies in our two groups for Sample One.10
The time-period is 1980 to 2004. Table 2 shows
the results. For comparison purposes, we also report results for the operating income series and
the income before extraordinary items series. The Selected SIC Industries group in Sample One
has over 20,000 observations while the All Other Industries group has over 90,000 observations.
Table 2 highlights the statistically significant evidence of positive autocorrelation for the first
differenced annual revenue series for both Sample One groups. Moreover, the Selected SIC
Industries group (r1=0.36; r2=0.18; r3=0.16; r4=0.17) shows stronger positive autocorrelations than
the All Other Companies group (r1=0.18; r2=0.02; r3=0.07; r4=0.09). The positive autocorrelations
for revenues in Table 2 contrasts sharply with the minimal to negative autocorrelations for both
the operating income series and the income before extraordinary items series.
9 Ball and Foster [1982] and Foster [1986, pp. 238-245], provide reviews of this early literature.
10 Samples Two and Three have too limited a time-series for individual companies to compute comparable
autocorrelations.

19
We now explore further evidence pertaining to our Hypothesis Two – companies with higher
recent positive revenue growth rates will have higher MKTt/REVt ratios. In Section IX we present
multivariate regression results that strongly support this hypothesis. This section of our paper
highlights key factors that warrant recognition in quantifying the importance of past revenue
growth in MKT/REV analysis. Annual revenue growth is computed as
(
)
For a subset of observations there is information for revenuet, but not for revenuet-1 in our
databases. For Samples One and Two, this is primarily due to newly-listed companies. Sample
Three has a subset of missing observations due to the VentureOne data not always having a full
sequence of annual revenue numbers. Note that where the private company in Sample Three
starts in year t, there is no year t-1 annual revenue number by definition. The percentage of
observations that fall in the positive revenue growth (or no change), negative revenue growth, and
missing observations categories are:
Positive
Revenue
Change
Negative
Revenue
Change
Missing
Observation Total
Sample One: NASDAQ/NYSE/AMEX Companies
Selected SIC Industries 58.2% 28.7% 13.1% 100.0%
All Other Companies 62.6% 27.6% 9.8% 100.0%
Sample Two: Internet Companies 48.3% 26.1% 25.6% 100.0%
Sample Three: Venture-Backed Companies 61.9% 7.2% 30.9% 100.0%
The ―missing observation‖ category appears to be not a random sample and is of considerable
interest in any study on market-to-revenue multiples or revenue growth.
A. Annual Revenue Growth Rates, Industry/Sector, and Time Period
Cross-sectional distributions of the annual revenue growth rate from 1980 to 2004 are presented
in Figure 3 for the Selected SIC Industries (Panel A) and All Other Companies (Panel B)
subsamples of Sample One. Several patterns are observable in Figure 3. First, the 90th percentile

20
for the Selected SIC Industries group consistently exceeds the 90th percentile for the All Other
Companies Group over the 1980-2004 period. The Selected SIC Industries has consistently had
higher revenue growth in the upper tail of its distribution. Second, there is consistently larger
revenue growth variability for the Selected SIC Industries group than the All Other Companies
group. One measure of variability in revenue growth is the 90th to 10
th interpercentile range. Panel
C in Figure 3 plots this interpercentile range for the two groups over the 1980 to 2004 period. For
1999 and 2000, the interpercentile range had values of 266% and 305%, respectively, which is
well above the range outside of the 1998-2000 period. Every year from 1980 to 2004, the
interpercentile range for the Selected SIC Industries is larger. Recall that the industries in the two
subsamples were chosen using only 1998-2001 information. The results in Figure 3 and
Appendix A highlight how the Selected SIC Industries exhibited higher variability and higher risk
in both capital market and fundamental measures long before the 1998-2001 period.11
The MKTt/REVt multiples in Figure 1 for Sample Two (the Internet Sector) typically exceed
those for the Selected SIC Industries in Figure 1 for comparable years. Figure 4 presents annual
revenue growth rates for the 90th, 70
th, and 10
th percentiles that highlight that Sample Two,
likewise has higher revenue growth rates vis-à-vis Sample One for the 90th and 70
th percentiles,
especially in the 1998 to 2000 years. The magnitude of the 90th and 70
th percentiles for the
Internet companies (i.e., Sample Two) during 1998 to 2000 are well above either of the two
Sample One subgroups for comparable years and well above historical revenue growth rates for
the Sample One subgroups before the advent of Internet companies.
11
The higher risk Selected SIC Industries subsample had dramatically higher positive security returns in
the 1998-2000 period. Capital market theory would predict that these companies would also have
dramatically more negative security returns in the event of a market decline. This is exactly what happened
by December 2001. Table 1 shows the following aggregate market capitalizations (in $ billions):
1/1/1998 3/10/2000 12/31/2001
Selected SIC Industries $2,849 $9,262 $4,593
All Other Companies $8,202 $9,135 $9,619

21
Figure 4 also plots annual revenue growth rate deciles for the privately-held venture-backed
companies (Sample Three). The vertical scales for Samples One and Two in Figure 4 are identical
(90th percentile: scale of 0-800%; 70
th percentile: 0-300%) to visually highlight the higher annual
revenue growth for the Internet Companies vs. the Selected SIC Industries and for the Selected
SIC Industries vs. All Other Companies. Sample Three is scaled differently (90th percentile: scale
of 0-2,000%; 70th percentile: 0-500%) to avoid differences across other samples being visually
diminished by the extreme revenue growth rates for the venture-backed private companies.
Sample Three has even higher annual revenue growth rates than either Samples One or Two.
Note also the dramatic declines in annual revenue growth rates in Figure 4 for the Selected SIC
Industries (in 2001), the Internet companies (in 2001), and the venture-backed companies (in
2002 and 2003).
Table 3 shows the distribution (10th, 20
th, …, 80
th, 90
th percentiles) of revenue growth rates for
our five different size company categories and for the pooled sample. The data in Table 3
highlights how smaller companies have both higher negative revenue growth rates (see
the 10th
and 20th
percentiles) and higher positive revenue growth rates (see the 80th
and
90th
percentiles).
B. MKT/REV Multiples and Sign/Size of Revenue Growth Rates
Other things being equal, it is expected that the capital market favorably values companies with
positive recent revenue growth vis-à-vis companies with negative revenue growth. Table 4
reports distribution statistics (10th percentile, 50
th percentile, 90
th percentile) for the MKTt/REVt
multiple for three mutually exclusive groups:
A.) Companies with positive or zero reported revenue growth in the most recent year,
B.) Companies with negative reported revenue growth in the most recent year, and

22
C.) Companies without the prior or current year‘s reported revenue number in the
database with which to compute a revenue growth rate (typically, these are newly-
listed companies in Samples One and Two12
)
These three groups do not appear to have similar MKTt/REVt distributions, especially in their
upper tails. The groups with the highest MKTt/REVt observations in their upper tails are typically
those in either the negative revenue growth group or the missing revenue growth group. This is
counter to the expectation noted above.
Consider the MKTt/REVt distribution comparison between the negative revenue growth group
and the positive revenue growth group. The ratio of the 90th MKTt/REVt percentile of the
negative revenue growth group to the 90th MKTt/REVt percentile of the positive revenue growth
group exceeds one for most years. Summary data for this ratio are:
Time Period
Average
Ratio
# Years with
Ratio > 1
Sample One: NASDAQ/NYSE/AMEX
Selected SIC Industries 1980-2004 2.36 22/25
All Other Companies 1980-2004 1.58 22/25
Sample Two: Internet Companies 1997-2004 5.26 3/8
SampleThree:Venture-Backed Companies 1992-2004 31.87 13/13
For Samples One and Three, there is a consistent pattern for the 90th MKTt/REVt percentile for
the negative revenue growth group exceeding that of the positive revenue growth group. The
pattern for Sample Two (Internet companies) is less consistent. While the mean ratio of 5.26 is
greater than 1, it is heavily impacted by the 1995 observation where the 90th percentile is 2,101.6.
The MKTt/REVt distribution for the missing revenue observation sample is typically even more
positively skewed than the other two groups in Table 4.
12
For companies in Sample Three, there is occasionally a missing current year‘s reported revenue number
due to the absence of a regulatory mandate for private companies to publicly disclose financial data.
VentureOne relies in part on voluntary disclosure by private companies in their financial data bases and
also on regulatory disclosures. (S-1 filings associated with an IPO are a key data source. These S-1 filings
can be used to ―back-fill‖ numbers not previously publicly disclosed.)

23
Hypothesis Three explores the potential role of transitory revenue in explaining the extreme
positive skewness in MKTt/REVt ratios for the negative revenue growth subsample in Table 4.
VIII. Hypothesis Three: Transitory Revenue and MKT/REV Ratios
Hypothesis Three is that companies with negative revenue growth and higher MKTt/REVt ratios
have a higher likelihood of negative transitory revenue. The concept of transitory revenue is a
potential explanation for the Table 4 counter-intuitive result that the median and upper percentiles
of the MKT/REV ratio of companies with negative revenue growth exceed those with positive
revenue growth.
Transitory revenue is linked to reported revenue and underlying revenue as follows:
Reported
Revenue
=
Underlying
Revenue
+
Transitory
Revenue
Reported revenue is what each company reports in its financial statements. We compute
MKT/REV as market capitalization at the end of the fiscal year end divided by the reported
revenue for that fiscal year. Underlying revenue is the (unobservable) variable that the capital
market perceives as relevant to capturing the ongoing revenue generating capacity of a company
in a given period. Transitory revenue are components that are noise in inferring underlying
revenue from reported revenue.13
Examples of components include random and ―one-off‖ events,
activities by management to shift/misrepresent reported revenues across periods, and the revenues
that result from using accounting methods not viewed as appropriate by the capital market.
Revenue Growth Transition Matrix Analysis
13
Beaver and Morse [1978], Beaver [1989, pp. 91-101], and Foster [1986, pp. 436-443] provide further
discussion of the ―transitory‖ vs. ―permanent‖ distinction with respect to reported earnings.

24
Insight into the role of transitory revenue can be gained by examining the multi-year behavior of
revenue growth from portfolios formed using MKTt/REVt for (a) positive revenue growth
observations, (b) negative revenue growth observations, and (c) missing observations. We use
several steps to construct a transition matrix:
1.) For all of the observations in year t, compute and rank the year t revenue growth (t/t-
1) for those observations with available information. Form 10 equally-sized
portfolios. Portfolio 1 has the lowest (starting with the most negative) revenue
growth rate and Portfolio 10 has the highest (finishing with the most positive). An
11th portfolio of observations with missing revenue growth in year t is also formed
2.) For each of the ten portfolios from step 1, compute and rank the year t+1 revenue
growth (t+1/t) and form 10 equally-sized portfolios.
Table 5 presents the results in a percentage of observations format for the transition matrix. Under
the null hypotheses of no association across years in revenue growth, each cell in the 10 x 10
matrix is expected to have the same percentage of observations. Three patterns observable in
Table 5 are:
1.) The revenue ―momentum‖ corner portfolios in Table 4 – [1,1] for successive years of lowest
growth and [10,10] for successive years of highest growth – have higher than expected
percentages:
Portfolio 1,t/
Portfolio 1,t+1
Portfolio 10,t/
Portfolio 10,t+1
Sample One: NASDAQ/NYSE/AMEX
Selected SIC Industries 27.42% 37.87%
All Other Companies 29.60% 34.93%
Sample Two: Internet Companies 26.67% 41.82%
SampleThree:Venture-Backed Companies 21.15% 36.59%
Momentum in the [10,10] corner is consistent with economic factors giving current high revenue
growth companies a sustaining advantage over multiple years (e.g., due to, say, superior

25
branding, exclusive patents, deeper customer relationships, or a sustainable low-cost advantage).
Here, above average revenue growth t/t-1 is likely to indicate above average revenue growth in
t+1/t. Momentum in the [1,1] corner is consistent with the factors giving rise to revenue decline
(e.g., poor quality problems, inexperienced management repeatedly incurring self-inflicted
wounds, or aggregate market declining due to a disruptive technology) persisting over multiple
years.
2.) The ―reversal‖ corner portfolios in Table 5 – [1,10] and [10,1] – have above expected
percentages for both corners of the Sample One transition matrix, for neither of the reversal
corners for the Sample Two matrix, and only the [Port 1, t; Port 10, t+1] corner for Sample Three:
Portfolio 1,t/
Portfolio 10,t+1
Portfolio 10,t/
Portfolio 1,t+1
Sample One: NASDAQ/NYSE/AMEX
Selected SIC Industries 17.95% 14.37%
All Other Companies 16.10% 13.99%
Sample Two: Internet Companies 6.06% 5.45%
SampleThree:Venture-Backed Companies 13.94% 5.23%
Above average ―reversal‖ is consistent with transitory revenue growth being a sizable component
of reported revenue growth for some companies. For Samples One and Three, the [Port 1, t; Port
10, t+1] combination is above average. Negative transitory revenue growth in year t will likely
result in an annual revenue growth in year t+1 that is above average (due to the ―abnormally‖ low
year t reported revenue in the numerator of year t and the denominator in year t+1).
3.) Table 5 shows the row percentages for those observations with a missing revenue number in
the REVt/REVt-1 computation. Using the portfolio cutoff points for year t+1 we classify those
observations into one of the ten REVt+1/REVt portfolios.14
The percentage membership of the ten
14
Specifically, for each Sample of companies, we form ten equally sized portfolios based on the
observation‘s revenue growth from year t to year t+1 (excluding the missing revenue growth observations).
We then use the lowest and highest revenue growth for each portfolio to establish the revenue growth range

26
revenue growth portfolios in year t+1 indicate that the year t subsample with missing
observations has a disproportionately higher percentage in the higher revenue growth portfolios in
year t+1. For example, the combined percentages in portfolios 9 and 10 are: Sample One –
Selected SIC Industries (52.99%); Sample One – All Other Companies (45.32%); Sample Two –
Internet Companies (56.09%); and Sample Three – Venture-backed Companies (43.81%). One
explanation for Sample One and Two is that the newly-listed IPO companies include those from
Sample Three. Figure 4 documents the quantumly higher revenue growth rates in the private
company sample.
Multi-Year Analysis of MKT/REV Portfolios With Different Sign of Annual Revenue
Growth
Across each of the three samples, there is a positive revenue growth expectation. For instance, the
median annual revenue growth rates are: Sample One – Selected SIC Industries (11.4%); Sample
One – All Other Companies (8.4%); Sample Two – Internet Companies (47.1%); and Sample
Three – Venture-backed Companies (56.0%). Hypothesis Three is that companies with reported
negative revenue growth will likely include a subset where the current reported revenue number
includes a sizable negative transitory component. We now examine whether the capital market
sets MKTt/REVt multiples recognizing this negative transitory component in an empirically
observable way. We first examine the sample with positive revenue growth observations, in part
to use it as a benchmark to interpret the sample with negative revenue growth observations.
Figure 5 (Panel A) shows the median company revenue growth rates for ten portfolios ranked on
the basis of their MKTt/REVt values; Panel A is based only on observations with positive revenue
growth in year t. These ten portfolios comprise the top 10%, next 10%, …, bottom 10% of
MKTt/REVt observations for each company/year combination. By construction, they range from
of each of the ten portfolios. The observations with missing revenue growth from year t-1 to year t are then
assigned to one of the ten portfolios based on their revenue growth from year t to year t+1. We report these
assignments in Table 5.

27
the highest to the lowest MKTt/REVt observations. However, this does not mechanically rank the
portfolios on the basis of revenue growth. Table 6 reports the correlation between the median
MKTt/REVt multiple of each portfolio and its median annual revenue growth. The analysis is
conducted for the annual revenue growth at year t, year t+1, and year t+2 for the ten portfolios
constructed in year t. For the subsample of observations with positive revenue growth in the year
the MKTt/REVt multiple is computed (i.e., year t), there is a significant positive correlation at the
portfolio level between MKTt/REVt and annual revenue growth in each of years 1, 2, and 3 for
Samples One (both Selected SIC Industries and All Other Companies) and for Sample Three. The
Internet sample has significant positive correlations in years 1 and 2, but not in year 3. A word of
caution is appropriate in interpreting the Internet sample results. The analysis in Figure 5 is
conducted in event time (rather than calendar time). The sample with the least diversification in
constructing multiple sequences of calendar time to package in event time is the Internet sample.
The Internet sample is heavily concentrated in the 1997 to 2002 period and exhibits the most
precipitous drop in annual revenue growth in 2000 and beyond (see Figure 4). In contrast,
Samples One and Three have longer time sequences to effect the time period diversification.
The general finding from Figure 5 (Panel A) is that the capital market sets higher MKTt/REVt
multiples for companies with positive revenue growth not only in year t, but also with the realized
growth rates in years t+1 and t+2. For the observations with positive annual revenue growth, there
is support for both the sign and magnitude of past revenue growth as well as subsequent realized
revenue growth being positively associated with MKTt/REVt multiples.
Figure 5 (Panel B) and Table 5 both report results for those observations with negative revenue
growth. There is a key dramatic difference from the positive revenue growth observations in
Figure 5 (Panel A). In the year the ten MKTt/REVt portfolios are formed (i.e., year t), there is a
high negative correlation between the median MKTt/REVt in year t of each portfolio and the
magnitude of the revenue growth in year t. This significant negative correlation supports the

28
hypothesis that reported revenue in year t includes a negative transitory revenue component that
the capital market takes into account. The more negative the transitory revenue component, the
lower the denominator of the MKTt/REVt computation. Hypothesis Three can be empirically
probed by observing the realized annual revenue growth rates in years t+1 and t+2 for the ten
portfolios in Panel B. The revenue growth rates in years t+1 and t+2 are positively correlated with
the MKTt/REVt multiples. This flipping of the sign and magnitude of the portfolio revenue
growth rates between year t and year t+1 in Panel B is most marked for Samples One and Three.
Our results are consistent with Hypothesis Three – the capital market sets MKTt/REVt multiples
such that the magnitude of transitory revenue is recognized; higher MKTt/REVt multiples are
assigned to those negative Year t revenue growth companies with higher realized (and
presumably expected) annual revenue growth in years t+1 and t+2.
Table 6 shows results for: (a) the correlations between median MKTt/REVt and median annual
revenue growth in years t, t+1, and t+2 (in Panel A), and (b) the correlations between median
annual revenue growth of the ten MKTt/REVt portfolios for pairs of years t, t+1, and t+2 (in Panel
B). The correlations in Panel B highlight the revenue momentum factor for the positive revenue
growth subsample. It is the strongest in samples One and Three. The Internet companies in
Sample Two exhibit significant evidence of revenue momentum between years t and t+1, but
none between years t and t+2 or between years t+1 and t+2. The results for the negative revenue
growth portfolios in Panel B highlight the reversal pattern associated with the negative transitory
revenue component in year t. Note also the positive correlations between the median annual
revenue growth rates across portfolios between years t+1 and t+2 (with the Internet sample
having the lowest positive correlation). Portfolios formed on MKTt/REVt in year t for a sample
with negative revenue growth have positive Pearson correlations between median annual revenue
growth rates in years t+1 and years t+2 of 0.98 (Sample One – Selected SIC), 0.95 (Sample One –
All Other), 0.45 (Sample Two – Internet), and 0.90 (Sample Three – Venture-backed). This is

29
strong support for our negative transitory revenue hypothesis for the MKTt/REVt multiples of
negative revenue growth companies in year t.
IX. Multivariate Analysis
This section incorporates our prior analysis into a multivariate framework. Table 7 presents rank
regression results that further probe the three hypotheses for our three samples. We present results
for rank regressions due to the extreme observations found in each of the three samples:
Dependent Variable MKTt/REVt
Independent Variables
Company Size log(REVt)
Current Revenue Growth [(REVt/REVt-1) – 1]
Future Revenue Growth [(REVt+1/REVt) – 1]
Profitability Income/Revenue if > 0
Neg. Income/Revenue if ≤ 0
Leverage Long-term debt
Total assets
1998-2000 Time Period Indicator = 1 if 1998-2000
Table 7 reports results for the regression with combinations of independent variables. Regression
#1 reports results that pertain to Hypothesis One which predicts a negative relationship between
MKTt/REVt and company size. Across each of the samples for Regression #1, this hypothesis is
strongly supported. Hypothesis Two – companies with higher positive current revenue growth
will have higher MKTt/REVt – is consistently supported by the Regression 2 results.
Regressions 3 to 5 combine variables related to company size, current revenue growth, and future
revenue growth (defined as the realized revenue growth in Year t+1/Year t). The future revenue
growth variable is added in Regressions 3b, 4 and 5 to recognize that the capital market uses a
broad based information set when forecasting future revenue growth. Both the current revenue
growth and the future revenue growth measures are expected to have measurement error
regarding capturing the expected revenue growth implicit in MKTt/REVt. The current revenue

30
growth variable (REVt/REVt-1) will incorporate factors affecting Year t but not expected to affect
subsequent years. The future revenue growth variable (REVt+1/REVt-1) will incorporate factors
affecting Year t+1 that were unanticipated at the end of Year t. Both measures also are scalars
(representing one year of revenue growth) whereas the capital market likely is impounding a
vector (representing revenue growth over a sequence of future years). The regression results in
Regressions 1 to 5 consistently support Hypotheses 1 and 2.
Existing textbooks emphasize the importance of profitability in capital market valuation – see, for
example, Palepu and Healy [2007] and Penman [2009]. Regression #6 reports regression results
for MKTt/REVt as the dependent variable and two related profitability independent variables:
INC/REV (Net Income/Revenues) – if net income is positive or zero
NEGINC/REV (Negative Net Income/Revenues)
We include these two separate profitability variables due to prior research documenting
―anomalous‖ results for the loss company observations. 15
Results are reported for the two
publicly traded company samples; the VentureOne database has limited net income observations
for the privately held Sample Three companies. For both Sample One subsamples the coefficients
on the two profitability variables are positive and statistically significant – the more profitable the
company, the higher the MKTt/REVt multiple. However, the internet companies show
insignificant coefficients on the two profitability variables in Regression #6.
Regression #7 pools the independent variables in Regression #1 to #6. We also include two
additional variables:
Financial leverage (long-term debt to total assets)
1998-2000 time period intercept dummy variable
The rank regressions in Regression #7 provide strong support for Hypotheses One and Two in a
multivariate context.
15
Collins, Pincus and Xie [1999] report results showing an ―anomalous significantly negative price-
earnings relation using the simple earnings capitalization model for firms that report losses‖ (p.29).

31
Sample Two (internet companies) alone has several changes in the sign or significance of
individual independent variables for Regression #7 vis-à-vis Regressions #1 to #6. In Regression
#7, the coefficient on the future revenue growth for Sample Two is positive and significant
whereas the coefficient on the current revenue growth is positive but insignificant; both growth
variables are positive and significant in Regression #4 and #5. Regression #7 reports significant
positive coefficients on the two profitability variables for Sample Two whereas they were
insignificantly negative in Regression #6.
A comparison of the R2‘s across selected regressions provides additional insight into the differing
significance of the company size, revenue growth, and profitability variables. We successively
use the Adjusted R2‘s in Regression #1 (company size), #4 (revenue growth), and #6
(profitability) as the numerator and the Adjusted R2 in Regression #7 as the denominator:
16
Sample One Sample Two
Internet
Companies
Sample Three
VC-Backed
Private Companies Selected SIC
Industries
All Other
Companies
Company Size
(#1 / #7)
8.2%
36.9%
= 22.2%
9.5%
43.6%
= 21.8%
7.1%
40.1%
= 17.7%
68.1%
67.2%
= 101.3%
Revenue Growth
(#4 / #7)
11.1%
36.9%
= 30.1%
6.0%
43.6%
= 13.8%
35.7%
40.1%
= 89.0%
20.9%
67.2%
= 31.1%
Profitability
(#6 / #7)
15.7%
36.9%
= 42.5%
30.2%
43.6%
= 69.3%
4.3%
40.1%
= 10.7%
-
For the two Sample One subgroups of companies, profitability variables contribute the most
explanatory power. Revenue growth is more important for the Selected SIC Industries than for
the All Other Companies; the R2 for revenue growth variables in Regression #4 are 30.1% of the
Regression #7 R2 for the Selected SIC Industries subsample, but only 13.8% for the All Other
Companies subsample. Revenue growth is the dominant contributor for Sample Two (Internet
16
Due to possible collinearity among the company size, revenue growth, and profitability variables, the
sum of these percentages may overstate the combined explanatory power of these variables in a
multivariate context.

32
Companies) while company size is the dominant contributor for Sample Three (venture-backed
private companies).
Table 8 reports for Sample One rank regressions for the (a) positive revenue growth, (b) negative
revenue growth, and (c) missing revenue growth observation subsamples in panels A through C,
respectively. The positive revenue growth subsample is the largest subsample and has results
similar to Regression #7 in Table 7. The negative revenue growth subsample has a sign reversal
on the two revenue growth independent variables – the coefficient on current revenue growth is
significantly negative while the coefficient on future revenue growth is significantly positive.
These results support Hypothesis Three and are consistent with the ―flipping‖ of the portfolio
revenue growth rates in Year t and Year t+1 in Figure 5 (Panel B). The missing observations
subsample has (by definition) no current revenue growth independent variable; the coefficient on
the future revenue growth variable is significantly positive.
The multivariate results in Tables 7 and 8 reinforce the findings reported in prior sections.
Revenue growth and company size are key determinants of MKTt/REVt multiples. Moreover, the
capital market is able to distinguish (in a probabilistic sense) cases where both current and future
revenue growth are positively correlated from cases where they are negatively correlated.
X. Overview and Extensions Of Research
Our findings have implications for research in at least four areas – capital market valuation,
―management‖ of reported financial numbers, analysis of the 1998-2000 capital market ―bubble
era‖, and early-stage company valuation and growth.
Capital Market Valuation Research

33
Prior capital market research has recognized that deleting observations with negative net income
or negative book value results in samples under-represented in:
a.) high-technology companies, and
b.) younger early-stage companies
The samples examined in this paper include a broad cross-section of (a) and (b) companies as
well as companies from other industries and in their post early-stages. We document several
marked features of (a) and (b) companies. Such companies typically have higher revenue growth
rates, higher variability in revenue growth rates, and a higher negative income likelihood. The
strong support for our Hypothesis One (negative association between MKTt/REVt and company
size) and Hypothesis Two (positive association between MKTt/REVt and recent positive revenue
growth) highlights the importance of recognizing company size and revenue growth variables in
company valuation research. Note, moreover, that these variables are also highly statistically
significant in a broad sample of non-high technology publicly traded companies (Sample One –
All Other Companies).
Our analysis is of increased interest in the post-―internet bubble‖ period given the continued high
profile valuation of select individual early-stage companies e.g., Facebook (2004/2005 startup),
Zynga (2007 startup), and Groupon (2008 startup).
Management of Reported Financial Numbers Research
The earnings management literature hypothesizes that management proactively uses accounting
rules (such as revenue or expense recognition) to change reported accounting numbers. One
explanation for a transitory component in reported numbers is management accounting
―adjustments‖ for reasons related to misrepresenting underlying economics e.g., changing
software revenue recognition assumptions to maximize a compensation bonus or an earn-out
provision. However, other explanations (of a non-management manipulation kind) for the
transitory component exist – e.g., a negative transitory revenue component could be due to a
delay in a recurring computer hardware sales shipment cycle due to an unexpected shortage of

34
component parts. In some cases, a negative transitory revenue component in Year t may well
result in a positive transitory revenue component in Year t+1. Research on ways to better identify
contexts where transitory revenue is sizable (and their possible explanations) can assist the
probing of earnings ―management‖ hypotheses. The research in this paper used the joint
combination of (i) a high MKTt/REVt multiple, and (ii) a negative current revenue growth to
identify negative transitory revenue contexts. Alternative combinations of MKTt/REVt levels and
revenue growth rates could potentially be used to identify positive transitory revenue contexts.
Note that a key assumption here is that the capital market is able to identify (in a relatively high
probabilistic sense) this transitory component when setting MKTt/REVt multiples.
Analysis of 1998-2000 Capital Market “Bubble Era”
The working assumption in many descriptions of the 1998-2000 capital market period is that
company fundamentals did not explain the historically high levels of market multiples. Our
research looks at both the pre and post behavior of revenue growth and documents their dramatic
decline in 2000/2001 vis-à-vis 1998-2000. We document that industries with the largest
increases/decreases in market capitalization in the 1998-2001 period had characteristics that
identified them as relatively high risk for an extended period prior to 1998 e.g., higher beta,
higher standard deviation of security returns, and higher percentage of negative net income. Our
results are consistent with capital markets behaving more rationally along the predictions of
capital market theory than many observers are willing to recognize.
Our results also highlight that the capital market 1998-2000 surge and subsequent decline in
valuations was not restricted to the so-called internet companies that have been the focus of many
research studies. While internet companies exhibited very high positive (negative) rates of returns
in the 1998-2000 (2000-2001) period, the dollar amount of their aggregate market capitalization
increase/decrease is dwarfed by the aggregate increase/decrease in market capitalization of our
Selected SIC Industries group, which comprise the broader computer
software/hardware/telecommunications/biotech-pharmaceuticals sectors. Aggregate market

35
capitalizations of our Selected SIC Industries group and the Internet Companies are (from Table 1
- $ billions17
):
Selected SIC
Industries
Internet
Companies
Selected SIC Industries
Excluding Overlapping
Internet Companies
Aggregate Market Capitalizations
1/1/1998
3/10/2000
12/31/2001
$ 2,489
9,262
4,593
$ 80
1,630
279
$ 2,412
7,762
4,337
Aggregate Changes
1/1/1998 – 3/10/2000
3/10/2000 – 12/31/2001
$ 6,773
4,669
$ 1,550
1,351
$ 5,350
3,425
Research probing the 1998-2001 capital market era needs to examine a broader set of companies
than just those labeled as ―internet stocks‖. Most internet companies were listed on NASDAQ.
Many of the companies in our Selected SIC Industries group were listed on the NYSE. The above
market capitalization changes highlight that the so-called ―internet bubble‖ is an overly narrow
description. The increases/decreases in market capitalization in the 1998-2001 period occurred for
many non-internet companies and for many non-NASDAQ companies.
Early-Stage Company Research
Our research documents that both company size and revenue growth are statistically significant
independent variables in MKTt/REVt models in both public and private markets. We also find the
dramatically higher revenue growth rates for our venture-backed private companies sample
(Sample Three) vis-à-vis the revenue growth rates for the publicly traded company samples
(Samples One and Two) – see Figure 4. Not all early-stage companies are venture capital backed.
Venture capitalists traditionally restrict themselves to companies that both address large markets
and have the capacity to grow rapidly. The revenue growth rates we report in Figure 4 and Table
4 are consistent with multiple early-stage private companies achieving revenue growth rates not
accomplished by many publicly-traded companies. Subsequent research could examine the
growth rates on non-venture financed private companies. Such analysis could be part of a broader
focus on factors that explain the level and change in revenue growth rates as a company evolves
17
Table 1 reports the extent to which our Selected SIC Industries and Internet Companies overlap.

36
over time. Our research highlights that the existence of venture capital financing likely is a
facilitator of high revenue growth. Other potential variables that could be examined include the
product/service markets targeted by a company and the experience/aspirations of the management
team.
The growing analysis of early-stage companies offers many avenues to analyze how key factors
affect company valuation and growth e.g., the type of private financing, the role of public listing,
the chosen business model and its ability to scale, and the adoption of management control
systems. The dramatic time-series and cross-sectional variations in both the capital market
variables and the fundamental accounting variables across both the public and private company
samples examined in this paper highlight the fruitful opportunities for subsequent research.
Early-stage companies are also of much interest due to many having a relatively high intangible
asset composition vis-à-vis tangible assets. Venture capital funding often occurs because
companies have negative net cash flows due to their making ―investments‖ in intangibles such as
technologies, discoveries, etc. or the buildup of a sales/marketing capability. Revenues are an
important signal that such ―investments‖ are being commercially valued by customers or partners.
Rapid growth in revenues potentially is a lead indicator of subsequent growth in profitability. An
important research area is understanding the strength, time-horizon and determinants of such
lead/lag relationships between revenue growth and profitability growth.

37
APPENDIX A
Risk Differences Across NYSE/AMEX/NASDAQ Subsamples of Listed Companies
The Selected SIC Industries and All Other Companies subsamples of Sample One exhibit sizable
differences in risk-related indicators prior to and after, as well as during, the 1998 – 2001 period.
Capital Market Risk: Two frequently used measures of a company‘s capital market risk are the
CAPM beta and the standard deviation of security returns. The Selected SIC Industries group has
had higher relative market risk and higher total market risk than the All Other Companies group
for an extended time period since the 1980‘s through to 2004:
Beta Standard Deviation of Returns
Selected SIC
Industries
All Other
Companies
Selected SIC
Industries
All Other
Companies
Year 90th
50th
90th
50th
90th
50th
90th
50th
1980 1.87 1.08 1.54 0.70 0.044 0.029 0.042 0.024
1985 2.15 0.87 1.42 0.55 0.041 0.022 0.036 0.018
1990 1.77 0.68 1.36 0.42 0.072 0.029 0.055 0.021
1995 2.09 0.75 1.33 0.35 0.053 0.024 0.037 0.016
2000 1.71 0.86 1.08 0.24 0.086 0.040 0.054 0.025
2004 2.14 1.17 1.63 0.71 0.049 0.023 0.031 0.014
These data highlight that before, during, and after the 1998-2001 period, our Selected SIC
Industry group had sizably higher market relative risk and higher market total risk than our All
Other Companies group. With this higher risk, finance theory would predict came the potential
for larger increases in market capitalization and larger decreases in market capitalization.
Negative Net Income: A fundamental indicator of company risk is the likelihood of reporting a
loss. All else held equal, a firm with negative net income is less likely to generate funds for
investing in new growth opportunities or to make distributions to its shareholders. The Selected
SIC Industries group differs markedly from the All Other Companies group in terms of its
propensity for losses. While there has been an increase since 1980 in the percentage of all

38
companies reporting negative net income (with a decline in the 2002 to 2004 period), this
increase has been concentrated in our Selected SIC Industries group:
Year
Selected
SIC Industries
All Other
Industries
All Companies
Pooled
1980 7.8% 23.5% 21.5%
1985 30.3% 16.3% 18.5%
1990 37.2% 23.1% 25.6%
1995 39.1% 17.2% 21.9%
2000 56.8% 22.3% 31.0%
2001 68.0% 25.3% 36.0%
2004 50.3% 22.7% 29.4%
The results for the All Companies column have been noted before by Hayn [1995], Collins,
Pincus, and Xie [1999], and Joos and Plesko [2005]. Over time, the likelihood that a publicly-
traded U.S. listed company will report a loss has increased. In 1980, there was roughly a 20%
chance in any one year, while by 2000 there was more than a 30% chance.18
Companies on NASDAQ have higher loss percentages than companies on the NYSE/AMEX.
Selected percentages over the 1980 to 2000 period are:
Year
NASDAQ
Companies
NYSE/AMEX
Companies
All
Companies
1980 23.6% 21.3% 21.5%
1985 21.5% 16.7% 18.5%
1990 31.5% 21.5% 25.6%
1995 27.5% 15.7% 21.9%
2000 40.5% 18.3% 31.0%
2001 44.1% 25.5% 36.0%
2004 36.4% 20.3% 29.4%
NASDAQ companies are, on average, smaller and younger than companies on the NYSE/AMEX.
Size and age have been found to useful predictors of financial distress [Altman, 2000].
18
The proposition that the percentage of losses has increased over time is supported by a univariate
regression of the percentage loss on a time trend. The trend term is positive and significant. Fama and
French [2004] report evidence of an increase in loss rates for newly listed companies.

39
Figure 1
Market Capitalization to Revenue Multiple Percentiles (90th
, 70th
, 50th
, 30th
, and 10th
) for
Sample One (All NYSE/AMEX/NASDAQ Public Companies), Sample Two (Internet Public
Companies) and Sample Three (Venture-Backed Private Companies): 1980 to 2004
Sample One
Selected SIC Industries (Public)a
Sample One
All Other Companies (Public)
Sample Two
Internet Companies (Public)
Sample Three
V.C. Backed Companies (Private)
a. Comprises companies in Hardware, Software, Telecom, and Biotech/Pharmaceuticals
Industries
0
10
20
30
40
50
60
70
80
90
100
1980 1985 1990 1995 2000 2005
90th
70th
50th
30th
10th
0
10
20
30
40
50
60
70
80
90
100
1980 1985 1990 1995 2000 2005
90th
70th
50th
30th
10th
0
50
100
150
200
250
300
350
1980 1985 1990 1995 2000 2005
90th
70th
50th
30th
10th
0
50
100
150
200
250
300
350
1980 1985 1990 1995 2000 2005
90th
70th
50th
30th
10th

40
Figure 2 – Panel A
Annual Market Capitalization-to-Revenue Multiple Percentiles for Sample One Companies
in Selected SIC Industries for Various Company Size Categories: 1980 - 2004 Selected SIC Industries (Public) All Other Companies (Public)
Rev
< $
5M
$5
M <
Rev
< $
25
M
$2
5M
< R
ev <
$10
0M
$1
00
M <
Rev
< $
1,0
00M
Rev
> $
1,0
00
M
0
50
100
150
200
250
300
350
400
1980 1985 1990 1995 2000 2005
90th
70th
50th
30th
10th
0
50
100
150
200
250
300
350
400
1980 1985 1990 1995 2000 2005
90th
70th
50th
30th
10th
0
5
10
15
20
25
30
35
1980 1985 1990 1995 2000 2005
90th
70th
50th
30th
10th
0
5
10
15
20
25
30
35
1980 1985 1990 1995 2000 2005
90th
70th
50th
30th
10th
0
2
4
6
8
10
12
14
16
18
20
1980 1985 1990 1995 2000 2005
90th
70th
50th
30th
10th
0
2
4
6
8
10
12
14
16
18
20
1980 1985 1990 1995 2000 2005
90th
70th
50th
30th
10th
0
2
4
6
8
10
12
14
16
18
20
1980 1985 1990 1995 2000 2005
90th
70th
50th
30th
10th
0
2
4
6
8
10
12
14
16
18
20
1980 1985 1990 1995 2000 2005
90th
70th
50th
30th
10th
-1
1
3
5
7
9
11
13
15
1980 1985 1990 1995 2000 2005
90th
70th
50th
30th
10th
-1
1
3
5
7
9
11
13
15
1980 1985 1990 1995 2000 2005
90th
70th
50th
30th
10th

41
Figure 2 – Panel B
Annual Market Capitalization-to-Revenue Multiple Percentiles for Sample Two and
Sample Three Companies for Various Company Size Categories: 1980 - 2004 B. Sample Two – Internet (Public) C. Sample Three – VC Backed
(Private)
Rev
< $
5M
$5
M <
Rev
< $
25
M
$2
5M
< R
ev <
$10
0M
$1
00
M <
Rev
< $
1,0
00M
Rev
> $
1,0
00
M
0
500
1000
1500
2000
2500
1980 1985 1990 1995 2000 2005
90th
70th
50th
30th
10th
0
500
1000
1500
2000
2500
1980 1985 1990 1995 2000 2005
90th
70th
50th
30th
10th
0
50
100
150
200
250
300
1980 1985 1990 1995 2000 2005
90th
70th
50th
30th
10th
0
50
100
150
200
250
300
1980 1985 1990 1995 2000 2005
90th
70th
50th
30th
10th
0
20
40
60
80
100
120
1980 1985 1990 1995 2000 2005
90th
70th
50th
30th
10th
0
20
40
60
80
100
120
1980 1985 1990 1995 2000 2005
90th
70th
50th
30th
10th
0
10
20
30
40
50
60
70
1980 1985 1990 1995 2000 2005
90th
70th
50th
30th
10th
0
10
20
30
40
50
60
70
1980 1985 1990 1995 2000 2005
90th
70th
50th
30th
10th
0
5
10
15
20
25
1980 1985 1990 1995 2000 2005
90th
70th
50th
30th
10th
0
5
10
15
20
25
1980 1985 1990 1995 2000 2005
90th
70th
50th
30th
10th

42
Figure 3
Annual Revenue Growth Percentiles (10th
, 30th
, 50th
, 70th
, and 90th
) and Interdecile Range
(90th
– 10th
) for Publicly Traded Companies on NYSE/AMEX/NASDAQ: 1980 to 2004
Panel A: Selected SIC Industries (Hardware, Software, Telecom, Biotech/Pharma)
Panel B: All Other Companies
Panel C: Annual Interpercentile (90th
– 10th
) Range
-100%
-50%
0%
50%
100%
150%
200%
250%
300%
350%
1980 1981 1982 1983 1984 1985 1986 1987 1988 1989 1990 1991 1992 1993 1994 1995 1996 1997 1998 1999 2000 2001 2002 2003 2004
An
nu
al
Reven
ue G
row
th
90th Percentile
10th Percentile
-100%
-50%
0%
50%
100%
150%
200%
250%
300%
350%
1980 1981 1982 1983 1984 1985 1986 1987 1988 1989 1990 1991 1992 1993 1994 1995 1996 1997 1998 1999 2000 2001 2002 2003 2004
An
nu
al
Reven
ue G
row
th
10th Percentile
90th Percentile
0%
50%
100%
150%
200%
250%
300%
350%
1980 1981 1982 1983 1984 1985 1986 1987 1988 1989 1990 1991 1992 1993 1994 1995 1996 1997 1998 1999 2000 2001 2002 2003 2004 2005
Inte
rperc
en
tile
(90th
min
us 1
0th
)
Ran
ge o
f A
nn
ual
Reven
ue G
row
th
Selected SIC Industries (II) All Other Companies (III)

43
Figure 4
Annual Revenue Growth Rates For Publicly-Traded Companies and Private Venture-Backed Companies: 1996 – 2004
Selected SIC Industries vs. All Other Companies vs. Internet Companies vs. Venture-Backed Companies
SAMPLE ONE SAMPLE TWO SAMPLE THREE
Selected SIC Industries
(Public)
All Other
Companies (Public)
Internet
Companies (Public)
Venture-Backed
Companies (Private)
90
th P
erce
nti
le
70
th P
erce
nti
le
10
th P
erce
nti
le
0%
100%
200%
300%
400%
500%
600%
700%
800%
1996
1997
1998
1999
2000
2001
2002
2003
2004
0%
100%
200%
300%
400%
500%
600%
700%
800%
1996
1997
1998
1999
2000
2001
2002
2003
2004
0%
100%
200%
300%
400%
500%
600%
700%
800%
1996
1997
1998
1999
2000
2001
2002
2003
2004
0%
200%
400%
600%
800%
1000%
1200%
1400%
1600%
1800%
2000%
1996
1997
1998
1999
2000
2001
2002
2003
2004
0%
50%
100%
150%
200%
250%
300%
1996 1998 2000 2002 2004
0%
50%
100%
150%
200%
250%
300%
1996 1998 2000 2002 20040%
50%
100%
150%
200%
250%
300%
1996 1998 2000 2002 2004
0%
50%
100%
150%
200%
250%
300%
350%
400%
450%
500%
1996 1998 2000 2002 2004
-100%
-80%
-60%
-40%
-20%
0%
20%
40%
60%
1996 1998 2000 2002 2004
-100%
-80%
-60%
-40%
-20%
0%
20%
40%
60%
1996 1998 2000 2002 2004
-100%
-80%
-60%
-40%
-20%
0%
20%
40%
60%
1996 1998 2000 2002 2004
-100%
-80%
-60%
-40%
-20%
0%
20%
40%
60%
1996 1998 2000 2002 2004

44
Figure 5 – Panel A
Median Annual Portfolio Revenue Growth in Years t, t+1, and t+2 for Portfolios Formed
Using MKTt/REVt Rankings: 10 Portfolios with Positive Revenue Growth in Year t Sample One
Selected SIC Industries (Public)
Sample One
All Other Companies (Public)
Yea
r t
Yea
r t+
1
Yea
r t+
2
Sample Two – Internet (Public) Sample Three – VC Backed (Private)
Yea
r t
Yea
r t+
1
Yea
r t+
2
0%
10%
20%
30%
40%
50%
60%
70%
80%
10 9 8 7 6 5 4 3 2 1
Positive Revenue Growth
0%
10%
20%
30%
40%
50%
60%
70%
80%
10 9 8 7 6 5 4 3 2 1
Positive Revenue Growth
0%
10%
20%
30%
40%
50%
60%
10 9 8 7 6 5 4 3 2 1
Positive Revenue Growth
0%
10%
20%
30%
40%
50%
60%
10 9 8 7 6 5 4 3 2 1
Positive Revenue Growth
0%
5%
10%
15%
20%
25%
30%
10 9 8 7 6 5 4 3 2 1
Positive Revenue Growth
0%
5%
10%
15%
20%
25%
30%
10 9 8 7 6 5 4 3 2 1
Positive Revenue Growth
0%
20%
40%
60%
80%
100%
120%
140%
160%
180%
10 9 8 7 6 5 4 3 2 1
Revenue Growth Portfolio
0%
1000%
2000%
3000%
4000%
5000%
6000%
7000%
8000%
9000%
10000%
10 9 8 7 6 5 4 3 2 1
Revenue Growth Portfolio
0%
20%
40%
60%
80%
100%
120%
140%
160%
10 9 8 7 6 5 4 3 2 1
Revenue Growth Portfolio
0%
20%
40%
60%
80%
100%
120%
140%
160%
10 9 8 7 6 5 4 3 2 1
Revenue Growth Portfolio
0%
20%
40%
60%
80%
100%
120%
10 9 8 7 6 5 4 3 2 1
Revenue Growth Portfolio
0%
20%
40%
60%
80%
100%
120%
10 9 8 7 6 5 4 3 2 1
Revenue Growth Portfoli0

45
Figure 5 – Panel B
Median Annual Portfolio Revenue Growth in Years t, t+1, and t+2 for Portfolios Formed
Using MKTt/REVt Rankings: 10 Portfolios with Negative Revenue Growth in Year t
Sample One
Selected SIC Industries (Public)
Sample One
All Other Companies (Public)
Yea
r t
Yea
r t+
1
Yea
r t+
2
Sample Two – Internet (Public) Sample Three – VC Backed (Private)
Yea
r t
Yea
r t+
1
Yea
r t+
2
-60%
-50%
-40%
-30%
-20%
-10%
0%
10 9 8 7 6 5 4 3 2 1
Negative Revenue Growth
-60%
-50%
-40%
-30%
-20%
-10%
0%
10 9 8 7 6 5 4 3 2 1
Negative Revenue Growth
-20%
-10%
0%
10%
20%
30%
40%
50%
60%
70%
80%
10 9 8 7 6 5 4 3 2 1
Negative Revenue Growth
-20%
-10%
0%
10%
20%
30%
40%
50%
60%
70%
80%
10 9 8 7 6 5 4 3 2 1
Negative Revenue Growth
-10%
-5%
0%
5%
10%
15%
20%
25%
30%
10 9 8 7 6 5 4 3 2 1
-10%
-5%
0%
5%
10%
15%
20%
25%
30%
10 9 8 7 6 5 4 3 2 1
-80%
-70%
-60%
-50%
-40%
-30%
-20%
-10%
0%
10 9 8 7 6 5 4 3 2 1
Negative Revenue Growth
-80%
-70%
-60%
-50%
-40%
-30%
-20%
-10%
0%
10 9 8 7 6 5 4 3 2 1
Negative Revenue Growth
-250%
-200%
-150%
-100%
-50%
0%
50%
10 9 8 7 6 5 4 3 2 1
Negative Revenue Growth
-50%
0%
50%
100%
150%
200%
250%
10 9 8 7 6 5 4 3 2 1
Negative Revenue Growth
-20%
0%
20%
40%
60%
80%
100%
120%
10 9 8 7 6 5 4 3 2 1
Negative Revenue Growth
-20%
0%
20%
40%
60%
80%
100%
120%
10 9 8 7 6 5 4 3 2 1
Negative Revenue Growth

46
Table 1
Summary Statistics on Three Samples: Sample One (All NYSE/AMEX/NASDAQ Public
Companies), Sample Two (Internet Public Companies) and Sample Three (Venture-
Backed Private Companies).
Panel A
Panel B
Panel C
No. of Companies
Sample Two - Internet Companies (Public) 1/1/1998 3/10/2000 12/31/2001 3/10/2000
I. All Internet Companies $80 $1,630 $279 367
II. PooledSelected Internet SIC Industries 77 1,500 256 260
II.A. Internet - Computer Hardware 57 653 158 21
II.B. Internet - Computer Software 17 726 72 178
II.C. Internet - Telecommunications 2 47 2 23
II.D. Internet - Business Services 1 75 24 38
III. All Other Internet Companies 3 130 23 107
Aggregate Market Capitalization ($ Billions)
Number of Number with Internet Coy's
Sample Three - VC Backed Companies (Private) Companies IPO with IPO(c)
I. All VentureOne Companies 11,910 1,262 239
I.A. Software (a) 4,811 388 134
I.B. Consumer-Business Services 2,272 127 48
I.C. Communications 1,604 195 53
I.D. Biopharmaceuticals 1,008 231 0
I.E. Hardware/Equipment (b) 2,215 321 4
(a) Comprises the ―Software‖ and ―Information Services‖ Industry Segments of VentureOne.
(b) Comprises the ―Medical Devices,‖ ―Electronics,‖ and ―Semiconductors‖ Industry Segments of VentureOne.
(c) The Internet company list (taken from Jay Ritter‘s website) is combined with the VentureOne listing to identify the
VentureOne Internet companies with an IPO.
No. of Companies Sample One - NYSE/AMEX/NASDAQ Companies (Public) 1/1/1998 3/10/2000 12/31/2001 3/10/2000 I. All Companies $11,051 $18,398 $14,212 8,401 II. Pooled Selected SIC Industries 2,849 9,262 4,593 1,932 (357, 366, 367, 737, 481, 283) II.A. Computer Hardware (357,366,367) 933 4,098 1,612 615 II.B. Computer Software (737) 550 2,504 979 792 II.C. Telecommunications (481) 528 1,387 625 190 II.D. Biotech/Pharma (283) 839 1,273 1,377 335 III. All Other Companies 8,202 9,135 9,619 6,469
Aggregate Market Capitalization ($ Billions)

47
Table 2
Mean Autocorrelations for First Differenced Annual Financial Series
for Sample One (NYSE/AMEX/NASDAQ Publicly-Traded Companies): 1980-2004
r1 r2 r3 r4
Revenues
Selected SIC Industries
All Other Companies
0.36
0.18
0.18
0.02
0.16
0.07
0.17
0.09
Operating Income
Selected SIC Industries
All Other Companies
0.03
-0.10
-0.06
-0.01
0.03
-0.01
0.01
0.01
Income Before Extraordinary Items
Selected SIC Industries
All Other Companies
-0.25
-0.27
-0.07
-0.04
-0.10
-0.07
0.02
0.02
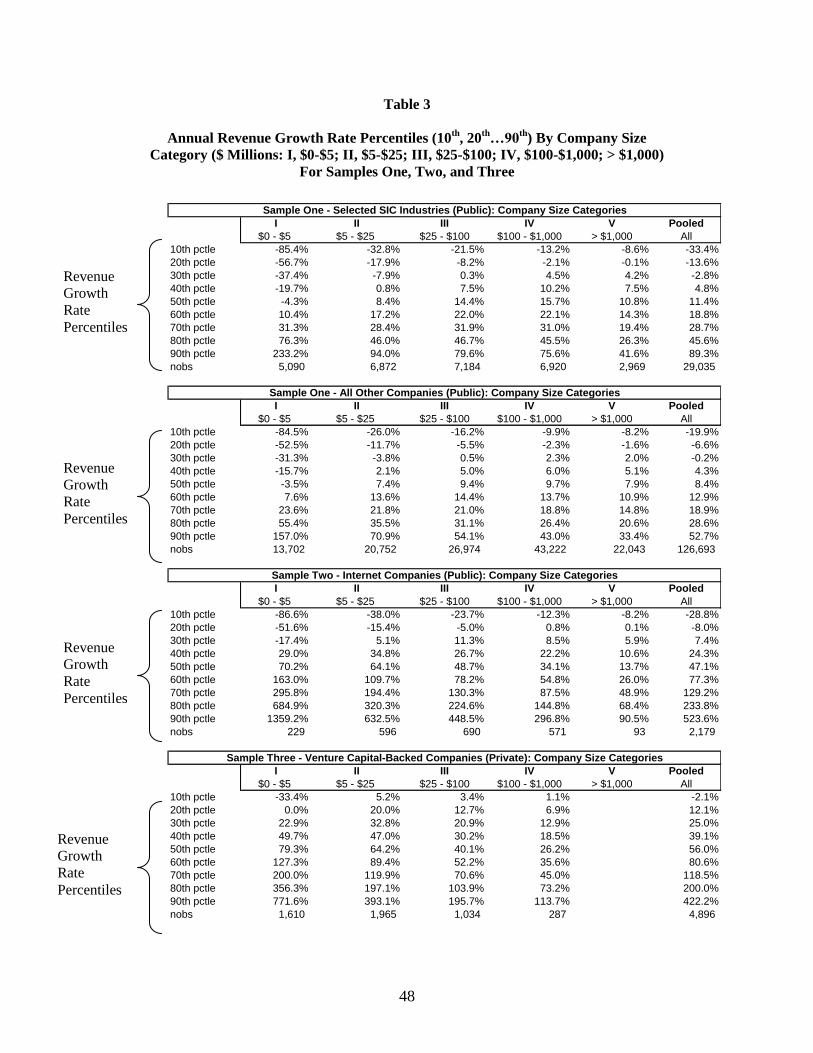
48
Table 3
Annual Revenue Growth Rate Percentiles (10th
, 20th
…90th
) By Company Size
Category ($ Millions: I, $0-$5; II, $5-$25; III, $25-$100; IV, $100-$1,000; > $1,000)
For Samples One, Two, and Three
Revenue
Growth
Rate
Percentiles
Revenue
Growth
Rate
Percentiles
Revenue
Growth
Rate
Percentiles
Revenue
Growth
Rate
Percentiles
I II III IV V Pooled
$0 - $5 $5 - $25 $25 - $100 $100 - $1,000 > $1,000 All
10th pctle -85.4% -32.8% -21.5% -13.2% -8.6% -33.4%
20th pctle -56.7% -17.9% -8.2% -2.1% -0.1% -13.6%
30th pctle -37.4% -7.9% 0.3% 4.5% 4.2% -2.8%
40th pctle -19.7% 0.8% 7.5% 10.2% 7.5% 4.8%
50th pctle -4.3% 8.4% 14.4% 15.7% 10.8% 11.4%
60th pctle 10.4% 17.2% 22.0% 22.1% 14.3% 18.8%
70th pctle 31.3% 28.4% 31.9% 31.0% 19.4% 28.7%
80th pctle 76.3% 46.0% 46.7% 45.5% 26.3% 45.6%
90th pctle 233.2% 94.0% 79.6% 75.6% 41.6% 89.3%
nobs 5,090 6,872 7,184 6,920 2,969 29,035
I II III IV V Pooled
$0 - $5 $5 - $25 $25 - $100 $100 - $1,000 > $1,000 All
10th pctle -84.5% -26.0% -16.2% -9.9% -8.2% -19.9%
20th pctle -52.5% -11.7% -5.5% -2.3% -1.6% -6.6%
30th pctle -31.3% -3.8% 0.5% 2.3% 2.0% -0.2%
40th pctle -15.7% 2.1% 5.0% 6.0% 5.1% 4.3%
50th pctle -3.5% 7.4% 9.4% 9.7% 7.9% 8.4%
60th pctle 7.6% 13.6% 14.4% 13.7% 10.9% 12.9%
70th pctle 23.6% 21.8% 21.0% 18.8% 14.8% 18.9%
80th pctle 55.4% 35.5% 31.1% 26.4% 20.6% 28.6%
90th pctle 157.0% 70.9% 54.1% 43.0% 33.4% 52.7%
nobs 13,702 20,752 26,974 43,222 22,043 126,693
I II III IV V Pooled
$0 - $5 $5 - $25 $25 - $100 $100 - $1,000 > $1,000 All
10th pctle -86.6% -38.0% -23.7% -12.3% -8.2% -28.8%
20th pctle -51.6% -15.4% -5.0% 0.8% 0.1% -8.0%
30th pctle -17.4% 5.1% 11.3% 8.5% 5.9% 7.4%
40th pctle 29.0% 34.8% 26.7% 22.2% 10.6% 24.3%
50th pctle 70.2% 64.1% 48.7% 34.1% 13.7% 47.1%
60th pctle 163.0% 109.7% 78.2% 54.8% 26.0% 77.3%
70th pctle 295.8% 194.4% 130.3% 87.5% 48.9% 129.2%
80th pctle 684.9% 320.3% 224.6% 144.8% 68.4% 233.8%
90th pctle 1359.2% 632.5% 448.5% 296.8% 90.5% 523.6%
nobs 229 596 690 571 93 2,179
I II III IV V Pooled
$0 - $5 $5 - $25 $25 - $100 $100 - $1,000 > $1,000 All
10th pctle -33.4% 5.2% 3.4% 1.1% -2.1%
20th pctle 0.0% 20.0% 12.7% 6.9% 12.1%
30th pctle 22.9% 32.8% 20.9% 12.9% 25.0%
40th pctle 49.7% 47.0% 30.2% 18.5% 39.1%
50th pctle 79.3% 64.2% 40.1% 26.2% 56.0%
60th pctle 127.3% 89.4% 52.2% 35.6% 80.6%
70th pctle 200.0% 119.9% 70.6% 45.0% 118.5%
80th pctle 356.3% 197.1% 103.9% 73.2% 200.0%
90th pctle 771.6% 393.1% 195.7% 113.7% 422.2%
nobs 1,610 1,965 1,034 287 4,896
Sample Three - Venture Capital-Backed Companies (Private): Company Size Categories
Sample One - Selected SIC Industries (Public): Company Size Categories
Sample One - All Other Companies (Public): Company Size Categories
Sample Two - Internet Companies (Public): Company Size Categories

49
Table 4
MKTt/REVt Multiple Distribution Summary for Subsamples Formed On Sign of Revenue Growth in Year t
Sample One Selected SIC
Total
Obs.
10th
Perc.
50th
Perc.
90th
Perc.
10th
Perc.
50th
Perc.
90th
Perc.
10th
Perc.
50th
Perc.
90th
Perc.
1995 1484 0.5 2.3 11.2 906 61.1% 0.2 1.3 52.0 275 18.5% 0.6 3.6 55.4 303 20.4%
1998 1962 0.5 2.2 11.8 1165 59.4% 0.3 1.2 26.4 574 29.3% 0.8 5.2 80.1 223 11.4%
1999 2154 0.6 3.2 27.3 1182 54.9% 0.3 1.8 47.1 564 26.2% 1.7 31.6 365.8 408 18.9%
2000 2313 0.4 2.8 26.4 1313 56.8% 0.2 1.5 45.3 582 25.2% 1.0 9.8 132.0 418 18.1%
2001 2168 0.5 2.8 22.3 1067 49.2% 0.2 1.4 24.1 950 43.8% 0.7 6.7 145.7 151 7.0%
2004 1726 0.7 2.5 16.0 1146 66.4% 0.4 2.6 114.5 468 27.1% 1.2 11.7 1,277.2 112 6.5%
Sample One
All Other
1995 6524 0.2 1.0 3.8 4453 68.3% 0.1 0.8 7.3 1193 18.3% 0.2 1.4 14.7 878 13.5%
1998 6767 0.2 1.1 4.0 4395 64.9% 0.1 0.8 5.6 1801 26.6% 0.3 1.8 12.3 571 8.4%
1999 6710 0.2 0.9 4.0 4198 62.6% 0.1 0.8 6.7 1865 27.8% 0.4 2.3 104.1 647 9.6%
2000 6451 0.1 0.9 4.2 4526 70.2% 0.0 0.5 10.5 1461 22.6% 0.4 2.6 83.9 464 7.2%
2001 6075 0.2 1.1 4.8 3394 55.9% 0.1 0.6 4.5 2322 38.2% 0.3 2.0 132.3 359 5.9%
2004 4966 0.3 1.5 5.7 3642 73.3% 0.2 1.5 12.0 1067 21.5% 0.7 4.3 330.3 257 5.2%
Sample Two
Internet
1995 17 0.4 1.4 8.7 10 58.8% 0.0% 1.0 23.5 2,101.6 7 41.2%
1998 69 1.6 6.1 28.0 33 47.8% 0.1 4.3 10.5 9 13.0% 4.3 24.4 91.7 27 39.1%
1999 275 2.1 11.9 113.6 50 18.2% 0.6 2.0 37.2 11 4.0% 6.8 44.5 282.3 214 77.8%
2000 379 0.3 2.4 20.6 207 54.6% 0.1 1.3 60.9 15 4.0% 0.9 6.9 67.1 157 41.4%
2001 319 0.4 2.4 10.4 175 54.9% 0.2 1.5 4.9 124 38.9% 0.6 3.6 12.7 20 6.3%
2004 202 0.8 3.0 11.0 139 68.8% 0.5 2.3 23.4 59 29.2% 1.0 1.9 30.5 4 2.0%
Sample Three
V.C. Private Backed
1995 262 0.7 3.8 17.7 186 71.0% 0.8 13.0 190.0 22 8.4% 1.2 26.4 203.3 54 20.6%
1998 274 1.7 10.0 60.0 147 53.6% 2.1 14.5 211.1 15 5.5% 4.8 27.6 300.0 112 40.9%
1999 361 2.6 16.5 83.2 238 65.9% 3.5 16.3 600.0 25 6.9% 2.1 34.3 648.5 98 27.1%
2000 254 3.5 24.2 160.8 150 59.1% 4.9 81.5 739.0 17 6.7% 3.8 56.2 1,971.1 87 34.3%
2001 107 1.5 5.3 45.3 51 47.7% 1.1 19.1 1,649.7 9 8.4% 1.4 10.0 397.5 47 43.9%
2004 88 1.0 6.9 24.8 57 64.8% 11.2 400.0 5,068.8 5 5.7% 0.8 4.0 538.2 26 29.5%
Positive Revenue Growth Subsample Negative Revenue Growth Subsample Missing Revenue Growth Subsample
Nob's
% of
Total
Sample
MKT/Rev Multiple
Nob's Nob's
% of
Total
Sample
% of
Total
Sample
MKT/Rev Multiple MKT/Rev Multiple

50
Table 5
Transition Matrix for Revenue Growth Decile in Year t and Year t+1 for Sample One
Selected SIC Industries and All Other Companies: 1980 – 2004
(Portfolio 1 is lowest revenue growth…Portfolio 10 is highest revenue growth)
Panel A - Selected SIC Industries
Panel B - All Other Companies
Panel C – Sample Two (Internet Companies)
Panel D – Sample Three (Venture-backed Companies)
port1 port2 port3 port4 port5 port6 port7 port8 port9 port10 Total
port 1 27.42% 14.07% 8.35% 5.52% 5.39% 4.64% 4.87% 5.69% 6.11% 17.95% 100.00%
port 2 13.68% 19.40% 15.91% 10.16% 7.96% 7.96% 7.73% 6.74% 5.56% 4.93% 100.00%
port 3 8.31% 12.68% 17.02% 16.73% 12.36% 10.25% 7.76% 7.03% 4.63% 3.22% 100.00%
port 4 5.29% 8.05% 13.02% 21.96% 19.07% 12.16% 8.28% 5.62% 4.08% 2.47% 100.00%
port 5 4.70% 7.36% 9.73% 13.71% 19.99% 16.80% 12.26% 7.50% 5.33% 2.63% 100.00%
port 6 4.63% 7.66% 9.92% 9.99% 12.45% 17.75% 17.19% 10.45% 6.87% 3.09% 100.00%
port 7 5.75% 7.76% 7.96% 8.05% 9.14% 12.85% 16.40% 16.40% 10.68% 5.00% 100.00%
port 8 6.87% 7.92% 7.56% 6.61% 6.18% 8.54% 12.42% 18.63% 18.17% 7.10% 100.00%
port 9 8.97% 7.33% 6.18% 4.31% 4.93% 6.31% 8.45% 14.00% 23.77% 15.75% 100.00%
port 10 14.37% 7.76% 4.37% 2.96% 2.53% 2.76% 4.64% 7.96% 14.79% 37.87% 100.00%
Total 100.00% 100.00% 100.00% 100.00% 100.00% 100.00% 100.00% 100.00% 100.00% 100.00%
Missing 8.64% 4.10% 3.40% 3.31% 3.76% 5.39% 7.37% 11.04% 17.04% 35.95% 100.00%
Rev G
row
th i
n Y
ear
t
Revenue Growth in Year t+1
port1 port2 port3 port4 port5 port6 port7 port8 port9 port10 Total
port 1 29.60% 13.37% 7.84% 5.26% 5.00% 4.60% 4.92% 5.70% 7.60% 16.10% 100.00%
port 2 14.55% 19.06% 14.94% 10.78% 8.48% 7.28% 6.80% 6.37% 6.01% 5.72% 100.00%
port 3 7.96% 13.95% 17.38% 16.26% 12.12% 9.92% 7.96% 6.01% 4.95% 3.49% 100.00%
port 4 5.82% 10.23% 13.91% 17.52% 16.12% 12.26% 9.37% 6.64% 4.91% 3.22% 100.00%
port 5 4.76% 8.37% 11.58% 15.02% 16.20% 14.93% 11.57% 8.37% 5.97% 3.21% 100.00%
port 6 4.68% 7.55% 9.62% 10.52% 13.97% 16.19% 15.19% 10.96% 7.23% 4.09% 100.00%
port 7 4.78% 6.96% 8.24% 8.71% 10.85% 13.58% 15.77% 15.44% 10.41% 5.26% 100.00%
port 8 5.47% 7.05% 6.38% 6.86% 7.96% 10.27% 13.96% 18.02% 16.02% 8.03% 100.00%
port 9 8.39% 7.31% 5.64% 5.60% 5.84% 6.92% 9.17% 14.39% 20.77% 15.97% 100.00%
port 10 13.99% 6.14% 4.46% 3.46% 3.47% 4.05% 5.29% 8.09% 16.13% 34.93% 100.00%
Total 100.00% 100.00% 100.00% 100.00% 100.00% 100.00% 100.00% 100.00% 100.00% 100.00%
Missing 8.36% 5.35% 6.02% 5.45% 5.55% 6.28% 7.58% 10.08% 14.23% 31.09% 100.00%
Rev G
row
th i
n Y
ear
t
Revenue Growth in Year t+1
port1 port2 port3 port4 port5 port6 port7 port8 port9 port10 Total
port 1 26.67% 20.00% 13.94% 7.27% 9.09% 6.06% 4.24% 2.42% 4.24% 6.06% 100.00%
port 2 11.45% 19.88% 21.69% 15.06% 15.06% 9.64% 4.22% 1.20% 1.20% 0.60% 100.00%
port 3 4.82% 10.84% 20.48% 28.31% 18.07% 11.45% 3.01% 1.20% 1.20% 0.60% 100.00%
port 4 6.06% 7.27% 10.91% 18.79% 18.18% 16.36% 13.94% 3.64% 1.82% 3.03% 100.00%
port 5 7.83% 6.63% 6.02% 9.04% 16.27% 17.47% 19.88% 7.83% 6.02% 3.01% 100.00%
port 6 7.23% 10.24% 6.02% 7.83% 8.43% 13.25% 21.69% 12.65% 7.23% 5.42% 100.00%
port 7 13.33% 9.70% 8.48% 4.85% 4.85% 6.67% 10.91% 19.39% 16.97% 4.85% 100.00%
port 8 9.64% 6.02% 6.02% 3.01% 4.22% 6.02% 12.65% 25.30% 16.87% 10.24% 100.00%
port 9 7.23% 7.23% 4.82% 4.22% 3.01% 7.23% 5.42% 15.66% 21.08% 24.10% 100.00%
port 10 5.45% 2.42% 1.82% 1.21% 3.03% 6.06% 3.64% 10.91% 23.64% 41.82% 100.00%
Total 100.00% 100.00% 100.00% 100.00% 100.00% 100.00% 100.00% 100.00% 100.00% 100.00%
Missing 2.59% 1.20% 0.80% 2.20% 5.59% 7.19% 11.98% 12.38% 16.77% 39.32% 100.00%
Rev G
row
th i
n Y
ear
t
Revenue Growth in Year t+1
port1 port2 port3 port4 port5 port6 port7 port8 port9 port10 Total
port 1 21.25% 12.89% 9.76% 5.92% 6.62% 6.62% 6.62% 9.06% 7.32% 13.94% 100.00%
port 2 13.89% 24.65% 20.49% 12.85% 7.99% 4.86% 5.21% 3.82% 2.78% 3.47% 100.00%
port 3 10.76% 14.24% 21.53% 16.67% 12.85% 6.60% 5.56% 4.51% 3.13% 4.17% 100.00%
port 4 10.42% 15.97% 13.19% 19.44% 17.01% 10.42% 6.25% 2.78% 3.47% 1.04% 100.00%
port 5 8.68% 6.94% 12.50% 12.15% 16.32% 12.85% 12.85% 7.29% 6.25% 4.17% 100.00%
port 6 9.38% 9.72% 5.56% 12.15% 12.85% 16.32% 14.58% 10.07% 5.90% 3.47% 100.00%
port 7 7.99% 5.90% 6.94% 7.29% 11.46% 17.01% 12.50% 14.58% 10.42% 5.90% 100.00%
port 8 6.55% 4.14% 2.41% 4.48% 6.90% 14.48% 15.17% 20.69% 13.45% 11.72% 100.00%
port 9 5.59% 4.55% 4.90% 6.29% 4.55% 6.29% 16.43% 16.78% 19.23% 15.38% 100.00%
port 10 5.23% 1.05% 2.79% 2.79% 3.48% 4.53% 4.88% 10.45% 28.22% 36.59% 100.00%
Total 100.00% 100.00% 100.00% 100.00% 100.00% 100.00% 100.00% 100.00% 100.00% 100.00%
Missing 10.51% 7.10% 5.97% 5.38% 6.22% 6.96% 6.86% 7.20% 12.78% 31.03% 100.00%
Rev G
row
th i
n Y
ear
t
Revenue Growth in Year t+1

51
Table 6
Correlation For 10 Portfolios Ranked on MKTt/REVt Between (A) Median MKT/REV and
Median Annual Revenue Growth, and (B) Annual Revenue Growth Across Time Periods
Panel A: Correlation Between Median MKT/REV and
Median Annual Revenue Growth for 10 Portfolios Sample One Sample Two Sample Three
Selected SIC
Industries
All Other
Companies
Internet
Companies
VC Backed
Companies
Positive Revenue Growth Portfolios
MKTt/REVt & REV Growtht/t-1
Pearson 0.97 0.99 0.95 0.83
Spearman 1.00 0.98 0.60 0.92
MKTt/REVt & REV Growtht+1/t
Pearson 0.93 0.97 0.98 1.00
Spearman 1.00 1.00 0.96 1.00
MKTt/REVt & REV Growtht+2/t+1
Pearson 0.86 0.92 -0.04 0.99
Spearman 1.00 1.00 0.17 0.98
Negative Revenue Growth Portfolios
MKTt/REVt & REV Growtht/t-1
Pearson -0.98 -0.99 -0.93 -0.92
Spearman -0.80 -0.51 0.01 -0.83
MKTt/REVt & REV Growtht+1/t
Pearson 0.97 0.89 0.87 0.79
Spearman 1.00 0.99 0.78 0.90
MKTt/REVt & REV Growtht+2/t+1
Pearson 0.91 0.72 0.59 0.70
Spearman 0.99 0.96 0.45 0.89
Panel B: Correlation Between Median Annual Revenue
Growth of Portfolios Across Time Periods Sample One Sample Two Sample Three
Selected SIC
Industries
All Other
Companies
Internet
Companies
VC Backed
Companies
Positive Revenue Growth Portfolios
Year t & Year t+1
Pearson 0.99 0.95 0.91 0.83
Spearman 1.00 0.99 0.71 0.92
Year t & Year t+2
Pearson 0.94 0.89 -0.03 0.86
Spearman 0.99 0.99 0.17 0.96
Year t+1 & Year t+2
Pearson 0.98 0.98 0.06 0.99
Spearman 1.00 1.00 0.31 0.98
Negative Revenue Growth Portfolios
Year t & Year t+1
Pearson -0.98 -0.82 -0.76 -0.90
Spearman -0.80 -0.46 -0.01 -0.89
Year t & Year t+2
Pearson -0.95 -0.62 -0.63 -0.84
Spearman -0.78 -0.34 -0.42 -0.74
Year t+1 & Year t+2
Pearson 0.98 0.95 0.45 0.90
Spearman 0.99 0.98 0.37 0.80

52
Table 7
Regression Analysis (Rank Regression) Using (a) MKTt/REVt As Dependent Variable, and
(b) Revenue Growth, Company Size, Profitability and Other Variables
Coef. t-stat Coef. t-stat Coef. t-stat Coef. t-stat
Regression #1
Intercept 19538 202.73 85789 431.18 1085 38.82 1108 97.45
log(REV) -0.29 -52.20 -0.31 -117.19 -0.21 -11.07 -0.83 -50.87
Adj. R-sq 8.2% 9.5% 7.1% 68.1%
Regression #2
Intercept 10508 104.04 52538 246.43 400 21.31 385 16.88
Current Rev Growth 0.26 36.82 0.17 49.25 0.39 19.00 0.32 6.14
Adj. R-sq 5.2% 2.2% 20.8% 4.7%
Regression #3
Intercept 14875 114.63 72816 261.31 724 23.68 1022 43.18
log(REV) -0.26 -45.07 -0.27 -97.74 -0.19 -11.28 -0.78 -33.90
Current Rev Growth 0.29 43.09 0.17 55.05 0.39 20.23 0.15 4.64
Adj. R-sq 12.0% 9.6% 25.8% 62.1%
Regression #3b
Intercept 14750 118.47 69869 266.45 624 20.32 946 47.00
log(REV) -0.27 -51.38 -0.29 -115.26 -0.13 -8.22 -0.73 -40.11
Future Rev Growth 0.30 56.80 0.23 89.75 0.39 24.01 0.18 9.61
Adj. R-sq 17.1% 14.7% 31.7% 70.4%
Regression #4
Intercept 7876 66.89 43583 175.96 261 14.059 232 9.63
Current Rev Growth 0.19 27.37 0.10 29.15 0.22 10.88 0.11 2.19
Future Rev Growth 0.25 40.18 0.21 67.32 0.32 17.89 0.45 12.46
Adj. R-sq 11.1% 6.0% 35.7% 20.9%
Regression #5
Intercept 11394 81.6 61103 203.69 445 15.282 936 32.40
log(REV) -0.25 -43.27 -0.27 -95.92 -0.13 -8.07 -0.73 -29.62
Current Rev Growth 0.22 32.68 0.11 33.68 0.24 11.76 0.10 3.02
Future Rev Growth 0.24 39.89 0.20 66.61 0.29 16.35 0.13 5.07
Adj. R-sq 17.3% 13.3% 38.6% 63.3%
Regression #6
Intercept -7539 -19.27 -51279 -97.28 1066 108.94
INC/REV 0.57 47.94 0.84 245.32 -0.33 0.08
NEG INC/REV 0.90 69.37 0.90 199.91 -0.14 0.08
Adj. R-sq 15.7% 30.2% 4.3%
Regression #7
Intercept -7793 -25.15 -24675 -46.36 138 1.31 982.82 41.76
log(REV) -0.21 -36.27 -0.22 -90.81 -0.17 -4.35 -0.7715 -33.9815
Current Rev Growth 0.15 29.38 0.04 19.19 0.02 0.84 0.13462 4.34423
Future Rev Growth 0.25 49.61 0.18 79.31 0.45 19.44 2.79494 2.51403
INC/REV 0.65 56.61 0.76 233.64 0.20 2.01
NEG INC/REV 0.90 73.12 0.75 163.21 0.30 3.43
Leverage -0.16 -29.39 -0.10 -45.38 -0.14 -5.89
1998-2000 Dummy 1993 19.54 4131 17.87 190 10.48 181.214 10.379
Adj. R-sq 36.9% 43.6% 40.1% 67.2%
Sample One Sample Two Sample Three
Selected SIC All Other Internet VC-backed

53
Table 8
Sample One Regression Analysis (Rank Regression) Using MKTt/REVt as Dependent Variables
For Three Subsamples Based on Sign of Current Revenue Growth
(Panel A: Positive; Panel B: Negative; Panel C: Missing Observations)
Coef. t-stat Coef. t-stat Intercept -5830.62 -29.74 -20794.45 -54.55 log(REV) -0.06 -8.43 -0.13 -46.55 Current Rev Growth 0.22 33.17 0.10 34.98 Future Rev Growth 0.18 27.40 0.14 49.79 INC/REV 0.66 58.83 0.77 225.51 NEG INC/REV 0.89 65.96 0.76 135.24 Leverage -0.15 -22.73 -0.08 -29.73 1998-2000 Period 1075.88 14.10 1937.86 11.55
R-sq 41.68% 49.37% nobs 15,131 73,574
Coef. t-stat Coef. t-stat Intercept 1198.46 5.32 -1170.76 -3.65 log(REV) -0.28 -17.90 -0.30 -54.19 Current Rev Growth -0.09 -6.82 -0.11 -19.60 Future Rev Growth 0.20 18.35 0.16 33.26 INC/REV 0.34 8.58 0.80 81.67 NEG INC/REV 0.56 15.22 0.64 56.65 Leverage -0.13 -11.23 -0.12 -22.85 1998-2000 Period 252.60 4.53 695.91 5.52
R-sq 26.62% 32.89% nobs 6,353 27,929
Coef. t-stat Coef. t-stat Intercept -7.75 -0.07 -1007.32 -5.39 log(REV) -0.26 -20.02 -0.36 -55.49 Current Rev Growth Future Rev Growth 0.25 23.62 0.24 42.57 INC/REV 0.39 15.26 0.57 66.29 NEG INC/REV 0.79 28.56 0.78 64.24 Leverage -0.20 -18.66 -0.11 -19.51 1998-2000 Period 277.61 8.08 1145.19 12.80
R-sq 56.56% 53.69% nobs 4064 15681
Missing Current Revenue Growth Selected SIC All Other
Selected SIC All Other
Positive Current Revenue Growth Selected SIC All Other
Negative Current Revenue Growth

54
REFERENCES
Allee, K.D., & Yohn, T.L. 2009, ‗The Demand for Financial Statements in an Unregulated
Environment: An Examination of the Production and Use of Financial Statements by Privately Held
Small Businesses‘, The Accounting Review, vol. 84, no. 1, pp. 1-25.
Altman, E.I. 2000, ‗Predicting Financial Distress of Companies Revisiting the Z-Score and Zeta®
Models‘, Working Paper, New York University.
Armstrong, C., Davila, A., & Foster, G. 2006, ‗Venture-Backed Private Equity Valuation and
Financial Statement Information‘, Review of Accounting Studies, vol. 17, pp. 119-154.
Armstrong, C., Davila, A., Foster, G., & Hand, J.R.M. 2006, ‗Biases in Multi-Year Management
Financial Forecasts: Evidence from Private Venture-Backed U.S. Companies,‘ Review of Accounting
Studies, vol. 12, no. 2-3, pp. 183-215.
Ball, R. & Foster, G. 1982, ‗Corporate Financial Reporting: a Methodological Review of Empirical
Research‘, Journal of Accounting Research, vol. 20, pp. 161-234.
Ball, R. & Watts, R. 1972, ‗Some Time Series Properties of Accounting Income.‘ The Journal of
Finance, vol. 27, no. 3, pp. 663-681.
Bartov, E., Mohanram, P. & Seethamraju, C. 2002, ‗Valuation of Internet stocks—An IPO
perspective‘, Journal of Accounting Research, vol. 40, no. 2, pp. 321-346.
Bauman, C.C., Bauman, M.P. & Das, S. 2010, ‗Valuation Consequences of Regulatory Changes in
Revenue Recognition: Evidence from Advertising Barter Sales‘, Advances in Accounting, vol. 26, no.
2, pp. 177-184.
Beaver, W.H. 1989, Financial Reporting: An Accounting Revolution, Prentice-Hall, Englewood
Cliffs, N.J., 2nd
edition.
Beaver, W.H. & Morse, D. 1978, ‗What Determines Price-Earnings Ratios?‘ Financial Analysts
Journal, vol. 34, no. 4, pp. 65-79.
Berger, P.G. 2003, ‗Discussion of Differential Market Reactions to Revenue and Expense Surprises,‘
Review of Accounting Studies, vol. 8, pp. 213-220.
Black, F. & Scholes, M. 1973, ‗The Pricing of Options and Corporate Liabilities‘, Journal of Political
Economy, vol. 81, no. 3, pp. 637-654.
Bowen, R.M., Davis, A.K., & Rajgopal, S. 2002, ‗Determinants of Revenue Reporting Practices for
Internet Firms‘, Contemporary Accounting Research, vol. 19, pp. 523-562.
Callen, J.L., Robb, S.W.G., & Segal, D. 2004, ‗Revenue Manipulation and Restatements by Loss
Firms‘, Working Paper, University of Toronto.
Cassar, G. 2009, ‗Financial Statement and Projection Preparation in Start-Up Ventures‘, The
Accounting Review, vol. 84, no. 1, pp. 27-51.

55
Collins, D.M.; M. Pincus; and H. Xie. ‗Equity Valuation and Negative Earnings: The Role of Book
Value of Equity.‘ The Accounting Review 74 (1999): 29-62.
Core, J.E.; W.R. Guay; and A.Van Buskirk. ‗Market Valuations in the New Economy,‘ Journal of
Accounting & Economics 34 (2003): 43-67.
Davila, A. 2005, ‗An Exploratory Study on the Emergence of Management Control Systems:
Formalizing Human Resources in Small Growing Firms‘, Accounting, Organizations and Society,
vol. 30, no. 3, pp. 223-248.
Davila, A., & Foster, G. 2005, ‗Management Accounting Systems Adoption Decisions: Evidence and
Performance Implications from Startup Companies‘, The Accounting Review, vol. 80, pp. 1039-1068.
Davila, A. & Foster, G. 2007, ‗Management Control Systems in Early-Stage Startup Companies‘, The
Accounting Review, vol. 82, no. 4, pp. 907-937.
Davila, A., Foster, G., & Gupta, M. 2003, ‗Venture Capital Financing and the Growth of Startup
Companies‘, Journal of Business Venturing, vol. 18, pp. 689-708.
Davila, A., Foster, G., & Jia, N. 2010, ‗Building Sustainable High Growth Startup Companies:
Management Systems As An Accelerator‘, California Management Review, vol. 52, no. 3, pp. 79-
105.
Davila, A., Foster, G., & Li, M. 2009, ‗Reasons for Management Control System Adoption: Insights
from Product Development Choice by Early Stage Entrepreneurial Companies‘, Accounting
Organizations and Society, vol. 34, nos. 3-4, pp. 322-247.
Davis, A. 2002, ‗The value relevance of revenue for Internet firms: Does reporting grossed-up or
barter revenue make a difference‘, Journal of Accounting Research, vol. 40, no. 2, pp. 445-484.
Demers, E. & Lev, B. 2000, ‗A Rude Awakening: Internet Shakeout in 2000‘, Review of Accounting
Studies, vol. 6, pp. 331-359.
Demers, E. & Lewellen, K. 2003, ‗The marketing role of IPOs: Evidence from Internet stocks‘,
Journal of Financial Economics, vol. 68, pp. 413-437.
Ertimur, Y., Livnat, J., & Martikainen, M. 2003, ‗Differential Market Responses to Revenue and
Expense Surprises‘, Review of Accounting Studies, vol. 8, pp. 185-211.
Ertimur, Y., Mayew, W.J., & Stubben, S.R. 2011, ‗Analyst Reputation and the Issuance of
Disaggregated Earnings Forecasts to I/B/E/S‘, Review of Accounting Studies, forthcoming.
Fama, E.F., & Miller, M.H. 1972, The Theory of Finance, Holt, Rinehart and Winston, Inc., New
York.
Fama, E. F., & French, K.R. 2004, ‗New Lists: Fundamentals and Survival Rates‘, Journal of
Financial Economics, vol. 73, pp. 229-269.
Foster, G. 1986, Financial Statement Analysis, Prentice-Hall, 2nd
edition, Englewood Cliffs, N.J.

56
Foster, G., Davila, A. Haemmig, M., He, X., Jia, N., von Bismarck, M., & Wellman, K. 2011, Global
Entrepreneurship and the Successful Growth Strategies of Early-Stage Companies, World Economic
Forum USA Inc.
Ghosh, A., Gu, Z., & Jain, P. 2005, ‗Sustained Revenue and Earnings Growth, Earning Quality, and
Earnings Response Coefficients‘, Review of Accounting Studies, vol. 10, pp. 33-57.
Hand, J.R.M. 2001, ‗The Role of Book Income, Web Traffic, and Supply and Demand in the Pricing
of U.S. Internet Stocks‘, European Finance Review, vol. 5, pp. 295-317.
Hand, J.R.M. 2003, ‗Profits, Losses and the Nonlinear Pricing of Internet Stocks‘, Intangible Assets:
Values, Measures and Risks, eds. J.R.M. Hand and B. Lev, Oxford University Press, New York.
Hand, J.R.M. 2005, ‗The Value Relevance of Financial Statements in the Venture Capital Market‘,
The Accounting Review, vol. 80, pp. 613-648.
Hand, J.R.M. 2011, ‗What drives the top line? Determinants of Sales Revenue in Private Venture-
Backed Firms‘, Entrepreneurial Finance Handbook, ed. D. Cumming, Oxford University Press, New
York.
Hayn, C. 1995, ‗The Information Content of Losses‘, Journal of Accounting and Economics, vol. 20,
pp. 125-153.
Joos, P. & Plesko, G.A. 2005, ‗Valuing Loss Firms‘, The Accounting Review, vol. 80, pp. 847-870.
Keating, E.K., Lys, T.Z., & Magee, R.P. 2003, ‗Internet Downturn: Finding Valuation Factors in
Spring 2000‘, Journal of Accounting & Economics, vol. 34, pp. 189-236.
Keung, E.C. 2010, ‗Do Supplementary Sales Forecasts Increase the Credibility of Financial Analysts‘
earnings forecasts‘, The Accounting Review, vol. 86, no. 6, pp. 2047-2074.
Liu, J., Nissim, D. & Thomas, J. 2002, ‗Equity Valuation Using Multiples‘, Journal of Accounting
Research, vol. 40, no. 1, pp. 135-172.
Ljungqvist, A., & Wilhelm, W.J.2003, ‗IPO Pricing in the Dot-Com Bubble‘, Journal of Finance,
vol. 58, no. 2, pp. 723-752.
Loughran, T. & Ritter, J. 2004, ‗Why Has IPO Underpricing Changed Over Time?‘ Financial
Management, vol. 33, no. 3, pp. 5-37.
Miller, M.H. & Modigliani, F. 1961, ‗Dividend Policy, Growth and the Valuation of Shares‖, Journal
of Business, vol. 34, no. 4, pp. 411-433.
Ofek, E. & Richardson, M. 2002, ‗The Valuation and Market Rationality of Internet Stock Prices‘,
Oxford Review of Economic Policy, vol. 18, pp. 265-287.
Ofek, E. & Richardson, M. 2003, ‗DotCom Mania: The Rise and Fall of Internet Stock Prices‘,
Journal of Finance, vol. 58, no. 3, pp. 1113-1138.
O‘Hara, S. & Lowry, V. 2009, ‗Paying Attention to Sales: How Market-Cap-To-Revenue Makes a
Difference‘, MarketWatch.

57
Palepu, K.G. & Healy, P.M. 2007, Business Analysis and Valuation Using Financial Statements, Text
and Cases, South-Western, Ohio.
Penman, S. 2009, Financial Statement Analysis and Security Valuation, McGraw-Hill/Irwin, 4th
edition, New York.
Rajgopal, S., Venkatachalam, M., & Kotha, S. 2002, ‗Managerial actions, stock returns, and earnings:
The case of business-to-business Internet firms‘, Journal of Accounting Research, vol. 40, no. 2, pp.
529-556.
Sandino, T. 2007, ‗Introducing the First Management Control Systems: Evidence from the Retail
Sector‘, The Accounting Review, vol. 82, no. 1, pp. 265-293.
Schultz, P., & Zaman, M. 2001, ‗Do the Individuals Closest to Internet Firms Believe They Are
Overvalued?‘ Journal of Financial Economics, vol. 59, pp. 347-381.
Stubben, S.R. 2010, ‗Discretionary Revenues as a Measurement of Earnings Mangement‘, The
Acounting Review, vol. 85, no. 2, pp. 695-717.
Trueman, B., Wong, M.H.F., & Zhang, X-J. 2000, ‗The eyeballs have it: Searching for the value in
Internet stocks‘, Journal of Accounting Research, vol. 38, pp. 137-162.
Trueman, B., Wong, M.H.F., & Zhang, X.J. 2001, ‗Back to basics: Forecasting the revenues of
Internet firms‘, Review of Accounting Studies, vol. 6, pp. 305-329.
Trueman, B., Wong, M.H.F., & Zhang, X.J. 2003, ‗Anomalous stock returns around Internet firms‘
earnings announcements‘, Journal of Accounting & Economics, vol. 34, pp. 249-271.