Market Structure, Industrial Concentration, and … · Market Structure, Industrial Concentration,...
16
Market Structure, Industrial Concentration, and Price Transmission Ian Sheldon (Ohio State University) Presentation for workshop on “Market Integration and Vertical and Spatial Price Transmission”, University of Kentucky, Lexington, KY April 21, 2006
Transcript of Market Structure, Industrial Concentration, and … · Market Structure, Industrial Concentration,...

Market Structure, Industrial Concentration,
and Price Transmission
Ian Sheldon (Ohio State University)
Presentation for workshop on “Market Integration and Vertical and
Spatial Price Transmission”, University of Kentucky, Lexington, KY
April 21, 2006

Introduction
Doha Round of WTO is a “development round”, focus on increasing LDC access to DC markets
Little attention paid to food marketing system in DCs in analyzing commodity exports of LDCs:
Vertical/horizontal structure
Increasing consolidation
Who captures the benefits of trade reform when downstream markets are imperfectly competitive?

Structure of Food Marketing in
Developed Countries
Food manufacturing concentrated in US and EU, e.g., average 3-firm concentration of 67% in EU
Food retailing concentrated at national level in EU, and at regional and local level in US
Increasing consolidation via mergers and acquisitions
Structure of successive oligopoly/oligopsony

Market Structure Might Matter
Declines in LDC commodity prices not necessarily passed through in lower consumer prices (Oxfam, 2001)
LDCs do not necessarily gain full benefits of trade reform, e.g., Mozambique cashew nuts (McMillan, et al., 2002)
Typical CGE analysis of Doha Round ignores downstream marketing system (Anderson and Martin, 2005; 2006)

Trade Liberalization and Industry
Consolidation in a Vertically-Related Market
If markets were competitive, ignoring vertical
market structure would not matter
Only recently have models examining optimal
trade policy included imperfect competition (Ishikawa
and Spencer, 1999; Sheldon et al., 2001)
With imperfect competition, incidence of benefits of
trade liberalization is important (Figure 1)
Increasing consolidation in food marketing also
affects share of value added received by LDC
exporters

QMT
S
ST
D
PMR
PMMR
PWT
PMT
PUT
PDT
QM
PW=PM
PU
PD
Figure 1: Trade Liberalization and the Vertical Marketing Chain
P
Q

Inverse commodity export supply function:
ap = υ(X) (1)
Downstream:
d d u
i ic = k + p x (2)
dp =φ(X) (3)
di i
i i
(X - x ) X - x= α
x x
(4)
d d dd ui
d
(α + (1 -α )sp 1- = p
η, d0 α 1 (5)
Vertical Markets Model
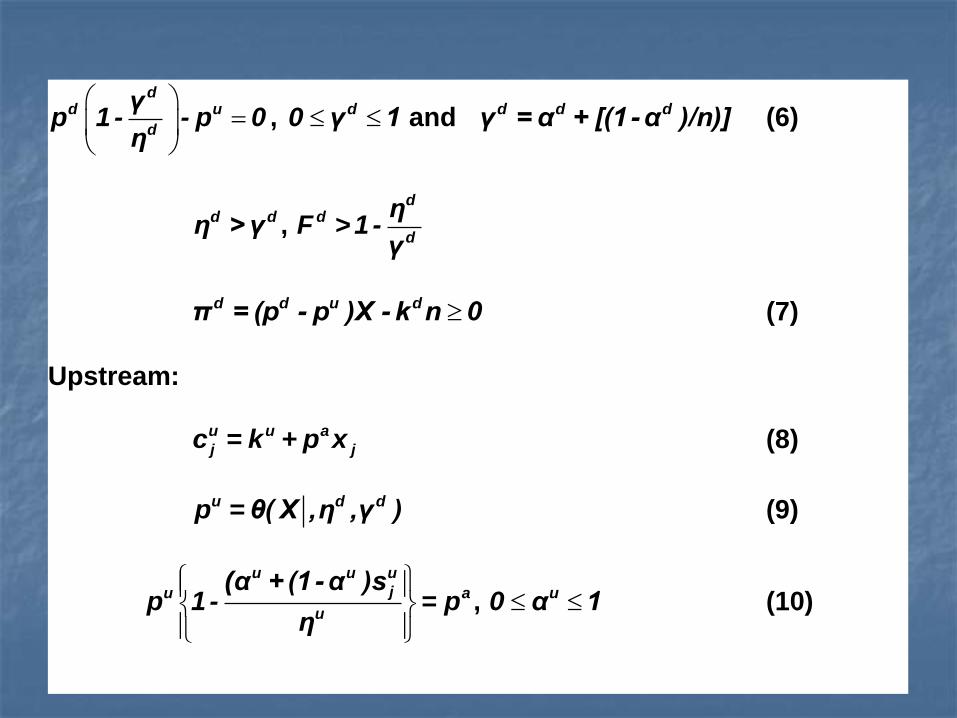
dd u
d
γp 1- - p 0
η, d0 γ 1 and d d dγ = α + [(1-α )/n)] (6)
d dη >γ , d
d
d
ηF > 1-
γ
d d u dπ = (p - p )X - k n 0 (7)
Upstream:
u u a
j jc = k + p x (8)
u d dp = θ( X ,η ,γ ) (9)
u u u
ju a
u
(α + (1 -α )sp 1- = p
η, u0 α 1 (10)

uu a
u
γp 1- - p = 0
η, u0 γ 1 and u u uγ = α + [(1-α )/m)] (11)
u uη >γ , u
u
u
ηF > 1-
γ
u u a uπ = (p - p )X - k m 0 (12)
Assume (ku=0, uγ =1) and d0 γ 1, i.e, u ap / p = 1 :
d
u d d
d d
>p 1
= =1p γ F
1 - + <η η
as d
<
F =1
>
. (13)

For linear downstream demand:
d
u d
p 1= 1
p 1+γ (14)
Profit effects:
d u
d
d dd d
d d du up p
d d
1 F-Xγ 1 - +
η ηπ p= g + g = < 0
γ F γp p1- +
η η
(15)
iff d dF >1-η , where for linear downstream demand:
d d
u d
π -2γ X= < 0
p 1+γ
(16)
Numerical Simulation (Sexton et al., 2003; 2006)
Key market power parameters are γu, γd, λu, and λd – as
these lie in range 0 to 1, simulate over entire unit interval
Consider equal departures from competition, e.g., in case of
successive oligopsony and downstream oligopoly, λu = λd = γd
Farm share of revenue under no tariff competitive
equilibrium set at f = 0.5 – when f is small, diminishes impact of
oligopsony
Per-unit tariff at competitive equilibrium set at T=0.2
Price elasticity of farm supply and downstream demand
evaluated at no-tariff competitive equilibrium, εa = ηd = 1

Figure 2: Change in Export Price from Trade LiberalizationFigure 7: Change in Farm Price from Trade Liberalization
0.00
0.02
0.04
0.06
0 0.2 0.4 0.6 0.8 1
Market Power Index
Farm
Pri
ce C
han
ge
Oligopsony Oligopoly
Oligopsony & Oligopoly Successive Oligopsony w ith Oligopoly
Successive Oligopoly w ith Oligopsony

Figure 3: Change in Producer Surplus from Trade LiberalizationFigure 8: Change in Producer Surplus from Trade
Liberalization
0.00
0.02
0.04
0.06
0 0.2 0.4 0.6 0.8 1
Market Power Index
Pro
du
cer
Su
rplu
s C
han
ge
Oligopsony Oligopoly
Oligopsony & Oligopoly Successive Oligopsony w ith Oligopoly
Successive Oligopoly w ith Oligopsony

Figure 4: Change in Producer Surplus, Consumer Surplus
and Marketers’ Profits from Trade Liberalization for the Case
of Processor Oligopsony and Retail Oligopoly
Figure 9: Change in Producer Surplus, Consumer Surplus
and Marketers' Profits from Trade Liberalization for the
Case of Processor Oligopsony and Retail Oligopoly
0.00
0.02
0.04
0.06
0.08
0.10
0.12
0 0.2 0.4 0.6 0.8 1
Market Power Index
Pro
du
er S
urp
lus, C
on
su
mer S
urp
lus,
Marketers' P
ro
fit
s
Producer surplus Consumer surplus Marketers' profits
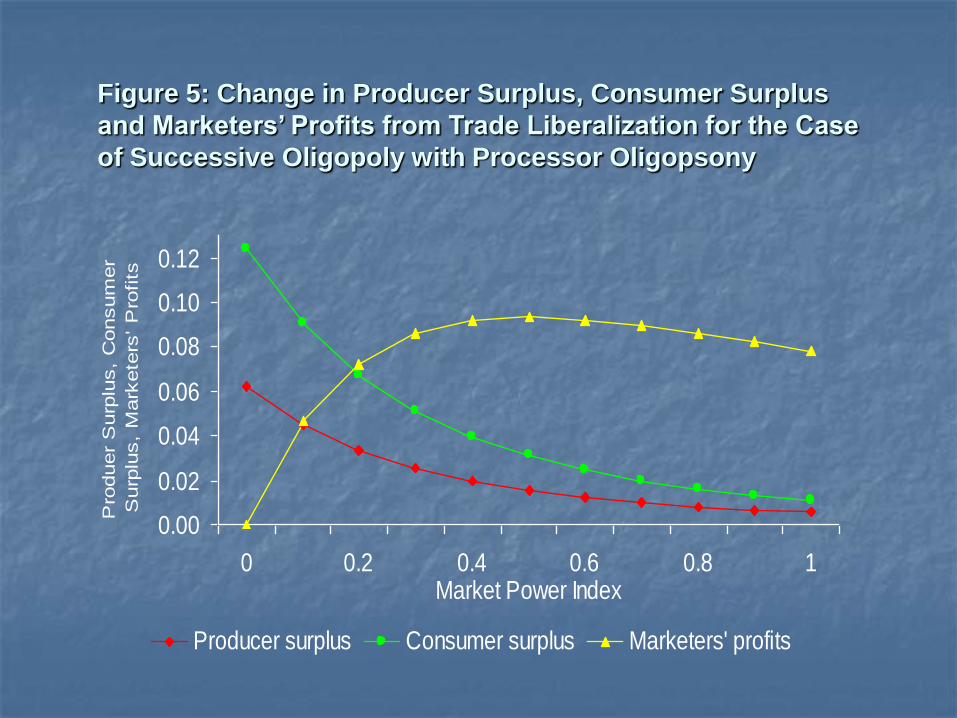
Figure 10: Change in Producer Surplus, Consumer Surplus and
Marketers' Profits from Trade Liberalization for the case of
Successive Oligopoly with Processor Oligopsony
0.00
0.02
0.04
0.06
0.08
0.10
0.12
0 0.2 0.4 0.6 0.8 1Market Power Index
Pro
duer
Surp
lus,
Consum
er
Surp
lus,
Mark
ete
rs' P
rofits
Producer surplus Consumer surplus Marketers' profits
Figure 5: Change in Producer Surplus, Consumer Surplus
and Marketers’ Profits from Trade Liberalization for the Case
of Successive Oligopoly with Processor Oligopsony

Summary and Conclusions
Structure of food marketing system in DCs
may matter for who gains from trade
liberalization
Results sensitive to assumptions about
downstream technology and convexity of
commodity supply function
It is one thing to show imperfect competition
can affect pass-through, another to infer
imperfect competition from econometric
analysis of price transmission