MARKET STRUCTURE AND STRATEGIES IN DIRECT MARKETING …
20
RESEARCH CIRCULAR 276 r -MARCH 1983 MARKET STRUCTURE AND STRATEGIES IN DIRECT MARKETING OF FRUITS AND VEGETABLES IN THE MIDWEST J. W. ERWIN L. H. CHATFIELD J. L. ROBERTSON The Ohio State University , Ohio Agricultural Research and Development Center Wooster, Ohio
Transcript of MARKET STRUCTURE AND STRATEGIES IN DIRECT MARKETING …

RESEARCH CIRCULAR 276 r
-MARCH 1983
MARKET STRUCTURE AND STRATEGIES IN DIRECT MARKETING
OF FRUITS AND VEGETABLES IN THE MIDWEST
J. W. ERWIN
L. H. CHATFIELD
J. L. ROBERTSON
The Ohio State University , Ohio Agricultural Research and Development Center
Wooster, Ohio

CONTENTS
* * * Summary__________________________________________________ 3
Introduction------------------------------------------------ 3
Procedure __________________________________________________ 4
Results and Discussion _______________________________________ 4
Firm Age and Business Structure __________________________ 6
Production Acreage_____________________________________ 6
Labor Analysis _________________________________________ 6
Location Analysis_______________________________________ 6
Sales Analysis_· _________________________________________ 7
Seasonality _________________ -~ __________________________ 7
Product Analysis ________________________________________ l 0
Customer Analysis _______________________________________ 11
Market Channels ________________________________________ 11
Multiple Outlets _____________ ·- __________________________ 13
Promotional Activities ____________________________________ 13
Service Differentiation ________________ ·- ___________________ 13
Price __________________________________________________ 14
Market Structure ________________________________________ 14
References _________________________________________________ l6
All publications of the Ohio Agricultural Research and Development Center are available to all on a nondiscriminatory basis without regard to race, color, national origin, sex, or religious affiliation.
AGDEX 202/845 3-83-2.SM

Market Structure and Strategies in Direct Markefing of Fruits and Vegetables
in the Midwest J. W. ERWIN, L. H. CHATFIELD and J. L. ROBERTSON1
SUMMARY The Ohio, Indiana, and Michigan direct market industry was sur
veyed in 1978 using mailed questionnaires and indepth visitation surveys to study general industry characteristics, market structure, and marketing strategies. Direct marketing firms, defined as producers who retail all or part of their own fruit and/ or vegetable production, can be segmented into nine operational classifications as functions of seasonality, major crop, and production or marketing orientation. Marketing oriented firms were less seasonal, offered a broader product line, and were closer to the population than production oriented firms. Results can be used by direct marketers to help establish individual firm marketing strategies.
INTRODUCTION Direct marketing or selling of fruits and/ or vegetables by the pro
ducer directly to the consumer has expanded rapidly throughout the U. S. (7, 10, 12). In the Midwest, direct marketing has increased substantially in the past 10 years, with an estimated 1977 market value of $40 million for Ohio, Indiana, and Michigan ( 13). Changing consumer life styles, improved transportation, more leisure time, higher disposable income, and consumer awareness of price/ value relationships for food have stimulated this growth ( 1, 6, 7). ·
Producers of fruits and vegetables in Ohio, Indiana, and Michigan initially developed as suppliers to processors and retailers in the Midwest. Recent changes in production and market channels due to advances in transporting perishable products have made it possible for large midwestern processors to seek more reliable supplies from the South and West where crop quality and quantity are less variable ( 17). Some midwestern growers still produce vegetable crops for canners and retail stores, but growers in many areas have been forced to develop new market channels for their products. Direct marketing is one alternative market channel that has emerged.
Much of the direct market industry is characterized by small, family-owned and operated businesses ( 5). Perishable products, seasonal
trGraduate Research Associate, Research Assistant, and Associate Professor, respectively, Department of Horticulture.
3

markets, and diverse forms of retail outlets compound the need for technical and management expertise. Research objectives were to provide direct marketers with information about market characteristics, industry structure, and marketing strategies, and to provide guidelines for management planning by establishing industry operating characteristics.
PROCEDURE Research was conducted in Ohio, Indiana, and Michigan during
the spring and summer of 1978. Surveyed firms were producers of fruits and/ or vegetables who sell directly to the consumer through on- or off-premise farm markets or pick-your-own (PYO) operations. Ohio, Indiana, and Michigan were chosen for the study since these states have a high population of direct marketers and similar socio-economic and climatic characteristics.
Initial firm contact was made through a mail survey. Basic information, such as operation size, outlet type, sales volume, and type of commodities sold, was collected. Of 650 identified farm markets in the three-state area, 343 or 53% of the questionnaires were returned and were usable.
Response to the preliminary survey was used to select a stratified random sample of 51 firms by state to be included in an indepth visitation survey. Firms were stratified by state proportionately to firm
- population size and all firms in the sample had annual gross sales of more than $10,000. Fourteen firms each were selected from Ohio and Indiana and 23 firms were selected from Michigan. Interview questions focused on firm and market characteristics, seasonality, product handling, and marketing activities.
RESULTS AND DISCUSSION About 33% of all firms surveyed by mail reported an annual gross
income of less than $20,000, 38% reported annual gross income between $20,000 and $100,000, and the remaining 29% reported annual gross income more than $100,000. Firms in the Si-firm sample were divided into small, medium, and large categories based on gross sales, so the sample was representative of the total midwestern direct marketing industry (Table 1). Small, medium, and large firms were classified as firms having less than $100,000 in sales, $100,000 to $399,999 in sales, and $400,000 or more in sales. The average direct marketing firm had annual gross sales of $384,510 and median gross sales were $145,000.
Distribution of farm markets by gross sales was similar in all three states. Ohio had the greatest percentage of sma:ll firms or firms with sales less than $100,000, while Indiana had the greatest percentage of firms with sales from $100,000 to $399,999 (Table 1). A greater per-
4

centage of firms located in Michigan had larger sales than Ohio and Indiana firms.
Some 72 % of the· 51 sample firms were open less than 12 m.onths per year (Table 1 ) . Fewer Indiana firms were open year-round in comparison to Michigan and Ohio firms.
The major crop for 51 % of sample firms was tree fruits (Table 1). Tree fruits were the .dominant crop in Ohio and Michigan, while vegetable crops were the most frequently grown crop in Indiana. Ohio firms were the most diversified by offering the greatest variety of fruits and/ or vegetables.
TABLE 1.~Sales, Seasonality, Crop, Location, and Customer Char-acteristics for Direct Farm Marketers in Ohio, Michigan, and Indiana, 51 Firms, 1978.
Indiana Michigan Ohi·O Average
Gross Sales Percent Small (Less than $100,000) 29 31 43 33 Medium ($100,000-$399,999) 50 43 36 43
Large ($400,000 and more) 21 26 21 24
Type of Market Percent Short Season (Open less than 5 months) 21 26 21 24
Half-Season (Open 5-6 months) 36 26 29 28
Long-Season (Open 7 -11 months) 29 13 21 20
Year-Round (Open 12 months) 14 35 29 28
Major Crop Percent
Tree Fruits 31 65 43 51 Blueberries 0 5 21 9
Strawberries 15 10 7 11
Sweet Corn 39 10 0 15
Other Vegetables 15 5 29 13
Location Percent
County Road 57 57 43 53
State Highway 7 30 36 26
U. S. Highway 36 13 21 21
Average Customer Distance Travel.ed (one way) Percent
Less than 2 miles 14 9 7 10
2-5 miles 14 26 29 23
5-10 miles 36 22 21 26
l 0-30 miles 36 26 21 27
More than 30 miles 0 18 21 14
5

More than half of all firms were located on county roads. The percentage of firms located on state and U. S. highways varied greatly between states. The average customer traveled a one-way distance of 10 miles or less to shop (Table 1).
Firm Age and Business Structure
The average firm had been in businses 24.6 years and under present management for 17.9 years. The average Indiana market had been in business longer than Ohio and Michigan markets. Overall, firm age was not related to sales, but the only firms that reported annual sales of more than $1 million had all been in business less than 20 years.
The most common business structure among direct marketers was the sole proprietorship, which accounted for 55% of the firms. Partnerships accounted for 24% of the firms and 21 % were corporations.
Production Acreage
Direct marketers had an average of 108 acres in crop production. Average production acreages by state were 40, 134, and 150 acres in Ohio, Michigan, and Indiana, respectively (Table 2). Ohio firms developed as marketers rather than producers, while Indiana and Michigan firms tended to have larger acreages specializing in vegetable and fruit crops, respectively.
Production acreage had been increased by 60% of all operators since 1968; 43 % of all operators planned to increase production acreage in 1980.
Labor Analysis
The average number of year-round employees per firm was 4.7 persons and the average number of full-time equivalents was 10.5 persons. Michigan, Ohio, and Indiana averaged 5.5, 4.3, and 3.7 full-time employees per firm (Table 2).
Small, medium, and large firms averaged 2, 4, and 6 full-time employees and 6, 10, and 12 full-time equivalents, respectively (Table 2). Sales per full-time equivalent for small, medium and large firms were $16,670, $31,250, and $45,450, respectively (Table 2).
Location Analysis
Firm location was classified by county road, state highway, and U. S. highway. About 53% of all direct marketing operations were located on county roads, 26 % were located on state highways, and 21 % were located on U. S. highways. Larger firms were most often located on state and U. S. highways, while smaller firms were usually located on county roads. Among year-round markets, 71 % were located on either state or U. S. highways.
6
Sales Analysis The larger the direct marketing firm, the less seasona:l the opera
tion (Table 2) . More than 7 5 % of the large firms with annual gross sales over $400,000 were full-year operations.
The average sale per customer for the three-state survey area was $6.09 (Table 2). There was little relationship between size of firm and average unit sale and average unit sale did not vary significantly among states.
Firms located on county roads reported the highest average sale per customer of $7 .50. The average unit sales for firms located on state and U. S. highways were $6:50 and $5.50, respectively.
The average in-store retail sale per square foot of sales area for the three-state area was $80.50. Average sales per square foot of retail sales area were $94.46, $86.~3, and $57.52 for Michigan, Indiana, and Ohio, respectively. The less seasonal and larger the operation, the greater the sales per square foot of retail sales area. The average year-round market had sales of more than $130 per square foot of retail sales area, which was more than twice the sales per square foot for seasonal markets (Table 2).
Seasonality Determining the number of months a farm market will be open is
a major management decision (2, 14, 15). Firm seasonality was categorized as follows: 1 ) short-season firms, open less than 5 months; 2) half-season firms, open 5 to 6 months; 3) long-season firms, open 7 to 11 months; and 4) full-year firms, open 12 months per year.
Firms ranged from specialized PYO operations open only 1 month a year to large full-year operations with a broad product line. Some 72% of firms were open 11 months or less while 52% were open 6 months or less; 28% of the firms were open year-round. Seasonality varied greatly by crop grown and type of operation. On-premise farm markets were larger and less seasonal, while PYO operations were highly seasonal.
The percentages of full-year markets in the small, medium, and large size categories were 0%, 25%, and 75%, respectively. Larger firms tended to be less seasonal firms, but firm seasonality had no relationship to type of market location.
Seasonality was strongly related to the major crop produced by the firm. A major crop was defined as any single crop which accounted for at least 40% of the total annual gross sales of the firm. Firms with no major crop were usually year-round operations with a broad product mix.
7

TABLE 2.-Comparison of Firm Characteristics by Firm Size, State, and Seasonality for Direct Farm Marketers in Ohio, Indiana, and Michigan, 51 Firms, 1978.
Sales
Percent of Average Average Percent of Sales Percent of
All No. of No. of Sales/ Average Annual Sales from Not Fruits Major Crop Firms Acres Products Employee Unit Sale Sales/Sq. F~. Major Crop and Vegetables Sold Retail
Firm Size Small* 32% 49 25 $16,670 $6.80 $36.85 58 9 87 Mediumt 37% 69 42 $31,250 $6.87 $68.55 67 19 68 Large:j: 31 % 189 79 $45,450 $6.57 $93.95 54 28 53
State co Ohio 27% 40 $5.20 $57.72
Indiana 27% 150 $6.39 $86.93 Michigan 46% 134 $6.68 $94.46
Seasonality Short Season (less than 5 mo.) 24% 67 25 $7.20 $65.00 81 3 73 Half Season (between 5 and 6 mo.) 28% 127 59 $6.90 $64.00 52 13 68 Long Season (between 7 and 11 mo.) 20% 75 41 $5.80 $78.10 64 10 76 Year-Round (12 mo.) 28% 189 90 $7.10 $130.40 40 44 63
*Less than $100,000 sales. tBetween $100,000 and $400,000 in sales. :j:More than $400,000 in sales.

-0
. TABLE 2 (Continued).-Comparison of Firm Characte.ristics by Firm Size, State, and Seasonality for Direct Farm Marketers in Ohio, Indiana, and Michigan, 51 Firms, 1978.
Labor Seasonalitx_ ---Average Average
Average No. of No. of Customer All No. of No. of Full-time Full-time All Seasonal Visits/ Advertising
Firms Acres Products Employees Equivalents Firms Firms Year Budget
Firm Size Smqll* 32% 49 25 2.0 6.0 4.7 4.7 12.5 $1,064 Mediumt 37% 69 42 4.0 10.0 7.5 6.3 17.3 $3,750 Large:j: 31 % 189 79 6.0 12.0 9.6 6.3 35.8 $6,055
State Ohio 27% 40 4.3 9.9 7.5 5.7 Indiana 27% 150 3.7 10.6 7.2 6.4 Michigan 46% 134 5.5 10.8 7.4 5.0
Seasonality Short Season (less than 5 mo.) 24% 67 25 9.4 $10,850 Half Season (between 5 and 6 mo.) 28% 127 59 12.9 $3,190 Long Season (between . 7 and 11 mo.) 20% 75 41 23.5 $1,570 Year-Round (l~ mo.) 28% 189 90 48.9 $7,439
*Less than $100,000 sales. tBetween $100,000 and $400,000 in sales. :j:More than $~00,000 in sales.

About 64% of firms whose major crop was apples were open for retail sales between 4 and 9 months a year and approximately 22% were open year-round. Of all the firms with a major crop other than apples, 88% were open less than 9 months a year. Firms specializing in tree fruits were less seasonal, while those specializing in small fruits and vegetables were usually more seasonal.
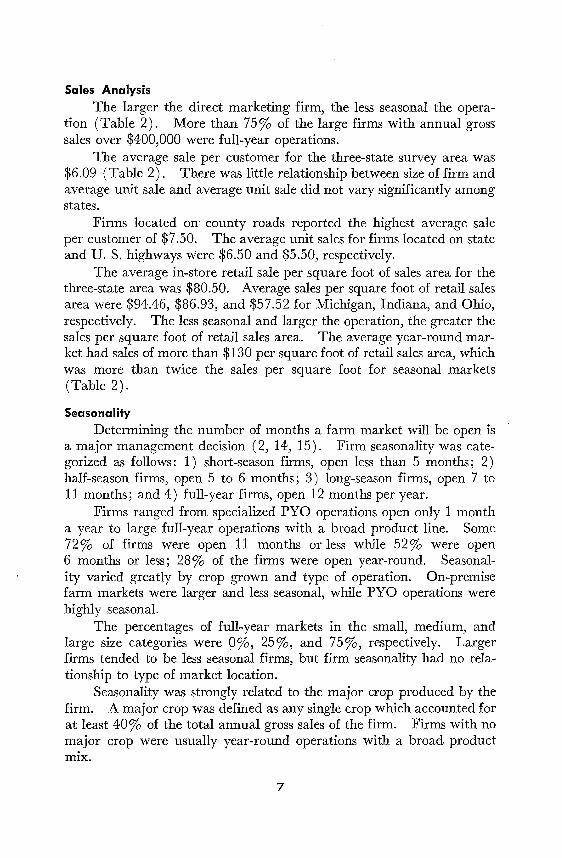
Product Analysis Product assortment for surveyed firms ranged from 3 to 128 prod
ucts, with 4 7 products as the average number per firm. More than 80% of the dollar value of all products sold by direct marketing firms was fresh produce. Some 18 % of the firms sold only fruits and/ or vege-
10
80
Average 60
number of products
40-
20
0 I
20 I
40 6'o 80
Percent of sales not fruit and vegetable
FIG. 1 .-Comparison of number of products to percent of sales not fruits and vegetables.
10

tables. Only 31 % of the firms sold more than 5 % commodities other than fruits or vegetables (Figure 1) .
A major fruit or vegetable crop for their firm was identified by 70% of all firms. The most frequent major crop was apples, small fruits, sweet corn, or strawberries. Apples were the major crop for 34% of the firms.
Larger firms and firms located in higher traffic areas relied more on products other than fruits and vegetables, handled a greater number of products, and were less seasonal. The average market had 14% gross sales contributed by products other than fruits and vegetables. Items commonly found in markets accounting for up to 20% of gross sales included bakery goods, soft drinks, meat, cheese, jam, wine, and gifts. Firms that were successful with new products had greater customer frequencies and lower unit sale sizes compared to more specialized firms. New products that had been offered in the last 5 years were identified by 37% of the firms.
Customer Analysis Customer factors affectlng sales included distance traveled, type
of customer, and shopping habits. Higher income consumers shopped at farm markets more frequent'ly and traveled less distance, while lower income consumers traveled less frequently but traveled a greater distance to farm markets.
Customers traveled an average one-way distance of 47, 23, 14, 10, and 8 miles for blueberries, tree fruits, strawberries, other vegetables, and sweet corn, respectively. Firms attracting customers over an average of 10 miles had an identifiable major crop. More seasonal firms with a major crop had a much lower frequency of customer visits compared to the less seasonal firms with a broader product mix.
Customers traveled the greatest distance to PYO operations. They purchased less frequently but bought more per visit than customers at off-premise markets. Customers traveled the shortest distance to off
- premise farm markets, shopping there more frequently but buying less per visit.
Market Channels Direct marketers utilized an average of three different market out-
lets. Produce was marketed through numerous outlets, but a combination of PYO, farm markets, and wholesale outlets predominated. Small firms tended to sell more through PYO operations, while larger firms used more diversified selling by utilizing multiple retail and wholesale outlets. Less than 1 % ·of the marketers responded that they were strictly PYO operations. Many firms indicated that they would be doing more selling through PYO and on-premise farm markets. About 83%,
11

I\)
Percent of gross sales spent
on advertising -
3-
2-
1-
....... ~ ..
# .. #-#
#-# ##
#-#
# ##
## ##
##
##
##
## ·-·-·-·-·-·-·-·-·-·-
-30
-20
-10
O I I I O 0 2 4 6 8 10
Gross sales ($100,000)
Full-time employee
equivalents
-----
Full-time employees
-·-
FIG. 2.-Comparison of gross sales to percent of gross sales spent on advertising and distribution of full-time employee equivalents and full-time employees by gross sales. · ·

73%, and 39% of strawberry, blueberry, and apple growers, respectively, ·sold their product using PYO methods. More than half of all bean growers, 40% of tomato growers, and 17% of sweet corn producers utilized PYO selling.
The processing and co-op methods of marketing were more popular in Michigan, while other types of outlets were used more by Ohio and Indiana operators. Indiana marketers reported using more wholesale outlets, but generally marketed smaller amounts through these channels than Michigan firms. Multiple Outlets
All firms operated one main retail outlet on a regular basis and 6 % of the markets surveyed regularly sold produce through multiple outlets. Firms that periodically operated additional outlets used twice a week farmers' markets, sales from vehicle ( s) driven to high traffic location ( s), or sales at local festivals operating for only a few days a year.
Direct marketers have not been successful in expansion by addition of retail outlets. Each multiple outlet operation staffed the branch store with family members and reported that if family members had not been available, they would not have marketed through additional outlets. Promotional Activ-ities
Short-season, half-season, long-season, and year-round direct mar-keters made average annual advertising expenditures of $10,850, $3,190, $1,570, and $7,439, respectively.
Some form of paid advertising was employed by 92 % of all firms. Advertising was mostly by newspaper and, to a lesser extent, radio. The percent of gross sales a firm spent on advertising was not directly related to firm size (Figure 2) . Firms with gross sales of more than $400,000 a year spent approximately 1 % of gross sales on advertising, while smaller firms spent from 1.5% to 3%.
Three-fourths of the firms surveyed utilized some sort of publicity. The majority of firms conducted tours of their operation. Talks to organizations were used as promotion by 8% of the firms, while 6% of the operators sent out news releases on a regular basis. Other publicity activities employed by firms included mall displays, supplying community banks with fruit, balloons, monthly drawings for prizes, give-aways, canning demonstrations, fair exhibits, and participation in Extension programs. Service Differentiation
Frequently offered services included carry-out, check cashing, credit cards, food stamps, product use information, special pricing, and credit. Operators reported that few services enhance the price/ value
13
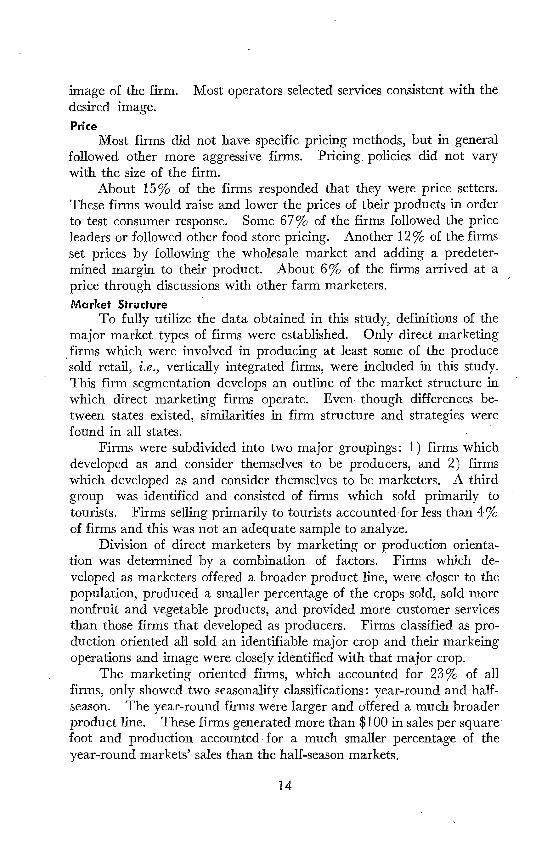
image of the firm. Most operators selected services consistent with the desired image.
Price Most firms did not have specific pricing methods, but in general
followed other more aggressive firms. Pricing policies did not vary with the size of the firm.
About 15 % of the firms responded that they were price setters. These firms would raise and lower the prices of their products in order to test consumer response. Some 67% of the firms followed the price leaders or followed other food store pricing. Another 12 % of the firms set prices by following the wholesale market and adding a predetermined margin to their product. About 6% of the firms arrived at a price through discussions with other farm marketers. Market Structure
To fully utilize the data obtained in this study, definitions of the major market types of firms were established. Only direct marketing
. firms which were involved in producing at least some of the produce sold retail, i .. e.) vertically integrated firms, were included in this study. This firm segmentation develops an outline of the market structure in which direct marketing firms operate. Even. though differences between states existed, similarities in firm structure and strategies were found in all states. ·
Firms were subdivided into two major groupings: 1) firms which developed as and consider themselves to be producers, and 2) firms which developed as and consider themselves to be marketers. A third group was identified and consisted of firms which sold primarily to tourists. Firms selling primarily to tourists accounted for less than 4% of firms and this was not an adequate sample to analyze.
Division of direct marketers by marketing or production orientation was determined by a combination of factors. Firms which developed as marketers offered a broader product line, were closer to the population, produced a smaller percentage of the crops sold, sold more nonfruit and vegetable products, and provided more customer services than those firms that developed as producers. Firms classified as production oriented all sold an identifiable major crop and their markeing operations and image were closely identified with that major crop.
The marketing oriented firms, which accounted for 23 % of all firms, only showed two seasonality classifications: year-round and halfseason. The year-round firms were larger and offered a much broader product line. These firms generated more than $100 in sales per square foot and production accounted for a much smaller percentage of the year-round markets' sales than the half-season markets.
14

Marketing oriented ha:lf-season firms tended to be stronger in vegetable sales, while year-round markets sold a higher percentage of fruit crops. The year-round marketing oriented firm has been most successful in achieving greater customer frequency by introducing bakeries, delicatessens, meat markets, and similar services and product lines. Some 75% of the firms in the year-round marketing classification offered at least one of these product lines. Year-round firms also expend a greater effort on advertising and promotional activities. About 30% of the marketing oriented firms were half-season firms and about 70% were. open year-round.
Firms classified as production oriented had an easily identifiable major crop. Of the production oriented firms, approximately 34%, 10%, and 50% identified vegetables, small fruits, and tree fruits as their major crops.
Small fruit growers were seasonal operations and identified PYO as their most profitable selling method. They sold a relatively high dollar amount per sale to customers who made few visits per year. These operations attracted customers from an average distance of 18.0 miles, produced most of the products they sold, and relied heavily on only small fruit crops.
Vegetable growers were frequently located closer to population centers than other production oriented markets and generally were not open year-round. The short-season vegetable firms, which accounted for approximately half the vegetable producers, sold very few other products, relied heavily on PYO, and sold through low investment facilities.
Firms with retail selling efforts centered around the tree crop they produced showed similar marketing strategies. Differences in strategy were related to the firm's distance from a population center, which was influenced directly by the number of months open. Firms which were located near a large population center remained open more months than those located further away. All firms relied heavily on their tree crops for their major sales. Customer frequency increased as the firms were open more months, but this was not a direct relationship and the customer flows were greatest for all of those firms when the major tree fruit crop was in season.
The industry has also developed differently in certain areas as Ohio markets show a greater tendency to be marketing oriented. Indiana firms produced larger acreages of vegetables with much greater competition in the marketplace, and Michigan firms shmyed a competitive market as in Indiana, but with tree fruits as the major crop. Variations by
15

state were found to be caused by environmental factors, market environment, and distance from population center ( s).
In conclusion, this research may be used by direct marketers to help make marketing decisions. This research deals only with direct markets, but is relevant to most fruit and vegetable producers and retailers as it develops an understanding of the consumer and their behavior in the purchasing of these crops. Overall industry averages in other states will most likely vary from the averages derived in this study, but out-ofstate firms may use the data as guidelines. Producers and retailers will be able to use this information to greater understand the fit of their firm in the total market structure. The greatest benefits of this research will be to direct marketers who, with the use of the industry averages and collection of ideas and strategy organization, will be able to better serve consumers.
REFERENCES 1. Antle, Glen G. 1978. Pick Your Own. Coop. Ext. Serv., Mich.
State Univ., Ext. Bull. E-1246 SF-16. 12 pp. 2. Antle, Glen G. 1978. Roadside Marketing for Beginners. Coop.
Ext. Serv., Mich. State Univ., Ext. Bull. E-1145 SF-13. 8 pp. 3. Bjergo, A. 1976. Organizing a Farmers' Market. Coop. Ext.
Serv., Montana State Univ., Bull. 1145. 19 pp. 4. Brown, E. Evan and W. Fred Chapman, Jr. 1958. Factors Af
fecting Roadside Market Sales. Agri. Exp. Sta., Clemson Univ., Bull. 475.
5. Brown, E. E. and R. L. Jordan. 1977. An Economic Analysis of Roadside Marketing in Georgia. Res. Rpt. 254, Dept. of Agri. Econ., Univ. of Georgia. 29 pp.
6. Clevenger, Thomas S. and Charles L. McGarrah. 1974. Economics of "Pick-It-Yourself" Vegetable Production and Marketing. Res. Rpt. 274, Dept. of Agri. Econ., Agri. Exp. Sta., New Mexico State Univ. 24 pp.
7. Courter, J. W. and C. C. Zych. 1969. Survey of "Pick-YourOwn" Strawberry Customers, 1969. Fruit Growing No. 24, Dept. of Hort., Univ. of Illinois. 3 pp.
8. Courter, J. W. and C. C. Doll. 1975. PYO is the Way to Go. Amer. Fruit Grower, 95 :26, 42.
9. Fabian, Morris S. 1972. "Pick-Your-Own" Marketing Selected Information and Bibliography. MP-8, Dept. of Agri. Econ. and Mkting., Rutgers Univ. 30 pp.
16

10. Ginder, Roger. 1970. Advantages, Problems, and Suggestions for Pick-Your-Own Marketing of Horticultural Products. Coop. Ext. Serv., Univ. of Delaware. 7 pp.
il. Ginder, Roger G. 1975. Management of Pick-Your-Own Marketing Operations. Coop. Ext. Serv., Univ. of Delaware. 66 pp.
12. Ingrassia, P. 1978. Independent Grocers OutseH the Big Chains by Adapting to Markets. The Wall Street Journal, 59(31) :1.
13. McConnell, G. E. 1972. So, You Want to Get Into Pick-YourOwn? Amer. Fruit Grower, 92(5) :18, 21, 24.
14. Metzger, Homer B. and Wilfred H. Erhardt. 1976. Marketing Fresh Fruits and Vegetables Through Roadside Stands and PickY our-Own Operations in Maine, 1974. Bull. 724, Life Sci. and Agri. Exp. Sta., Univ. of Maine. 28 pp.·
15. Powell, Gordon R. 1977. Direct Marketing Management. Amer. Veg. Grower, 25(9) :11-12.
16. Routley, D. G. 1978. The Tuttles and Their Farm-1635 to 1978. HortScience, 13:214, 319.
17. Watkins, Edgar P. and Bruce Bradley. 1978. Ohio Customers and Their Roadside Markets. ESS-562, MM 381, Coop. Ext. Serv., The Ohio State Univ. 23 pp.
17

This page intentionally blank.

BETTER LIVING IS THE PRODUCT of. research at the Ohio Agricultural Research and Development Center. All Ohioans benefit from this product.
Ohio's farm families benefit from the results of agricultural research translated into increased earnings and improved living conditions. So do the families of the thousands of workers employed in the firms making up the state's agribusiness complex.
But the greatest benefits of agricultural research flow to the millions of Ohio consumers. They enjoy the end products of agricultural science-the world's most wholesome and nutritious food, attractive lawns, beautiful ornamental plants, and hundreds of consumer products containing ingredients origin.ating on the farm, in the greenhouse and nursery, or in the forest.
The Ohio Agricultural Experiment Station, as the Center was called for 83 years, was established at The Ohio State University, Columbus, in 1882. Ten years later, the Station was moved to its present location in Wayne County. In 1965, the Ohio General Assembly passed legislation changing the name to Ohio Agricultural Research and Development Center-a name which more accurately reflects the nature and scope of the Center's research program today.
Research at OARDC deals with the improvement of all agricu.1-tural production and marketing practices. It is concerned with the development of an agricultural product from germination of a seed or development of an embryo through to the consumer's dinner table. It is directed at improved human nutrition, family and child development, home management, and all other aspects of family life. It is geared to enhancing and preserving the quality of our environment.
Individuals and groups are welcome to visit the OARDC, to enjoy the attractive buildings, grounds, and arboretum, and to observe first hand research aimed at ~he goal of Better Living for All Ohioans!

The Ohio State University
Ohio Agricultural Research and Development Center