
Market Segments in European Air Traffic · PDF file · 2016-08-09Market Segments in...
22
STATFOR Doc 581 DRAFT v0.4 20/07/16 EUROCONTROL/NMD/STATFOR Market Segments in European Air Traffic 2015 Summary In this report on the breakdown of flights per market segment – traditional-scheduled, low-cost, business aviation, charter, all-cargo - we present an overview of the growth in IFR movements over the past six years by tracking the main changes through time per segment and by providing a more detailed analysis of 2015 ECAC flights. • Between 2010 and 2015, ECAC flights experienced a 3.5% growth. The growth was mainly driven by the low-cost segment. The other segments are still suffering the period of economic and political instability, although the traditional and all-cargo market segments have shown the first recovery signs in the last two years. • In 2015, the backbone of the ECAC flights remains the traditional-scheduled sector (54%), followed by a big share (28%) of flights served by the low-cost segment. The rest is served by the other market segments. • The low-cost segment presented positive growth throughout the analysed period. It is the only sector which was able to grow through these uncertain economic conditions mainly affected by the economic downturn due to the banking crisis and the EU debt crisis. • In 2015, the traditional-scheduled segment represented more than 50% of the flights (including overflights) for most of the traffic zones, with the exception of France, UK, Italy, Continental Spain and FYROM. In those traffic zones the low-cost segment is particularly developed. • In eight out of the 2015 top ten busiest airports, traditional scheduled flights represent more than 50% of flights. It is interesting to report that in Paris CDG - the busiest airport in 2015 - the prominent segment is traditional scheduled (80%) followed by low-cost (12%); whereas in the 10 th busiest airport, London Gatwick, the prominent sector is low-cost (67%) followed by traditional scheduled (29%). • The top-fifteen most trafficked airport-pairs for traditional and low-cost are mainly composed by internal connections within the busiest traffic zones or connections between Member States main cities. The traditional segment shows negative or no growth when performing the same city pair as the low cost. Whereas the low-cost sector in the same city-pair registers substantial growth.
Transcript of Market Segments in European Air Traffic · PDF file · 2016-08-09Market Segments in...

STATFOR Doc 581 DRAFT v0.4 20/07/16 EUROCONTROL/NMD/STATFOR
Market Segments in European Air Traffic 2015
Summary In this report on the breakdown of flights per market segment – traditional-scheduled, low-cost, business aviation, charter, all-cargo - we present an overview of the growth in IFR movements over the past six years by tracking the main changes through time per segment and by providing a more detailed analysis of 2015 ECAC flights. • Between 2010 and 2015, ECAC flights experienced a 3.5% growth. The growth was mainly
driven by the low-cost segment. The other segments are still suffering the period of economic and political instability, although the traditional and all-cargo market segments have shown the first recovery signs in the last two years.
• In 2015, the backbone of the ECAC flights remains the traditional-scheduled sector (54%), followed by a big share (28%) of flights served by the low-cost segment. The rest is served by the other market segments.
• The low-cost segment presented positive growth throughout the analysed period. It is the only sector which was able to grow through these uncertain economic conditions mainly affected by the economic downturn due to the banking crisis and the EU debt crisis.
• In 2015, the traditional-scheduled segment represented more than 50% of the flights (including overflights) for most of the traffic zones, with the exception of France, UK, Italy, Continental Spain and FYROM. In those traffic zones the low-cost segment is particularly developed.
• In eight out of the 2015 top ten busiest airports, traditional scheduled flights represent more than 50% of flights. It is interesting to report that in Paris CDG - the busiest airport in 2015 - the prominent segment is traditional scheduled (80%) followed by low-cost (12%); whereas in the 10th busiest airport, London Gatwick, the prominent sector is low-cost (67%) followed by traditional scheduled (29%).
• The top-fifteen most trafficked airport-pairs for traditional and low-cost are mainly composed by internal connections within the busiest traffic zones or connections between Member States main cities. The traditional segment shows negative or no growth when performing the same city pair as the low cost. Whereas the low-cost sector in the same city-pair registers substantial growth.

Market Segments in European Air Traffic 2015
STATFOR Doc 581 DRAFT v0.4 20/07/16 EUROCONTROL/NMD/STATFOR Page 3
Contents 1. Introduction ................................................................................................................................. 4
2. Definitions and scope .................................................................................................................. 4
3. Overview 2010 – 2015 ................................................................................................................ 5
3.1 Share of flights by Market Segment ..................................................................................... 5
3.2 Market Segment trends ........................................................................................................ 5
4. Market Segments in 2015 ........................................................................................................... 8
4.1 Flights distribution by traffic zone ......................................................................................... 8
4.2 Flights distribution growth in the top ten busiest traffic zones ............................................... 9
4.3 Main aircraft types .............................................................................................................. 11
4.4 Flights in the top ten busiest airports .................................................................................. 12
4.5 Main airports pairs.............................................................................................................. 14
A. Main aircraft types ..................................................................................................................... 15
B. Main airports ............................................................................................................................. 16
C. Main airport pairs ................................................................................................................... 19
D. Glossary ................................................................................................................................ 22

Market Segments in European Air Traffic 2015
STATFOR Doc 581 DRAFT v0.4 20/07/16 EUROCONTROL/NMD/STATFOR Page 4
1. INTRODUCTION As business models in aviation have significantly different patterns, we want to contribute to a better perception of the different needs of the operators, know how they operate and how they behave in times of economic and political instability. STATFOR has a definition for air traffic market segments based on lists of aircraft types, aircraft operators and the ICAO flight types filed on flight plans. This categorisation (section 2) has been well-established within the aviation sector. We use it in several reports and analysis to monitor and track the changes of the segments through time. In the STATFOR’s interactive dashboard (SID)1 it is possible to get a breakdown of flights per segment and get monthly updates per state, airport, years, etc… Our aim is to provide a snapshot of the current situation by presenting an overview of the changes in flights since 2010 (section 3) and by providing a more detailed analysis of 2015 (section 4). The analysis described in section 4 is supported by specific tables reported in annex A, B, C, and a glossary in annex D. Finally, this report also aims at refining STATFOR’s business intelligence by providing a simple and effective mean of comparing the aviation segments and to help calibrating our own definition of these segments.
2. DEFINITIONS AND SCOPE IFR movements can be grouped in several categories. The answers to “when, where and why they fly” (business model, mission type) and to “what they transport” (passengers, cargo) place them in different market segments. Based on rules matching specific criteria, STATFOR classifies the flights in seven market segments2:
• Business aviation: flights with a specific aircraft type listed in the STATFOR market segment description3, as well as specific aircraft linked to ICAO flight type ‘G’;
• Low-cost: flights filed with ICAO flight type within a specific list of low-cost operators and/or departure and arrival airport listed in the STATFOR market segment description3;
• Traditional-scheduled: flights with ICAO flight type ‘S’, excluding those falling into other categories;
• Non-scheduled/Charter: flights with ICAO flight type ‘N’ not included in the business aviation segment;
• Military IFR: flights matching specific aircraft type, aircraft operator or ICAO flight type ‘M’; • All-cargo: flights with a specific aircraft type, callsign and/or aircraft operator linked to all-cargo
operations; and • Other: all the IFR movements that do not match the above mentioned segments.
We understand that no definition is perfect, because there are different views on how they should be grouped. The need is not for perfection at a single point in time but rather to have a usable definition that allows the segments to be tracked through time. More information on the order of the rules we use to define market segments is available on the FAQs of the STATFOR webpage4. Furthermore, the lists with the mentioned criteria are regularly updated and published in the SID. Due to confidentiality reasons, military IFR and other types of flights appear as “other” in this report. The report is divided into two parts. In section 3 we provide an overall view of the market segmentation within the European Civil Aviation Conference (ECAC) Area from 2010 to 2015 by presenting the distribution and annual growth of the different segments. All IFR flights are included in the analysis (departures, arrivals, internals and overflights). In section 4 we analyse the current situation (2015) based on the share of flights for each market segment, as well as in comparison with 2014. We find it relevant to introduce the segments share in the traffic zones5 (TZs) within Europe (section 4.1), with a special section on the busiest ones (section 4.2). We limited our analysis to three operational elements that we find important to characterise the segments: the aircraft type (section 4.3), the main airports (section 4.4) and the main airport pairs (section 4.5). Each section has a complementary table in the annexes reporting the most used elements per segment. The flight counts are based on arrivals and departures (international and domestic) and all the flights covered 1 Statfor Interactive Dashboard 2 Classification dated August 2012 3http://publish.eurocontrol.int/sites/default/files/content/documents/official-documents/facts-and-figures/statfor/market-segments-rules-for-sid-aug2012.xls 4 http://www.eurocontrol.int/faq/statfor#frequently_asked_questions-default-6 5 Traffic zone (TZ) consists of a Flight Information Region (FIR) or a group of FIRs. It is independent of the FIR country of origin. In most of the TZ equals the correspondent “State” - see STATFOR FAQs http://www.eurocontrol.int/faq/statfor
Market Segments in European Air Traffic 2015
STATFOR Doc 581 DRAFT v0.4 20/07/16 EUROCONTROL/NMD/STATFOR Page 5
by the Network Manager (NM) area are included. This was particularly relevant in order to capture certain flows that are originated outside NM which have a significant weight on the European traffic. To avoid any bias in the calculations due to a leap year effect, all calculations of this report were based on mean daily movements.
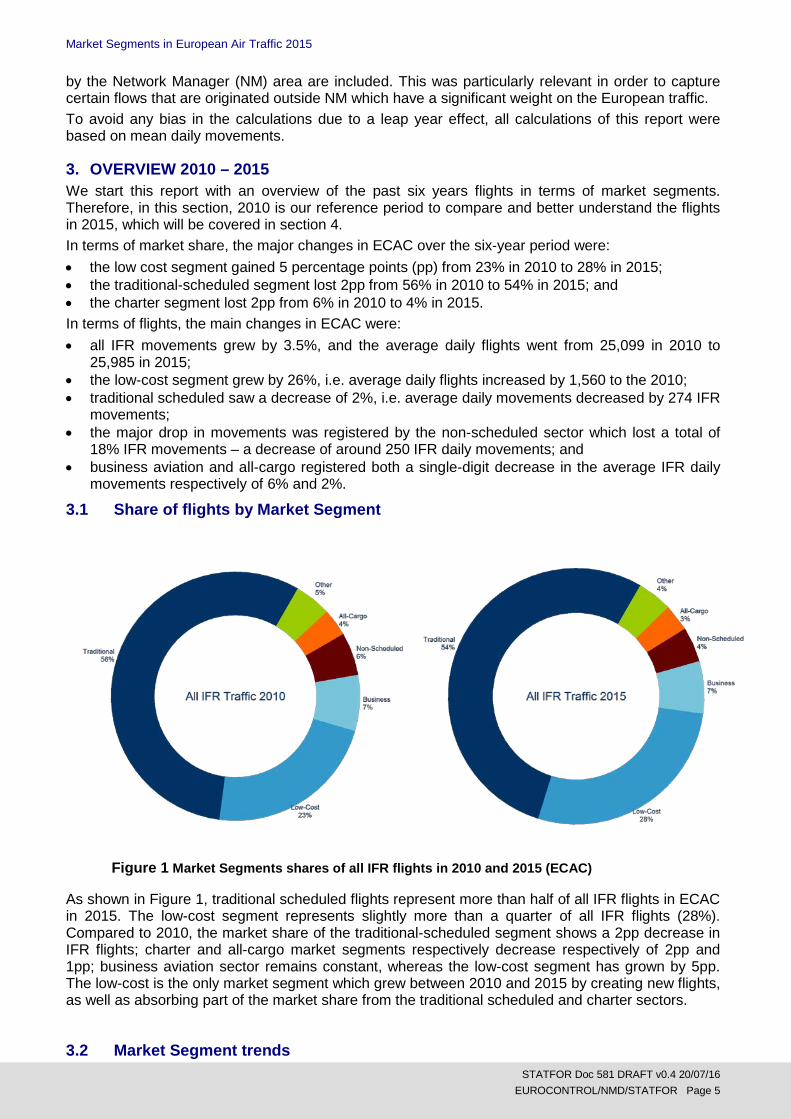
3. OVERVIEW 2010 – 2015 We start this report with an overview of the past six years flights in terms of market segments. Therefore, in this section, 2010 is our reference period to compare and better understand the flights in 2015, which will be covered in section 4. In terms of market share, the major changes in ECAC over the six-year period were: • the low cost segment gained 5 percentage points (pp) from 23% in 2010 to 28% in 2015; • the traditional-scheduled segment lost 2pp from 56% in 2010 to 54% in 2015; and • the charter segment lost 2pp from 6% in 2010 to 4% in 2015. In terms of flights, the main changes in ECAC were: • all IFR movements grew by 3.5%, and the average daily flights went from 25,099 in 2010 to
25,985 in 2015; • the low-cost segment grew by 26%, i.e. average daily flights increased by 1,560 to the 2010; • traditional scheduled saw a decrease of 2%, i.e. average daily movements decreased by 274 IFR
movements; • the major drop in movements was registered by the non-scheduled sector which lost a total of
18% IFR movements – a decrease of around 250 IFR daily movements; and • business aviation and all-cargo registered both a single-digit decrease in the average IFR daily
movements respectively of 6% and 2%.
3.1 Share of flights by Market Segment
As shown in Figure 1, traditional scheduled flights represent more than half of all IFR flights in ECAC in 2015. The low-cost segment represents slightly more than a quarter of all IFR flights (28%). Compared to 2010, the market share of the traditional-scheduled segment shows a 2pp decrease in IFR flights; charter and all-cargo market segments respectively decrease respectively of 2pp and 1pp; business aviation sector remains constant, whereas the low-cost segment has grown by 5pp. The low-cost is the only market segment which grew between 2010 and 2015 by creating new flights, as well as absorbing part of the market share from the traditional scheduled and charter sectors.
3.2 Market Segment trends
Figure 1 Market Segments shares of all IFR flights in 2010 and 2015 (ECAC)
Market Segments in European Air Traffic 2015
STATFOR Doc 581 DRAFT v0.4 20/07/16 EUROCONTROL/NMD/STATFOR Page 6
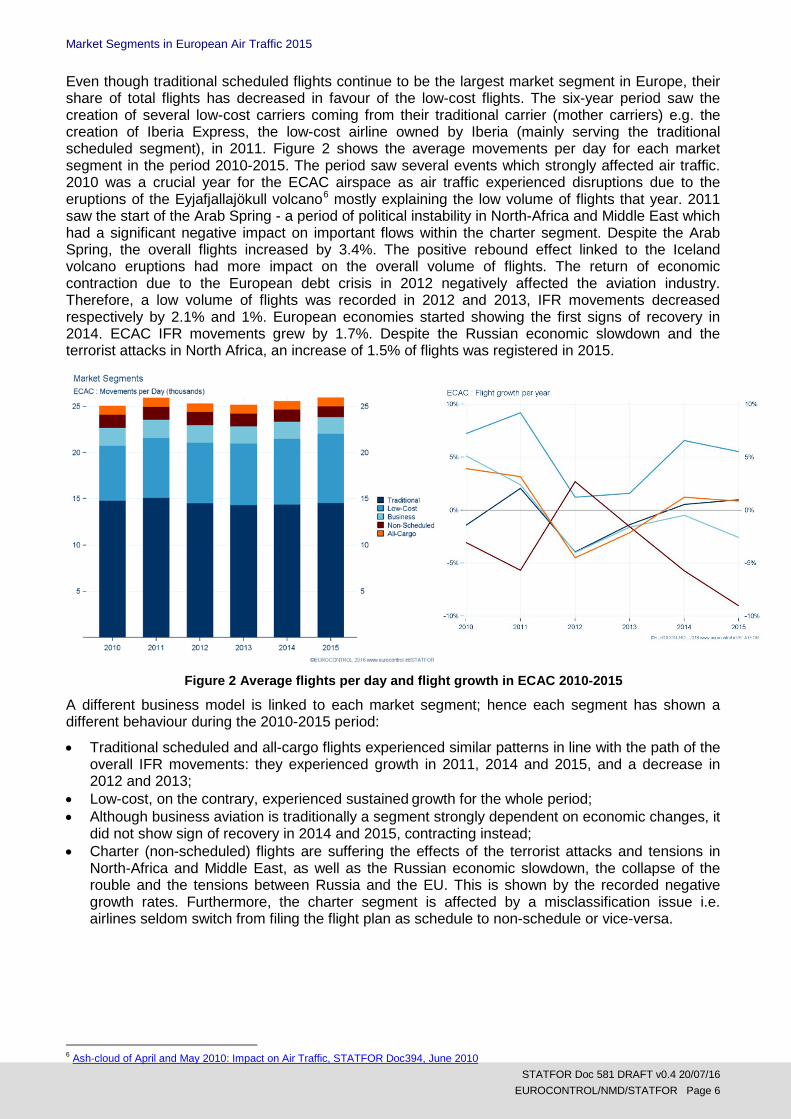
Even though traditional scheduled flights continue to be the largest market segment in Europe, their share of total flights has decreased in favour of the low-cost flights. The six-year period saw the creation of several low-cost carriers coming from their traditional carrier (mother carriers) e.g. the creation of Iberia Express, the low-cost airline owned by Iberia (mainly serving the traditional scheduled segment), in 2011. Figure 2 shows the average movements per day for each market segment in the period 2010-2015. The period saw several events which strongly affected air traffic. 2010 was a crucial year for the ECAC airspace as air traffic experienced disruptions due to the eruptions of the Eyjafjallajökull volcano6 mostly explaining the low volume of flights that year. 2011 saw the start of the Arab Spring - a period of political instability in North-Africa and Middle East which had a significant negative impact on important flows within the charter segment. Despite the Arab Spring, the overall flights increased by 3.4%. The positive rebound effect linked to the Iceland volcano eruptions had more impact on the overall volume of flights. The return of economic contraction due to the European debt crisis in 2012 negatively affected the aviation industry. Therefore, a low volume of flights was recorded in 2012 and 2013, IFR movements decreased respectively by 2.1% and 1%. European economies started showing the first signs of recovery in 2014. ECAC IFR movements grew by 1.7%. Despite the Russian economic slowdown and the terrorist attacks in North Africa, an increase of 1.5% of flights was registered in 2015.
A different business model is linked to each market segment; hence each segment has shown a different behaviour during the 2010-2015 period:
• Traditional scheduled and all-cargo flights experienced similar patterns in line with the path of the overall IFR movements: they experienced growth in 2011, 2014 and 2015, and a decrease in 2012 and 2013;
• Low-cost, on the contrary, experienced sustained growth for the whole period; • Although business aviation is traditionally a segment strongly dependent on economic changes, it
did not show sign of recovery in 2014 and 2015, contracting instead; • Charter (non-scheduled) flights are suffering the effects of the terrorist attacks and tensions in
North-Africa and Middle East, as well as the Russian economic slowdown, the collapse of the rouble and the tensions between Russia and the EU. This is shown by the recorded negative growth rates. Furthermore, the charter segment is affected by a misclassification issue i.e. airlines seldom switch from filing the flight plan as schedule to non-schedule or vice-versa.
6 Ash‐cloud of April and May 2010: Impact on Air Traffic, STATFOR Doc394, June 2010
Figure 2 Average flights per day and flight growth in ECAC 2010-2015

Market Segments in European Air Traffic 2015
STATFOR Doc 581 DRAFT v0.4 20/07/16 EUROCONTROL/NMD/STATFOR Page 7
Figure 3 Monthly flight year-on-year growth from January 2011 to December 2015
Figure 3 shows the monthly growth of all ECAC flights (including overflights) calculated comparing the same month of two subsequent years from January 2011 to December 2015. Fluctuations in each segment’s growth in flights often reflect particular events: • The 2010 Eyjafjallajökull eruptions negatively affected all ECAC IFR flights. As written above,
2011 flights partly grew due to a rebound effect (especially in April 2011). All flights declined in 2012 affected by the general economic downturn due to the banking crisis and the European debt crisis.
• Low-cost presented positive growth throughout the whole analysed period showing some slow down due to the seasonality effect, with some exceptions in the first months of 2012 and 2013. During those months fuel prices were too high and low-cost carriers decided to cut winter capacity (e.g. by grounding aircraft). Low-cost is the only sector which was able to grow in uncertain economic conditions. Low-cost carriers have been adapting their business model to attract new kind of passengers e.g. they started flying from/to main airports to attract client from the traditional scheduled sector.
• Excluding 2012, the traditional segment shows a constant pattern of growth mainly driven by the seasonality effect. The big changes in this sector were recorded in 2012 during which the traditional scheduled sector decline was replaced by the low-cost sector growth.
• The Arab Spring in 2011, the Russian economic slowdown in 2014 as well as the terrorist attacks North-Africa 2015 negatively affected charter segment’s pattern. In addition, airlines seldom switch from filing the flight plan as schedule to non-schedule or vice-versa (switching from ICAO flight type “N” to “S”7 or vice-versa). This misclassification issue creates very high peaks e.g. in October 2015 the charter segment surged to a 19% growth compared with the same month last year. The substantial growth was inflated by Wideroe which switched from filing its flights plans from scheduled to non-scheduled flights.
• The all-cargo segment has been mainly affected by the overall economic downturn. It is showing poor recovery signals as of January 2014 in line with most European economies.
• The business segment did not grow over the period 2012-2015. This segment was particularly affected by the economic uncertainties, losing market shares over time. The unfavourable
7 See Chapter 2 on the classification of market segments
Market Segments in European Air Traffic 2015
STATFOR Doc 581 DRAFT v0.4 20/07/16 EUROCONTROL/NMD/STATFOR Page 8
economic outlook in Europe changed business aviation users’ needs. Users are now willing to accept the offer provided by other segments.
4. MARKET SEGMENTS IN 2015 This section is aimed at giving the view of market segments in the most recent year with complete data coverage i.e. 2015. Growth is calculated on 2014. As mentioned above, we introduce the segments share in the TZs within Europe, with a particular focus on the busiest ones. We also analyse three operational elements that characterise the segments: aircraft type, main airports and airport pairs.
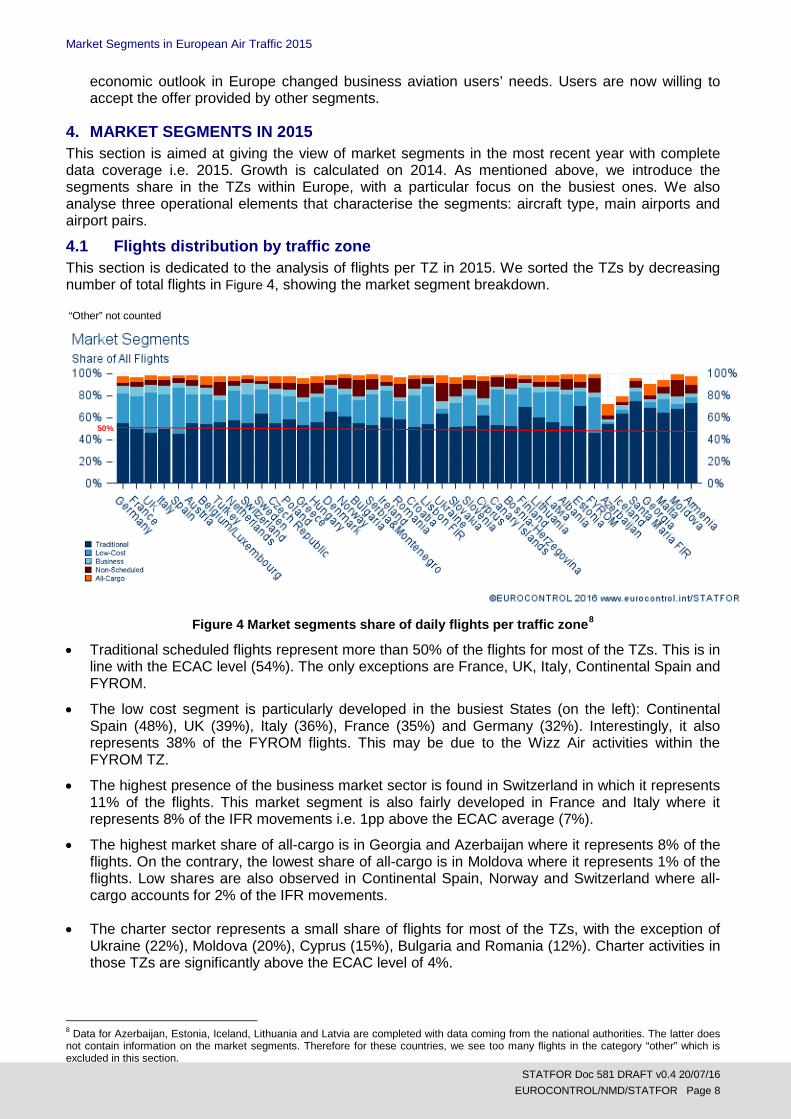
4.1 Flights distribution by traffic zone This section is dedicated to the analysis of flights per TZ in 2015. We sorted the TZs by decreasing number of total flights in Figure 4, showing the market segment breakdown.
Figure 4 Market segments share of daily flights per traffic zone8
• Traditional scheduled flights represent more than 50% of the flights for most of the TZs. This is in line with the ECAC level (54%). The only exceptions are France, UK, Italy, Continental Spain and FYROM.
• The low cost segment is particularly developed in the busiest States (on the left): Continental Spain (48%), UK (39%), Italy (36%), France (35%) and Germany (32%). Interestingly, it also represents 38% of the FYROM flights. This may be due to the Wizz Air activities within the FYROM TZ.
• The highest presence of the business market sector is found in Switzerland in which it represents 11% of the flights. This market segment is also fairly developed in France and Italy where it represents 8% of the IFR movements i.e. 1pp above the ECAC average (7%).
• The highest market share of all-cargo is in Georgia and Azerbaijan where it represents 8% of the flights. On the contrary, the lowest share of all-cargo is in Moldova where it represents 1% of the flights. Low shares are also observed in Continental Spain, Norway and Switzerland where all-cargo accounts for 2% of the IFR movements.
• The charter sector represents a small share of flights for most of the TZs, with the exception of Ukraine (22%), Moldova (20%), Cyprus (15%), Bulgaria and Romania (12%). Charter activities in those TZs are significantly above the ECAC level of 4%.
8 Data for Azerbaijan, Estonia, Iceland, Lithuania and Latvia are completed with data coming from the national authorities. The latter does not contain information on the market segments. Therefore for these countries, we see too many flights in the category “other” which is excluded in this section.
“Other” not counted
50%

Market Segments in European Air Traffic 2015
STATFOR Doc 581 DRAFT v0.4 20/07/16 EUROCONTROL/NMD/STATFOR Page 9
4.2 Flights distribution growth in the top ten busiest traffic zones In this section we analyse the flights distribution growth in the top ten busiest TZs in ECAC. Table 1 below ranks the TZs in terms of IFR movements including and excluding overflights:
Traffic zone Average
Daily IFR Movements (including overflights)
Rank Traffic zone Average
Daily IFR Movements (excluding overflights)
Germany 8,198 1 UK 5,280 France 7,900 2 Germany 5,010 UK 6,243 3 France 3,801 Italy 4,541 4 Spain 3,120 Spain 4,408 5 Italy 3,087 Turkey 3,647 6 Turkey 2,587 Netherlands 3,158 7 Netherlands 1,491 Austria 3,138 8 Switzerland 1,256 Belgium/Luxembourg 3,128 9 Belgium/Luxembourg 1,055 Switzerland 2,805 10 Austria 835
Table 1 Top ten busiest TZs in ECAC (“other” not counted), for all segments Figure 5 shows the annual growth per segment in the top ten busiest TZs.
Figure 5 IFR movements (excluding overflights) growth (2015 vs 2014) by market segment - busiest TZs
• The traditional scheduled segment registered robust growth in eight out of the ten busiest TZs. Germany and Italy are the only two exceptions where the traditional scheduled segment saw a slight decrease. Turkey showed the highest growth (9.7%) in traditional scheduled flights; this traffic zone was the biggest contributor to the network.
• Low-cost is the only segment experiencing strong growth in all ten busiest TZs, with the highest growth rate registered in Turkey (11.1%). In addition, low-cost flights grew more quickly than traditional flights in nine out of ten TZs (Continental Spain is the only exception).
• All-cargo registered very different growth rates between the busiest TZs. Particularly high growth rates were registered in Turkey and Austria, respectively about roughly 16% and 11% more flights. Negative growth was observed only in France and Continental Spain.
• The business aviation segment declined in all busiest TZs, with the exception of Belgium/Luxembourg. Even though European economies showed first signs of recovery since 2014, the business aviation segment is encountering some delay to recover. The unfavourable economic outlook strongly affected business aviation users.
• The charter segment recorded a decline in all the top ten busiest TZs. It is worth recalling that, in 2015, this sector was negatively affected by terrorist attacks and by a misclassification issue

Market Segments in European Air Traffic 2015
STATFOR Doc 581 DRAFT v0.4 20/07/16 EUROCONTROL/NMD/STATFOR Page 10
Figure 6 Flights per day in the 2015 top ten busiest TZ (including overflights)
Figure 6 shows the average movements per day in 2015 within the 10 busiest TZs in terms of IFR movements including overflights; in absolute terms: • The highest level of traditional flights is in Germany – 4,399 movements per day; • The highest level of low-cost flights is in France – 2,864 movements per day; • The highest level of business flights is in France – 680 movements per day; • The highest level of charter flights is in Turkey – 322 movements per day; and • The highest level of all-cargo flights is in Germany – 382 movements per day.
Figure 7 Flights per day in the 2015 top-ten busiest TZ (excluding overflights)
Figure 7 shows the average movements per day in 2015 within the 10 busiest TZs in terms of IFR movements excluding overflights; in absolute terms: • The highest level of traditional flights is in Germany – 2,618 movements per day; • The highest level of low-cost flights is in the UK – 2,317 movements per day; • The highest level of business flights is in France – 448 movements per day; • The highest level of charter flights is in Turkey – 210 movements per day; and • The highest level of all-cargo flights is in Germany – 263 movements per day. It is worth highlighting Germany as the main contributor to the network when we consider overflights and UK when we exclude them.
“Other” not counted
“Other” not counted

Market Segments in European Air Traffic 2015
STATFOR Doc 581 DRAFT v0.4 20/07/16 EUROCONTROL/NMD/STATFOR Page 11
4.3 Main aircraft types The aircraft used by an operator is a typical characteristic of a market segment. As describe above, the type of aircraft represents one of the criteria used by STATFOR in the market segments definition. Each aircraft type has a typical number of available seats linked to it. Nevertheless, this number varies from airline to airline and this is the reason why we use in this section the median seats per aircraft type as our “capacity” indicator. These are grouped in seat classes to case the comparisons.
• Low-cost and traditional scheduled segments have both a median of 150 seats in 2015, while the median for charter flights is 144. This reveals a preference for aircraft with high seat availability;
• Business aviation has a median of 10 seats, driven by the type of business they run;
Figure 8 shows the distribution of flights per seat class and market segment for 2014 and 2015 in the ECAC area. In terms of changes, we can distinguish two groups of segments:
1. The group of growing segments composed by low-cost and traditional flights; and 2. The group of decreasing segments composed by traditional and charter flights.
Group 1 is increasing the number of aircraft in the fleet whereas group 2 is reducing it.
Figure 8 Aircraft size per seat class and market segment in 2014 and 2015
With regard to the low-cost market segment, the increase in flights is linked to an increase in class D (101 to 150 seats) and class E (151 to 210 seats) aircraft. The growing number of class E aircraft for the traditional segment was driven by the need of reducing costs. More efficiency is gained today via higher the load factors.
The tables in Annex A refer to the top 10 aircraft in terms of 2015 average daily flights used by aircraft operators per each market segment.
Analysing the tables, we can highlight a general trend of traditional carriers increasing the use of bigger aircraft while reducing the flights of relatively smaller aircraft. This may represent an attempt by traditional carriers of rationalising the business while aligning it to the low-cost business model.

Market Segments in European Air Traffic 2015
STATFOR Doc 581 DRAFT v0.4 20/07/16 EUROCONTROL/NMD/STATFOR Page 12
4.4 Flights in the top ten busiest airports Each market segment has a very specific business model. Each segment tends to satisfy very different needs when choosing an airport where to concentrate operations. A table reporting each segment’s main business need(s) is reported below:
Segment Main Business Need(s) Traditional scheduled High transfer capabilities Low-cost Low-taxation mainly provided by secondary airports;
Main airports served with low frequencies Business aviation Business locations Charter Holiday destinations All-cargo Logistics facilities and possibility of night operations
Table 2 Market Segment Business Needs
Nevertheless, the latest evolutions in the aviation market saw low-cost carriers adapting their business to absorb part of the other segment’s market share. We can now observe low-cost flight departing and arriving to major cities, while offering an improved quality of service. In our analysis, we focus on the ten busiest airports in terms of IFR movements in 2015.
Rank Airport Average Daily IFR Departures
1 Paris CDG 652
2 London Heathrow 649
3 Frankfurt 641
4 Amsterdam 633
5 Istanbul Ataturk 621
6 Munich 517
7 Madrid Barajas 502
8 Rome Fiumicino 432
9 Barcelona 396
10 London Gatwick 367
Table 3 Top ten 2015 busiest ECAC airports
Given the importance of traditional scheduled and low-cost flights (a cumulated 82% of 2015 ECAC flights), we would expect those two segments to concentrate their operations in the busiest airports.
Figure 9 Market Segments distribution in 2015 busiest airports (order alphabetically)
Figure 9 shows the market segments distribution in the top ten busiest ECAC airports. The dominance of traditional scheduled carriers is striking. Traditional scheduled flights represent more than 50% of flights in eight out of the ten busiest airports. It is interesting to report that in Paris CDG, the busiest airport in 2015, the prominent segment is traditional scheduled (80%) followed by low-
Market Segments in European Air Traffic 2015
STATFOR Doc 581 DRAFT v0.4 20/07/16 EUROCONTROL/NMD/STATFOR Page 13
cost (12%); whereas in the 10th busy airport, London Gatwick, the prominent sector is low-cost (67%) followed by traditional scheduled (29%).
London Heathrow is almost exclusively composed by traditional scheduled flights (97%). All-cargo flights are particularly significant in Paris CDG (FedEx hub), Istanbul Ataturk and Frankfurt; they are underrepresented in the other airports listed above.
Business aviation and charter segments are not focusing their business in the busiest airport, as their shares are lower than the overall ECAC shares which are respectively 7% and 4%.
Market segments segregation is more visible when we analyse the distribution of flight in metropolitan areas: London, Paris, Rome, etc… Annex B reports the top fifteen airports for each market segment based on the average movements per day recorded in 2015. Taking London as an example, we can observe that traditional scheduled flights are concentrated in Heathrow, whereas low-cost and business aviation are concentrated respectively in Gatwick and Luton.
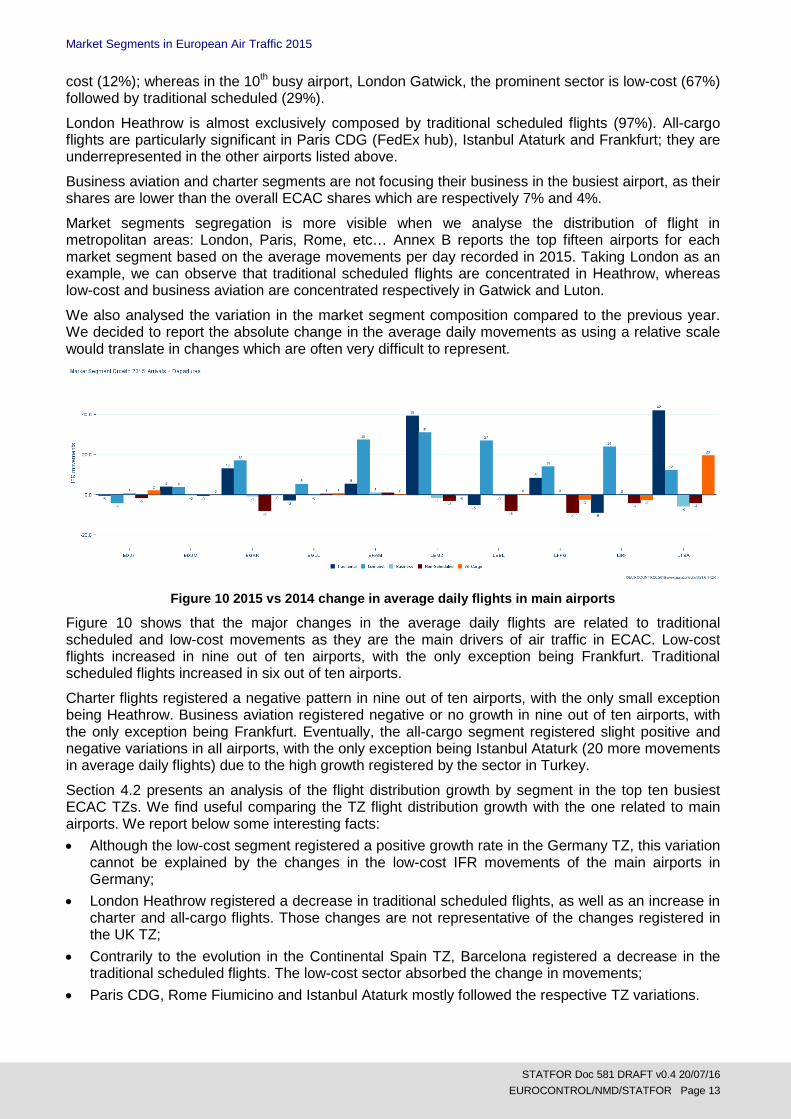
We also analysed the variation in the market segment composition compared to the previous year. We decided to report the absolute change in the average daily movements as using a relative scale would translate in changes which are often very difficult to represent.
Figure 10 2015 vs 2014 change in average daily flights in main airports
Figure 10 shows that the major changes in the average daily flights are related to traditional scheduled and low-cost movements as they are the main drivers of air traffic in ECAC. Low-cost flights increased in nine out of ten airports, with the only exception being Frankfurt. Traditional scheduled flights increased in six out of ten airports.
Charter flights registered a negative pattern in nine out of ten airports, with the only small exception being Heathrow. Business aviation registered negative or no growth in nine out of ten airports, with the only exception being Frankfurt. Eventually, the all-cargo segment registered slight positive and negative variations in all airports, with the only exception being Istanbul Ataturk (20 more movements in average daily flights) due to the high growth registered by the sector in Turkey.
Section 4.2 presents an analysis of the flight distribution growth by segment in the top ten busiest ECAC TZs. We find useful comparing the TZ flight distribution growth with the one related to main airports. We report below some interesting facts: • Although the low-cost segment registered a positive growth rate in the Germany TZ, this variation
cannot be explained by the changes in the low-cost IFR movements of the main airports in Germany;
• London Heathrow registered a decrease in traditional scheduled flights, as well as an increase in charter and all-cargo flights. Those changes are not representative of the changes registered in the UK TZ;
• Contrarily to the evolution in the Continental Spain TZ, Barcelona registered a decrease in the traditional scheduled flights. The low-cost sector absorbed the change in movements;
• Paris CDG, Rome Fiumicino and Istanbul Ataturk mostly followed the respective TZ variations.

Market Segments in European Air Traffic 2015
STATFOR Doc 581 DRAFT v0.4 20/07/16 EUROCONTROL/NMD/STATFOR Page 14
4.5 Main airports pairs This section analyses the main bi-directional flow of flights generated in European airports per market segment. The range of airports is quite diverse geographically. It is possible to note a particular concentration of flights in central Europe for all market segments, with the exception of charters which are more concentrated in East Europe. Each of the top fifteen most flown city pairs represents less than 1% of all the 2015 flights. Figure 11 graphically shows the most-flown city pairs in ECAC per market segment.
• The flows for low cost and traditional are mainly composed by internal connection within most trafficked Member States or connections between Member States main cities.
• The business and all-cargo sectors follow the economic trends between major business and trade cities.
• Given the variety in the traffic composition of the charter segment, routes vary with the type of flights e.g. training flights, helicopters, etc…
Figure 11 Busiest 15 airport pairs in ECAC per market segment in 2015 (bi-directional)
Information regarding the share of city-pairs and growth can be found in Annex C. The traditional sector shows negative or no growth when performing the same city pair as the low cost. Whereas the low-cost sector in the same city-pair registers substantial growth e.g. Istanbul-Ankara or Istanbul-Izmir. This could prove the partial shift of flights from traditional-scheduled to low-cost flights.

Market Segments in European Air Traffic 2015
STATFOR Doc 581 DRAFT v0.4 20/07/16 EUROCONTROL/NMD/STATFOR Page 15
A. Main aircraft types
Traditional Scheduled
Low-Cost
Aircraft Type Mvts/day Growth
(%) Share (%)
Typical Seats
Aircraft Type Mvts/day Growth
(%) Share (%)
Typical Seats
1 A320 2423.6 -2.10% 16.60% 150 1 B738 3001.5 6.70% 39.90% 167
2 A319 1402.9 -1.20% 9.60% 124 2 A320 1832.9 18.70% 24.40% 150
3 B738 1391.5 10.50% 9.50% 167 3 A319 1179 -3.50% 15.70% 124
4 A321 1073.4 6.40% 7.30% 186 4 DH8D 449.8 16.10% 6.00% 72
5 E190 878 14.10% 6.00% 108 5 A321 272.5 20.10% 3.60% 186
6 DH8D 396 -2.30% 2.70% 72 6 B737 131.8 -13.90% 1.80% 137
7 B737 392.3 -6.80% 2.70% 137 7 CRJ9 86.4 -16.30% 1.10% 86
8 B77W 389.3 13.30% 2.70% 342 8 B733 85 -36.00% 1.10% 137
9 AT75 344.2 14.00% 2.40% 72 9 B712 75.6 35.00% 1.00% 117
10 CRJ9 337.7 10.60% 2.30% 86 10 E170 60.9 -1.80% 0.80% 70
Other - - - 38.30% - Other - - - 4.50% -
Business Aviation
Charter
Aircraft Type Mvts/day Growth
(%) Share (%)
Typical Seats
Aircraft Type Mvts/day Growth
(%) Share (%)
Typical Seats
1 BE20 151.3 -2.60% 8.40% 14 1 A320 148 -17.30% 12.30% 150
2 C56X 149.1 -1.40% 8.30% 10 2 A321 128.6 -12.90% 10.70% 186
3 H25B 84.3 -14.70% 4.70% 8 3 B738 123.5 -18.80% 10.20% 167
4 F2TH 76.8 -3.50% 4.30% 19 4 S92 100.9 -6.00% 8.40% 19
5 PC12 76.1 10.30% 4.20% 8 5 B752 43.8 -42.70% 3.60% 183
6 C525 75.8 1.50% 4.20% 7 6 B734 43.1 1.80% 3.60% 144
7 C510 73.4 -2.90% 4.10% 6 7 B733 41.7 18.60% 3.50% 137
8 CL60 71.7 -5.00% 4.00% 19 8 EC25 37.7 3.90% 3.10% 4
9 C25A 68.2 -2.40% 3.80% 7 9 A139 32.6 -9.20% 2.70% 9
10 GLF5 62.9 -6.00% 3.50% 19 10 DH8A 32.1 3557% 2.70% 37
Other - - - 50.70% - Other - - - 38.10% -
All-Cargo
Aircraft Type Mvts/day Growth
(%) Share (%)
Typical Seats
1 B752 93.5 -1.20% 10.10% - 2 B733 89.5 -4.00% 9.70% - 3 B734 84.9 46.20% 9.20% - 4 A332 73.9 35.70% 8.00% - 5 B744 72.8 -4.70% 7.90% - 6 A306 61.3 13.10% 6.60% - 7 B77L 60.3 14.70% 6.50% - 8 ATP 51.1 -5.30% 5.50% - 9 B763 36 -3.50% 3.90% - 10 MD11 32.6 -8.20% 3.50% - Other - - - 28.90% -

Market Segments in European Air Traffic 2015
STATFOR Doc 581 DRAFT v0.4 20/07/16 EUROCONTROL/NMD/STATFOR Page 16
B. Main airports
Traditional
Airport Mvts/day Growth (%)
Share (%)
1 LONDON/HEATHROW 1249.9 -0.002 4.30%
2 FRANKFURT MAIN 1117.6 0 3.80%
3 PARIS CH DE GAULLE 1035.3 0.008 3.50%
4 ISTANBUL-ATATURK 997.6 0.044 3.40%
5 SCHIPHOL AMSTERDAM 920.4 0.006 3.10%
6 MUENCHEN 2 835.1 0.005 2.90%
7 MADRID BARAJAS 676.1 0.062 2.30%
8 ROME FIUMICINO 620.3 -0.014 2.10%
9 ZURICH 547.8 0.001 1.90%
10 COPENHAGEN KASTRUP 486.9 -0.008 1.70%
11 BRUSSELS NATIONAL 482.5 0.027 1.60%
12 WIEN SCHWECHAT 463.2 -0.029 1.60%
13 PARIS ORLY 454.4 -0.025 1.60%
14 STOCKHOLM-ARLANDA 448.1 -0.014 1.50%
15 OSLO/GARDERMOEN 397.2 -0.019 1.40%
Other - - - 63.00%
Low-Cost
Airport Mvts/day Growth (%)
Share (%)
1 BARCELONA 500.1 0.057 3.30%
2 LONDON/GATWICK 493.1 0.036 3.30%
3 LONDON/STANSTED 387.1 0.088 2.60%
4 DUESSELDORF 345.4 0.178 2.30%
5 ISTANBUL/SABIHA 342.5 0.136 2.30%
6 TEGEL-BERLIN 311.4 0.044 2.10%
7 PALMA DE MALLORCA 299.3 -0.001 2.00%
8 MANCHESTER 282.6 0.023 1.90%
9 SCHIPHOL AMSTERDAM 262.3 0.117 1.70%
10 MADRID BARAJAS 259.8 0.136 1.70%
11 ROME FIUMICINO 225.9 0.119 1.50%
12 ANTALYA 222.4 0.015 1.50%
13 LONDON/LUTON 220.1 0.138 1.50%
14 HAMBURG 208.8 0.018 1.40%
15 OSLO/GARDERMOEN 206.7 -0.066 1.40%
Other - - - 70.00%

Market Segments in European Air Traffic 2015
STATFOR Doc 581 DRAFT v0.4 20/07/16 EUROCONTROL/NMD/STATFOR Page 17
Business
Airport Mvts/day Growth (%)
Share (%)
1 PARIS LE BOURGET 123.7 -0.046 3.40%
2 GENEVE COINTRIN 81.3 -0.109 2.30%
3 NICE 75.9 -0.047 2.10%
4 LONDON/LUTON 71.1 0.015 2.00%
5 ZURICH 56.9 -0.004 1.60%
6 FARNBOROUGH CIV 55.4 -0.021 1.50%
7 MILANO LINATE 52.4 -0.015 1.50%
8 MOSKVA/VNUKOVO 47.8 -0.199 1.30%
9 ROMA CIAMPINO 41.8 -0.067 1.20%
10 WIEN SCHWECHAT 37.5 -0.064 1.00%
11 MUENCHEN 2 35.7 -0.002 1.00%
12 STUTTGART 31.1 -0.077 0.90%
13 BIGGIN HILL 30.8 0.04 0.90%
14 MADRID BARAJAS 29.4 -0.043 0.80%
15 CANNES MANDELIEU 28.6 0.001 0.80%
Other - - - 78.00%
Charter9
Airport Mvts/day Growth (%)
Share (%)
1 ANTALYA 139.6 -0.124 6.00%
2 DEN HELDER/DE KOOY 55 -0.072 2.40%
3 STAVANGER/SOLA 54.6 -0.035 2.40%
4 BERGEN/FLESLAND 46.5 0.157 2.00%
5 MOSKVA/DOMODEDOVO 45.9 -0.365 2.00%
6 HURGHADA 45.3 -0.181 2.00%
7 SHARM EL SHEIKH 37.9 -0.182 1.60%
8 PALMA DE MALLORCA 31.5 -0.085 1.40%
9 TEL AVIV/BEN GURION 27.2 -0.076 1.20%
10 BURGAS 25.7 -0.037 1.10%
11 COPENHAGEN KASTRUP 23.5 0.501 1.00%
12 LONDON/GATWICK 23.3 -0.256 1.00%
13 WARSZAWA/OKECIE 22.5 0.021 1.00%
14 NIKOS/KAZANTZAKIS 22.4 -0.165 1.00%
15 MANCHESTER 20.7 -0.23 0.90%
Other - - - 73.00%
9 Helicopter flights were not removed for this ranking, and non-ECAC airports include only ECAC flights.

Market Segments in European Air Traffic 2015
STATFOR Doc 581 DRAFT v0.4 20/07/16 EUROCONTROL/NMD/STATFOR Page 18
All-Cargo
Airport Mvts/day Growth (%)
Share (%)
1 LEIPZIG/HALLE 99.9 0.089 5.50%
2 ISTANBUL-ATATURK 87.2 0.291 4.80%
3 PARIS CH DE GAULLE 87 -0.025 4.70%
4 KOELN-BONN 74.7 0.05 4.10%
5 LIEGE/LIEGE 66.1 0.073 3.60%
6 EAST MIDLANDS 64.1 0.008 3.50%
7 FRANKFURT MAIN 59.7 0.039 3.30%
8 SCHIPHOL AMSTERDAM 39.4 0.008 2.20%
9 BRUSSELS NATIONAL 33.9 0.003 1.80%
10 LUXEMBOURG 26 0.02 1.40%
11 MILANO MALPENSA 24.9 0.136 1.40%
12 LONDON/STANSTED 24.1 -0.06 1.30%
13 BERGAMO/ORIO ALSERIO 23.8 0.042 1.30%
14 MARSEILLE PROVENCE 23.2 0 1.30%
15 ATHINAI E. VENIZELOS 21.3 -0.081 1.20%
Other - - - 59.00%

Market Segments in European Air Traffic 2015
STATFOR Doc 581 DRAFT v0.4 20/07/16 EUROCONTROL/NMD/STATFOR Page 19
C. Main airport pairs
Traditional
Airport 1 Airport 2 Mvts/day Growth (%)
Share (%)
1 ISTANBUL-ATATURK ANKARA-ESENBOGA 38.1 -4.50% 0.30%
2 LONDON/HEATHROW NEW YORK 38 2.30% 0.30%
3 ROME FIUMICINO MILANO LINATE 37.4 -0.20% 0.30%
4 LONDON/HEATHROW SCHIPHOL AMSTERDAM 37.1 1.60% 0.30%
5 LONDON/HEATHROW DUBLIN 37.1 -2.10% 0.30%
6 TOULOUSE BLAGNAC PARIS ORLY 37 -3.90% 0.30%
7 FRANKFURT MAIN LONDON/HEATHROW 35.1 0.70% 0.20%
8 LAS PALMAS TENERIFE NORTE 30.7 -5.60% 0.20%
9 FRANKFURT MAIN TEGEL-BERLIN 30 5.60% 0.20%
10 LAS PALMAS ARRECIFE LANZAROTE 29.8 0.40% 0.20%
11 NICE PARIS ORLY 29.4 3.10% 0.20%
12 ISTANBUL-ATATURK IZMIR-ADNAN-MENDERES 29.2 0.40% 0.20%
13 FRANKFURT MAIN HAMBURG 29 3.30% 0.20%
14 LA PALMA TENERIFE NORTE 28.9 2.00% 0.20%
15 LONDON/HEATHROW EDINBURGH 28.6 -10.90% 0.20%
Other - - - - 95.00%
Low-Cost
Airport 1 Airport 2 Mvts/day Growth (%)
Share (%)
1 KOELN-BONN TEGEL-BERLIN 28.9 -8.10% 0.40%
2 ISTANBUL/SABIHA ANTALYA 28.3 1.10% 0.40%
3 ISTANBUL/SABIHA IZMIR-ADNAN-MENDERES 27.9 11.90% 0.40%
4 ISTANBUL-ATATURK IZMIR-ADNAN-MENDERES 27.9 0.00% 0.40%
5 DUESSELDORF TEGEL-BERLIN 26.3 68.50% 0.30%
6 STUTTGART TEGEL-BERLIN 25 -4.50% 0.30%
7 LONDON/GATWICK BARCELONA 21 4.60% 0.30%
8 PALMA DE MALLORCA BARCELONA 21 9.60% 0.30%
9 ISTANBUL-ATATURK ANTALYA 19.6 -9.00% 0.30%
10 BERGEN/FLESLAND OSLO/GARDERMOEN 19.4 -5.40% 0.30%
11 TRONDHEIM/VAERNES OSLO/GARDERMOEN 19.3 -4.10% 0.30%
12 BARCELONA PARIS ORLY 18.4 13.70% 0.20%
13 ISTANBUL/SABIHA ANKARA-ESENBOGA 18.4 13.20% 0.20%
14 CATANIA FONTANAROSSA ROME FIUMICINO 17.8 -1.00% 0.20%
15 BARCELONA IBIZA 17.4 5.00% 0.20%
Other - - - - 94.00%

Market Segments in European Air Traffic 2015
STATFOR Doc 581 DRAFT v0.4 20/07/16 EUROCONTROL/NMD/STATFOR Page 20
Business
Airport 1 Airport 2 Mvts/day Growth (%)
Share (%)
1 PARIS LE BOURGET GENEVE COINTRIN 8.7 -21.20% 0.50%
2 ROMA CIAMPINO MILANO LINATE 5.8 -12.80% 0.30%
3 PARIS LE BOURGET NICE 4.8 -15.50% 0.30%
4 NICE MOSKVA/VNUKOVO 4.2 -21.90% 0.20%
5 NICE GENEVE COINTRIN 4.2 -6.30% 0.20%
6 LONDON/LUTON PARIS LE BOURGET 3.8 10.40% 0.20%
7 FARNBOROUGH CIV PARIS LE BOURGET 3 -2.20% 0.20%
8 TRONDHEIM/VAERNES OSLO/GARDERMOEN 2.9 2.40% 0.20%
9 LUBECK-BLANKENSEE LAAGE 2.9 24.20% 0.20%
10 BRISTOL/LULSGATE BARROW/WALNEY ISLAND 2.9 4.20% 0.20%
11 LONDON/LUTON NICE 2.8 -0.60% 0.20%
12 MADRID BARAJAS BARCELONA 2.7 -10.10% 0.10%
13 OUESSANT BREST-GUIPAVAS 2.7 -0.60% 0.10%
14 PARIS LE BOURGET MILANO LINATE 2.7 -8.10% 0.10%
15 FARNBOROUGH CIV BARROW/WALNEY ISLAND 2.7 5.70% 0.10%
Other - - - - 90.00%
Charter
Airport 1 Airport 2 Mvts/day Growth (%)
Share (%)
1 ANTALYA MOSKVA/DOMODEDOVO 10.6 -18.50% 0.90%
2 GUERNSEY ALDERNEY 10.3 -15.70% 0.90%
3 HURGHADA MOSKVA/DOMODEDOVO 7.8 -29.60% 0.60%
4 STAVANGER/SOLA EKOFISK L 7.5 97.60% 0.60%
5 BRAUNSCHWEIG INGOLSTADT 6.5 0.50% 0.50%
6 ANTALYA MOSKVA/SHEREMETYEVO 6.4 -10.10% 0.50%
7 SHARM EL SHEIKH MOSKVA/DOMODEDOVO 5.9 -40.40% 0.50%
8 DEN HELDER/DE KOOY EH OIL PLATFORM 5.1 38.80% 0.40%
9 ANTALYA KIEV - BORISPOL 4.8 8.40% 0.40%
10 SOUTHAMPTON ALDERNEY 4.6 -28.20% 0.40%
11 ANTALYA SANKT-PETERBURG 4.2 -16.00% 0.30%
12 SHARM EL SHEIKH KIEV - BORISPOL 4 1.40% 0.30%
13 ANTALYA MOSKVA/VNUKOVO 3.9 -6.60% 0.30%
14 ANTALYA YEKATERINBURG 3.8 -9.50% 0.30%
15 BRUSSELS NATIONAL ANTALYA 3.6 -13.20% 0.30%
Other - - - - 78.00%

Market Segments in European Air Traffic 2015
STATFOR Doc 581 DRAFT v0.4 20/07/16 EUROCONTROL/NMD/STATFOR Page 21
All-Cargo
Airport 1 Airport 2 Mvts/day Growth (%)
Share (%)
1 BELFAST/ALDERGROVE EAST MIDLANDS 9.8 0.20% 1.10%
2 LEIPZIG/HALLE EAST MIDLANDS 7.5 3.60% 0.80%
3 EAST MIDLANDS EDINBURGH 7.1 -0.50% 0.80%
4 KOELN-BONN PARIS CH DE GAULLE 6 -0.90% 0.60%
5 BRUSSELS NATIONAL LEIPZIG/HALLE 5.7 2.00% 0.60%
6 MARSEILLE PROVENCE PARIS CH DE GAULLE 5.3 23.40% 0.60%
7 KOELN-BONN EAST MIDLANDS 5.3 -4.80% 0.60%
8 MAKEDONIA ATHINAI E. VENIZELOS 5.1 -1.60% 0.60%
9 INCHEON INTERNATIONAL FRANKFURT MAIN 4.8 2.00% 0.50%
10 LIEGE/LIEGE EAST MIDLANDS 4.8 2.10% 0.50%
11 SHANGAI PUDONG FRANKFURT MAIN 4.2 55.30% 0.50%
12 TEL AVIV/BEN GURION ISTANBUL-ATATURK 4 2.00% 0.40%
13 FRANKFURT MAIN ISTANBUL-ATATURK 3.9 18.50% 0.40%
14 LEIPZIG/HALLE BERGAMO/ORIO ALSERIO 3.8 -4.40% 0.40%
15 FRANKFURT MAIN CHICAGO O HARE INTL 3.8 23.60% 0.40%
Other - - - - 86.00%
Market Segments in European Air Traffic 2015
STATFOR Doc 581 DRAFT v0.4 20/07/16 EUROCONTROL/NMD/STATFOR Page 22
D. Glossary Acronyms ECAC European Civil Aviation Conference EDDF Frankfurt EDDM Munich EGKK London Gatwick EGLL London Heathrow EHAM Amsterdam EKCH Copenhagen IFR Instrument Flight Rules LEMD Madrid Barajas LFPG Paris CDG LTBA Istanbul Atatürk NM Network Manager

Market Segments in European Air Traffic 2015
STATFOR Doc 581 DRAFT v0.4 20/07/16 EUROCONTROL/NMD/STATFOR Page 23
ECAC The European Civil Aviation Conference (ECAC) is an intergovernmental organisation which was established by ICAO and the Council of Europe. ECAC now totals 44 members, including all 28 EU, 31 of the 32 European Aviation Safety Agency member states, and all 41 EUROCONTROL Member States.
© European Organisation for the Safety of Air Navigation (EUROCONTROL) 2016 This document is published by EUROCONTROL in the interests of exchange of information. It may be copied in whole or in part, providing that the copyright notice and disclaimer are included. The information contained in this document may not be modified without prior written permission from EUROCONTROL. EUROCONTROL makes no warranty, either implied or express, for the information contained in this document, neither does it assume any legal liability or responsibility for the accuracy, completeness or usefulness of this information. For further information please contact, STATFOR, the EUROCONTROL Statistics and Forecast Service [email protected] http://www.eurocontrol.int/statfor
STATFOR, the EUROCONTROL Statistics and Forecast Service is ISO 9001:2008 certified.


![Estimating Road Segments Using Natural Point ...segments”-contest [6] was organized with the task of averaging segments of GPS trajectories to predict road segments while including](https://static.fdocuments.us/doc/165x107/60cfe59c42219c07ae1490d1/estimating-road-segments-using-natural-point-segmentsa-contest-6-was-organized.jpg)


