Market segmentation, marketing communication strategies and …998548/... · 2016-09-29 ·...
48
KFB-Rapport 2000:18 Market segmentation, Market segmentation, Market segmentation, Market segmentation, Market segmentation, marketing communication marketing communication marketing communication marketing communication marketing communication str str str str strategies and ategies and ategies and ategies and ategies and electric vehicle drive electric vehicle drive electric vehicle drive electric vehicle drive electric vehicle drive Anita Gärling, WET, CTH
Transcript of Market segmentation, marketing communication strategies and …998548/... · 2016-09-29 ·...
KFB-Rapport 2000:18
Market segmentation,Market segmentation,Market segmentation,Market segmentation,Market segmentation,marketing communicationmarketing communicationmarketing communicationmarketing communicationmarketing communication
strstrstrstrstrategies andategies andategies andategies andategies andelectric vehicle driveelectric vehicle driveelectric vehicle driveelectric vehicle driveelectric vehicle drive
Anita Gärling, WET, CTH
8-8)0 �WZIRWO� Marknadssegmentering,marknadsföringsstrategier och användning avelbil8-80) �)RKPMWL� Market segmentation,marketing communication strategies and electricvehicle drive
*Ó6*%88%6)�%98,36
Anita Gärling, WET, CTH7)6-)�7)6-)7
-7&2 91-88371-73-5-772 1104-262149&0-')6-2+7(%891�(%8)
49&0-7,)(
June 200098+-:%6)�49&0-7,)6
KFB – Kommunikationsforskningsberedningen,Stockholm/*&W (26 1999-0763
KFB-Rapport 2000:18
6)*)6%8 �7]JXI� 1IXSH� 6IWYPXEX�
Ett första syfte med rapporten var att söka identifiera specifika grupper av troliga köpare av de elbilarsom idag finns tillgängliga på den svenska bilmarknaden genom mätning av olika sociodemografiska,psykografiska och beteendemässiga variabler. Ett andra syfte var att studera hur inställning till elbilensolika produktattribut, och viljan att ändra resbeteende i syfte att passa dessa, påverkas av olikamarknadsföringsstrategier. Ett tredje, och sista syfte, var att studera hur vanliga familjer använder enelbil i sitt dagliga resande. Resultaten visade att hur elbilen upplevdes var beroende av hur desskompatibilitet, fördelar och säkerhet uppfattades, av personliga egenskaper som innovationsförmåga,miljöengagemang och kunskap och av kön, inkomst och eget bilinnehav och att viljan att köpa en elbil, isin tur, var beroende av upplevelsen av elbilen. På basis av hur elbilen upplevdes urskiljdes fyra olikamarknadssegment. Vidare visade resultaten att ett webbaserat marknadsföringsprogram, M-EV99,resulterade i de mest positiva inställningarna till elbilen. Slutligen visade resultaten att de familjer somanvände en elbil i sitt dagliga resande gjorde detta utan några större problem. Även om familjerna ansågatt den använda elbilen hade uppfyllt deras resbehov och förväntningar tyckte de att räckvidden hadekunnat vara längre och att lastutrymmet hade kunnat vara större. Trots det användes elbilen, underundersökningsperioden, i ungefär 40 % av totala antalet körda kilometrar, i ungefär 50 % av totalaantalet genomförda resor och vid alla typer av resor.
%&786%'8 �%MQ� 1IXLSH� 6IWYPXW�
A first aim of this report was to identify specific groups of potential costumers of a state-of-the-artelectric vehicle. Socio-demographic, psycho-graphic and behavioural variables were included in aquestionnaire to identify specific market segments. A second aim was to compare the effect of threedifferent marketing communication strategies on the electric vehicle’s perceived product attributes andinclination to change travel behaviour according to these attributes. Finally, the last aim was to studyhow families in daily travel use an electric vehicle. The results show that attitudes towards the electricvehicle depend upon how the vehicles’ compatibility, perceived advantage and safety are evaluated, ofpersonal traits like innovativeness, environmental concern, and knowledge, and of background variableslike gender, income, and number of vehicles, and that the intention to buy an electric vehicle, in turn,heavily depends on the attitude towards the vehicle. Based on attitude responses four different marketingsegments were distinguished. Furthermore, the results show that an information acceleration strategy,the M-EV99 program, elicited the most favourable responses towards the electric vehicle. Finally, theresults show that the families that had tried an electric vehicle for daily travel had no major problems inusing the vehicle. Furthermore, they stated that the vehicle had fulfilled their travel needs andexpectations even though they thought that the vehicle’s driving range was too short and that it’s cargocapacity was too small. In spite of this the electric vehicle was used in about 40 % of the total of drivendistances, in about half of the total number of trips made, and for all kinds of trips.
I Kommunikationsforskningsberedningens – KFB – publikationsserier redovisar forskare sina projekt. Publiceringeninnebär inte att KFB tar ställning till framförda åsikter, slutsatser och resultat.
KFB-rapporter försäljs genom Fritzes Offentliga Publikationer, 106 47 Stockholm. Tel: 08-690 91 90, fax: 08-690 9191, e-post: [email protected] internet: www.fritzes.seÖvriga KFB-publikationer beställs och erhålls via KFB.. Man kan dessutom abonnera på tidningen KFB-Kommuniké.
KFB Reports are sold through Fritzes’, S-106 47 Stockholm.Other KFB publications are ordered directly from KFB
MARKET SEGMENTATION , MARKETING
COMMUNICATION STRATEGIES AND
ELECTRIC VEHICLE DRIVE
Anita GärlingWater Environment Transport
Chalmers University of TechnologyGöteborg, Sweden
M ARCH 2000
2
BRIEF CONTENTS
1. INTRODUCTION................................................................................................3
2. RENEWED INTEREST IN ELECTRIC VEHICLES....................................................3
3. THE ELECTRIC VEHICLE AND THE ENVIRONMENT.............................................6
4. FUTURE ELECTRIC VEHICLES...........................................................................7
5. EARLIER RESEARCH........................................................................................85.1 BEHAVIORAL TRAVEL ANALYSIS .............................................................85.2 ATTITUDES AND CONSUMER PREFERENCES..............................................95.3 FREE TRIALS .........................................................................................10
6. MARKET SEGMENTATION ..............................................................................106.1 SUBJECTS..............................................................................................106.2 MEASUREMENT SCALES.........................................................................116.3 RESULTS...............................................................................................146.4 SUMMARY .............................................................................................23
7. MARKETING COMMUNICATION STRATEGIES...................................................237.1 SUBJECTS..............................................................................................247.2 INFORMATION ACCELERATION...............................................................257.3 SHOW ROOM VISITS..............................................................................287.4 FREE TRIALS .........................................................................................287.5 COMPARING MARKETING COMMUNICATION STRATEGIES.......................28
8. ELECTRIC VEHICLE DRIVE.............................................................................318.1 EXPECTATIONS......................................................................................328.2 TRIP AND RECHARGE LOGS....................................................................328.3 PERCEIVED PRODUCT ATTRIBUTES........................................................348.4 EXPERIENCES........................................................................................358.5 SUMMARY .............................................................................................36
9. CONCLUDING REMARKS................................................................................37
10. ACKNOWLEDGEMENTS..................................................................................38
11. REFERENCES.................................................................................................40
APPENDIX...........................................................................................................42
3
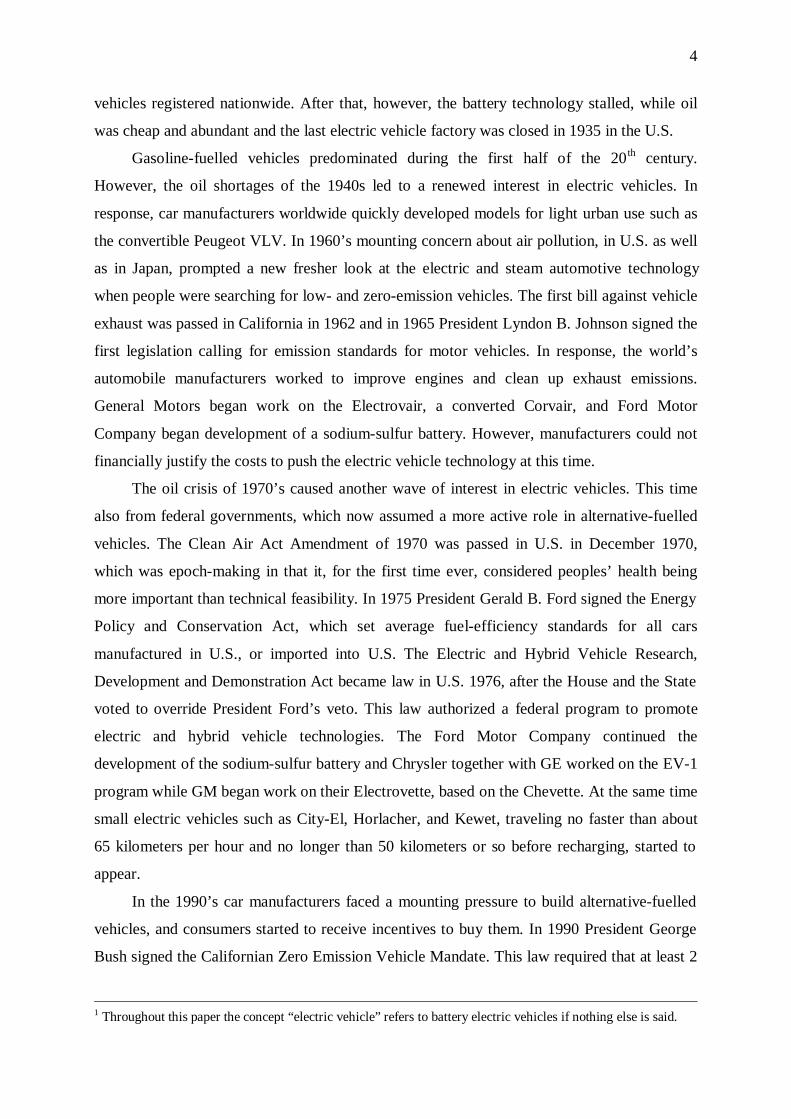
1. INTRODUCTION
Since the heydays of the electric vehicles1 in the beginning of the 20th century people,
time and time again, have shown renewed interest in electric vehicles, especially since the oil
crisis in the 1970’s. There have been three main reasons for this, the air pollution, the fact that
oil is a finite resource, and the demand for reduced CO2 emissions.
The first reason became a societal issue in the 1970’s in response to the increasing
pollution worldwide from road traffic and factories. At this time the Muskie Law was passed
in the United States. This required decreased levels of CO, HC, and NOx exhausts in
automobiles; otherwise they could not be sold or imported. The second originates from
societal demands for alternative energy sources and was spurred by the oil-crisis. This sense
of urgency has diminished somewhat because of the current state of oil supply and demand.
Nevertheless, considering that oil is a finite resource, and will someday disappear, the finding
of sustainable alternative energies is perhaps the most important issue facing the world in the
long run. Finally, the third reason is a more recent issue, which will certainly become even
more pressing in the future.
In this context, the electric vehicles should be very promising because there is a wide
range of sources of electricity. However, there are, at least, two main obstacles present. The
first is to find the optimal battery technology and the second to get the market to accept the
new automobile technology.
2. RENEWED INTEREST IN ELECTRIC VEHICLES
Thomas Davenport built the world’s first electric vehicle in 1834 while the first
gasoline-powered automobile not was built until 1885. The energy source in the first electric
vehicle was a rechargeable lead battery, developed by the French scientist Gaston Plante. In
the 1890’s electric vehicles became a favored mode of transportation for affluent American
city-dwellers. The first American battery-powered automobile was built in Des Moines, Iowa
and at the Chicago World’s Fair in 1893 visitors could rent electric “carriages” to carry them
through the grounds of the Fair. The years between 1900 and 1910 were the golden age of
alternative-fuel vehicles in U.S. Of some 4,200 automobiles sold in the United States in 1900
about 40 % were steam-powered, 38% electric, and the rest had internal combustion engines.
In 1912 electric vehicle ownership reached its historic peak in the U.S. with nearly 34,000
4
vehicles registered nationwide. After that, however, the battery technology stalled, while oil
was cheap and abundant and the last electric vehicle factory was closed in 1935 in the U.S.
Gasoline-fuelled vehicles predominated during the first half of the 20th century.
However, the oil shortages of the 1940s led to a renewed interest in electric vehicles. In
response, car manufacturers worldwide quickly developed models for light urban use such as
the convertible Peugeot VLV. In 1960’s mounting concern about air pollution, in U.S. as well
as in Japan, prompted a new fresher look at the electric and steam automotive technology
when people were searching for low- and zero-emission vehicles. The first bill against vehicle
exhaust was passed in California in 1962 and in 1965 President Lyndon B. Johnson signed the
first legislation calling for emission standards for motor vehicles. In response, the world’s
automobile manufacturers worked to improve engines and clean up exhaust emissions.
General Motors began work on the Electrovair, a converted Corvair, and Ford Motor
Company began development of a sodium-sulfur battery. However, manufacturers could not
financially justify the costs to push the electric vehicle technology at this time.
The oil crisis of 1970’s caused another wave of interest in electric vehicles. This time
also from federal governments, which now assumed a more active role in alternative-fuelled
vehicles. The Clean Air Act Amendment of 1970 was passed in U.S. in December 1970,
which was epoch-making in that it, for the first time ever, considered peoples’ health being
more important than technical feasibility. In 1975 President Gerald B. Ford signed the Energy
Policy and Conservation Act, which set average fuel-efficiency standards for all cars
manufactured in U.S., or imported into U.S. The Electric and Hybrid Vehicle Research,
Development and Demonstration Act became law in U.S. 1976, after the House and the State
voted to override President Ford’s veto. This law authorized a federal program to promote
electric and hybrid vehicle technologies. The Ford Motor Company continued the
development of the sodium-sulfur battery and Chrysler together with GE worked on the EV-1
program while GM began work on their Electrovette, based on the Chevette. At the same time
small electric vehicles such as City-El, Horlacher, and Kewet, traveling no faster than about
65 kilometers per hour and no longer than 50 kilometers or so before recharging, started to
appear.
In the 1990’s car manufacturers faced a mounting pressure to build alternative-fuelled
vehicles, and consumers started to receive incentives to buy them. In 1990 President George
Bush signed the Californian Zero Emission Vehicle Mandate. This law required that at least 2
1 Throughout this paper the concept “electric vehicle” refers to battery electric vehicles if nothing else is said.
5
percent of all new cars sold in the state by car manufacturers selling more than 35,000
vehicles per year (Chrysler, GM, Honda, Ford, Mazda, Nissan, and Toyota) by 1998 must
produce no emissions. A requirement that means, in effect, that the autos must be electric
powered. Furthermore, the percentage would in 2001 be increased to 5 % and in 2003 to 10
%. In April 1990 General Motors Corporation Chairman Roger Smith announced that GM
will mass-produce the electric Impact auto by the mid-1990’. In 1992 Chrysler, Ford, and GM
formed the United States Council for Automotive Research to foster non-competitive research
in areas of common interest. During the years 1994 to 1996 an 18 month Preview Drive
Program was launched by GM allowing several hundred drivers in 11 cities to test drive the
Impact EV for two-week periods (Golob & Gould, 1998). Furthermore, in 1996 GM
announced that EV1, the first specifically designed electric vehicle, would be available to the
public late the same year. At the same time the American Honda Motor Company and Toyota
Motor Sales, USA announced that they would start to market electric vehicles in U.S. in 1997
or beginning of 1998.
In 1996 the California Air Research Board changed the decision with respect to zero
emission vehicles. The requirement of 2 % sold zero emission vehicles in 1998 and 5 % from
2001 by major car manufacturers was abounded while the requirement of 10 % sold from
2003 was kept. But now also car manufacturers selling 3,001 to 35,000 vehicles per year also
were targeted. Furthermore, of these 10 %, 60 % could be nearly equivalent zero emission
vehicles. In response, many car manufacturers are developing, or have developed, at least one
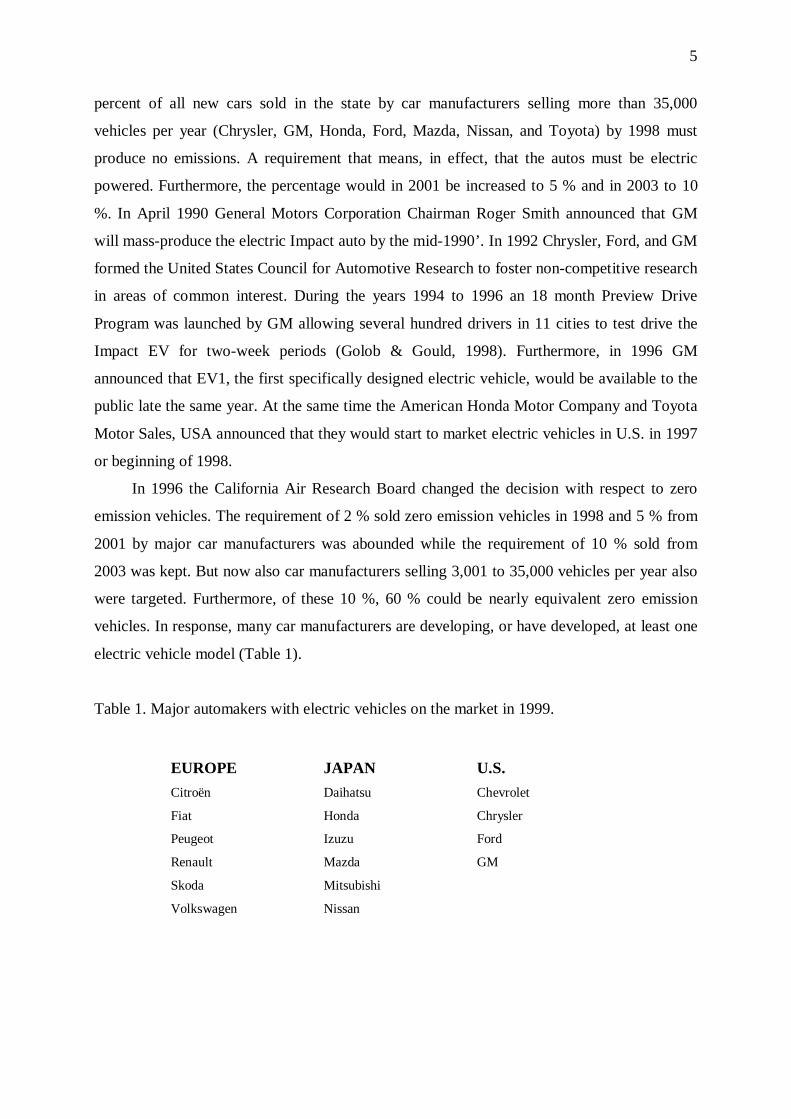
electric vehicle model (Table 1).
Table 1. Major automakers with electric vehicles on the market in 1999.
EUROPE JAPAN U.S.
Citroën Daihatsu Chevrolet
Fiat Honda Chrysler
Peugeot Izuzu Ford
Renault Mazda GM
Skoda Mitsubishi
Volkswagen Nissan
6
3. THE ELECTRIC VEHICLE AND THE ENVIRONMENT
To meet the call for a sustainable development, introduced in the Brundtland
Commission “Our Common Future” (1987) and further elaborated at the Rio Conference
(1992) and at the Kyoto Conference (1997), also within the area of transportation,
development of clean car technologies as well as selection of alternative-fuels are of most
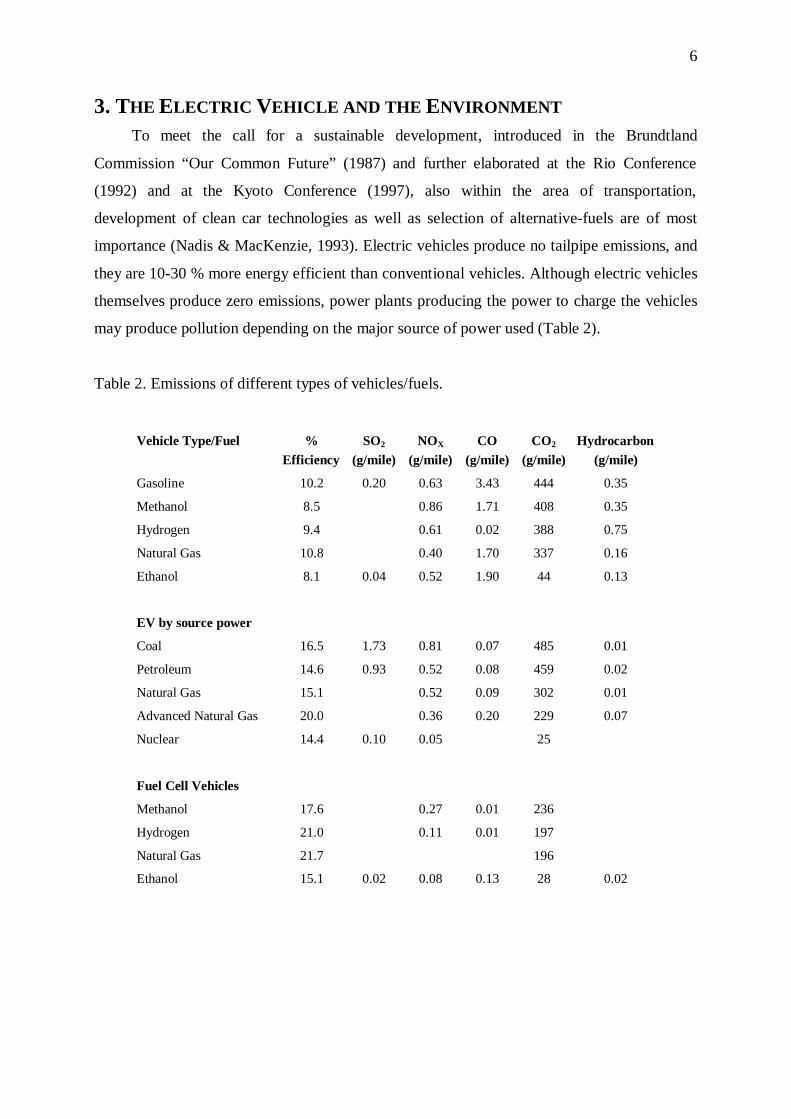
importance (Nadis & MacKenzie, 1993). Electric vehicles produce no tailpipe emissions, and
they are 10-30 % more energy efficient than conventional vehicles. Although electric vehicles
themselves produce zero emissions, power plants producing the power to charge the vehicles
may produce pollution depending on the major source of power used (Table 2).
Table 2. Emissions of different types of vehicles/fuels.
Vehicle Type/Fuel %Efficiency
SO2
(g/mile)NOX
(g/mile)CO
(g/mile)CO2
(g/mile)Hydrocarbon
(g/mile)
Gasoline 10.2 0.20 0.63 3.43 444 0.35
Methanol 8.5 0.86 1.71 408 0.35
Hydrogen 9.4 0.61 0.02 388 0.75
Natural Gas 10.8 0.40 1.70 337 0.16
Ethanol 8.1 0.04 0.52 1.90 44 0.13
EV by source power
Coal 16.5 1.73 0.81 0.07 485 0.01
Petroleum 14.6 0.93 0.52 0.08 459 0.02
Natural Gas 15.1 0.52 0.09 302 0.01
Advanced Natural Gas 20.0 0.36 0.20 229 0.07
Nuclear 14.4 0.10 0.05 25
Fuel Cell Vehicles
Methanol 17.6 0.27 0.01 236
Hydrogen 21.0 0.11 0.01 197
Natural Gas 21.7 196
Ethanol 15.1 0.02 0.08 0.13 28 0.02
7
Still, electric vehicles are the cleanest car technology of today. Moreover, electric
vehicles have fewer moving parts and a simpler engine, which makes maintenance cheaper
than in conventional and other alternative-fuelled vehicles. Also the sound pollution is
minimized. Other benefits of electric vehicles are, at least for most countries, that they reduce
dependence of foreign oil states, increase air quality, and, thereby, reduce damages on man
and nature.
4. FUTURE ELECTRIC VEHICLES
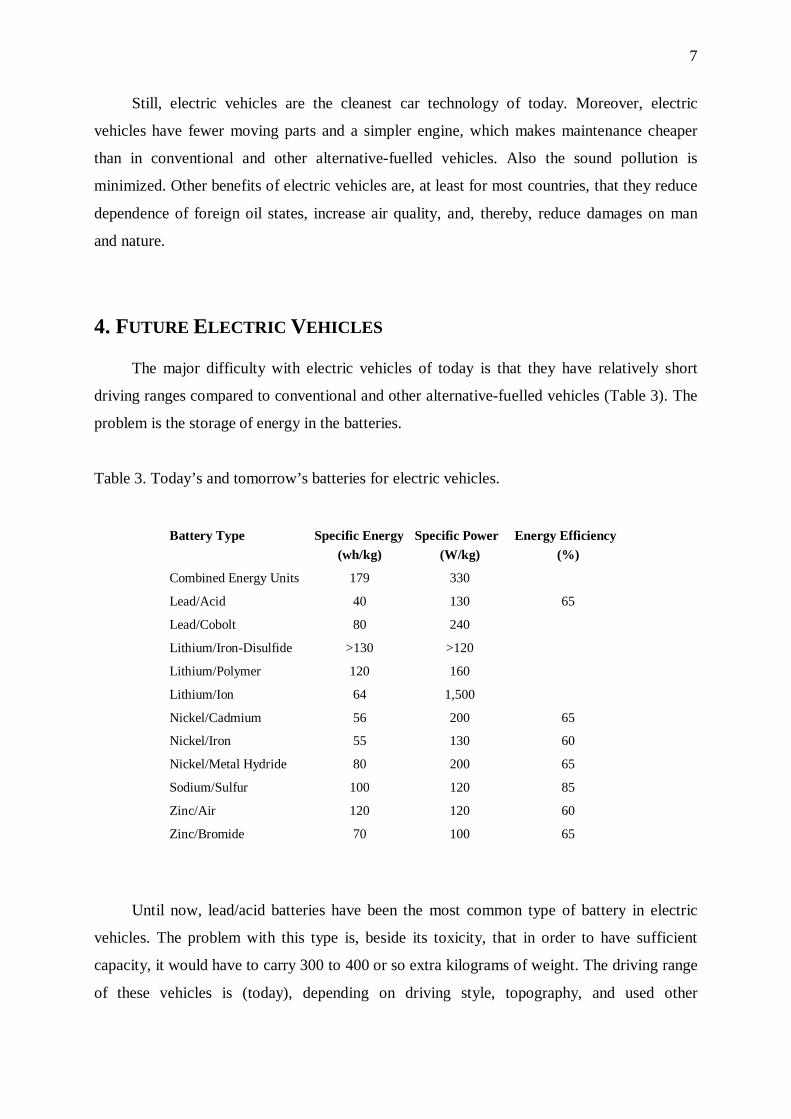
The major difficulty with electric vehicles of today is that they have relatively short
driving ranges compared to conventional and other alternative-fuelled vehicles (Table 3). The
problem is the storage of energy in the batteries.
Table 3. Today’s and tomorrow’s batteries for electric vehicles.
Battery Type Specific Energy(wh/kg)
Specific Power(W/kg)
Energy Efficiency(%)
Combined Energy Units 179 330
Lead/Acid 40 130 65
Lead/Cobolt 80 240
Lithium/Iron-Disulfide >130 >120
Lithium/Polymer 120 160
Lithium/Ion 64 1,500
Nickel/Cadmium 56 200 65
Nickel/Iron 55 130 60
Nickel/Metal Hydride 80 200 65
Sodium/Sulfur 100 120 85
Zinc/Air 120 120 60
Zinc/Bromide 70 100 65
Until now, lead/acid batteries have been the most common type of battery in electric
vehicles. The problem with this type is, beside its toxicity, that in order to have sufficient
capacity, it would have to carry 300 to 400 or so extra kilograms of weight. The driving range
of these vehicles is (today), depending on driving style, topography, and used other
8
electrically powered components in the vehicle, limited to between 140 and 280 kilometer per
charge. Nickel/cadmium, nickel/iron, and sodium/sulfur batteries have all received
considerable attention but have not turned out as very promising due to high operating
temperatures, loss of considerable amount of energy if left unused, and corrosion (Sperling,
1996). Both zinc/air and zinc/bromide batteries are high in energy but low in power density
and the former is also relatively expensive.
For the immediate future, nickel/metal hydride and lithium-based batteries are the most
promising contenders because of their long life, non-toxicity, relative cheapness, and high
performance. Other interesting options are lead/cobolt, combined energy units (ultracapacitors
and aluminium/air or zinc/air and lead/acid and nickel metal hydride batteries) because of
their ability to rapidly charge without overheating, high performance, faster acceleration, and
climbing ability. Also fuel cells are of interest because they are energy efficient, non-
polluting, quiet operating, have long range and fast re-fuelling.
One key to the future of electric vehicles is improved battery performance. Although
still inferior to gasoline engines in cost and range on a single charge, the new types of
batteries; nickel/metal hydride, lithium-based, lead/cobolt, and combined energy units, hold
promise for the future. Most major car manufacturers already have concept vehicles for the
future but most needed here is a technological breakthrough with respect to battery
technology like from transportation by horse to auto, from steam to diesel power, or from
diesel to electricity.
5. EARLIER RESEARCH
5.1 BEHAVIORAL TRAVEL ANALYSIS
In order to determine the possibility of future use of electric vehicles researchers have
mainly used behavior travel analysis. Deshpande (1984) showed that approximately 60% of
households in North America would be able to use an electric vehicle for daily travel as much
as on 348 days in a year. Nesbitt, et al (1992) found that 28 million household in the United
States would be able to substitute their own gasoline-powered auto with an electric vehicle
with a driving range of about 110 kilometers without making any changes in their current
travel behavior. Gärling, et al (1996) showed that 93.2% of travels made during one week
9
with gasoline-powered autos by households in Sweden could be substituted with an electric
vehicle with a driving range of 100 kilometers.
5.2 ATTITUDES AND CONSUMER PREFERENCES
Although the most conservative estimates indicate that electric vehicles can be
substituted for gasoline-powered autos in a substantial number of daily travel, attitude surveys
and consumer-preference studies have shown that only between 8 % and 24 % of consumers
are interested in actually buying an electric vehicle (Power & Associates, 1993). In stated-
choice studies in which subjects choose between gasoline and alternative-fuelled autos, it is
similarly found that very few (0-2%) chose an electric vehicle (Beggs et al., 1981; Bunch et
al., 1993). In Austria about 25 % of a random sample of car drivers and non-car drivers stated
that they could imagine themselves buying an electric vehicle within the next years (Fessel,
1995). Approximately 49 % of car users in Montreal, Canada reported that they were
interested in buying an electric vehicle with a driving range of, at least, 300 kilometers, a max
speed of 100 kilometers per hour, and a recharging time of, at most, 6 hours (Chéron & Zins,
1997). Urban et al (1996) showed that 53 % of a random sample of car purchasers not
opposing environmental friendly vehicles and limited driving range were interested in buying
an electric vehicle. The 1997 National Automotive Consumer Study in U.S. revealed that
about 31 % of a sample of randomly assigned subjects stated that they would definitely, or
probably, consider buying an electric vehicle if it was available in their area.
However, in the above reported studies the subjects stated attitudes and intentions to
buy without any experience of electrical vehicles. Turrentine & Kurani (1992) showed that
when consumers know little, or nothing, about the electric drivetrain technology, their
preferences might be negatively influenced by unfamiliarity. Would more informed subjects
be more positive towards electric vehicles? In two studies families were given a free trial
period of 2 weeks (Golob & Gould, 1998; Gärling et al, 1997). Golob & Gould (1998)
concluded that personal experience with electric vehicles did not change the subjects’
perceptions of desired driving range. Nor did the results in Gärling et al (1997) strongly
support the hypothesis that personal experience with electric vehicles make subjects more
positive towards electric vehicles. However, a 2-week free trial period might be too short to
really affect held opinions
10
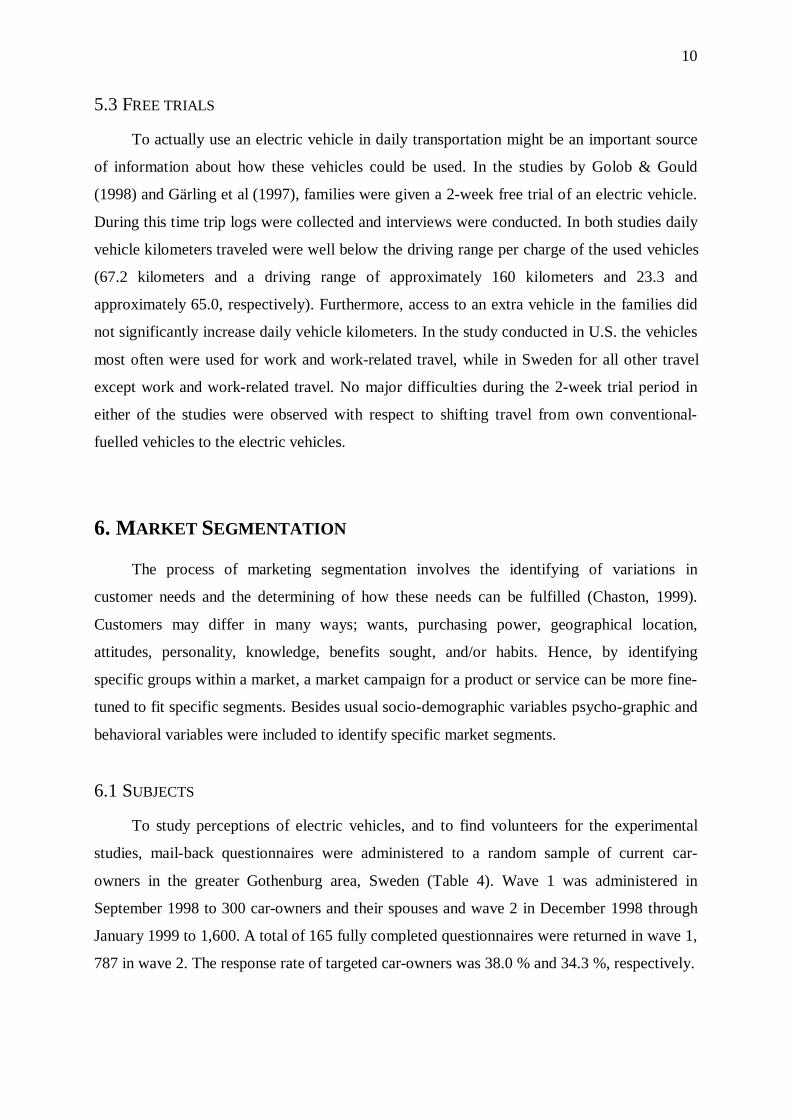
5.3 FREE TRIALS
To actually use an electric vehicle in daily transportation might be an important source
of information about how these vehicles could be used. In the studies by Golob & Gould
(1998) and Gärling et al (1997), families were given a 2-week free trial of an electric vehicle.
During this time trip logs were collected and interviews were conducted. In both studies daily
vehicle kilometers traveled were well below the driving range per charge of the used vehicles
(67.2 kilometers and a driving range of approximately 160 kilometers and 23.3 and
approximately 65.0, respectively). Furthermore, access to an extra vehicle in the families did
not significantly increase daily vehicle kilometers. In the study conducted in U.S. the vehicles
most often were used for work and work-related travel, while in Sweden for all other travel
except work and work-related travel. No major difficulties during the 2-week trial period in
either of the studies were observed with respect to shifting travel from own conventional-
fuelled vehicles to the electric vehicles.
6. MARKET SEGMENTATION
The process of marketing segmentation involves the identifying of variations in
customer needs and the determining of how these needs can be fulfilled (Chaston, 1999).
Customers may differ in many ways; wants, purchasing power, geographical location,
attitudes, personality, knowledge, benefits sought, and/or habits. Hence, by identifying
specific groups within a market, a market campaign for a product or service can be more fine-
tuned to fit specific segments. Besides usual socio-demographic variables psycho-graphic and
behavioral variables were included to identify specific market segments.
6.1 SUBJECTS
To study perceptions of electric vehicles, and to find volunteers for the experimental
studies, mail-back questionnaires were administered to a random sample of current car-
owners in the greater Gothenburg area, Sweden (Table 4). Wave 1 was administered in
September 1998 to 300 car-owners and their spouses and wave 2 in December 1998 through
January 1999 to 1,600. A total of 165 fully completed questionnaires were returned in wave 1,
787 in wave 2. The response rate of targeted car-owners was 38.0 % and 34.3 %, respectively.
11
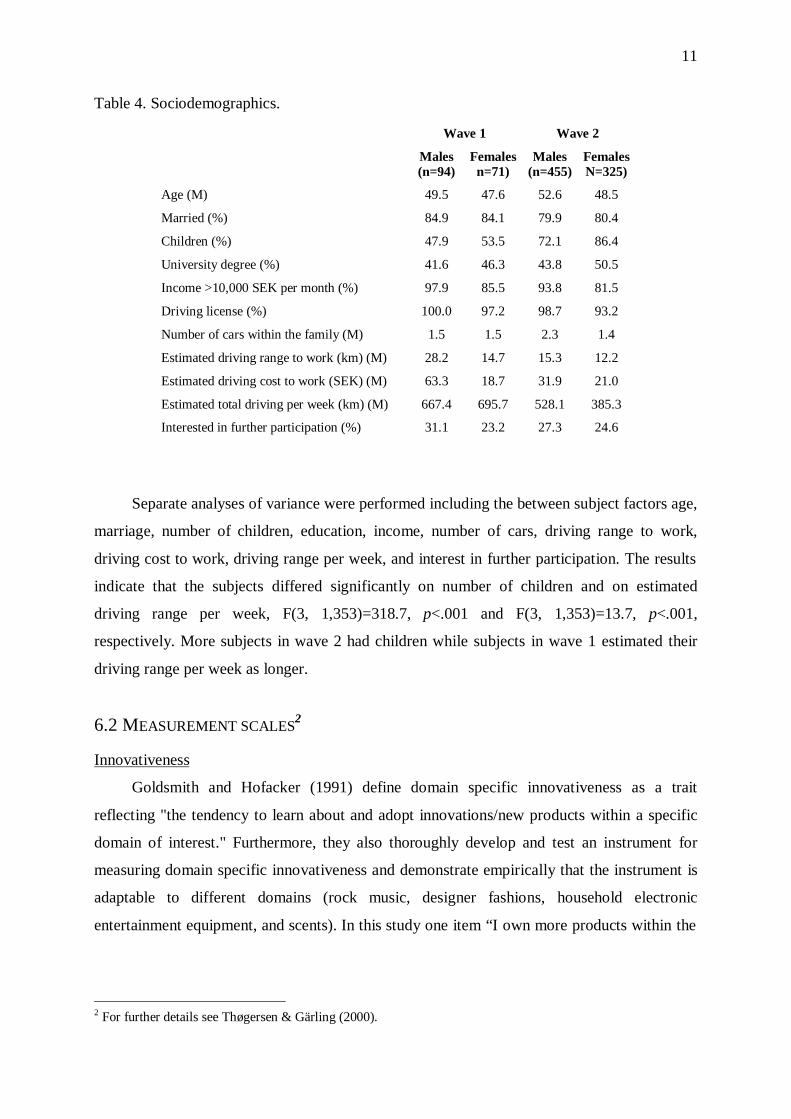
Table 4. Sociodemographics.
Wave 1 Wave 2
Males(n=94)
Femalesn=71)
Males(n=455)
FemalesN=325)
Age (M) 49.5 47.6 52.6 48.5
Married (%) 84.9 84.1 79.9 80.4
Children (%) 47.9 53.5 72.1 86.4
University degree (%) 41.6 46.3 43.8 50.5
Income >10,000 SEK per month (%) 97.9 85.5 93.8 81.5
Driving license (%) 100.0 97.2 98.7 93.2
Number of cars within the family (M) 1.5 1.5 2.3 1.4
Estimated driving range to work (km) (M) 28.2 14.7 15.3 12.2
Estimated driving cost to work (SEK) (M) 63.3 18.7 31.9 21.0
Estimated total driving per week (km) (M) 667.4 695.7 528.1 385.3
Interested in further participation (%) 31.1 23.2 27.3 24.6
Separate analyses of variance were performed including the between subject factors age,
marriage, number of children, education, income, number of cars, driving range to work,
driving cost to work, driving range per week, and interest in further participation. The results
indicate that the subjects differed significantly on number of children and on estimated
driving range per week, F(3, 1,353)=318.7, p<.001 and F(3, 1,353)=13.7, p<.001,
respectively. More subjects in wave 2 had children while subjects in wave 1 estimated their
driving range per week as longer.
6.2 MEASUREMENT SCALES2
Innovativeness
Goldsmith and Hofacker (1991) define domain specific innovativeness as a trait
reflecting "the tendency to learn about and adopt innovations/new products within a specific
domain of interest." Furthermore, they also thoroughly develop and test an instrument for
measuring domain specific innovativeness and demonstrate empirically that the instrument is
adaptable to different domains (rock music, designer fashions, household electronic
entertainment equipment, and scents). In this study one item “I own more products within the
2 For further details see Thøgersen & Gärling (2000).
12
product area than others” was removed from the original instrument and another was added,
“Of my acquaintances I am one of the least interested in TV programs like "Motor Journal" to
better go with the domain of alternative-fuelled vehicles. The instrument was adapted to the
domain of "alternative fuels vehicles" and translated to Swedish (Table 5). A five-point agree-
disagree scale was used.
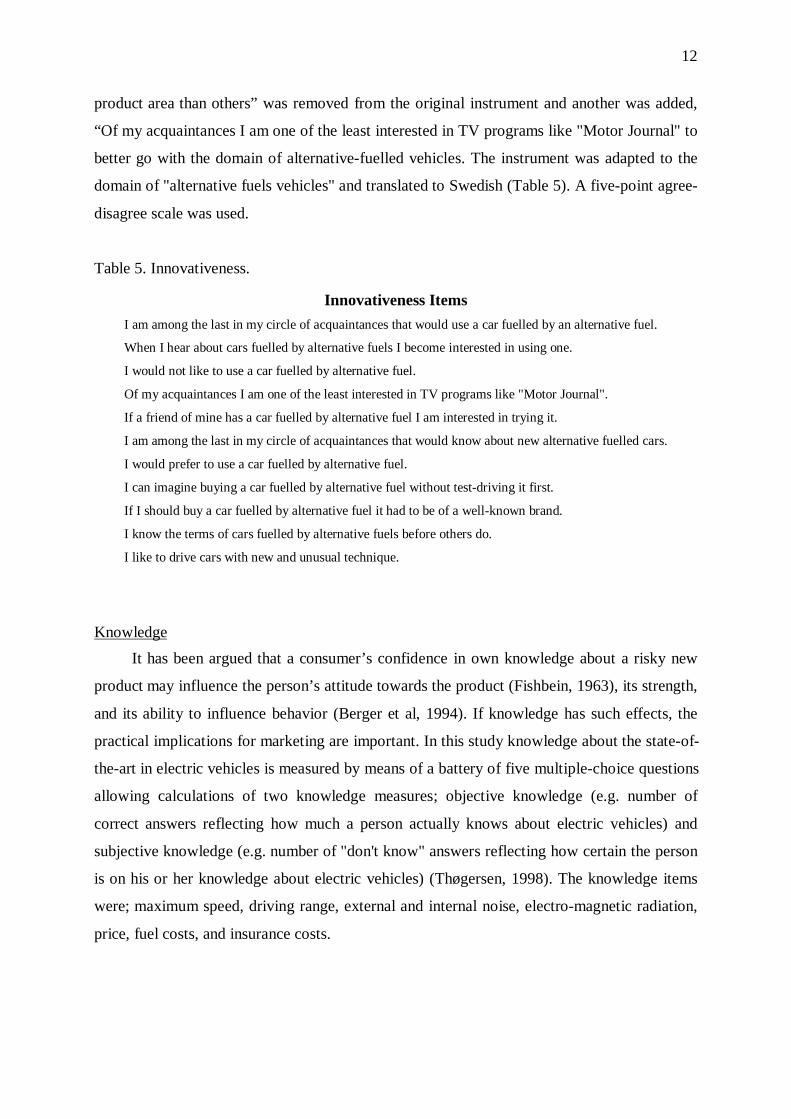
Table 5. Innovativeness.
Innovativeness Items
I am among the last in my circle of acquaintances that would use a car fuelled by an alternative fuel.
When I hear about cars fuelled by alternative fuels I become interested in using one.
I would not like to use a car fuelled by alternative fuel.
Of my acquaintances I am one of the least interested in TV programs like "Motor Journal".
If a friend of mine has a car fuelled by alternative fuel I am interested in trying it.
I am among the last in my circle of acquaintances that would know about new alternative fuelled cars.
I would prefer to use a car fuelled by alternative fuel.
I can imagine buying a car fuelled by alternative fuel without test-driving it first.
If I should buy a car fuelled by alternative fuel it had to be of a well-known brand.
I know the terms of cars fuelled by alternative fuels before others do.
I like to drive cars with new and unusual technique.
Knowledge
It has been argued that a consumer’s confidence in own knowledge about a risky new
product may influence the person’s attitude towards the product (Fishbein, 1963), its strength,
and its ability to influence behavior (Berger et al, 1994). If knowledge has such effects, the
practical implications for marketing are important. In this study knowledge about the state-of-
the-art in electric vehicles is measured by means of a battery of five multiple-choice questions
allowing calculations of two knowledge measures; objective knowledge (e.g. number of
correct answers reflecting how much a person actually knows about electric vehicles) and
subjective knowledge (e.g. number of "don't know" answers reflecting how certain the person
is on his or her knowledge about electric vehicles) (Thøgersen, 1998). The knowledge items
were; maximum speed, driving range, external and internal noise, electro-magnetic radiation,
price, fuel costs, and insurance costs.

13
Environmental concern
Environmental concern is in this study defined as a disposition to do the
(environmentally) “right thing” even when it conflicts with one’s own interests. Hence, we
follow the tradition of emphasizing its moral, altruistic nature (Heberlein, 1972; Stern &
Dietz, 1994). In measuring environmental concern the point of departure is taken in an
instrument developed by Biel & Dahlstrand, 1997. The instrument contains 18 items (Table
6). A nine-point agree-disagree scale was used.
Table 6. Environmental concern.
Environmental Concern Items
I feel a moral obligation to do something about the environmental problems.
I believe that the environmental problems of our time are exaggerated.
Environmental protection law restricts my choice options and my personal freedom.
The health effects of pollution are more serious than we think.
The balance of nature is sensitive and easy to disturb.
I am not engaged in the environmental problems of our time.
I believe that I should protect the environment.
I think that the environmental problems of our time are alarming.
A clean environment offers me better recreational possibilities.
Pollution in one country hurts people all over the World.
During the nearest decades thousand of species will be extinct.
Ordinary citizens must take responsibility for the environment.
I believe that it is important that people in general protect the environment.
I believe that the environmental problems of our time need regulation.
Environmental protection threatens jobs for people like me.
We need not worry about the environment because future generations will be much moreable to handle such problems than we are.
Claims that current level of pollution changes the climate of the Earth are exaggerated.
Public authorities and not common citizens are responsible for taking steps that improve theenvironment.
Relative advantage
The relative advantage of the electric vehicles is measured by means of speed,
acceleration, driving range, recharge time, loading capacity, operating costs, price, ease of
maintenance, and environment-friendliness. A nine-point important-unimportant scale was
used.
14
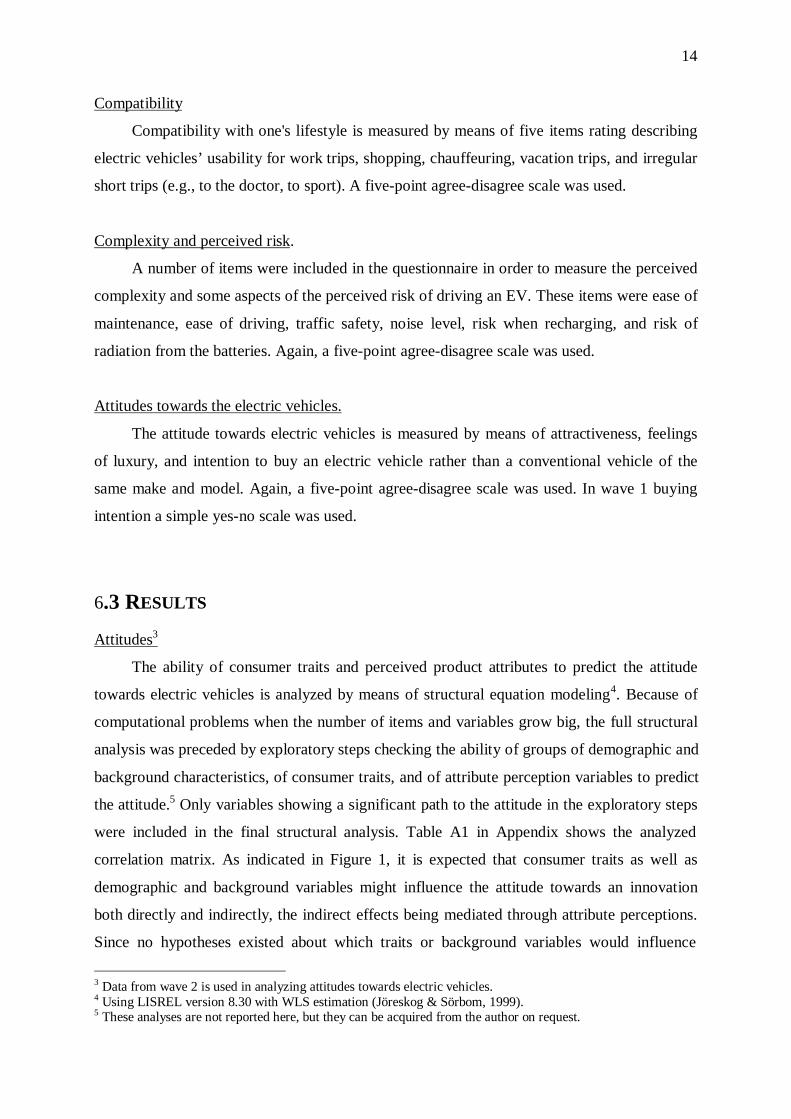
Compatibility
Compatibility with one's lifestyle is measured by means of five items rating describing
electric vehicles’ usability for work trips, shopping, chauffeuring, vacation trips, and irregular
short trips (e.g., to the doctor, to sport). A five-point agree-disagree scale was used.
Complexity and perceived risk.
A number of items were included in the questionnaire in order to measure the perceived
complexity and some aspects of the perceived risk of driving an EV. These items were ease of
maintenance, ease of driving, traffic safety, noise level, risk when recharging, and risk of
radiation from the batteries. Again, a five-point agree-disagree scale was used.
Attitudes towards the electric vehicles.
The attitude towards electric vehicles is measured by means of attractiveness, feelings
of luxury, and intention to buy an electric vehicle rather than a conventional vehicle of the
same make and model. Again, a five-point agree-disagree scale was used. In wave 1 buying
intention a simple yes-no scale was used.
6.3 RESULTS
Attitudes3
The ability of consumer traits and perceived product attributes to predict the attitude
towards electric vehicles is analyzed by means of structural equation modeling4. Because of
computational problems when the number of items and variables grow big, the full structural
analysis was preceded by exploratory steps checking the ability of groups of demographic and
background characteristics, of consumer traits, and of attribute perception variables to predict
the attitude.5 Only variables showing a significant path to the attitude in the exploratory steps
were included in the final structural analysis. Table A1 in Appendix shows the analyzed
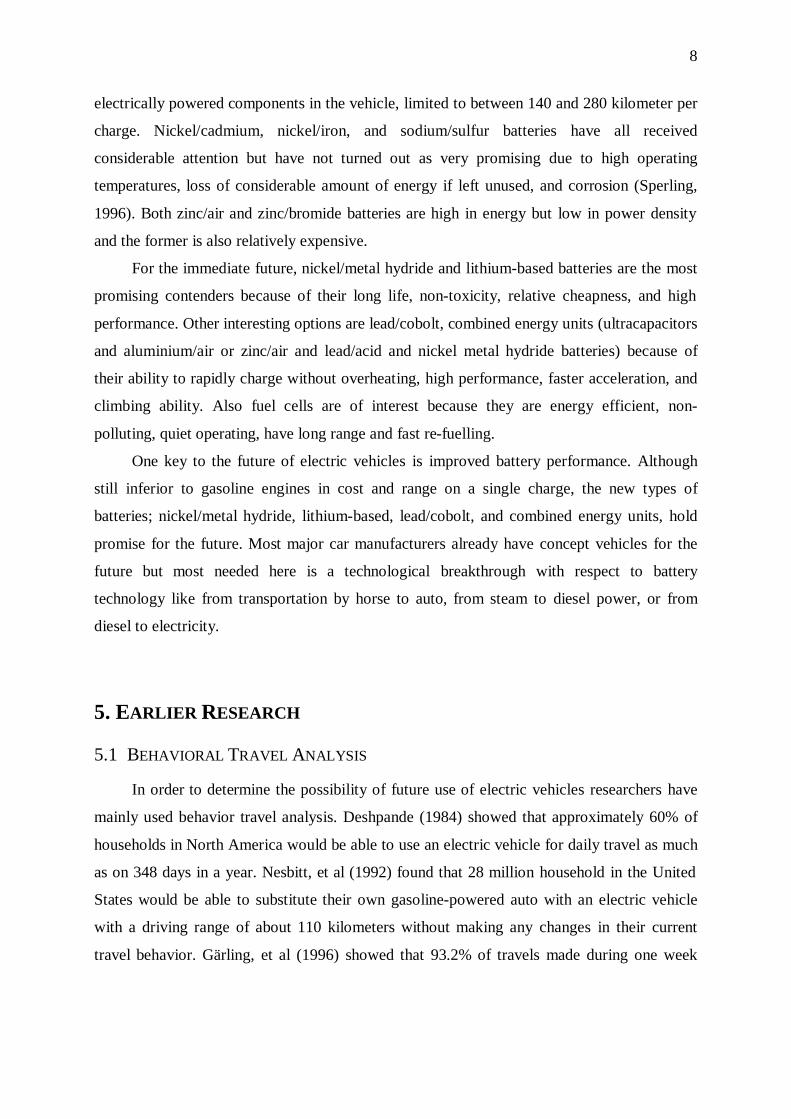
correlation matrix. As indicated in Figure 1, it is expected that consumer traits as well as
demographic and background variables might influence the attitude towards an innovation
both directly and indirectly, the indirect effects being mediated through attribute perceptions.
Since no hypotheses existed about which traits or background variables would influence
3 Data from wave 2 is used in analyzing attitudes towards electric vehicles.4 Using LISREL version 8.30 with WLS estimation (Jöreskog & Sörbom, 1999).5 These analyses are not reported here, but they can be acquired from the author on request.
15
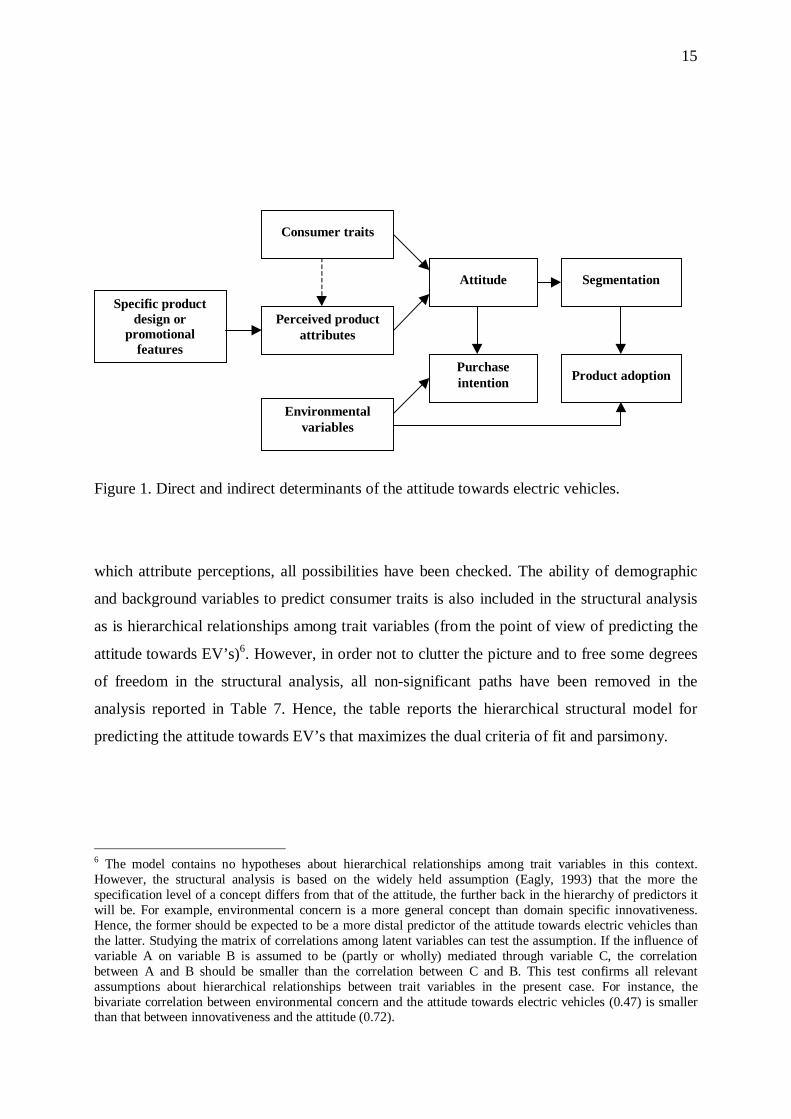
Figure 1. Direct and indirect determinants of the attitude towards electric vehicles.
which attribute perceptions, all possibilities have been checked. The ability of demographic
and background variables to predict consumer traits is also included in the structural analysis
as is hierarchical relationships among trait variables (from the point of view of predicting the
attitude towards EV’s)6. However, in order not to clutter the picture and to free some degrees
of freedom in the structural analysis, all non-significant paths have been removed in the
analysis reported in Table 7. Hence, the table reports the hierarchical structural model for
predicting the attitude towards EV’s that maximizes the dual criteria of fit and parsimony.
6 The model contains no hypotheses about hierarchical relationships among trait variables in this context.However, the structural analysis is based on the widely held assumption (Eagly, 1993) that the more thespecification level of a concept differs from that of the attitude, the further back in the hierarchy of predictors itwill be. For example, environmental concern is a more general concept than domain specific innovativeness.Hence, the former should be expected to be a more distal predictor of the attitude towards electric vehicles thanthe latter. Studying the matrix of correlations among latent variables can test the assumption. If the influence ofvariable A on variable B is assumed to be (partly or wholly) mediated through variable C, the correlationbetween A and B should be smaller than the correlation between C and B. This test confirms all relevantassumptions about hierarchical relationships between trait variables in the present case. For instance, thebivariate correlation between environmental concern and the attitude towards electric vehicles (0.47) is smallerthan that between innovativeness and the attitude (0.72).
Specific productdesign or
promotionalfeatures
Perceived productattributes
Consumer traits
Environmentalvariables
Attitude
Purchaseintention
Segmentation
Product adoption
16
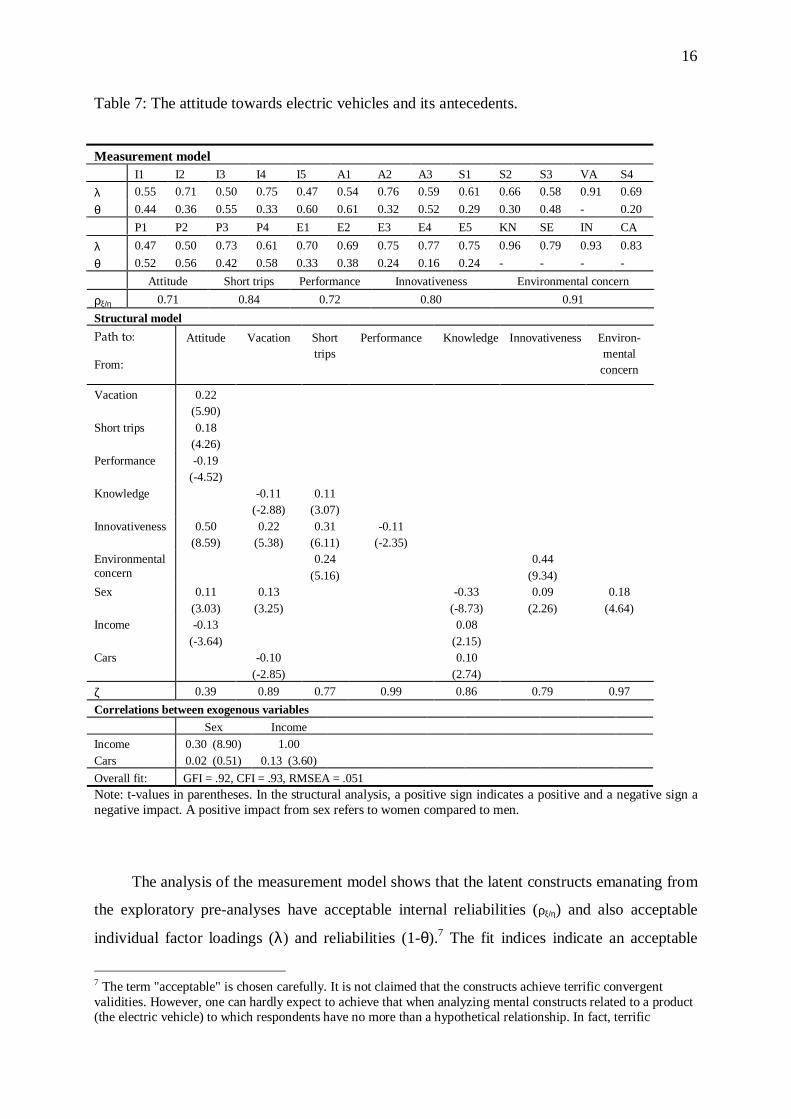
Table 7: The attitude towards electric vehicles and its antecedents.
Measurement modelI1 I2 I3 I4 I5 A1 A2 A3 S1 S2 S3 VA S4
λ 0.55 0.71 0.50 0.75 0.47 0.54 0.76 0.59 0.61 0.66 0.58 0.91 0.69
θ 0.44 0.36 0.55 0.33 0.60 0.61 0.32 0.52 0.29 0.30 0.48 - 0.20
P1 P2 P3 P4 E1 E2 E3 E4 E5 KN SE IN CA
λ 0.47 0.50 0.73 0.61 0.70 0.69 0.75 0.77 0.75 0.96 0.79 0.93 0.83
θ 0.52 0.56 0.42 0.58 0.33 0.38 0.24 0.16 0.24 - - - -
Attitude Short trips Performance Innovativeness Environmental concern
ρξ/η 0.71 0.84 0.72 0.80 0.91
Structural model
Path to:
From:
Attitude Vacation Shorttrips
Performance Knowledge Innovativeness Environ-mentalconcern
Vacation 0.22(5.90)
Short trips 0.18(4.26)
Performance -0.19(-4.52)
Knowledge -0.11(-2.88)
0.11(3.07)
Innovativeness 0.50(8.59)
0.22(5.38)
0.31(6.11)
-0.11(-2.35)
Environmentalconcern
0.24(5.16)
0.44(9.34)
Sex 0.11(3.03)
0.13(3.25)
-0.33(-8.73)
0.09(2.26)
0.18(4.64)
Income -0.13(-3.64)
0.08(2.15)
Cars -0.10(-2.85)
0.10(2.74)
ζ 0.39 0.89 0.77 0.99 0.86 0.79 0.97
Correlations between exogenous variables
Sex IncomeIncome 0.30 (8.90) 1.00Cars 0.02 (0.51) 0.13 (3.60)
Overall fit: GFI = .92, CFI = .93, RMSEA = .051Note: t-values in parentheses. In the structural analysis, a positive sign indicates a positive and a negative sign anegative impact. A positive impact from sex refers to women compared to men.
The analysis of the measurement model shows that the latent constructs emanating from
the exploratory pre-analyses have acceptable internal reliabilities (ρξ/η) and also acceptable
individual factor loadings (λ) and reliabilities (1-θ).7 The fit indices indicate an acceptable
7 The term "acceptable" is chosen carefully. It is not claimed that the constructs achieve terrific convergentvalidities. However, one can hardly expect to achieve that when analyzing mental constructs related to a product(the electric vehicle) to which respondents have no more than a hypothetical relationship. In fact, terrific
17
overall fit, thus confirming that the measurement model and the suggested structural
relationships give a good representation of the data. Some distributions in the data set deviate
moderately from the normality assumption of the ML algorithm (relative multivariate kurtosis
is 1.147), which means that the fit indices and error variances may be biased. However, ML
parameter estimates are robust against moderate violations of the multivariate normality
assumption, provided the sample size exceeds 100 (Boomsma, 1982) so the possible biases do
not pose a threat to the substantive interpretation of the results in this case.
The structural equation analysis accounts for 61% (100*(1-ζ)) of the variation in the
attitude towards electric vehicles. As predicted, the attitude depends on how important an
electric vehicle’s technical performance is perceived to be, as well as on its perceived
usefulness for both shorter and longer (vacation) trips. The direction of all these relationships
is as expected. The more useful and easy to use an electric vehicle is perceived to be the more
positive the attitude, and the more important its inferior technical performance is perceived to
be the more negative the attitude.
By far the strongest predictor of the attitude towards electric vehicles is a trait variable,
domain specific innovativeness. The structural analysis even shows that besides the strong
direct effect, innovativeness has a number of indirect effects on the attitude, through
influencing how the potential adopter perceives and evaluates product attributes. The
innovative person holds more favorable perceptions about the usefulness of an electric vehicle
and attaches less importance to its technical performance than the less innovative person.
Following the structural relationships further back in the effects hierarchy, the analysis
shows that domain specific innovativeness is rooted in environmental concern and gender.
When all other variables are controlled, environmental concern only influences the attitude
towards electric vehicles indirectly, most notably through innovativeness. However,
environmental concern also colors potential adopters’ perception of the usefulness of electric
vehicles for shorter trips in a favorable direction.
convergent validity is achieved for the most abstract of the latent constructs, environmental concern. The highestcorrelation between latent constructs is .67 (between innovativeness and attitude), indicating acceptablediscriminant validity as well.
18
Factual knowledge about electric vehicles also only influences the attitude indirectly.
The more factual knowledge a person has about electric vehicles, the less useful for vacation
purposes and the more useful for short trips he or she perceives it to be.
Not surprisingly, demographic and background characteristics have the weakest
influence on the attitude. However, among these gender is the most important predictor,
having a direct effect as well as indirect effects, through attribute perceptions, knowledge,
innovativeness, and environmental concern. When attribute perceptions and traits have been
controlled, women are more positive towards electric vehicles than men. Women also
perceive electric vehicles as more useful for vacations, and they are more environmentally
concerned and innovative (regarding alternative fuelled vehicles) than men. These findings all
indicate that women represent a more promising market for electric vehicles than men.
However, this expectation is dampened by the finding that women are less knowledgeable
about electric vehicles than men are, which is the strongest gender effect of all.
In addition, Table 1 shows that people with high income tend to know more about, but
to have a more negative attitude towards, electric vehicles than people with lower income, and
that the more cars a household possesses, the less useful an electric vehicle is perceived to be
for vacation purposes. People with more cars also tend to be more knowledgeable about
electric vehicles.
Intention to buy.
As mentioned earlier, the sample from wave 1 is used to study the link from attitude to
buying intention. According to the model outlined in Figure 1, buying intention is
codetermined by the attitude and environmental variables. Hence, it is expected that all
impacts of attitudinal antecedents on buying intention are mediated through the attitude.
Table 8 shows the results of the structural equation analysis of the relationships between
buying intention, attitude, and the included proximal antecedents of the attitude, all with
regard to a state-of-the-art electric vehicle priced at the same level as a similar conventional
car (Appendix, Table A2).
Again, the measurement model shows that the latent constructs have acceptable internal
reliabilities (ρξ/η) and also acceptable individual factor loadings (λ) and reliabilities (1-θ). The
fit indices indicate a good overall fit, again confirming that the measurement model and the
suggested structural relationships represent the data well. Again, some distributions in the
data set deviate moderately from the normality assumption of the ML algorithm (relative
19
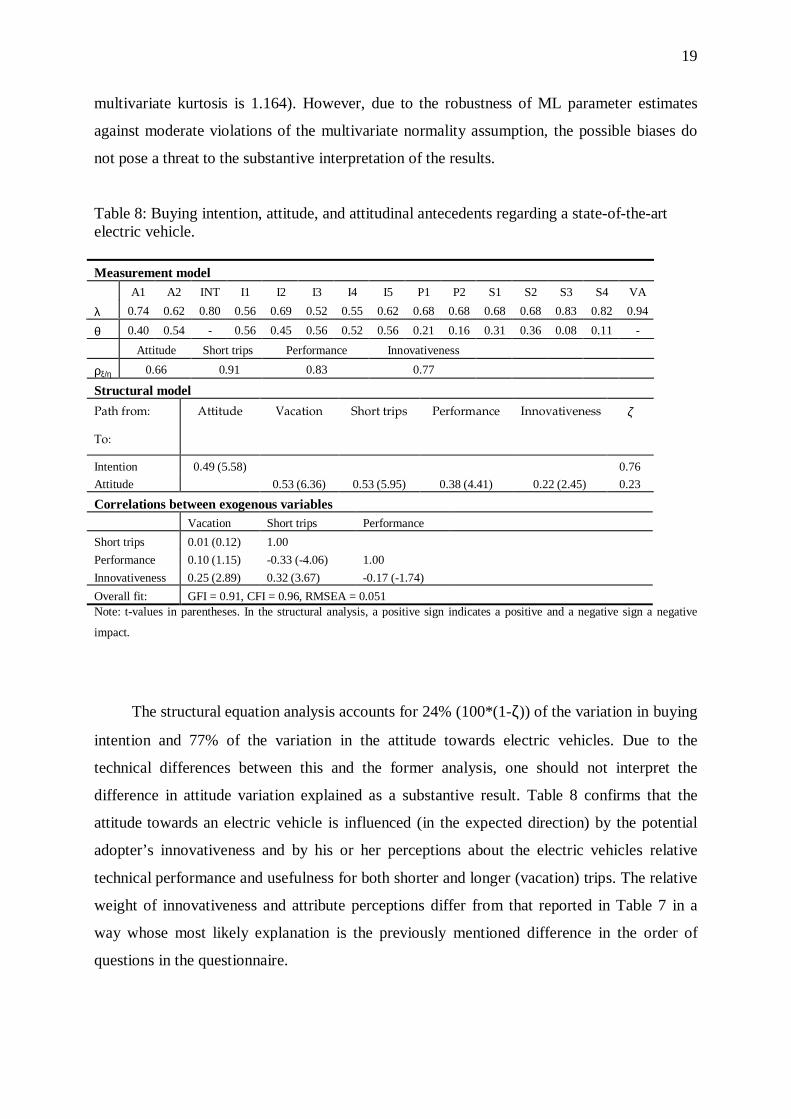
multivariate kurtosis is 1.164). However, due to the robustness of ML parameter estimates
against moderate violations of the multivariate normality assumption, the possible biases do
not pose a threat to the substantive interpretation of the results.
Table 8: Buying intention, attitude, and attitudinal antecedents regarding a state-of-the-artelectric vehicle.
Measurement modelA1 A2 INT I1 I2 I3 I4 I5 P1 P2 S1 S2 S3 S4 VA
λ 0.74 0.62 0.80 0.56 0.69 0.52 0.55 0.62 0.68 0.68 0.68 0.68 0.83 0.82 0.94
θ 0.40 0.54 - 0.56 0.45 0.56 0.52 0.56 0.21 0.16 0.31 0.36 0.08 0.11 -
Attitude Short trips Performance Innovativeness
ρξ/η 0.66 0.91 0.83 0.77
Structural model
Path from:
To:
Attitude Vacation Short trips Performance Innovativeness ζ
Intention 0.49 (5.58) 0.76
Attitude 0.53 (6.36) 0.53 (5.95) 0.38 (4.41) 0.22 (2.45) 0.23
Correlations between exogenous variablesVacation Short trips Performance
Short trips 0.01 (0.12) 1.00
Performance 0.10 (1.15) -0.33 (-4.06) 1.00
Innovativeness 0.25 (2.89) 0.32 (3.67) -0.17 (-1.74)
Overall fit: GFI = 0.91, CFI = 0.96, RMSEA = 0.051Note: t-values in parentheses. In the structural analysis, a positive sign indicates a positive and a negative sign a negative
impact.
The structural equation analysis accounts for 24% (100*(1-ζ)) of the variation in buying
intention and 77% of the variation in the attitude towards electric vehicles. Due to the
technical differences between this and the former analysis, one should not interpret the
difference in attitude variation explained as a substantive result. Table 8 confirms that the
attitude towards an electric vehicle is influenced (in the expected direction) by the potential
adopter’s innovativeness and by his or her perceptions about the electric vehicles relative
technical performance and usefulness for both shorter and longer (vacation) trips. The relative
weight of innovativeness and attribute perceptions differ from that reported in Table 7 in a
way whose most likely explanation is the previously mentioned difference in the order of
questions in the questionnaire.
20
As expected, all effects of the attitudinal antecedents on buying intention are mediated
through the attitude. Adjusted for relative multivariate kurtosis, χ2 is 104.5 with 81 degrees of
freedom (p > 0.05). In no cases does the addition of a direct path from an attitudinal
antecedent to buying intention result in a significant path coefficient or in a significant change
in χ2.
Segmentation
It is obvious from the presented analyses that not all will respond equally favorably to
attempts to the marketing of an electric vehicle. Presented with the characteristics described in
this study, some consumers respond with a positive attitude towards the electric vehicle and
interest in buying, while others do not. The most likely early adopters of electric vehicles are
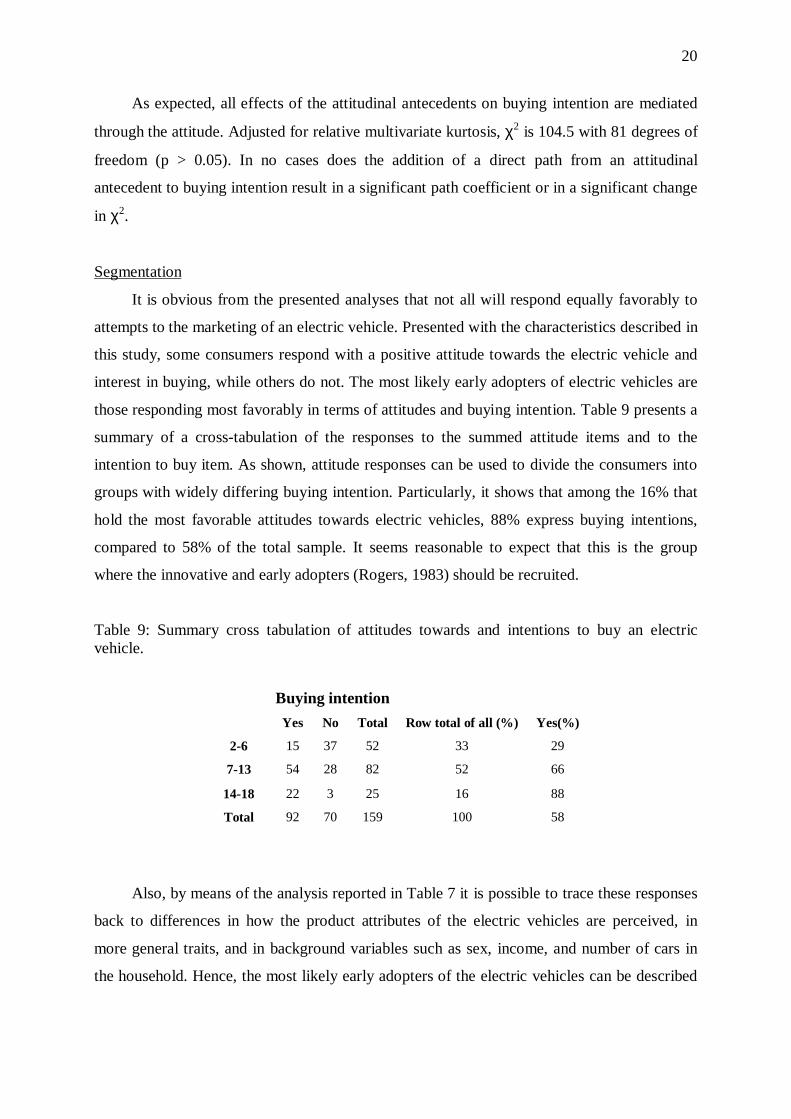
those responding most favorably in terms of attitudes and buying intention. Table 9 presents a
summary of a cross-tabulation of the responses to the summed attitude items and to the
intention to buy item. As shown, attitude responses can be used to divide the consumers into
groups with widely differing buying intention. Particularly, it shows that among the 16% that
hold the most favorable attitudes towards electric vehicles, 88% express buying intentions,
compared to 58% of the total sample. It seems reasonable to expect that this is the group
where the innovative and early adopters (Rogers, 1983) should be recruited.
Table 9: Summary cross tabulation of attitudes towards and intentions to buy an electricvehicle.
Buying intention
Yes No Total Row total of all (%) Yes(%)
2-6 15 37 52 33 29
7-13 54 28 82 52 66
14-18 22 3 25 16 88
Total 92 70 159 100 58
Also, by means of the analysis reported in Table 7 it is possible to trace these responses
back to differences in how the product attributes of the electric vehicles are perceived, in
more general traits, and in background variables such as sex, income, and number of cars in
the household. Hence, the most likely early adopters of the electric vehicles can be described
21
in a way that can be used for developing a marketing plan for targeting these potential electric
vehicle buyers. Furthermore, it is possible that some attributes of an electric vehicle are
weighed differently by men and women, by consumers with high and low knowledge about
electric vehicles, by those high and low in environmental concern or innovativeness, or by
those considering to substitute an electric vehicle for their only car and those considering to
substitute it for the second or third car.
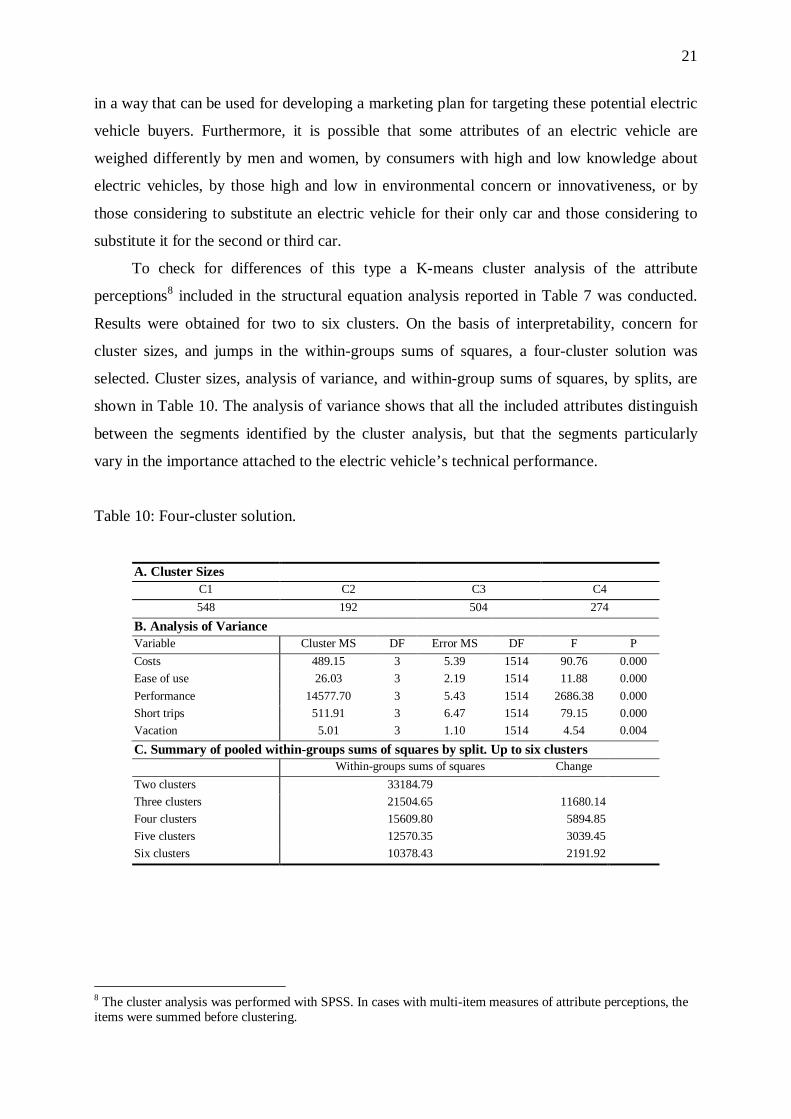
To check for differences of this type a K-means cluster analysis of the attribute
perceptions8 included in the structural equation analysis reported in Table 7 was conducted.
Results were obtained for two to six clusters. On the basis of interpretability, concern for
cluster sizes, and jumps in the within-groups sums of squares, a four-cluster solution was
selected. Cluster sizes, analysis of variance, and within-group sums of squares, by splits, are
shown in Table 10. The analysis of variance shows that all the included attributes distinguish
between the segments identified by the cluster analysis, but that the segments particularly
vary in the importance attached to the electric vehicle’s technical performance.
Table 10: Four-cluster solution.
A. Cluster SizesC1 C2 C3 C4
548 192 504 274
B. Analysis of VarianceVariable Cluster MS DF Error MS DF F P
Costs 489.15 3 5.39 1514 90.76 0.000
Ease of use 26.03 3 2.19 1514 11.88 0.000
Performance 14577.70 3 5.43 1514 2686.38 0.000
Short trips 511.91 3 6.47 1514 79.15 0.000
Vacation 5.01 3 1.10 1514 4.54 0.004
C. Summary of pooled within-groups sums of squares by split. Up to six clustersWithin-groups sums of squares Change
Two clusters 33184.79
Three clusters 21504.65 11680.14
Four clusters 15609.80 5894.85
Five clusters 12570.35 3039.45
Six clusters 10378.43 2191.92
8 The cluster analysis was performed with SPSS. In cases with multi-item measures of attribute perceptions, theitems were summed before clustering.
22
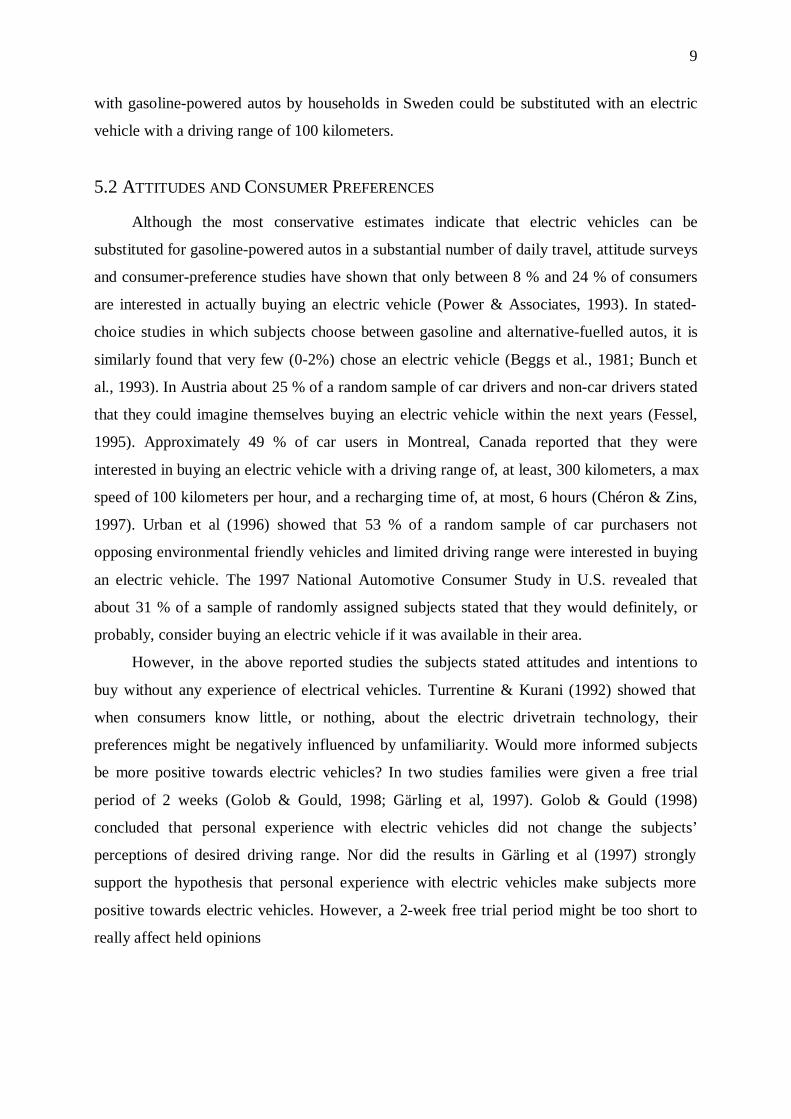
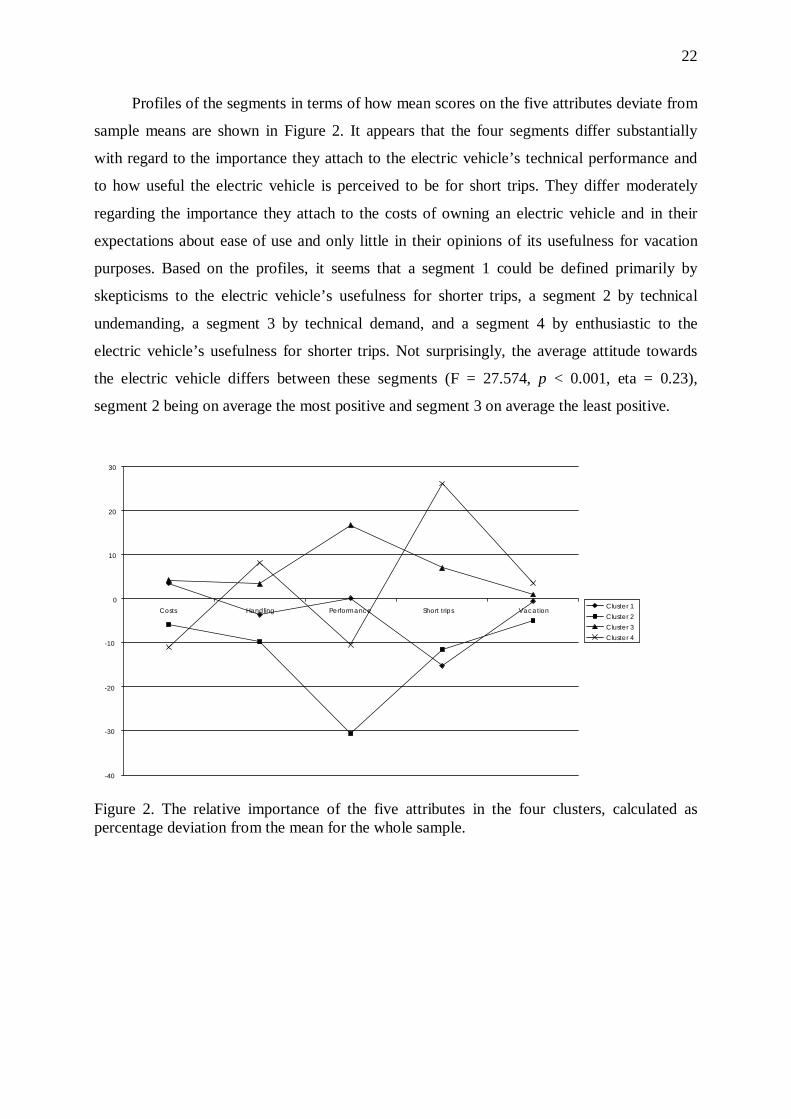
Profiles of the segments in terms of how mean scores on the five attributes deviate from
sample means are shown in Figure 2. It appears that the four segments differ substantially
with regard to the importance they attach to the electric vehicle’s technical performance and
to how useful the electric vehicle is perceived to be for short trips. They differ moderately
regarding the importance they attach to the costs of owning an electric vehicle and in their
expectations about ease of use and only little in their opinions of its usefulness for vacation
purposes. Based on the profiles, it seems that a segment 1 could be defined primarily by
skepticisms to the electric vehicle’s usefulness for shorter trips, a segment 2 by technical
undemanding, a segment 3 by technical demand, and a segment 4 by enthusiastic to the
electric vehicle’s usefulness for shorter trips. Not surprisingly, the average attitude towards
the electric vehicle differs between these segments (F = 27.574, p < 0.001, eta = 0.23),
segment 2 being on average the most positive and segment 3 on average the least positive.
-40
-30
-20
-10
0
10
20
30
Costs Handling Performance Short trips VacationCluster 1
Cluster 2
Cluster 3
Cluster 4
Figure 2. The relative importance of the five attributes in the four clusters, calculated aspercentage deviation from the mean for the whole sample.
23
6.4 SUMMARY
Attitudes towards electric vehicles depend upon how the vehicles’ product attributes
(compatibility, and perceived advantage and safety) are evaluated, personal traits
(innovativeness, environmental concern, and knowledge), and background variables (gender,
income, and number of vehicles). The more important the electric vehicle’s technical
performance is the less positive is the attitude and the more useful and easy to use the electric
vehicle is perceived the more positive is the attitude. Subjects that are high in innovativeness
are also more positive to the electric vehicle’s usefulness and the less importance is attached
to the technical performance of the vehicle. Subjects that are high in knowledge perceive the
electric vehicle as less useful while subjects that are more environmentally concerned
perceive the electric as more useful. Females, higher than males in innovativeness, more
environmentally concerned but less knowledgeable about a state-of-the-art electric vehicle,
are more positive towards the electric vehicle and perceive them as more usefulness for longer
trips. Subjects higher in income and subjects owning more than one car are more
knowledgeable about a state-of-the-art electric vehicle and also more negative about the
vehicle’s usefulness.
Intention to buy an electric vehicle heavily depends on the attitude towards the vehicle,
which, in turn, mainly depends upon the vehicle’s technical performance, perceived
usefulness, innovativeness, and gender. The attitude responses were used to divide subjects
into different groups with differing buying intentions. Among the 16 % of the subjects that
hold the most favorable attitude towards the electric vehicle 88 % expressed a buying
intention. The deviation from sample means of the attributes costs, ease of use, performance,
and short and long trips made it possible to distinguish four profiles differing on the
importance attached to these attributes; a segment 1 characterized by a skepticisms to the
electric vehicle’s usefulness for shorter trips, a segment 2 characterized by a technical
uninterest, a segment 3 characterized by a technical interest, and a segment 4 characterized by
an enthusiasms about the electric vehicle’s usefulness for shorter trips.
7. MARKETING COMMUNICATION STRATEGIES
Marketing is often presented as a sequential, logical process designed to provide
answers to such questions as Where are we now?, Where are we going?, and How are we
going to get there? (Kotler, 1997). The answers to the first and second question are quite
24
obvious. We have a new vehicle technology that removes, or reduces, some disadvantages of
the conventional vehicle technology while others remain unaffected. We do want to substitute
the conventional vehicle technology with this new technology. But how is this done? Since
the electric vehicle technology differs from the conventional in such a way (i.e. limited
driving range and longer fuelling time) that behavioral adjustments might be needed other
marketing communication strategies might also be required to get consumers’ attention, hold
interest, arouse desire, and obtain action/purchase.
Building on earlier research in forecasting acceptance of electric vehicles three
marketing communication strategies are compared (Beggs et al., 1981; Bunch et al., 1993;
Chéron & Zins, 1997; Deshpande, 1984; Fessel, 1995; Gärling, et al, 1996; Nesbitt, et al,
1992; Power & Associates, 1993). The strategies are information acceleration (Urban, et al.,
1996), show room visits, and free trials acceleration (Urban, et al., 1996). In the first a
computerized marketing program, M-EV99, which simulates web-based marketing, is
developed and used. This strategy is inexpensive, easy to access, and gives an interested
costumer good chances to find needed information. The second strategy, show room visits,
simulates the traditional car dealer situation while the third, free trials, is an extension of the
second. For success on the market the first adopters’ responses to the new product is of
substantial importance. Actually, the first responses have to be more than positive given the
importance of words-of-mouth (Gärling & Thøgersen, in press). Hence, it is very important
that the electric vehicle initially is sold to the “right” consumer, or the “take-off” may never
come about. However, to adjust to new and unknown products and/or services takes time.
Thus, prolonged trials to check the compatibility of the electric vehicle’s product attributes
with one’s own life style might be of great significance. However, a drawback is that this
strategy is quite expensive in practice.
7.1 SUBJECTS
Subjects were a random sample of current car-owners in the metropolitan area of
Gothenburg, Sweden. In information acceleration 30 (8 females and 22 males) current car-
owners participated, in show room visits 30 (12 females and 18 males), and in free trials 42
families (42 females and 42 males) (Table 11). Subjects participating in free trials were more
often married and owned more often more cars, F(2, 145)=49.5, p<.001 and F(2, 141)=8.5,
p<.001.
25
Furthermore, with respect to innovativeness subjects participating in free trials were less
interested in new technologies9, less interested in trying alternative fuelled vehicles, less
interested in trying an alternative fuelled vehicle before purchase, and made more independent
car purchasing decisions and were in this situation less dependent on the car make, F(2,
124)=17.3, p<.001, F(2, 124)=28.3, p<.001, F(2, 124)=22.0, p<.001, F(2, 124)=3.5, p<.05,
and F(2, 124)=11.7, p<.01.
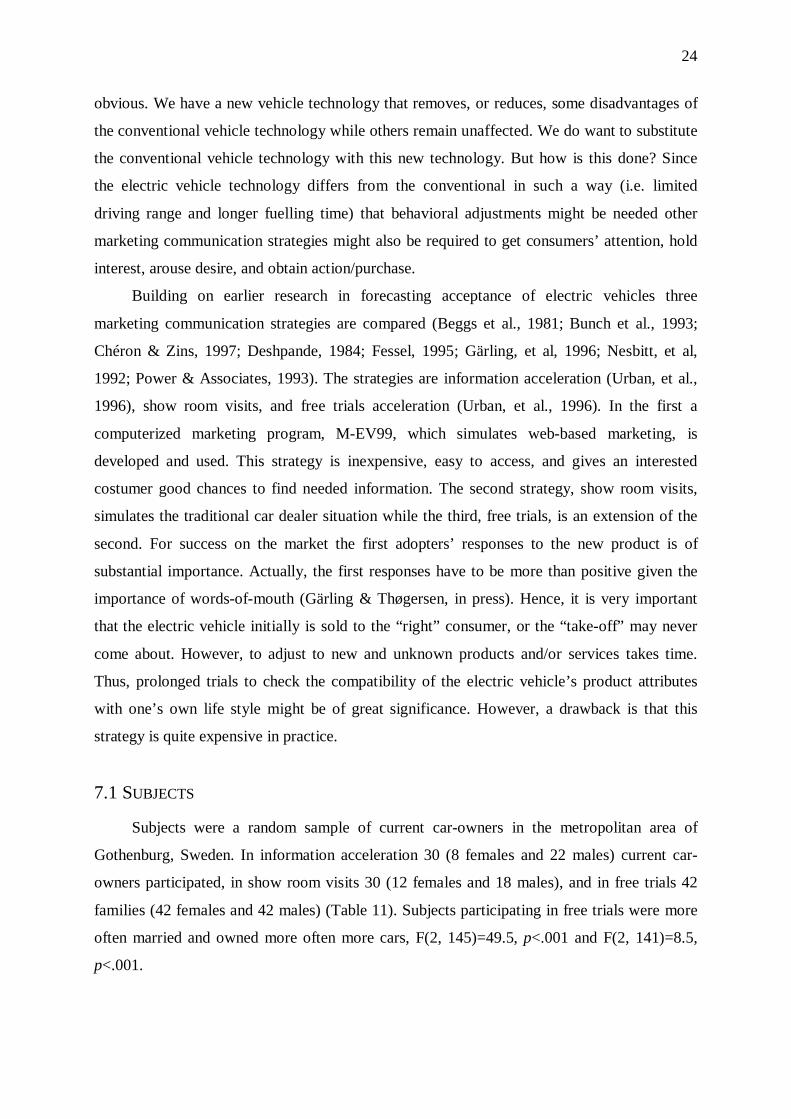
Table 11. Sociodemographics.
Information Acceleration(n=30)
Show Room Visits(n=30)
Free trials(n=84)
Age (M) 41.0 40.9 44.1
Married (%) 44.8 46.7 100.0
Number of cars within the family (M) 1.3 1.2 1.6
Estimated driving distance inkilometer to work (M) 8.8 10.4 11.7
7.2 INFORMATION ACCELERATION
In the information acceleration study a computerized web-based marketing program, M-
EV99, was developed, and designed, for the Swedish car market. The M-EV99 runs on a
personal computer. The operating system is Windows 98 and it runs under Internet Explorer
5.0 in full screen mode and without visible menu bars. The M-EV99 presents products
through the use of different types of media and logs users’ search patterns within the program.
The logging activity is hidden from the user. The output data consists of a record where time
spent on each side, order of accessed pages, and all keystrokes are recorded. The output data
is converted to SPSS file format for further statistical analyses.
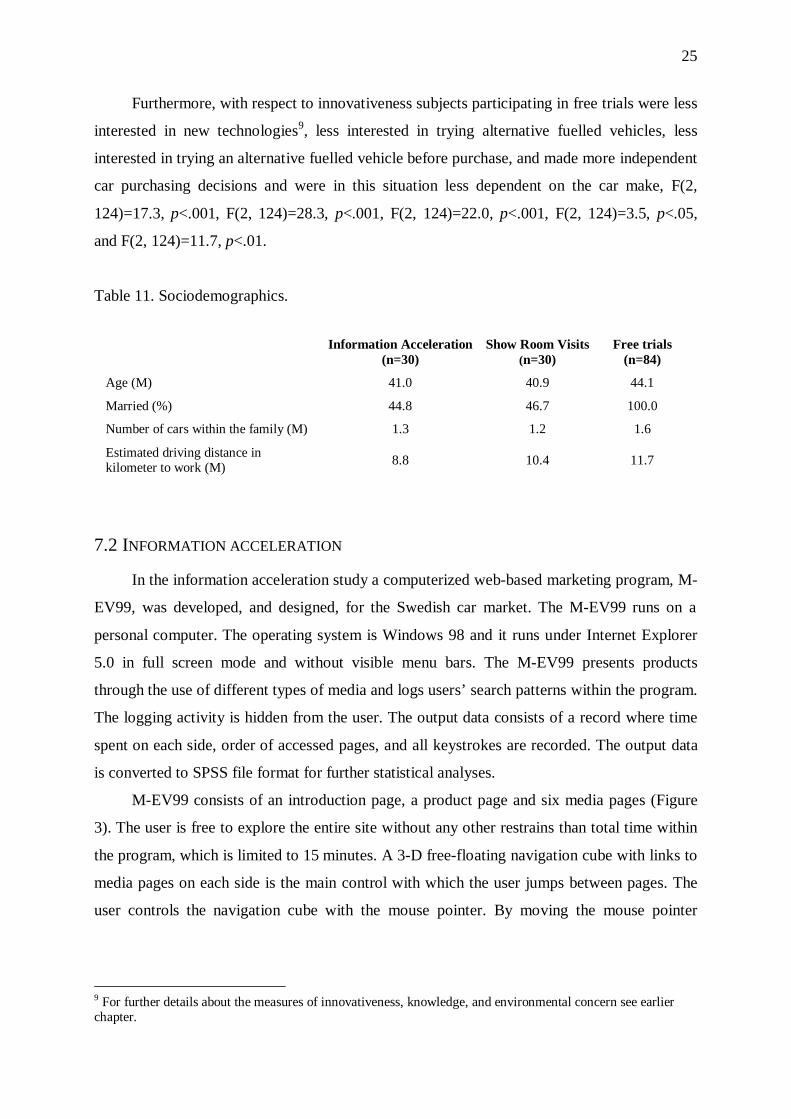
M-EV99 consists of an introduction page, a product page and six media pages (Figure
3). The user is free to explore the entire site without any other restrains than total time within
the program, which is limited to 15 minutes. A 3-D free-floating navigation cube with links to
media pages on each side is the main control with which the user jumps between pages. The
user controls the navigation cube with the mouse pointer. By moving the mouse pointer
9 For further details about the measures of innovativeness, knowledge, and environmental concern see earlierchapter.
26
within the surrounding area, the spin of the cube is controlled. One left-click on the mouse
results in a zooming in of the chosen side and a double click results in a move to that link. By
using the navigation cube instead of a more ordinary menu, the dependence on top-down, left-
right readings are avoided, and number of pages needed, decreased.
Introduction page. Product page
Figure 3. M-EV99 introduction and product pages.
The products in this study were Fiat Seicento Elettra, Peugeot 106 Electric, and Renault Clio
Electrique. The chosen electric vehicles are similar to each other with respect to external and
internal design. Furthermore, the performance is similar in terms of driving range, recharging
times, and initial cost. Six different types of media are presented; a fact sheet, a newspaper
article, a commercial film, a show room, a car dealer, and an electric vehicle-owner. The first
two types of media are text-based, the next two visual-based, and the last two audio-based.
The information given within each type of media is comparable between vehicles. The time
needed to obtain available information on each site is also comparable. It should be noted,
though, that some of the information given in M-EV99 is created purely for the purpose of the
study and should not be mixed up with the information given by the car manufacturers in
question. Changes of the external, and internal, design of the vehicles and of the presented
product facts have been made to better suit the purpose of the study.
The user is first instructed how to use the mouse and then to read the introduction page.
When the user is ready to start the program he/she clicks the start button. A countdown clock

27
starts at the same time as the user hit the product page. The user chooses one of the three-
presented electric vehicles. A click on the desired vehicle takes the user to the frame page
consisting of a left frame with the navigation cube, a return link to the page with the three
vehicles, and a right frame with an instruction page informing the user how to navigate
between the different media types. The user chooses one of six different media types by
rotating the navigation cube and making a double click on the chosen side. The user is
throughout the program free to decide time spent on each page and order of chosen pages.
Furthermore, the user is free to swap back and forth between vehicles and pages as long
as the total time is not exceeded. When the total time is out a clock bells and the program is
shut down.
Choice of media type
Fiat was the most chosen vehicle make as well as the make on which most time was
spent. The most chosen media type was text-based and the most time was also spent on site
(Table 12). In the text-based media type fact sheet was most chosen, in the visual-based
commercial film, and in the audio-based car-dealer. Times spent on newspaper articles were
longer than on fact sheets, longer on commercial films than on show rooms, and longer on
electric vehicle-owners than on car-dealers. However, no significant effects were found
between vehicle makes or gender.
Table 12. Frequencies of chosen sites and time (min:sec) spent on each site distributed overmedia type and vehicle make.
Text Visual Audio
Hits Time Hits Time Hits Time
Fiat 72 54:16 43 44:21 44 43:42
Peugeot 67 43:11 36 27.55 49 42:28
Renault 63 43:57 39 37:59 52 46:37
28
7.3 SHOW ROOM VISITS
Authentic show room visits were set up where trained research assistants served as car-
dealers. The subjects were given the same text based information about the Renault Clio
Electrique as in the information acceleration study. They were also able to test-drive a Renault
Clio Electrique.
The Renault Clio Electrique is a 4-seated 5-door car with a cargo capacity of 220 kg. It
has a battery pack containing 19 rechargeable nickel-cadmium batteries and is recharged in an
ordinary electric outlet with a 10-Ampere fuse. Its factual driving range is 60 to 70 kilometers
depending on driving style and topography. The recharging time from empty to full is about
10 hours (10 Ampere fuse) and the acceleration is 8.5 seconds from 0 to 50 kilometers per
hour.
7.4 FREE TRIALS
In free trials the subjects were lent a Renault Clio Electrique to be used for daily travels
during a time period of 9 weeks.
7.5 COMPARING MARKETING COMMUNICATION STRATEGIES
After the information acceleration study, the show room visits, and the free trials the
subjects’ perceptions of the electric vehicle’s specific product attributes and their inclination
to change transportation behavior in accordance with the specific product attributes of the
electric vehicle were measured. The product attributes were compatibility, relative advantage,
perceived risk, and attitude. Relative advantage and perceived risk were measured compared
to conventional vehicles. All product attributes were measured on 9-point agree-disagree
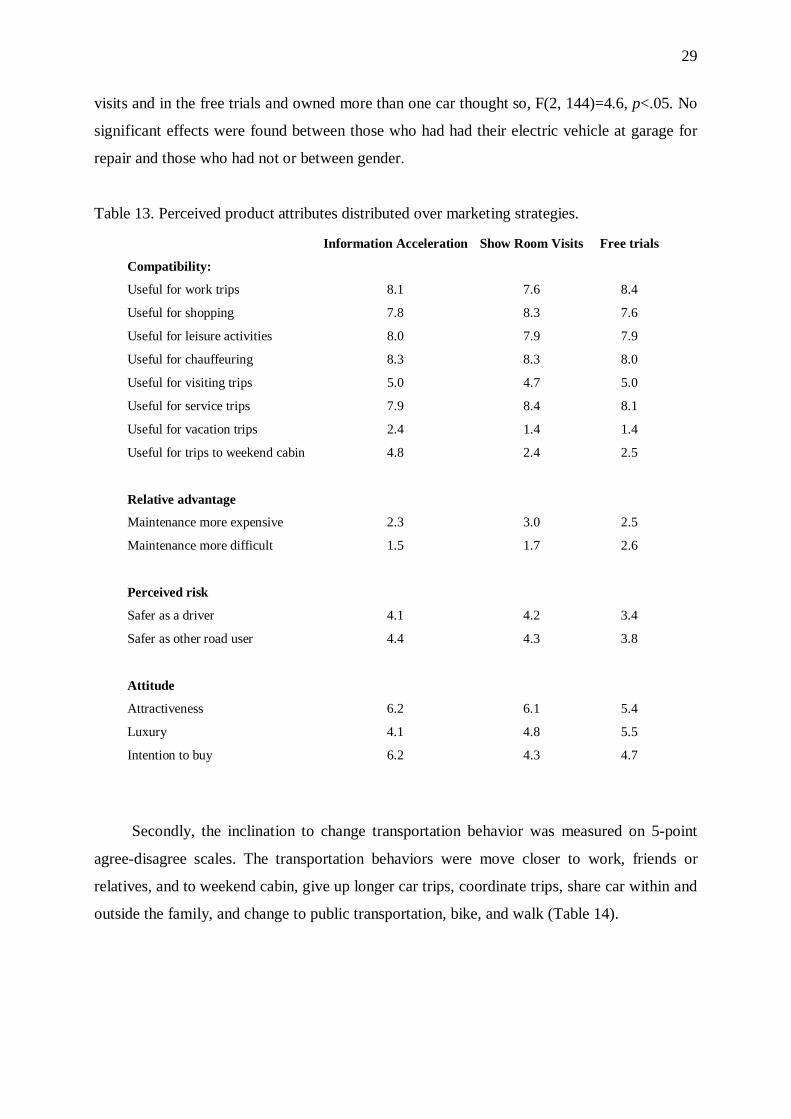
scales (Table 13). The subjects participating in the information acceleration study perceived
the electric vehicle as higher in compatibility, as providing more relative advantage and
safety, and their attitudes towards the vehicle were more positive. They perceived the electric
vehicle as more useful for vacation trips and trips to weekend cabins, as easier to maintain,
and their intention to buy the vehicle was higher even though they perceived the electric
vehicle as less luxury, F(2, 140)=6.7, p<.01, F(2, 118)=10.1, p<.001, F(2, 141)=3.3, p<.05,
F(2, 141)=4.6, p<.05, and F(2, 140)=3.3, p<.05. Furthermore, if they owned an only car they
perceived the electric vehicle as more attractive while subjects participating in the show room
29
visits and in the free trials and owned more than one car thought so, F(2, 144)=4.6, p<.05. No
significant effects were found between those who had had their electric vehicle at garage for
repair and those who had not or between gender.
Table 13. Perceived product attributes distributed over marketing strategies.
Information Acceleration Show Room Visits Free trials
Compatibility:
Useful for work trips 8.1 7.6 8.4
Useful for shopping 7.8 8.3 7.6
Useful for leisure activities 8.0 7.9 7.9
Useful for chauffeuring 8.3 8.3 8.0
Useful for visiting trips 5.0 4.7 5.0
Useful for service trips 7.9 8.4 8.1
Useful for vacation trips 2.4 1.4 1.4
Useful for trips to weekend cabin 4.8 2.4 2.5
Relative advantage
Maintenance more expensive 2.3 3.0 2.5
Maintenance more difficult 1.5 1.7 2.6
Perceived risk
Safer as a driver 4.1 4.2 3.4
Safer as other road user 4.4 4.3 3.8
Attitude
Attractiveness 6.2 6.1 5.4
Luxury 4.1 4.8 5.5
Intention to buy 6.2 4.3 4.7
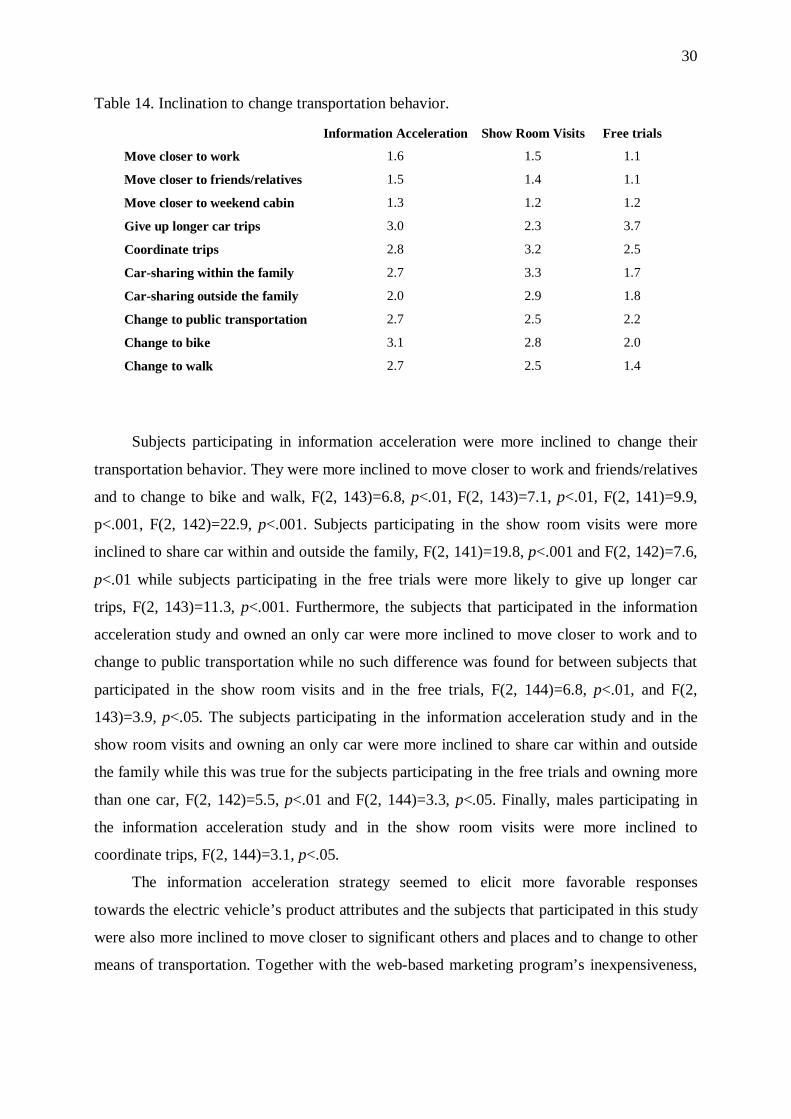
Secondly, the inclination to change transportation behavior was measured on 5-point
agree-disagree scales. The transportation behaviors were move closer to work, friends or
relatives, and to weekend cabin, give up longer car trips, coordinate trips, share car within and
outside the family, and change to public transportation, bike, and walk (Table 14).
30
Table 14. Inclination to change transportation behavior.
Information Acceleration Show Room Visits Free trials
Move closer to work 1.6 1.5 1.1
Move closer to friends/relatives 1.5 1.4 1.1
Move closer to weekend cabin 1.3 1.2 1.2
Give up longer car trips 3.0 2.3 3.7
Coordinate trips 2.8 3.2 2.5
Car-sharing within the family 2.7 3.3 1.7
Car-sharing outside the family 2.0 2.9 1.8
Change to public transportation 2.7 2.5 2.2
Change to bike 3.1 2.8 2.0
Change to walk 2.7 2.5 1.4
Subjects participating in information acceleration were more inclined to change their
transportation behavior. They were more inclined to move closer to work and friends/relatives
and to change to bike and walk, F(2, 143)=6.8, p<.01, F(2, 143)=7.1, p<.01, F(2, 141)=9.9,
p<.001, F(2, 142)=22.9, p<.001. Subjects participating in the show room visits were more
inclined to share car within and outside the family, F(2, 141)=19.8, p<.001 and F(2, 142)=7.6,
p<.01 while subjects participating in the free trials were more likely to give up longer car
trips, F(2, 143)=11.3, p<.001. Furthermore, the subjects that participated in the information
acceleration study and owned an only car were more inclined to move closer to work and to
change to public transportation while no such difference was found for between subjects that
participated in the show room visits and in the free trials, F(2, 144)=6.8, p<.01, and F(2,
143)=3.9, p<.05. The subjects participating in the information acceleration study and in the
show room visits and owning an only car were more inclined to share car within and outside
the family while this was true for the subjects participating in the free trials and owning more
than one car, F(2, 142)=5.5, p<.01 and F(2, 144)=3.3, p<.05. Finally, males participating in
the information acceleration study and in the show room visits were more inclined to
coordinate trips, F(2, 144)=3.1, p<.05.
The information acceleration strategy seemed to elicit more favorable responses
towards the electric vehicle’s product attributes and the subjects that participated in this study
were also more inclined to move closer to significant others and places and to change to other
means of transportation. Together with the web-based marketing program’s inexpensiveness,
31
easy accessibility, and potential of providing a user personalized information this might quite
well give the information acceleration strategy a decent possibility of reaching and making
costumers looking for new cars for sale on the market aware of, and interest in, the electric
alternative.
8. ELECTRIC VEHICLE DRIVE
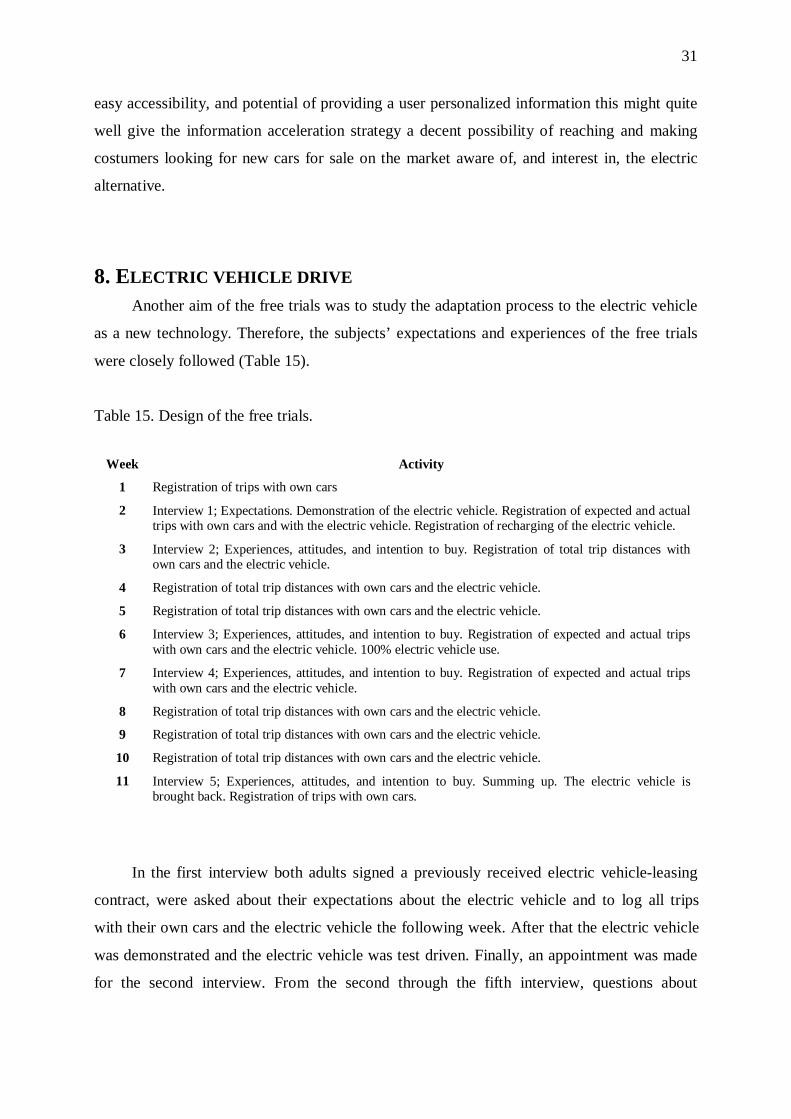
Another aim of the free trials was to study the adaptation process to the electric vehicle
as a new technology. Therefore, the subjects’ expectations and experiences of the free trials
were closely followed (Table 15).
Table 15. Design of the free trials.
Week Activity
1 Registration of trips with own cars
2 Interview 1; Expectations. Demonstration of the electric vehicle. Registration of expected and actualtrips with own cars and with the electric vehicle. Registration of recharging of the electric vehicle.
3 Interview 2; Experiences, attitudes, and intention to buy. Registration of total trip distances withown cars and the electric vehicle.
4 Registration of total trip distances with own cars and the electric vehicle.
5 Registration of total trip distances with own cars and the electric vehicle.
6 Interview 3; Experiences, attitudes, and intention to buy. Registration of expected and actual tripswith own cars and the electric vehicle. 100% electric vehicle use.
7 Interview 4; Experiences, attitudes, and intention to buy. Registration of expected and actual tripswith own cars and the electric vehicle.
8 Registration of total trip distances with own cars and the electric vehicle.
9 Registration of total trip distances with own cars and the electric vehicle.
10 Registration of total trip distances with own cars and the electric vehicle.
11 Interview 5; Experiences, attitudes, and intention to buy. Summing up. The electric vehicle isbrought back. Registration of trips with own cars.
In the first interview both adults signed a previously received electric vehicle-leasing
contract, were asked about their expectations about the electric vehicle and to log all trips
with their own cars and the electric vehicle the following week. After that the electric vehicle
was demonstrated and the electric vehicle was test driven. Finally, an appointment was made
for the second interview. From the second through the fifth interview, questions about
32
experiences, attitudes, and intention to buy were posed. After the second interview the
subjects were asked to log total trip distance per car and week the following 3 weeks. In the
third interview the subjects were informed that they were not supposed to use their own cars
except for in cases of emergencies the following week. Furthermore, they were asked to log
all trips. After the fourth interview the families were asked to log total trip distances per car
and week the following 3 weeks. In the fifth interview a summery of experiences of the whole
study was included and the subjects were asked to log all trips made with their own cars the
following week. The total study period was 11 weeks and the families had the electric
vehicles for 9. The free trials were run from October 1998 through February 2000.
8.1 EXPECTATIONS
The subjects expected to share the use of the electric vehicle equally between the
spouses. They expected that the electric vehicles most often would be used for service and
shopping trips and least for vacation trips and trips to weekend cabins. They also expected
that the electric vehicle differed from their own cars with respect to acceleration, top speed,
and cargo capacity. On average the subjects expected to be able to drive 110 kilometers
before recharging was necessary. Furthermore, the subjects expected that they would have to
adjust their transportation behavior as well as their way of driving to the specific product
attributes of the electric vehicle.
8.2 TRIP AND RECHARGE LOGS
During the free trials the subjects (42 families) drove a total of 199,395 kilometers and
made 6,567 trips. The electric vehicles were driven a total of 65,364 kilometers and 3.567
were made with the vehicles. The vehicles were recharged before it was necessary in about 92
% of the recharges and on average the subjects recharged the vehicles when 40.1 Ah was left
(or about 50 % of the total driving range). There was no change in recharge behavior over
time. The electric vehicles were most often recharged at home (in 66.3 % of the recharges).
All trips made with the subjects’ own cars were logged during weeks 1 and 11. During weeks
2, 6, and 7 all trips with both the subjects own cars and with the electric vehicles were logged
and during weeks 3, 4, 5, 8, 9, and 10, total travel distances with both the subjects own cars
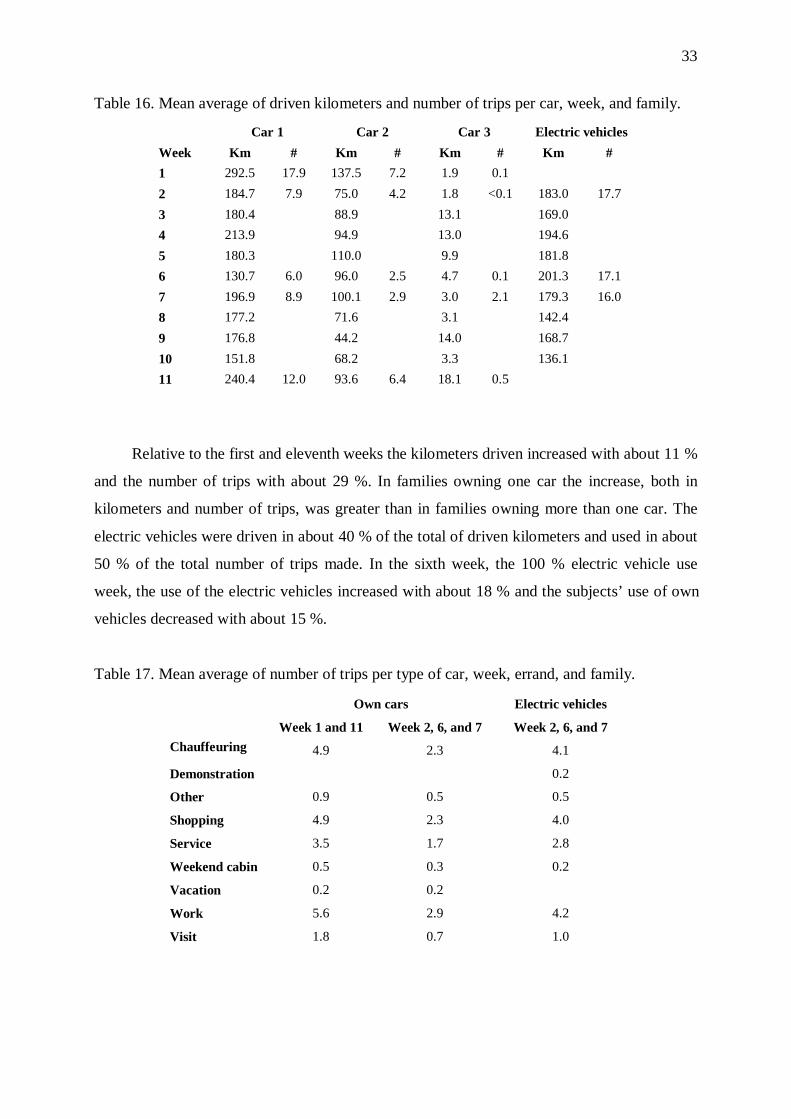
and the electric vehicles were logged (Table 16).
33
Table 16. Mean average of driven kilometers and number of trips per car, week, and family.
Car 1 Car 2 Car 3 Electric vehicles
Week Km # Km # Km # Km #
1 292.5 17.9 137.5 7.2 1.9 0.1
2 184.7 7.9 75.0 4.2 1.8 <0.1 183.0 17.7
3 180.4 88.9 13.1 169.0
4 213.9 94.9 13.0 194.6
5 180.3 110.0 9.9 181.8
6 130.7 6.0 96.0 2.5 4.7 0.1 201.3 17.1
7 196.9 8.9 100.1 2.9 3.0 2.1 179.3 16.0
8 177.2 71.6 3.1 142.4
9 176.8 44.2 14.0 168.7
10 151.8 68.2 3.3 136.1
11 240.4 12.0 93.6 6.4 18.1 0.5
Relative to the first and eleventh weeks the kilometers driven increased with about 11 %
and the number of trips with about 29 %. In families owning one car the increase, both in
kilometers and number of trips, was greater than in families owning more than one car. The
electric vehicles were driven in about 40 % of the total of driven kilometers and used in about
50 % of the total number of trips made. In the sixth week, the 100 % electric vehicle use
week, the use of the electric vehicles increased with about 18 % and the subjects’ use of own
vehicles decreased with about 15 %.
Table 17. Mean average of number of trips per type of car, week, errand, and family.
Own cars Electric vehicles
Week 1 and 11 Week 2, 6, and 7 Week 2, 6, and 7
Chauffeuring 4.9 2.3 4.1
Demonstration 0.2
Other 0.9 0.5 0.5
Shopping 4.9 2.3 4.0
Service 3.5 1.7 2.8
Weekend cabin 0.5 0.3 0.2
Vacation 0.2 0.2
Work 5.6 2.9 4.2
Visit 1.8 0.7 1.0
34
The most frequent trips were work and chauffeuring (20.7 % and 18.4 %) while
demonstrations and vacations (both less than 1 %) were the most infrequent (Table 17). The
number of chauffeuring, shopping, and service trips increased most and these were also the
trips most often made with the electric vehicles.
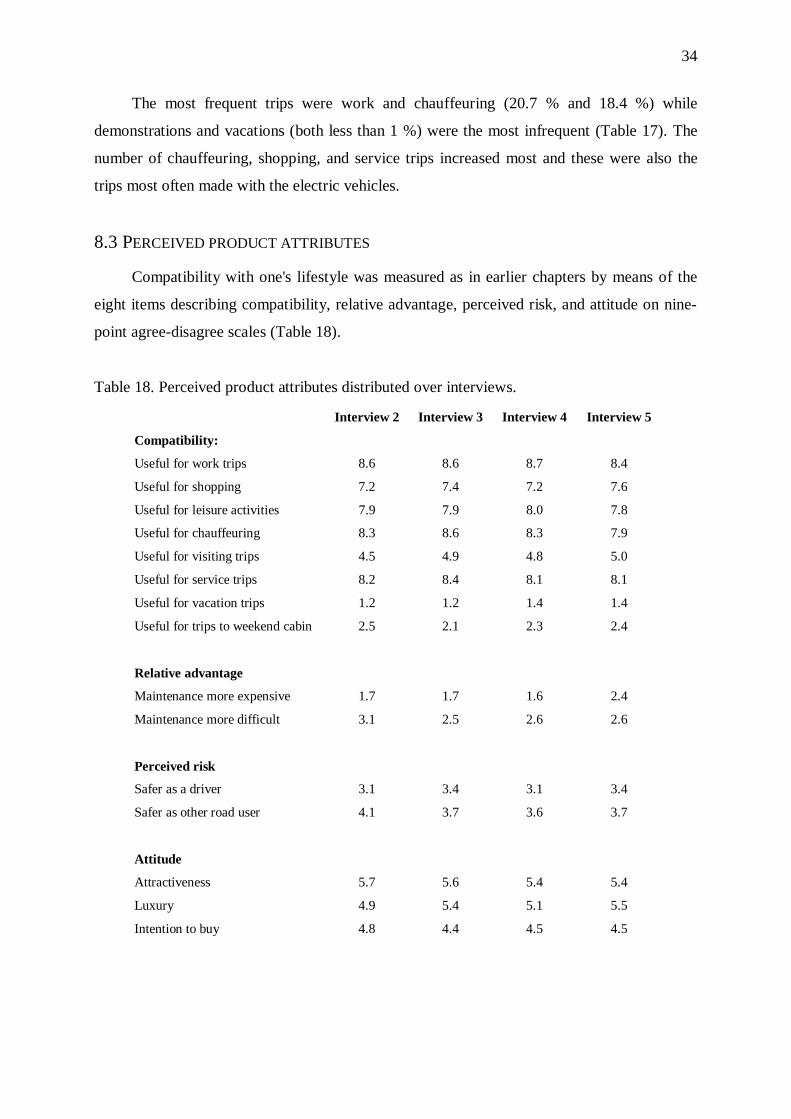
8.3 PERCEIVED PRODUCT ATTRIBUTES
Compatibility with one's lifestyle was measured as in earlier chapters by means of the
eight items describing compatibility, relative advantage, perceived risk, and attitude on nine-
point agree-disagree scales (Table 18).
Table 18. Perceived product attributes distributed over interviews.
Interview 2 Interview 3 Interview 4 Interview 5
Compatibility:
Useful for work trips 8.6 8.6 8.7 8.4
Useful for shopping 7.2 7.4 7.2 7.6
Useful for leisure activities 7.9 7.9 8.0 7.8
Useful for chauffeuring 8.3 8.6 8.3 7.9
Useful for visiting trips 4.5 4.9 4.8 5.0
Useful for service trips 8.2 8.4 8.1 8.1
Useful for vacation trips 1.2 1.2 1.4 1.4
Useful for trips to weekend cabin 2.5 2.1 2.3 2.4
Relative advantage
Maintenance more expensive 1.7 1.7 1.6 2.4
Maintenance more difficult 3.1 2.5 2.6 2.6
Perceived risk
Safer as a driver 3.1 3.4 3.1 3.4
Safer as other road user 4.1 3.7 3.6 3.7
Attitude
Attractiveness 5.7 5.6 5.4 5.4
Luxury 4.9 5.4 5.1 5.5
Intention to buy 4.8 4.4 4.5 4.5
35
There was only one attribute that reached significance between interviews, F(3,
333)=4.7, p<.01. The subjects perceived the maintenance costs as higher at the point of the
last interview. However, females perceived to a higher degree the electric vehicles as safer for
drivers and other road users, the maintenance as more difficult and the electric vehicles as
more useful for service and visiting trips, F(1, 335)=9.2, p<.01, F(1, 335)=5.6, p<.05, F(1,
336)=16.8, p<.001, F(1, 335)=3.9, p<.05, and F(1, 335)=6.0, p<.05. Subjects owning an only
car perceived the electric vehicles’ as more usefulness for leisure and for trips to weekend
cabins, as more luxurious and attractive, and they were also more inclined to buy, F(1,
335)=9.1, p<.01, F(1, 336)=6.8, p<.01, F(1, 335)=8.8, p<.01, F(1, 336)=17.8, p<.001, and
F(1, 322)=14.9, p<.001. Finally, the subjects that had had their electric vehicle at the garage
for repair perceived the maintenance costs as higher, F(1, 334)=10.2, p<.01.
8.4 EXPERIENCES
More than half of the subjects reported, as expected on before hand, that they had
changed their travel behavior and their way of driving to match the specific attributes of the
electric vehicles. The subjects perceived that the driving range per charge was about 65
kilometers, which actually was a very correct figure. About 70 % of the subjects perceived
this range per charge as too short. They meant that a driving range per charge should, at least,
be about 140 kilometers. The subjects reported that they had used the electric vehicles for city
and country driving and most often for work trips. About 60 % of the subjects believed that
they would have used fast recharging facilities if they had had access to it. Most subjects
(90.3 %) stated that the information previously received concerning how to use the electric
vehicle was sufficient.
The subjects perceived the electric vehicles as quieter than their own cars, as having
enough passenger space but as having too small a cargo space. Most subjects thought that the
electric vehicle had fulfilled their travel needs (87.3 %) and their expectations (92.9 %).
Furthermore, more subjects could imagine themselves as electric vehicle-owners than as
electric vehicle-leasers (64.4 % and 23.7 %). Only five subjects were willing to pay more (on
average SEK 10,500) for an electric than for a conventional vehicle of the same make and
model. The electric vehicle was perceived as most suitable as a second-car and that its driving
range, recharging time, and recharging facilities for private electric vehicle-owners outside the
home needed further attention.
36
8.5 SUMMARY OF ELECTRIC VEHICLE DRIVE
The subjects in the free trials had no major problems in using the electric vehicles for
their daily travel. They also stated that the vehicles had fulfilled their travel needs and
expectations even though they stated that the driving range of the vehicles was too short and
that the cargo capacity was too small. In spite of this the electric vehicles, regardless of car-
ownership, were used in about 40 % of the total of the driven kilometers, in about half of the
total number of the trips made, and for all kinds of trips. An unwanted side effect of the free
trials was, however, that both the number of trips and the kilometers driven increased during
the study period.
Only two subjects stated that they had started to recharge after the warning sign was
shown (about 12 Ah left or about 7 kilometers of driving). On average the subjects started to
recharge when there was about 40 Ah (about half of the total driving range) left and there was
no change in recharging behavior over time. This might reflect uneasiness with the risk of
being out of energy in the wrong situations or the subjects’ true transportation needs.
There were almost no changes in favor of the electric vehicle over interviews. Why the
subjects in the last interview perceived maintenance costs as more expensive than earlier is,
however, somewhat difficult to understand. There were, for instance, no associations to
having had the electric vehicle at the garage for repair or having read, seen, or heard anything
about electric vehicle maintenance costs. Maybe, the thought of actually buying an electric
vehicle in the end of the study became more real, which led the subjects to start to think about
the uncertainty about the battery costs if a replacement of the battery pack became necessary.
Why there was no change in favor of the electric vehicle over interviews, or with
practical experience, might in part be explained by the fact that the Renault does not seem to
bee a very popular car make according to the information acceleration study. Hence, it is
possible that the subjects did not distinguish between the make of the car and the car
technology. Another possibility is that the subjects made their assessments relative to their
own vehicles, which most often were larger vehicles. Less than 10 % of the families had own
vehicles of the same size as the Renault. Besides a longer driving range a larger cargo
capacity was of great importance, which is not difficult to understand given that the subjects
participating in free trials all had children and often had prams to carry.
On the other hand, despite the incompatibilities with the electric vehicle’s specific
product attributes the subjects’ perceptions did not either change in a negative direction. This
37
must, indeed, be interpreted as favorable for the electric vehicle. It is still quite possible that
an electric vehicle such as the Renault Clio Electrique better suits subjects with a life situation
different from those that participated in the free trials reported here. Therefore, in future
research, it might be worthwhile to try out free trials with subjects whose transportation needs
and general life situation are more compatible with the specific attributes of the electric
vehicle in question.
With respect to gender and car-ownership, females and subjects that had an only car
were more in favor of the electric vehicle. Reasons, mentioned in the interviews, for the
former could be that females experienced a greater feeling of cleanliness when driving the
electric vehicle and they also perceived the ease of being able to “fuel” at home as higher.
Somewhat more surprising was the latter finding, that subjects that had an only car, were
more positive towards the electric vehicle than subjects owning more than one car. The
electric vehicle has, nationally and internationally, often been discussed as the perfect second-
car alternative in multi-car households since its drawbacks (e.g. limited driving range and
long recharging times) would not be that problematic when there was another car available to
take care of this. Maybe, it is time to reconsider the appropriateness of the electric vehicle as a
second-car in multi-car households.
9. CONCLUDING REMARKS
This report deals with the issue of how a new and environment-friendly car technology
may be diffused into the private car market. A theoretical model outlining the key
determinants of a consumer’s adoption of the electric vehicle is developed, a communication
strategy is suggested, and the adaptability to the electric vehicle as a new technology is
revealed.
Basically, it is suggested that the adoption of the electric vehicle depends on how the
vehicles specific product attributes are perceived, on personal traits, and on background
variables. Further, it shows that those most interested in adopting an electric vehicle are those
with the most favorable attitude towards the vehicle, which, in turn, mainly depends on the
perception of the electric vehicle’s usefulness and on the importance put on it’s technical
performance. However, hardly anyone finds the limitations of the electric vehicle (e.g. driving
range and recharging time) as unimportant, which means that improvement of the battery
38
technology now really must be given a very high priority. Besides, paying attention to those
specific product attributes of the electric vehicle producers also should pay particular attention
to the needs and wants of female costumers who are on the rise as car purchasers as well as
the most interested in environmental-friendly transportation.
Furthermore, this report also suggests that using a web-based information acceleration
strategy early on in the marketing process could be of great value in the kick off an interest in
the electric vehicle concept. However, to actually buy a new product such as a concept like
this definitely requires more than just favorable responses elicited by a marketing program. In
the free trials (e.g. the electric vehicle drives) it was revealed that the subjects had no major
problems with the electric vehicle’s limitations (e.g. driving range and recharging time) in
their daily travel but that the feeling of being limited was (e.g. the attitudes and the intention
to buy an electric vehicle did not change over time). One reason for this was, without doubt,
that the entire life situation of the subjects participating in the free trials was not exactly
compatible with the attributes of the electric vehicle used. On the other hand, despite the
incompatibilities the subjects’ perceptions did not change in an unfavorable direction over
time either. It is still quite possible that an electric vehicle such as the Renault Clio Electrique
fits subjects with a life situation more compatible with the vehicle’s product attributes better.
Maybe, those who already own a same-sized car and, hence, are used to drive, and already
have adjusted their behavior to, a car of that size just would love it because of its true pros.
Finally, the results from the free trials in this report might, through the added knowledge of
private costumers experiences and preferences, have a positive effect on the experience curve.
10. ACKNOWLEDGEMENTS
This research was financially supported by a grant from the Swedish Communications
and Transport Research Board (#1998-0111). As in all research many have been involved and
many have been supportive in many different ways, though, some have been exceptional.
First, a very special thank to John Thøgersen, who is the first author of Chapter 6, for his
excellent guiding into the area of marketing research. Moreover, to Daniel Sperling for his
interest in my work, to Mattias Lundberg for helping me to find the positive in the negative,
to Amelie Gamble and Cecilia Jakobsson for doing the interviews, to Björn Berle and Anders
Johansson for serving as car-dealers and research leaders, for taking care of the logistics, the

39
demonstrations, and most of the data entering. Finally, to Marcos Alemparte, Ove Eriksson,
and Conny Sahlstedt for taking care of the service of the electric vehicles. Also thanks to all
subjects for your tremendous contributions to this research, and to all becoming civil
engineers at the former Department of Road and Traffic Planning for entering data.

40
11. REFERENCES
Beggs, S. D., Cardell, N.S., & Hausman L. (1981). Assessing the potential demand forelectric cars. Journal of Econometrics, 16, 1-19.
Berger, I. E., Ratchford, B. T., & Haines Jr., G. H. (1994). Subjective productknowledge as a moderator of the relationship between attitudes and purchase intentions for adurable product. Journal of Economic Psychology, 15, 301-314.
Biel, A. & Dahlstrand, U. (1997). Habits and the establishment of ecological purchasebehavior. In IAREP XXII Conference, pp. 367-381. Valencia, Spain: Corpas.
Boomsma, A. (1982). The robustness of LISREL against small samples in factoranalysis models. In K. G. Jöreskog and H. Wold. (eds), Systems under indirect observation,Part I, pp- 149-173. Amsterdam: North-Holland.
Brundtland, G. H. (1987). Our common future: A report from the world commission onenvironment and development. Oxford: Oxford University Press.
Bunch, D. S., Golob, T. F., Kitamura, R., & Occhiuzzo, G. P. (1993). Demand for cleanfueled vehicles in California: A discrete-choice, stated preference survey. TransportationResearch A, 27A, 237-253.
Chaston, I. (1999). New marketing strategies. Guilford, UK: Biddles.
Chéron, E. & Zins, M. (1997). Electric vehicle purchasing intentions: The concern overbattery charge duration. Transportation Research A, 31, 235-243.
Deshpande, G. K. (1984). Development of driving schedules for advanced vehicleassessment. SAE Technical Paper Series No 840360, Warrendale.
Eagly, A. H. & Chaiken, S. (1993). The psychology of attitudes. Fort Worth: Harcourt.
Fishbein, M. (1963). An investigation of the relationships between beliefs about anobject and the attitude toward that object. Human Relations, 16, 233-239.
Fessel, G. (1995). Electrically propelled road vehicles� ,QVWLWXW I&U 0DUktforschung,Vienna, Austria.
Goldsmith, R. E. & Hofaker, C. F. (1991). Measuring consumer innovativeness. Journalof the Academy of Marketing Science, 19, 209-221.
Golob, T. & Gould, J. (1998). Projecting use of electric vehicles from household vehicletrials. Transportation Research B, 32, 441-454.
Gärling, A., Johansson, A., Montgomery, W., & Gärling, T. (1996). Elbilars förmågaatt tillgodose hushålls behov av dagliga tätortsresor, Delrapport 1, Göteborg universitet:Psykologiska institutionen.
Gärling, A., Johansson, A., & Gärling, T. (1997). Hushålls val av elbilsresor.Delrapport 3, Göteborg universitet: Psykologiska institutionen.
Gärling, A. & Thøgersen, J. (2000). Marketing of electric vehicles. Business Strategyand the Environment. (In press).
Heberlein, T. A. (1972). The land ethic realized: Some social psychologicalexplanations for changing environmental attitudes. Journal of Social Issues, 28, 79-87.
Jöreskog, K. G. & Sörbom, D. (1999). Lisrel8: New statistical features. Chicago:Scientific Software International.
41
Kotler, P. (1997). Marketing Management: Analysis, Planning, Implementation, andControl (9th edn). Upper Saddle River, NJ: Prentice Hall.
Nadis, S. & MacKenzie, J. J. (1993). Car trouble: How new technology, clean fuels,and creative thinking can revive the auto industry and save our cities from smog and gridlock.Boston: Beacon Press.
Nesbitt, K., Kurani, M., & DeLuchi, M. D. (1992). Home recharging and the householdelectric vehicle market: A constraint analysis. Transportation Research Record No 1366, 11-19.
Power, J. D. & Associates (1993). Automotive consumer profile study. The PowerReport, USA.
Rogers, E. M. (1983). Diffusion of innovations, 3rd ed. New York: Free Press.
Sperling, D. (1996). Future drive. Electric vehicles and sustainable transportation.Washington, D. C. Island Press.
Stern, P. C. & Dietz, T. (1994). The value basis of environmental concern. Journal ofSocial Issues, 50, 65-84.
Thøgersen, J. (1998). Knowledge barriers to sustainable consumption. Paper presentedat the Nordic Consumer Research Conference, Lillehammar, Norway, 11-14 November.
Thøgersen, J. & Gärling, A. (2000). Consumers´ readiness to adopt an environment-friendly automotive innovation. (Submitted for publication).
Turrentine, T. & Kurrani, K. (1992). The household market for electric vehicles:Testing the hybrid household hypothesis – A reflexive designed survey of new-car-buying,multivehicle California households. Technical Report from the Institute of TransportationStudies, University of California, Davis, CA.
Urban, G. L., Weiberg, B. D., & Hauser, J. R. (1996). Premarket forecasting of really-new products. Journal of Marketing, 60, 47-60.
Weinberg, B. D. (1992). An information-acceleration-based methodology fordeveloping preproduction forecasts for durable goods: Design, development, and initialvalidation. Doctoral Thesis, Sloan School of Management, Massachusetts Institute ofTechnology.
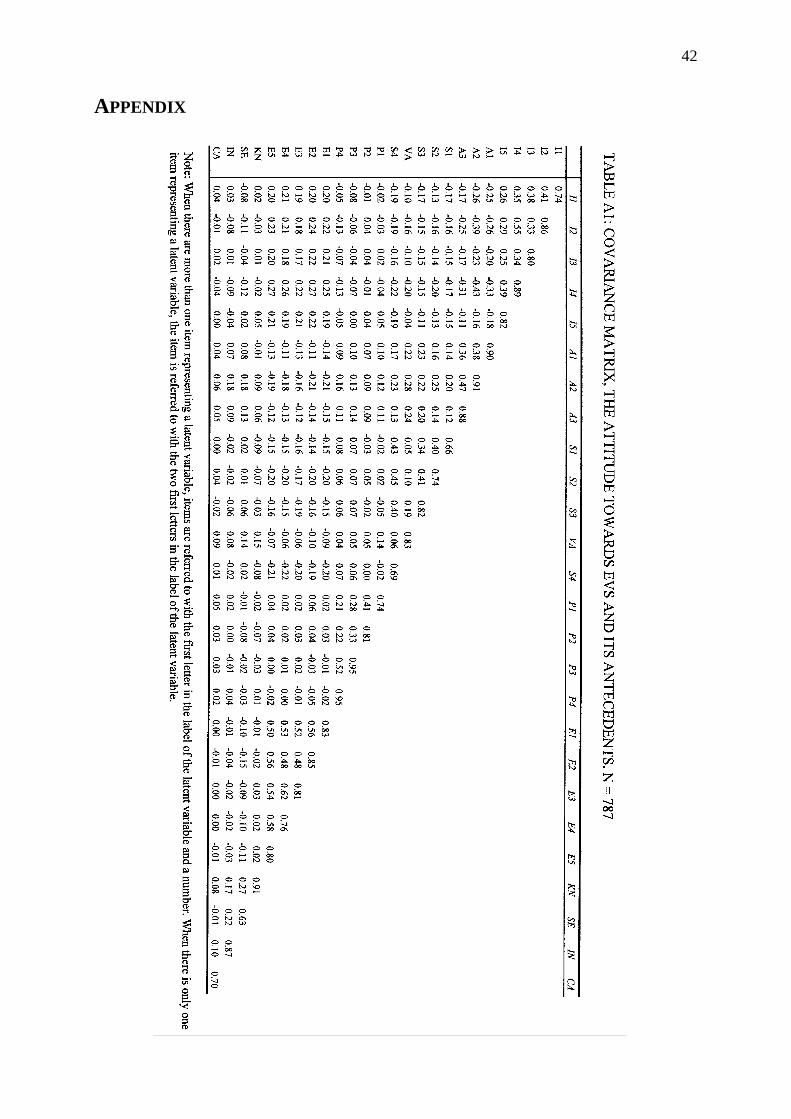
42
APPENDIX

43


Förteckningar över KFBs olika publikationsserier, bl a• Rapporter• Meddelanden• KFB-Information• Publikationer inom KFBs bio- och elprogramkan erhållas från KFB.
KFB (The Swedish Transport and CommunicationsResearch Board) is a government agency with planning, initia-ting, coordinating and supporting functions in Swedish trans-port and communications research. KFB’s activities encompasstransportation, traffic, postal services and telecommunications,as well as the impact of transports and communications on theenvironment, traffic safety and regional development. KFB is also responsible for information and documentationwithin its areas of responsibility.
Postal address: Box 5706, S-114 87 Stockholm, SwedenVisiting address: Linnégatan 2, StockholmPhone: 08-459 17 00; Int: +46 8 459 17 00Fax: 08-662 66 09; Int: +46 8 662 66 09
Internet Home page: www.kfb.seE-mail: [email protected]