MARKET REVIEW - Skybound Capital€¦ · sector that closed the month ... performer was the ... The...
18
MARKET REVIEW December 2017
Transcript of MARKET REVIEW - Skybound Capital€¦ · sector that closed the month ... performer was the ... The...

MARKET REVIEW
December 2017

ContentsMONTHLY REVIEW
Global Market Review
1. Global Market Data Table2. Global Market Commentary3. Global Market Performance Graph4. Global Sector Performance5. US Dollar vs International Currencies6. Commodities Performance
Local Market Review
1. The South African Rand2. The JSE All Share Index3. 5 Year JSE All Share Index4. 5 Year JSE All Share Index vs Global Indexes (USD)5. The JSE All Share Index Subsectors6. The South African Fixed Income & Property

Global Market ReviewSKYBOUND CAPITAL

Data TablesMONTHLY REVIEW
INTERNATIONAL INDICATORS LOCAL INDICATORS
Closing Price
December 2017
November 2017
Year to Date 2016
Closing Price
December 2017
November 2017
Year to Date 2016
MSCI World (US$) 2 103 1,26% 1,99% 20,11% 5,32% Top40 Index 52 533 -1,38% 1,33% 19,66% -4,14%
MSCI Emerging Markets (US$) 1 158 3,36% 0,15% 34,35% 8,58% Mid Cap Index 80 245 4,47% 2,22% 3,68% 23,42%
JSE All Share 59 505 -0,45% 1,34% 17,47% -0,08% Small Cap Index 60 971 3,25% -3,26% -1,04% 15,92%
MSCI China 89 2,00% 1,66% 52,34% -1,38% Resources 36 293 -1,06% -1,52% 13,03% 26,44%
Stoxx Europe 600 389 0,64% -2,16% 7,68% -1,20% Industrials 79 085 -4,79% 1,48% 23,03% -10,41%
S&P 500 2 674 0,98% 2,81% 19,42% 9,54% Finanicals 17 873 9,63% 5,70% 18,54% -1,03%
Platinum Producers 20 -5,47% -6,52% -1,01% 50,46%
Oil Spot 66,87 5,19% 3,58% 17,69% 52,41% Gold Producers 1 304 -10,30% 5,54% -4,31% 28,85%
Gold Spot 1 303 2,20% 0,30% 13,09% 8,56%
Platinum Spot 931 -1,29% 2,58% 2,99% 1,16% 10 Year Governenment Bond 8,60% 4,35% -1,37% 1,28% 5,12%
JSE Listed Property 2 464 4,21% 1,92% 17,15% 10,20%
Rand / Dollar 12,38 9,64% 3,06% 9,80% 11,33% All Bond Index 588 5,60% -0,97% 10,16% 15,45%
Dollar / Pound 1,35 -0,04% 1,84% 9,42% -16,14%
Rand / Pound 16,73 -9,81% -1,17% -1,29% -25,69%
Dollar / Euro 1,20 0,85% 2,22% 14,12% -3,10%

The JSE All-Share ended the month of December down 0.45%. By sector the largest gainer was the Financial sector that closed the month positively, up 9.77%, supported by double digit positive returns in the month from FirstRand (+19.34%), RMB Holdings (+18.34%), Barclays Africa (+15.34%). By sector, the worst performer was the information Technology sector, down 9.39%, weighed down by a 19.83% drop in EOH Holdings Ltd. In addition, consumer discretionary stocks dropped by 8.41%, weighed down by declines in Steinhoff International (-91.73%), Steinhoff Africa Retail (-13.78%), and Naspers (-6.42%).
Among specific shares, the Steinhoff accounting scandal dominated headlines in December, which saw its shares price drop over 90% during December. At this stage, it appears that losses within the group have been masked in “off-balance sheet entities”, thus inflating earnings. It has been announced that the entity’s financials will need to be restated from its 2015 financial year.
The Rand recorded its worst level of R14.47 and its best level of R12.43 against the US Dollar in 2017. The Rand strengthened considerably against major currencies, as markets priced in Cyril Ramaphosa to win the ANC presidential election, who is seen as a market friendly presidential candidate. During the 7th to the 29th
December, the Rand strengthened by 9.87% to settle at the R12.38/$ mark, where the local currency has continued to trade well below the R13/$ mark, however, market participants anticipate the Rand to weaken back to a fair value of mid R13/$.
Lastly, on a local economic front, data was released in early December, indicated that the third quarter GDP grew by 2%. The largest contributor to the third quarter’s growth was the agricultural sector, which comprises of 44.2% of the national GDP, adding 9.6%. Mining production increased by 5.2% YoY (est. 4.1%) amid better-than-expected October mining data. Lastly, YoY headline inflation slowed to 4.6% for November (Oct 4.8%) and MoM inflation slowed to 0.1% from 0.3% in October 2017.
CommentaryMONTHLY REVIEW
CHINA AND ASIA
EUROPE
UNITED STATES
SOUTH AFRICAThe STOXX 600 added 0.43% for the month of December. By sector, Basic Resources featured as the strongest performers, up 9.89%. In contrast, Utility stocks featured as the worst performers, down 3.89%. The FTSE 100 attributed positively to the gauge, featuring as the region’s top performer, up 4.93%. In contrast, the German DAX and French CAC 40 Index ended the month in negative territory, down 0.82% and 1.12% respectively.
In Europe, political risks remain elevated, amid the inclusive German election and stalled coalition talks, which rattled European markets mid-December. In addition, Italy’s political landscape has shifted significantly over the past five years, where populist parties have gained significant traction while traditional centre-left parties have lost support. Italian President, Sergio Mattarella, has scheduled Italy’s first election in 5 years for 4th March 2018.
In response to the solid global economic growth, the European Central Bank (ECB) has kept its asset purchases at €30 billion per month in 2018, however, given the low inflation and the likelihood that price pressures will remain low for the majority of 2018 in the Eurozone, the ECB will probably only raise interest rates in 2019.
Lastly, the economic growth in the UK slowed down to 1.5% in 2017 (2016: 1.6%). The 0.1% cut in growth output implies a £9 billion decrease in fiscal revenue. This coupled with a sharp depreciation in the Pound has increased inflation in the UK. This may force the Bank of England to increase interest rates at least once in 2018 to combat rising inflation.
Asian equities ended the month of December up, with MSCI Asia Pacific Index adding 2.00%. The Hang Seng featured as the region’s top performer up 2.54%, followed by a 0.18% increase in the Japanese Nikkei 225 Index. In contrast, the Shanghai Composite Index fell 0.30%.
Among specific nations, China has embarked on a new five-year political cycle. During the previous five years, stimulus in property and infrastructure markets were prioritised to soften the economic slowdown. The 19th Party Congress have stated that they have shifted their focus from quantity of growth to quality of growth for the next five years.
Growth in China is expected to slow down to 6% in the medium term, amid tightening financial conditions. Chinese Policy makers have clamped down on shadow financing and credit growth has fallen to almost 10-year lows.
Monetary policy in China is expected remain stable, however authorities could step in, should economic growth drop below 6%. .
The S&P 500 ended the month of December up 0.98%, reaching the 2673.61-point mark. By sector, the largest gainer was the Telecommunications Services sector which closed the month positively (up 5.77%). The Dow Jones and NASDAQ Composite Index advanced in December, adding 1.84% and 0.43% respectively.
US equity markets performed well throughout 2017 and finished December with further gains. Improving earnings growth was the main contributor for the positive performance in 2017. In addition, the estimated fourth quarter earnings growth for the S&P 500 was 10.9%, with all 11 sectors anticipating growth from third-quarter levels.
Fixed income investment vehicles experienced a relatively more volatile year compared to equities, amid the Federal Reserve (Fed) raising interest rates three times in 2017. Market participants anticipate that the Fed will continue raising interest rates at least two times in 2018. Although these interest rate hikes indicate the central bank’s confidence in the US economy, it could have a negative impact on fixed income markets.
Lastly, the Fed’s latest quarterly economic projections has forecasted US economic growth to be 2.5% (previously 2.4%) for 2017 and 2.5% for 2018, which has taken into account the effect of the new tax legislation.

Performance Graph (USD)MONTHLY REVIEW
JSE Africa All Share Index; 10,06%
MSCI World Index; 1,26%S&P 500 Index; 0,98%STOXX Europe 600 Index; 0,64%
MSCI Asia Pacific Index; 2,00%
-6,00%
-4,00%
-2,00%
0,00%
2,00%
4,00%
6,00%
8,00%
10,00%
12,00%
JSE Africa All Share Index MSCI World Index S&P 500 Index STOXX Europe 600 Index MSCI Asia Pacific Index
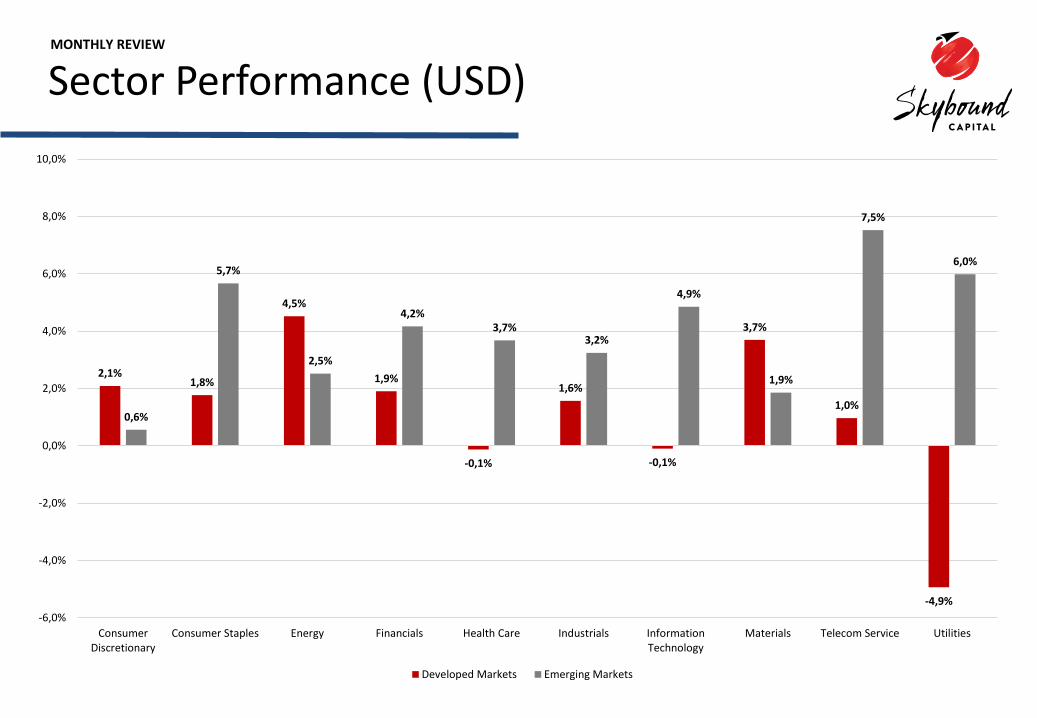
Sector Performance (USD)MONTHLY REVIEW
2,1%1,8%
4,5%
1,9%
-0,1%
1,6%
-0,1%
3,7%
1,0%
-4,9%
0,6%
5,7%
2,5%
4,2%3,7%
3,2%
4,9%
1,9%
7,5%
6,0%
-6,0%
-4,0%
-2,0%
0,0%
2,0%
4,0%
6,0%
8,0%
10,0%
ConsumerDiscretionary
Consumer Staples Energy Financials Health Care Industrials InformationTechnology
Materials Telecom Service Utilities
Developed Markets Emerging Markets

Performance Analysis (USD vs Global Currencies)
MONTHLY REVIEW
1,35
1,32
1,33
1,34
1,35
1,36
US
DO
LLA
RS
PER
PO
UN
D
112,69
111
112
113
114
YEN
PER
US
DO
LLA
R
1,20
1,16
1,17
1,18
1,19
1,20
1,21
US
DO
LLA
RS
PER
EU
RO
0,78
0,73
0,74
0,75
0,76
0,77
0,78
0,79
US
DO
LLA
RS
PER
AU
STR
ALI
AN
DO
LLA
R

Market Performance (Commodities)MONTHLY REVIEW
Commodities ended the month of December mostly higher, with the Bloomberg commodity index adding 2.88%. The global oil benchmark recorded its sixth consecutive month-on-month gain to close at a two year high of $66.87 per barrel.
Metal prices rose during December, supported by firm Chinese economic growth. Aluminium featured as the top performer, recording a price reversal of 11.08%. However palladium featured as the best performer for a second consecutive year, adding 55.29% in 2017 (2016: 21.57%).
-10%
0%
10%
20%
30%
40%
50%
60%
1 Year | Gold, Platinum and Palladium
Gold Platinum Palladium
75
77
79
81
83
85
87
89
91
1 Year | Bloomberg Commodities Index
COMMODITY PRICES (US$)
Closing PriceDecember
2017November
2017 Year to Date 2016
Gold 1 309,30 2,84% 0,21% 13,68% 8,63%
Platinum 934,20 -0,88% 2,49% 3,62% 1,11%
Palladium 1 061,00 5,40% 2,80% 55,29% 21,57%
Copper 330,05 8,68% -2,06% 31,73% 17,35%
Silver 17,15 4,66% -1,86% 7,23% 15,84%
Aluminium 2 258,25 11,08% -5,28% 33,31% 12,52%
Oil Spot 66,87 5,19% 3,58% 17,69% 52,41%
Coal 100,80 4,13% -3,10% 14,03% 74,70%
Natural Gas 2,95 -2,38% 4,45% -20,70% 59,35%
Sugar 15,16 0,53% 2,31% -22,30% 28,02%
Cocoa 1 892,00 -7,62% -2,20% -11,01% -33,79%
Coffee 126,20 -0,08% 0,96% -7,92% 8,17%
Corn 1,20 0,85% 2,22% 14,12% -3,10%

South African Market ReviewSKYBOUND CAPITAL

Performance (South African Rand)MONTHLY REVIEW
During the month of December, the Rand recorded its worst level of R13.70 and its best level of R12.43 against the US Dollar. The Rand strengthened considerably against major currencies, as markets priced in a Cyril Ramaphosa victory of the ANC 2017 presidential election, who is seen as a market friendly presidential candidate. During the 7th to the 29th December, the Rand strengthened by 9.87% to settle at the R12.38/$ mark, where the local currency has continued to trade well below the R13/$ mark, however, market participants anticipate the Rand to weaken back to a fair value of mid R13/$.
12,38
9,50
10,50
11,50
12,50
13,50
14,50
15,50
16,50
17,50
3 Year| Rand vs US Dollar
12,38
12,00
12,20
12,40
12,60
12,80
13,00
13,20
13,40
13,60
13,80
14,00RANDS PER US DOLLAR
14,96
14,00
14,50
15,00
15,50
16,00
16,50RANDS PER EURO
16,73
15,90
16,40
16,90
17,40
17,90
18,40
18,90 RANDS PER POUND
Closing Price
December 2017
November 2017
Year to Date 2016
Rands/US Dollar 12,38 9,64% 3,06% 9,80% 11,33%
Rands/Pound 16,73 9,81% 1,17% 1,29% 25,69%
Rands/Euro 14,96 8,30% 0,83% -3,51% 13,99%

Performance (JSE All Share Index)MONTHLY REVIEW
0,88%
4,21%
-3,11%
1,78%
3,38%
-0,47%
-3,64%
6,97%
2,38%
-1,67%
6,12%
1,34%
-6,00%
-4,00%
-2,00%
0,00%
2,00%
4,00%
6,00%
8,00%
JSE All Share Index | Monthly Performance
7,05%
-10,22%
-3,06%-4,64% -3,73%
3,95% 5,29%5,49%
-15%
-10%
-5%
0%
5%
10%
Performance of 10 Largest Index Members
-5%
-4%
-4%
-3%
-3%
-2%
-2%
-1%
-1%
0%
JSE All Share Index | Cumulative Performance
24,89% 24,30%21,77%
20,02% 19,34% 18,31% 18,06% 17,72% 17,53%
0%
5%
10%
15%
20%
25%
30%
Top 10 Performers

5-Year JSE Performance (ZAR)MONTHLY REVIEW
59 505
52 729
49 372
56 085
30 000
35 000
40 000
45 000
50 000
55 000
60 000
65 000

5 Year JSE vs Leading Global Indicators (USD)MONTHLY REVIEW
82,3%
53,5%
31,8%
24,6%
2,2%
-40%
-20%
0%
20%
40%
60%
80%
100%
S&P 500 Index MSCI World Index MSCI Asia Pacific Index STOXX Europe 600 Price Index JSE Africa All Share Index

Performance (JSE All Share Index Subsectors)MONTHLY REVIEW
Closing PriceDecember
2017November
2017 Year to Date 2016
Top40 Index 52 533 -1,38% 1,33% 19,66% -4,14%
Mid Cap Index 80 245 4,47% 2,22% 3,68% 23,42%
Small Cap Index 60 971 3,25% -3,26% -1,04% 15,92%
Resources 36 293 -1,06% -1,52% 13,03% 26,44%
Industrials 79 085 -4,79% 1,48% 23,03% -10,41%
Finanicals 17 873 9,63% 5,70% 18,54% -1,03%
Platinum Producers 20 -5,47% -6,52% -1,01% 50,46%
Gold Producers 1 304 -10,30% 5,54% -4,31% 28,85%
Dec| Forward P/E
Nov| Forward P/E
Oct | Dividend
Yield
Top40 Index 15,65 15,09 2,93%
Mid Cap Index 12,82 12,35 3,55%
Small Cap Index 10,36 9,85 4,04%
Resources 12,61 12,35 3,72%
Industrials 19,45 19,43 2,10%
Finanicals 12,04 10,57 4,22%
Platinum Producers 23,28 24,19 0,00%
Gold Producers 13,22 14,05 1,73%
-6%
-4%
-2%
0%
2%
4%
6%
Market Cap Performers
Top40 Index Mid Cap Index Small Cap Index

South African Fixed Income & PropertyMONTHLY REVIEW
-6,0%
-4,0%
-2,0%
0,0%
2,0%
4,0%
6,0%
8,0%
Relative Property Performance
FTSE/JSE SA Listed Property Total Return Index
FTSE JSE All Share Index Total Return Value
ALBI Total Return Index
STeFI Cash Rate
8,30%
8,50%
8,70%
8,90%
9,10%
9,30%
9,50%
SA 10 Year Government Bond Yield
10,6% 10,3% 10,2% 9,5% 9,5%
0,1% 0,1%
-3,4%
-7,0%
-15,0%-20,0%
-15,0%
-10,0%
-5,0%
0,0%
5,0%
10,0%
15,0%
Top & Bottom Performers
4,8%
5,0%
5,2%
5,4%
5,6%
5,8%
6,0%
6,2%
6,4%
6,6%
Spread of Dividend Yield vs Government Bonds

DisclaimerMONTHLY REVIEW
This presentation (the “Presentation”) is issued on a confidential basis bySkybound Capital Limited (“Skybound”) for information purposes onlyand is subject to change without notice.
This Presentation, its contents and any information provided ordiscussed in connection with it are strictly private and confidential andmay not be reproduced, redistributed or passed on, directly orindirectly, to any other person or published, in whole or in part, for anypurpose, without the consent of Skybound (provided that you maydisclose this Presentation on a confidential basis to your legal, tax orinvestment advisers (if any) for the purposes of obtaining advice).Acceptance of delivery of any part of the Presentation by you constitutesunconditional acceptance of the terms and conditions of this notice.
This Presentation does not itself constitute an offer to subscribe for orpurchase any securities, investment product or investment managementservices. This Presentation is not intended to be relied upon as the basisfor an investment decision, and is not, and should not be assumed to be,complete. It is provided for information purposes only. Any investmentis subject to various risks, none of which are outlined herein. All suchrisks should be carefully considered by prospective investors before theymake any investment decision.
You are not entitled to rely on this Presentation, and no responsibility isaccepted by Skybound or any of its directors, officers, partners,members, agents or advisers or any other person for any action taken onthe basis of the content of this Presentation. Skybound does notundertake to provide the recipient with access to any additionalinformation or to update this Presentation or to correct any inaccuraciestherein which may become apparent.
The views, opinions and forecasts expressed in this document are basedon Skybound’s research, analysis and house views at the time ofpublication. Tax assumptions may change if the law changes and thevalue of tax relief will depend upon individual circumstances.
No undertaking, representation, warranty or other assurance, express orimplied, is made or given by or on behalf of Skybound or any of itsrespective directors, officers, partners, members, employees, agents oradvisers or any other person as to the accuracy or completeness of theinformation or opinions contained in this Presentation and noresponsibility or liability is accepted by any of them for any suchinformation or opinions.
Past performance is not indicative of future results. The value ofinvestments may fall as well as rise and investors may not get back theamount invested. Changes in rates of foreign exchange may cause thevalue of investments to go up or down. No representation is being madethat any investment will or is likely to achieve profits or losses similar tothose achieved in the past, or that significant losses will be avoided.
The internal rates of return or IRRs presented on a “gross” basis do notreflect any management fees, carried interest, taxes and allocableexpenses of the kind that will be borne by investors in a fund, which inthe aggregate may be substantial.
Statements contained in this Presentation that are not historical factsare based on current expectations, estimates, projections, opinions andbeliefs of Skybound. Such statements involve known and unknown risks,uncertainties and other factors, and undue reliance should not be placedthereon. In addition, this Presentation contains “forward-lookingstatements.” Actual events or results or the actual performance of theFund “the Fund” may differ materially from those reflected orcontemplated in such forward-looking statements.
Certain economic and market information contained herein has beenobtained from published sources prepared by third parties and in certaincases has not been updated through the date hereof. While such sourcesare believed to be reliable, neither Skybound nor any of its directors,partners, members, officers or employees, agents or advisor or anyother person assumes any responsibility for the accuracy orcompleteness of such information.
No person, especially those who do not have professional experience inmatters relating to investments, must rely on the contents of thisPresentation. If you are in any doubt as to the matters contained in thisPresentation you should seek independent advice where necessary. ThisPresentation has not been submitted to or approved by the securitiesregulatory authority in any state or jurisdiction. Except for Skybound andcertain other identified representatives of the Fund, no person has orwill be authorised to give any information or representation relating tothis Presentation.
This document does not constitute a solicitation, invitation orinvestment recommendation, and before selecting a financial product orfund. We recommended that investors seek specialised financial, legaland tax advice.
There is no assurance that the investment objective of the Fund or anyother cell is achievable. Investments in the Fund will be on the terms setout in the Fund’s Offering Memorandum and Constitution.
The content of this Presentation has not been independently verified norhas it, from a UK perspective, been approved by an authorised person,within the meaning of the UK Financial Services and Markets Act 2000(“FSMA”), as amended.
As an unregulated collective investment scheme, distribution andpromotion of Interests in the Fund are restricted for the purposes ofsection 21 and 238 of FSMA to persons who are “Qualifying Investors”,being persons who are investment professionals within the meaning ofArticle 19(5) of the FSMA (Financial Promotion) Order 2005, as amended
(“FPO”) or Article 14(5) of the FSMA (Promotion of Collective InvestmentSchemes) (Exemptions) Order 2001, as amended (“SPO”), sophisticatedinvestors within the meaning of Article 50 of the FPO or Article 23 of theSPO and high net worth companies, unincorporated associations etc.falling within Article 49(2)(1) to (d) of the FPO or Article 22(2)(a) to (d) ofthe SPO.
Where the content of this Presentation is approved by an authorisedperson, within the meaning of the FSMA (“Authorised Person”),Qualifying Investors also include eligible counterparties and professionalclients within the meaning of chapter 3 of Conduct of BusinessSourcebook (“COBS”) of the FCA Handbook made by the UK FinancialConduct Authority (“FCA”), certain persons which are exempt from theFSMA prohibition on carrying any regulated activity in the UK withoutbeing authorised to do so by the FCA (other than appointedrepresentatives provided the Presentation relates to a regulated activityin respect of which they are exempt), certified sophisticated investors,certified high net worth investors and self-certified sophisticatedinvestors, in each case within the meaning of COBS 4.12 for whom theAuthorised Person considers that an investment in the Fund is likely tobe suitable based on a preliminary assessment of these investors’ profileand objectives.
Skybound is not authorised to carry on investment business in the UK,and potential investors are advised that all, or most, of the protectionsafforded by the UK regulatory system, will not apply to any investmentin the Fund. This Presentation is not for distribution to retail customers.
In Hong Kong, the document is directed only at Professional Investors (asdefined under applicable regulations) and not intended for, and shouldnot be used by, non-Professional Investors.
PLEASE NOTE
This document is used for marketing purposes only and is, therefore,more general in nature. For more detail and accurate informationrelating to the Fund please email [email protected] or speak toone of the team members directly.

Contact UsMONTHLY REVIEW
UNITED KINGDOM3rd floor, 33 Bruton Street, London, W1J 6QUTel: +44 207 099 8328Skybound Capital (UK) Ltd is authorised and regulated by the Financial Conduct Authority in the United Kingdom (No. 537301)
HONG KONG21/F, Chuang’s Tower, 30-32 Connaught Road Central, Central, Hong KongTel: +852 2253 6296Skybound Capital (HK) Ltd has a Type 9 Asset Management License from the Securities and Futures Commission of Hong Kong (No. AXR396)
MAURITIUS2nd floor, Block B, Ruisseau Creole Offices, La Mivoie, Riviere Noire, MauritiusTel: +230 483 5422Skybound Capital Limited has a GBL1 License, a CIS Manager License and an Investment Advisor (Unrestricted) License under the Financial Services Commission in Mauritius (No. C103000742)
BERMUDAc/o Cohort Limited, 41 Cedar Avenue, 5th Floor, Hamilton Bermuda HM12Skybound Capital (Bermuda) Ltd – BMA Number FIST03462Tel: +1 441 295-5599
SOUTH AFRICA | Cape Town7th floor, Letterstedt House, cnr. Main & Campground Roads, Newlands, 7700Tel: +27 21 657 4999Skybound Capital (Pty) Ltd has a Category I, II and IIA License from the Financial Services Board in South Africa (No. 35733)
SOUTH AFRICA | Durban04 Palm Boulevard, 2A West Palm, Gateway, 4321Skybound Capital (Pty) Ltd has a Category I, II and IIA License from the Financial Services Board in South Africa (No. 35733)
SOUTH AFRICA | JohannesburgCommerce Square, 1st floor, Building 2, 39 Rivonia Rd, Sandhurst, 2196, Johannesburg, 2196Skybound Capital (Pty) Ltd has a Category I, II and IIA License from the Financial Services Board in South Africa (No. 35733)
SOUTH AFRICA | Port Elizabeth7 Westbourne Road, Richmond Hill, Port Elizabeth, 6001Skybound Capital (Pty) Ltd has a Category I, II and IIA License from the Financial Services Board in South Africa (No. 35733)
www.skyboundcapital.com