
Market Reinvigorating the EU Single... · Reinvigorating the EU Single Market The EU Single Market...
38
Please cite this paper as: Fournier, J. (2014), “Reinvigorating the EU Single Market”, OECD Economics Department Working Papers, No. 1159, OECD Publishing. http://dx.doi.org/10.1787/5jxx3d3hk437-en OECD Economics Department Working Papers No. 1159 Reinvigorating the EU Single Market Jean-Marc Fournier JEL Classification: F15, H73, J61, L14, L51
Transcript of Market Reinvigorating the EU Single... · Reinvigorating the EU Single Market The EU Single Market...

Please cite this paper as:
Fournier, J. (2014), “Reinvigorating the EU Single Market”,OECD Economics Department Working Papers, No. 1159,OECD Publishing.http://dx.doi.org/10.1787/5jxx3d3hk437-en
OECD Economics Department WorkingPapers No. 1159
Reinvigorating the EU SingleMarket
Jean-Marc Fournier
JEL Classification: F15, H73, J61, L14, L51

Unclassified ECO/WKP(2014)55 Organisation de Coopération et de Développement Économiques Organisation for Economic Co-operation and Development 08-Sep-2014 ___________________________________________________________________________________________
English - Or. English ECONOMICS DEPARTMENT
REINVIGORATING THE EU SINGLE MARKET ECONOMICS DEPARTMENT WORKING PAPERS No. 1159
By Jean-Marc Fournier
OECD Working Papers should not be reported as representing the official views of the OECD or of its member countries. The opinions expressed and arguments employed are those of the author(s). Authorised for publication by Alvaro Pereira, Director, Country Studies Branch, Economics Department
All Economics Department Working Papers are available through OECD's Internet website at www.oecd.org/eco/workingpapers
JT03361639
Complete document available on OLIS in its original format This document and any map included herein are without prejudice to the status of or sovereignty over any territory, to the delimitation of international frontiers and boundaries and to the name of any territory, city or area.
ECO
/WK
P(2014)55 U
nclassified
English - O
r. English

ECO/WKP(2014)55
2
OECD Working Papers should not be reported as representing the official views of the OECD or of its member countries. The opinions expressed and arguments employed are those of the author(s).
Working Papers describe preliminary results or research in progress by the authors and are published to stimulate discussion on a broad range of issues on which the OECD works.
Comments on Working Papers are welcomed, and may be sent to OECD Economics Department, 2 rue André-Pascal, 75775 Paris Cedex 16, France, or by e-mail to [email protected]
This document and any map included herein are without prejudice to the status of or sovereignty over any territory, to the delimitation of international frontiers and boundaries and to the name of any territory, city or area.
The statistical data for Israel are supplied by and under the responsibility of the relevant Israeli authorities. The use of such data by the OECD is without prejudice to the status of the Golan Heights, East Jerusalem and Israeli settlements in the West Bank under the terms of international law.
© OECD (2014) You can copy, download or print OECD content for your own use, and you can include excerpts from OECD publications, databases and multimedia products in your own documents, presentations, blogs, websites and teaching materials, provided that suitable acknowledgment of OECD as source and copyright owner is given. All requests for commercial use and translation rights should be submitted to [email protected].

ECO/WKP(2014)55
3
ABSTRACT/RÉSUMÉ
Reinvigorating the EU Single Market
The EU Single Market remains fragmented by complex and heterogeneous rules at the EU and national levels affecting trade, capital, including foreign direct investment, and labour mobility. Further development of the Single Market and removing barriers to external trade would bring substantial growth and employment gains by enhancing resource allocation in Europe, by generating economies of scale and by strengthening competition and hence incentives to innovate. Reforming regulation and other implicit barriers can also yield a double dividend: it would stimulate cross-border activities and support the necessary reallocation process within countries. Such reallocation can cause hardships, especially for the less-skilled workers who may not be able to compete. To deal with such problems, it is important to enhance active labour market policies and training. The Single Market would also benefit from better networks between countries that can be supported by a well-targeted infrastructure policy. New digital networks can be promoted by an appropriate regulatory framework to strengthen confidence and to promote fair competition. Regarding external trade, the first-best solution is clearly multilateral trade negotiations, but short of that external trade and investment barriers can be reduced with Free Trade Agreement negotiations with the United States and other partners.
This Working Paper relates to the 2014 OECD Economic Survey of the European Union (www.oecd.org/eco/surveys/economic-survey-european-union.htm).
JEL classification codes: F15, H73, J61, L51, L14
Keywords: EU Single Market, Economic Integration, Regulatory Heterogeneity, Labour Mobility, Regulatory Barriers, Network Interconnections.
*************************************
Redynamiser le marché unique de l’UE
Le marché unique de l’UE reste fragmenté en raison de règles complexes et hétérogènes, tant au niveau communautaire qu’au niveau national, touchant le commerce, le capital, y compris les investissements directs étrangers et la mobilité de la main-d’oeuvre. Une plus grande intégration du marché unique et la suppression des obstacles au commerce extérieur se traduiraient par d’importants gains de croissance et d’emploi en améliorant l’allocation des ressources en Europe, en favorisant des économies d’échelle et en renforçant la concurrence et, partant, les incitations à innover. La réforme de la réglementation et des autres obstacles implicites peut aussi générer un double dividende : elle stimulerait les activités transfrontalières et soutiendrait le nécessaire processus de redéploiement au sein des pays. Ce redéploiement peut entraîner des difficultés, en particulier pour les travailleurs moins qualifiés qui ne sont sans doute pas à même de soutenir la concurrence. Il importe donc, dans ce contexte, d’améliorer les politiques actives du marché du travail et la formation. Le marché unique bénéficierait aussi d’un renforcement des réseaux entre les pays, qu’une politique d’infrastructures bien ciblée pourrait faciliter. Les nouveaux réseaux numériques peuvent être encouragés par une approche réglementaire appropriée visant à rehausser la confiance et à favoriser une concurrence équitable. S’agissant du commerce extérieur, la solution la plus favorable est à l’évidence la négociation commerciale multilatérale, mais, à défaut, les obstacles au commerce extérieur et à l’investissement peuvent être réduits grâce à la négociation d’accords de libre-échange avec les États-Unis et les autres partenaires.
Ce Document de travail se rapporte à l’Étude économique de l’OCDE de l'Union européenne 2014 (www.oecd.org/fr/eco/etudes/union-europeenne.htm).
Classification JEL : F15, H73, J61, L51, L14
Mots clefs : Marché Unique de l’UE, Intégration Économique, Hétérogénéité des Régulations, Mobilité du Travail, Barrières Réglementaires, Interconnections de Réseaux.

ECO/WKP(2014)55
4
TABLE OF CONTENTS
REINVIGORATING THE EU SINGLE MARKET ...................................................................................... 6
The potential for growth gains from a deeper Single Market are large ....................................................... 6 The Single Market is still fragmented ..................................................................................................... 6 Economies of scale and better resource allocation would boost productivity ......................................... 7
Unnecessary barriers to trade and resource allocation reduce potential gains .......................................... 11 Stringent regulations impede trade gains from the Single Market ........................................................ 11 Policies to support efficient allocation .................................................................................................. 14 Heterogeneous rules and regulations impede integration ...................................................................... 14 The EU Services Directive aims at tackling regulatory barriers............................................................ 17 Enforcement of rules adds to barriers .................................................................................................... 18
Enhancing labour market mobility within the Single Market adds to gains ............................................. 20 Better network interconnections across borders would enhance integration gains ................................... 23
Fragmentation in the transport sector .................................................................................................... 24 The growth of the digital economy raises new regulatory issues to ensure fair competition ................ 25 Electricity grids lack investments .......................................................................................................... 27
Free trade agreements (FTAs) can boost integration gains from the Single Market ................................. 29 Building stronger trade ties with the rest of the world would further boost integration gains .............. 29 An agreement is under negotiation with the United States .................................................................... 30 Negotiations are going on with many other trade partners .................................................................... 30
BIBLIOGRAPHY ......................................................................................................................................... 32
Figures
1. Trade between EU member states .......................................................................................................... 7 2. Productivity is higher in large firms ....................................................................................................... 7 3. Do resources flow to more innovative firms? ........................................................................................ 9 4. The distribution of firm employment growth ....................................................................................... 10 5. EU countries differ in their ability to allocate labour to the most productive firms ............................. 10 6. Restrictiveness of economy-wide product market regulation .............................................................. 11 7. Selected indicators of product market regulation ................................................................................. 12 8. FDI restrictiveness index ...................................................................................................................... 13 9. Indicators of differences in regulations ................................................................................................ 14 10. Heterogeneity in countries diminishes more the farther they are from common practices ................ 15 11. Cross-border procurement .................................................................................................................. 17 12. Barriers in services show little change between 2008 and 2013 in the EU ........................................ 18 13. Long trial length is associated with a lower share of FDI .................................................................. 19 14. The number of infringement cases is decreasing ............................................................................... 19 15. Stock of migrated population within the EU ...................................................................................... 21 16. Immigration flows into western EU countries ................................................................................... 21 17. Share of EU25 non-national teachers ................................................................................................. 23 18. Mobile phone prices are widely dispersed ......................................................................................... 24 19. Individual purchases over the Internet ............................................................................................... 25 20. Electricity prices for industry ............................................................................................................. 27 21. Effective carbon prices in selected countries ..................................................................................... 28 22. Foreign value added content of gross exports .................................................................................... 29 23. Exports to dynamic Asian economies ................................................................................................ 31

ECO/WKP(2014)55
5
Boxes
Box 1. FDI patterns within the EU: the role of policies ........................................................................... 13 Box 2. Main recommendations to reduce implicit barriers within the Single Market ............................. 20 Box 3. Main recommendation to enhance labour mobility ...................................................................... 23 Box 4. Main recommendations for network sectors ................................................................................. 28 Box 5. Main recommendation to promote trade ....................................................................................... 31

ECO/WKP(2014)55
6
Reinvigorating the EU Single Market
By Jean-Marc Fournier1
The Commission has estimated that the Single Market generated an extra 2.8 million jobs in the EU and an additional 2% in GDP from 1992 to 2008 (EC, 2012a). As internal barriers remain considerable, there are additional gains from further reducing unnecessary regulatory burdens and regulatory heterogeneity in the Single Market. The Commission, reflecting Monti (2010), has identified in its Single Market Act II four Single Market drivers that could enhance these gains by reducing fragmentation and raising productivity: integrating networks; fostering mobility of citizens and businesses; supporting the digital economy and strengthening social entrepreneurship, and listed a relevant list of key actions to be taken (EC, 2012a). But more can be done to deal with the complexity and the heterogeneity of numerous rules and policies that impede the Single Market. However, this requires a step change in efforts devoted to encouraging economic integration. As reforms require the support of all EU member states, more detailed and convincing analysis of the role of implicit barriers and hence of opportunities arising from their removal, is needed to identify priorities and accelerate the process of reforms.
The first section discusses growth gains that can be reaped from completing a genuine Single Market. The second section considers regulatory barriers to trade within the Single Market. In particular, the heterogeneity of regulations across countries generates hurdles for cross-border activities. The third section examines barriers to labour mobility. The fourth section discusses policies to reduce fragmentation of network sectors. The fifth section broadens the discussion to the rest of the world by considering the role of Free Trade Agreements (FTA) to further enhance the growth potential of the Single Market.
The potential for growth gains from a deeper Single Market are large
The Single Market is still fragmented
Progress with Single Market reforms and its fragmentation was already discussed in the 2012 Survey (OECD, 2012a). Recent trade data confirm significant remaining fragmentation (Braconier and Pisu, 2013). Trade between most countries is smaller than trade within a country, everything else equal. The gap is most important in Estonia and Greece, where within-country trade is 13 times more intense than trade with EU partners, but is significant in most countries (Figure 1). Noticeable exceptions are central countries well-integrated in transport networks (Belgium, Germany and the Netherlands).
1. Jean-Marc Fournier is an economist in the Economics Department of the OECD. This paper was prepared for the OECD Economic Survey of the European Union published in April 2014 under the authority of the Economic and Development Review Committee. The author is particularly thankful to numerous colleagues for their valuable comments, including Eckhard Wurzel, Piritta Sorsa, Andrew Dean, Robert Ford, Dan Andrews, Sebastian Barnes, Rudolf van der Berg, Silvia Beyer, Nicola Brandt, Rob Dellink, Agustin Diaz-Pines, Michael Donohue, Przemyslaw Kowalski, Thomas Liebig, Sam Paltridge and Dirk Pilat as well as to the European Commission and central bank officials. The author is grateful to Isabelle Duong and Annamaria Tuske for excellent research assistance and Deirdre Claasen and Anthony Bolton for first rate editorial support.

ECO/WKP(2014)55
7
Figure 1. Trade between EU member states Country specific border effects1
1. The border effect is a measure of the reduction of trade due to a border. For instance, in Estonia trade within the country is
almost 15 times larger than trade across the border, everything else (e.g. road distance) equal. For further detail, see Source. Source: Braconier, H. and M. Pisu (2013), "Road Connectivity and the Border Effect: Evidence from Europe", OECD Economics
Department Working Papers, No. 1073, OECD Publishing, Paris.
Economies of scale and better resource allocation would boost productivity
The small size of firms in the EU relative to the United States (OECD, 2012a) is one indicator of costs of fragmentation. Fragmentation can reduce productivity in the EU, as firms cannot reap the benefits of economies of scale. Van Ark et al. (2013) suggest substantial growth gains from further Single Market integration, in large part due to scale advantages. The correlation between the size of firms and their productivity in the manufacturing sector suggests that firms may have some potential to generate economies of scale (Figure 2). Economies of scale are crucially important for innovative firms that spend a large fixed cost in research and development (R&D) and need a large internal market to cover these costs. This may have led to lower spending on innovations in Europe.
Figure 2. Productivity is higher in large firms Value added in thousand EUR; manufacturing sector; 20111
1. Or latest available data. Source: US Census Bureau; OECD, Structural and Demographic Business Statistics database, Structural Analysis (STAN) database
and OECD Economic Outlook database.
Log scale
0.25
0.50
1.00
2.00
4.00
8.00
16.00
32.00
64.00Log scale
0.25
0.50
1.00
2.00
4.00
8.00
16.00
32.00
64.00
BEL NLD DEU LUX HUN AUT FRA ESP CZE ITA POL SVN SVK CHE DNK GRC EST
Border effects using road distanceConfidence interval
0 500 1000 1500 2000 2500 3000
40
50
60
70
80
90
100
110Value added per employee
40
50
60
70
80
90
100
110Value added per employee
Value added per firm
AUTBEL
CZE
DNK
EST
FIN
FRA
DEU
HUN
ITA
LUX
NLD
POL
SVKSVN
ESP
SWE
GBROECDEU19
ECO/WKP(2014)55
8
A large part of welfare gains from international trade comes from reallocation of resources to the most competitive firms in sectors where the economy has a comparative advantage (OECD, 2011a). Single Market integration also strengthens import competition and hence triggers more innovation, so that firms make a more efficient use of their production factors. Bloom et al. (2011) provide empirical evidence that firms do more innovation when they are exposed to low-cost import competition. These efficiency gains can be more important when frictions “trap” factors of production inside firms (Bloom et al., 2013). The positive impact of trade integration on growth is also larger with a business-friendly environment within each country. Ben Yahmed and Dougherty (2012) show that the productivity gains triggered by import competition occur in firms that were already close to the technology frontier and that stringent domestic regulation reduces these potential productivity gains substantially.
The process to allocate resources is slower or less efficient in the EU than in the United States. A 10 % increase in the patent stock is associated with an increase in the typical firm’s capital stock of 3% in Sweden and the United States, against no significant increase in Austria, Denmark, Finland, the Netherlands and Spain (Figure 3, upper panel). Similarly, the ease with which patenting firms in the United States can attract labour is roughly twice as large as in France, Germany or Italy (Figure 3, lower panel). Compared to their United States peers, firms are more static in Europe (Figure 4). In a successful Single Market, productive factors should be reallocated from non-competitive firms that downsize or close, towards highly competitive firms that grow. This is especially important in countries with negative or low correlation between size and productivity (e.g. Greece, the Netherlands and Poland, as shown in Figure 5). Such a low correlation between size and productivity can indeed reflect the fact that factors of production are not well reallocated towards the most productive firms (Olley and Pakes, 1996).
Implicit barriers discussed in this paper are also in many cases impediments to resource reallocation (e.g. business-unfriendly product market regulations). A package of reforms to reinvigorate the Single Market would thus both improve factor allowance across countries, but also within countries.

ECO/WKP(2014)55
9
Figure 3. Do resources flow to more innovative firms? Additional inputs attracted by a firm that increases its patent stock by 10%, 2002-101
1. The light blue bands denote the 90% confidence intervals which vary across countries due to differences in the number of
observations. For more details on these estimates outcomes, see Figure 10 in Source. Source: Andrews, D. and C. Criscuolo (2013), “Knowledge-Based Capital, Innovation and Resource Allocation”, OECD Economics
Department Working Papers, No. 1046, OECD Publishing, Paris.
-2
-1
0
1
2
3
4Per cent
-2
-1
0
1
2
3
4Per cent
Capital stockPercentage change
FIN NLD DNK ESP ITA JPN AUT FRA GBR DEU BEL USA SWE
-3
-2
-1
0
1
2
3
4Per cent
-3
-2
-1
0
1
2
3
4Per cent
EmploymentPercentage change
DNK FIN JPN DEU ITA FRA NLD GBR ESP AUT SWE BEL USA

ECO/WKP(2014)55
10
Figure 4. The distribution of firm employment growth Europe - US gap,1 2002-05
1. Seven European countries (Austria, Denmark, Finland, Italy, Netherlands, Norway and Spain) have been selected on the basis of
data availability. The gap is the percentage difference between the share of firms in a given growth bracket in Europe and in the United States.
Source: Andrews, D. and C. Criscuolo (2013), “Knowledge-Based Capital, Innovation and Resource Allocation”, OECD Economics Department Working Papers, No. 1046, OECD Publishing, Paris.
Figure 5. EU countries differ in their ability to allocate labour to the most productive firms Firm-level covariance between productivity and firm size; manufacturing sector; 20051
1. Firm size is measured as its share in total industry employment. The estimates show the extent to which firms with higher-than-
average labour productivity have larger employment shares. In most countries, the covariance between productivity and employment share is positive, suggesting that the actual allocation of employment boosts manufacturing labour productivity, compared to a situation where resources were allocated randomly across firms (this metric would equal zero if labour were allocated randomly).
2. EU16 is the unweighted average of Austria, Belgium, Czech Republic, Denmark, Finland, France, Greece, Germany, Hungary, Italy, Netherlands, Portugal, Poland, Spain, Slovak Republic and the United Kingdom.
Source: OECD calculations based on firm level data from the ORBIS database. For more details, see Andrews, D. and F. Cingano (2012), “Public Policy and Resource Allocation: Evidence from Firms in OECD Countries”, OECD Economics Department Working Papers, No. 996, OECD Publishing, Paris.
-20
-10
0
10
20
30
40
-20
-10
0
10
20
30
40
Fast shrinking firms Static firms Fast growing firms
More firms
in Europe
%
More firms
in the USA
More firms
in Europe
%
More firms
in the USA
-100 -20 -15 -10 -5 -1 1 5 10 15 20 8
-0.4
-0.2
0.0
0.2
0.4
0.6
Log points
-0.4
-0.2
0.0
0.2
0.4
0.6
Log points
PO
L
GR
C
KO
R
NLD
CH
E
SV
K
PR
T
HU
N
ITA
AU
T
BE
L
EU
162
CZ
E
DN
K
GB
R
JPN
NO
R
DE
U
FR
A
ES
P
US
A
FIN
SW
E
ECO/WKP(2014)55
11
Unnecessary barriers to trade and resource allocation reduce potential gains
Stringent regulations impede trade gains from the Single Market
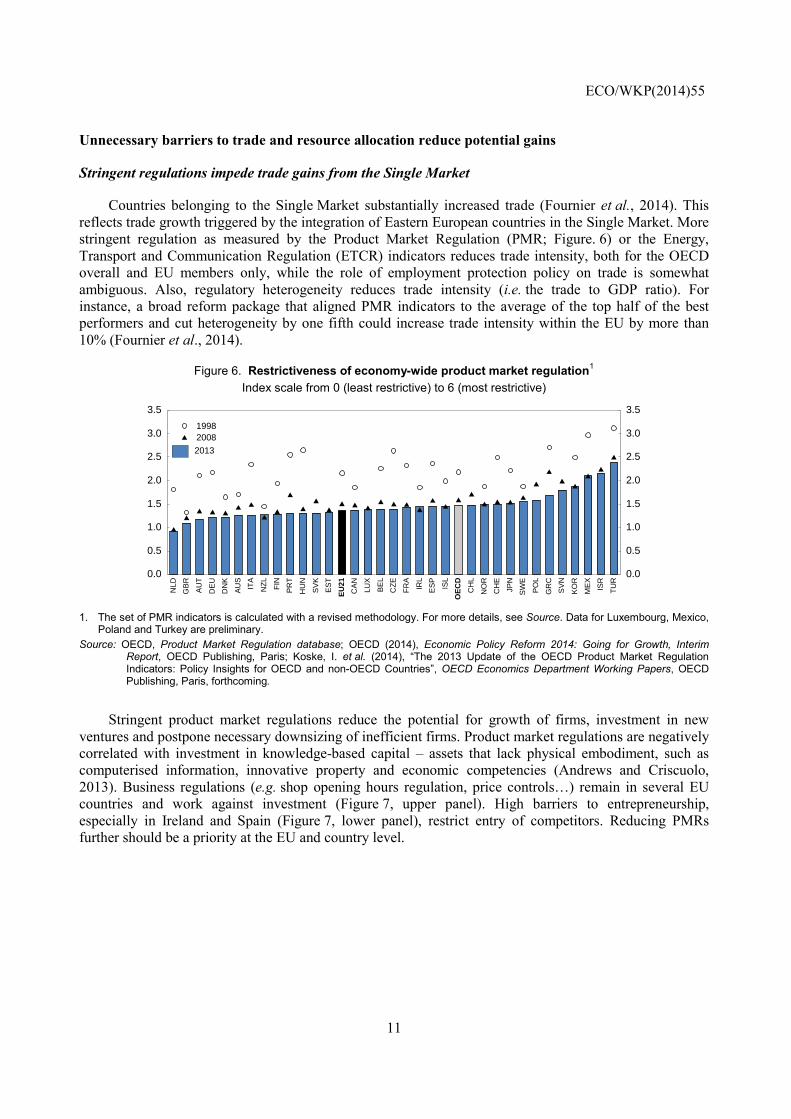
Countries belonging to the Single Market substantially increased trade (Fournier et al., 2014). This reflects trade growth triggered by the integration of Eastern European countries in the Single Market. More stringent regulation as measured by the Product Market Regulation (PMR; Figure. 6) or the Energy, Transport and Communication Regulation (ETCR) indicators reduces trade intensity, both for the OECD overall and EU members only, while the role of employment protection policy on trade is somewhat ambiguous. Also, regulatory heterogeneity reduces trade intensity (i.e. the trade to GDP ratio). For instance, a broad reform package that aligned PMR indicators to the average of the top half of the best performers and cut heterogeneity by one fifth could increase trade intensity within the EU by more than 10% (Fournier et al., 2014).
Figure 6. Restrictiveness of economy-wide product market regulation1
Index scale from 0 (least restrictive) to 6 (most restrictive)
1. The set of PMR indicators is calculated with a revised methodology. For more details, see Source. Data for Luxembourg, Mexico,
Poland and Turkey are preliminary. Source: OECD, Product Market Regulation database; OECD (2014), Economic Policy Reform 2014: Going for Growth, Interim
Report, OECD Publishing, Paris; Koske, I. et al. (2014), “The 2013 Update of the OECD Product Market Regulation Indicators: Policy Insights for OECD and non-OECD Countries”, OECD Economics Department Working Papers, OECD Publishing, Paris, forthcoming.
Stringent product market regulations reduce the potential for growth of firms, investment in new ventures and postpone necessary downsizing of inefficient firms. Product market regulations are negatively correlated with investment in knowledge-based capital – assets that lack physical embodiment, such as computerised information, innovative property and economic competencies (Andrews and Criscuolo, 2013). Business regulations (e.g. shop opening hours regulation, price controls…) remain in several EU countries and work against investment (Figure 7, upper panel). High barriers to entrepreneurship, especially in Ireland and Spain (Figure 7, lower panel), restrict entry of competitors. Reducing PMRs further should be a priority at the EU and country level.
0.0
0.5
1.0
1.5
2.0
2.5
3.0
3.5
0.0
0.5
1.0
1.5
2.0
2.5
3.0
3.5
2013
NLD
GB
R
AU
T
DE
U
DN
K
AU
S
ITA
NZ
L
FIN
PR
T
HU
N
SV
K
ES
T
EU
21
CA
N
LUX
BE
L
CZ
E
FR
A
IRL
ES
P
ISL
OE
CD
CH
L
NO
R
CH
E
JPN
SW
E
PO
L
GR
C
SV
N
KO
R
ME
X
ISR
TU
R
19982008

ECO/WKP(2014)55
12
Figure 7. Selected indicators of product market regulation1
Index scale from 0 (least restrictive) to 6 (most restrictive)
1. The set of PMR indicators is calculated with a revised methodology. For more details, see Source. Data for Luxembourg, Mexico,
Poland and Turkey are preliminary. Source: OECD, Product Market Regulation database; OECD (2014), Economic Policy Reform 2014: Going for Growth, Interim
Report, OECD Publishing, Paris; Koske, I. et al. (2014), “The 2013 Update of the OECD Product Market Regulation Indicators: Policy Insights for OECD and non-OECD Countries”, OECD Economics Department Working Papers, OECD Publishing, Paris, forthcoming.
Implicit regulatory barriers and strong vested interests are also reducing foreign direct investment (FDI) that is often important in boosting productivity (Kalemli-Ozcan et al., 2014; Nicoletti et al., 2003). Aghion et al. (2006) argue that catching up with the technology frontier can be supported by the involvement of a foreign investor, who is familiar with the frontier technology. FDI flows have indeed been larger towards Eastern European countries and Ireland than towards Southern European countries. Policies that support FDI flows should thus be given high priority in southern European countries.
0.0
0.5
1.0
1.5
2.0
2.5
3.0
3.5
0.0
0.5
1.0
1.5
2.0
2.5
3.0
3.5Involvement in business operations
2013
AU
S
DE
U
CZ
E
DN
K
GB
R
AU
T
NO
R
NZ
L
SW
E
IRL
FIN
PO
L
FR
A
ISL
NLD
LUX
ME
X
ES
T
EU
21
JPN
CH
E
OE
CD
CA
N
ITA
HU
N
CH
L
SV
K
BE
L
ES
P
PR
T
SV
N
KO
R
GR
C
TU
R
ISR
2008
0.0
0.5
1.0
1.5
2.0
2.5
3.0
0.0
0.5
1.0
1.5
2.0
2.5
3.0Barriers to entrepreneurship
2013
SV
K
NZ
L
NLD IT
A
DN
K
AU
T
PR
T
CA
N
GB
R
DE
U
FIN
ES
T
CH
E
EU
21
AU
S
FR
A
JPN
HU
N
NO
R
OE
CD
SW
E
PO
L
BE
L
SV
N
CZ
E
KO
R
LUX
GR
C
IRL
CH
L
ISL
ES
P
ME
X
ISR
TU
R
2008
ECO/WKP(2014)55
13
Box 1. FDI patterns within the EU: the role of policies
Firm level econometric analysis is used to investigate the determinants of FDI (Kalemli-Ozcan et al., 2014). FDI restrictions, as measured by the FDI regulatory restrictiveness index, have a negative impact on FDI. More stringent product market policies also deter foreign investment (Kalemli-Ozcan et al., 2014). This effect is stronger in countries where average productivity is lower. Stringent regulations cause foreign investors to select into high productivity firms by international standards, whereas in the absence of these policies foreigners invest in both high and low productivity firms without differentiation. Under stringent regulations, foreign investors may perceive restructuring of weak firms as too costly. Removing business-unfriendly product market regulation (PMR) in countries that need to catch up would thus broaden scope for upgrading the efficiency of the weakest firms.
The heterogeneity of economy-wide PMR has a positive impact on FDI. If countries’ regulations are too different, entry cost may be lowered by the takeover of local firms, which are better accustomed to local regulatory issues. Heterogeneity of regulation can thus favour multiplicity of local presence, especially if the cost to deal with the heterogeneity is high relative to losses of economies of scales implied by multiple local bases. By contrast, the heterogeneity of financial services regulations is found to deter FDI, as it increases costs for foreign investors. This may deter efficient FDI. Thus reducing financial services regulations can have important efficiency gains not just for local producers but for FDI.
This study also examined origins of FDI in Europe. Financial centers seem important sources of FDI, but ultimate ownership data show that more than 10% of the German, British and Dutch foreign investment stocks have their ultimate owners in Far East and Central Asia. OECD and the Bureau van Dyck (BvD) direct ownership data cannot describe these patterns. This suggests that a significant share of these North American and Asian investments are channeled through West European financial centers (e.g. Ireland and the United Kingdom).
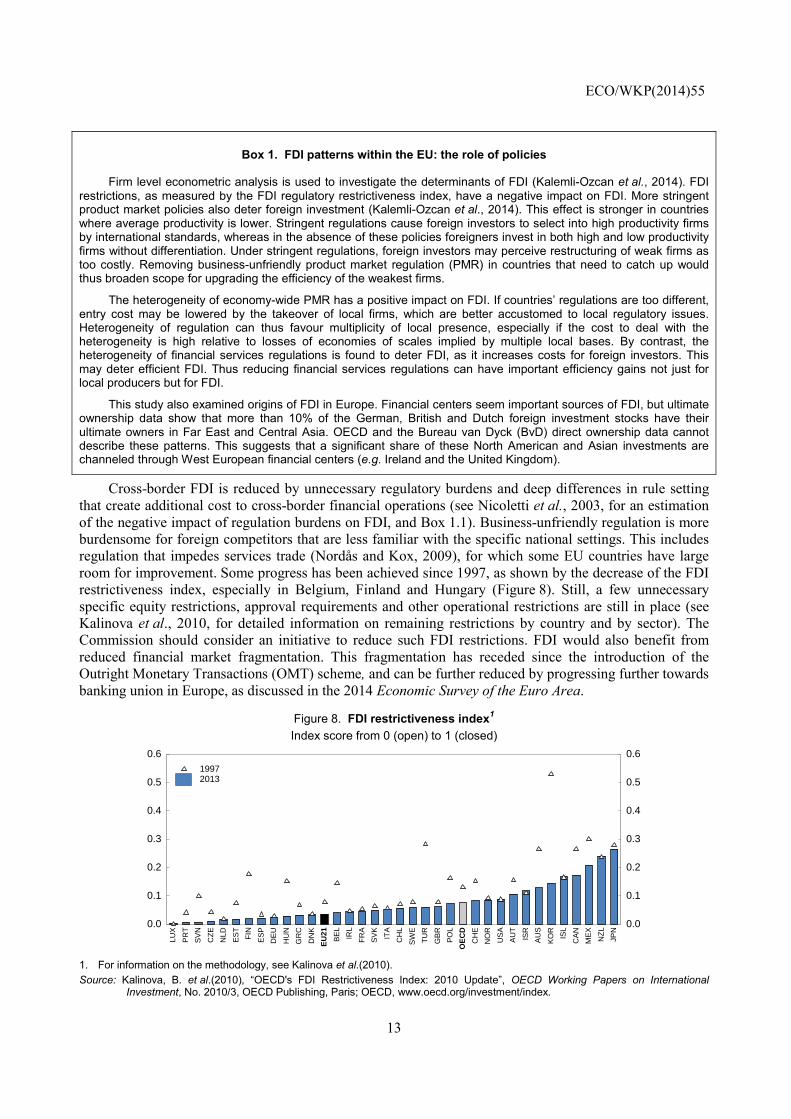
Cross-border FDI is reduced by unnecessary regulatory burdens and deep differences in rule setting that create additional cost to cross-border financial operations (see Nicoletti et al., 2003, for an estimation of the negative impact of regulation burdens on FDI, and Box 1.1). Business-unfriendly regulation is more burdensome for foreign competitors that are less familiar with the specific national settings. This includes regulation that impedes services trade (Nordås and Kox, 2009), for which some EU countries have large room for improvement. Some progress has been achieved since 1997, as shown by the decrease of the FDI restrictiveness index, especially in Belgium, Finland and Hungary (Figure 8). Still, a few unnecessary specific equity restrictions, approval requirements and other operational restrictions are still in place (see Kalinova et al., 2010, for detailed information on remaining restrictions by country and by sector). The Commission should consider an initiative to reduce such FDI restrictions. FDI would also benefit from reduced financial market fragmentation. This fragmentation has receded since the introduction of the Outright Monetary Transactions (OMT) scheme, and can be further reduced by progressing further towards banking union in Europe, as discussed in the 2014 Economic Survey of the Euro Area.
Figure 8. FDI restrictiveness index1 Index score from 0 (open) to 1 (closed)
1. For information on the methodology, see Kalinova et al.(2010). Source: Kalinova, B. et al.(2010), “OECD's FDI Restrictiveness Index: 2010 Update”, OECD Working Papers on International
Investment, No. 2010/3, OECD Publishing, Paris; OECD, www.oecd.org/investment/index.
0.0
0.1
0.2
0.3
0.4
0.5
0.6
0.0
0.1
0.2
0.3
0.4
0.5
0.619972013
LUX
PR
T
SV
N
CZ
E
NLD
ES
T
FIN
ES
P
DE
U
HU
N
GR
C
DN
K
EU
21
BE
L
IRL
FR
A
SV
K
ITA
CH
L
SW
E
TU
R
GB
R
PO
L
OE
CD
CH
E
NO
R
US
A
AU
T
ISR
AU
S
KO
R
ISL
CA
N
ME
X
NZ
L
JPN

ECO/WKP(2014)55
14
Efficient investment is also influenced by takeover rules. The EU Takeover Directive passed in 2004 sets standards for takeover bidders, such as mandatory bid rules and minimum price rules, and on anti-takeover provisions. This has led to investments by EU companies that are less profitable (as proxied by takeover returns) and that take longer to complete than before (Humphery-Jenner, 2012). Humphery-Jenner (2012) argues that legal uncertainties generated by a large room for interpretation of the rules at the national level increased availability of anti-takeover provisions. In addition, mandatory bid rules and minimum price rules discourage profitable takeovers. Lower takeover threat can increase the opportunity for managerial slack, reducing firms’ efficiency (Giroud and Mueller, 2010). The Takeover Directive should be replaced by a revised version that renders takeovers more profitable, such as reducing legal uncertainties, the availability of anti-takeover provisions and limiting the scope of application of the minimum price rules.
Policies to support efficient allocation
Financial, tax and innovation policies can influence efficient reallocation. First, the emergence of new firms requires well-functioning financial markets; this can be achieved by sound regulation, as described in the 2014 Economic Survey of the Euro Area. Second, well-designed R&D tax incentives can support the innovation process (see the OECD Science, Technology and Industry Scoreboard for a cross-country comparison of existing schemes). Refundable measures with carry-over provisions would benefit all innovative firms, including young firms that do not generate profits yet. Direct government support to research can have a positive impact, possibly reflecting an improving structure of public schemes, such as a more frequent use of matching grants (Andrews and Criscuolo, 2013).
Heterogeneous rules and regulations impede integration
Product market regulations contribute to heterogeneity
Numerous differences across countries in regulations raise trade costs (Kox and Lejour, 2006; Nordås and Kox, 2009). Heterogeneity of rules can be observed from PMR data (Figure 9). In particular, restrictions within the EU in professional services are only slightly more similar than between EU countries and other OECD countries (Fournier, 2014). This analysis provides a lower bound of the true difference, as in some cases, countries can report the same level of stringency, but with different kind of procedures behind.
Figure 9. Indicators of differences in regulations1
Share of different regulations
1. Underlying data for Luxembourg, Mexico, Poland and Turkey are preliminary. Source: OECD, Product Market Regulations database and OECD calculations. For more details, see Fournier, J.-M. (2014), “The
Heterogeneity of Product Market Regulations”, OECD Economics Department Working Papers, OECD Publishing, Paris, forthcoming.
0.32
0.33
0.34
0.35
0.36
0.37
0.38
0.39
0.40
0.41
0.42Overall
1998 2003 2008 2013
EU to EUEU to non-EUNon-EU to non-EUOECD average
0.34
0.36
0.38
0.40
0.42
0.44
0.46
0.48
0.50
0.52
0.54Retail trade
1998 2003 2008 2013
EU to EUEU to non-EUNon-EU to non-EUOECD average

ECO/WKP(2014)55
15
Product market reforms can also help to reduce the heterogeneity of regulations. Countries that were further away from common practices in 2008 made more reforms that reduce bilateral regulatory heterogeneity (Figure 10). More broadly, countries that have most reduced the overall stringency of regulation are also countries that reduced their heterogeneity relative to other OECD countries. This reflects the fact that the most common practices across OECD countries are also in most cases business-friendly practices. Kox and Lejour (2005) estimated that if the EU made more use of mutual recognition, bilateral trade in commercial services among EU countries could increase by 30 to 60%. Progress has been too limited in this area, and a broad-based initiative to develop mutual recognition is necessary to achieve substantial trade gains as well as fostering labour mobility as discussed above.
Figure 10. Heterogeneity in countries diminishes more the farther they are from common practices
1. The vertical axis shows the difference between the average bilateral heterogeneity of a given country in 2013 and the average bilateral heterogeneity that would be observed if no change had been made in this country’s regulations between 2008 and 2013. These data are preliminary estimates. Data for Luxembourg and Poland are preliminary.
Source: OECD, Product Market Regulations database and OECD calculations. For more details, see Fournier, J.-M. (2014), “The Heterogeneity of Product Market Regulations”, OECD Economics Department Working Papers, OECD Publishing, Paris, forthcoming.
The unitary patent reduces heterogeneity
The establishment of an EU unitary patent is a major improvement to harmonise and simplify the patenting process and boost innovation. Before the set-up of this EU unitary patent, a European patent validated in 13 countries was more than ten times more expensive than a patent in the United States or Japan (van Pottelsberghe de la Potterie and François, 2006). These high costs include translation cost, fees charged by patent agents, publication and renew fees. As a result, the vast majority of patents were validated in only a few EU member states (EC, 2011d). The EU unitary patent will sharply reduce translation costs: following the transition period, applicants will have to provide a translation in the three official languages (English, French and German) of the European Patent Office only. The necessary information on patents will be available in all EU languages via machine translation once a reliable and efficient system is in force. The EU member states also agreed to set up a single and specialised patent jurisdiction (the “Unified Patent Court”), which should be ratified as soon as possible to reduce litigation costs and enhance legal certainty. While this simplifies and unifies the patent registration procedure in the EU, Croatia, Italy and Spain are not part of the agreement (though Croatia has announced its intention to join), which may lower the benefits of the unitary patent system in the EU.
28 30 32 34 36 38 40-2
-1
0
1
2
3
4
5
6
Heterogeneity reduction between 2008 and 2013,¹ %
-2
-1
0
1
2
3
4
5
6
Heterogeneity reduction between 2008 and 2013,¹ %
Heterogeneity in 2008
AUT
BEL
CZE
DNK
ESTFIN
FRADEU
GRC
HUN
IRL
ITALUX
NLD
POL
PRT
SVK
SVN
ESP
SWE
GBR

ECO/WKP(2014)55
16
Tax administration burdens vary
Harmonisation of tax-related administrative burdens would also reduce heterogeneity of rules. Existing EU tax frameworks (e.g. EU VAT legislation) tend to have uncertainties as regard the applicable rules, or instances of double taxation or tax discrimination (Monti, 2010). As regards the VAT, the Commission’s Regulatory Fitness (REFIT) initiative, which aims to reduce EU-origin regulatory burdens, includes an appropriate proposal to reduce VAT-related administrative burdens through harmonisation of procedures and the promotion of e-invoicing. There should also be increased co-ordination in procedures for corporate income taxes and employer’s social security contributions. A common definition of corporate tax bases and moving forward with the code of conduct on business taxation can help in this respect (Monti, 2010). The heterogeneity of national preferences can still be taken into account in a harmonised framework by setting tax rates nationally.
Tax administration harmonisation can go hand in hand with the need to reduce tax erosion and to suppress tax expenditures that generate inefficiencies. Co-ordination can be an opportunity to reduce compliance costs by eliminating mismatches causing tax base erosion. This would go in the same direction as the on-going OECD/G20 initiative on Base Erosion and Profit Shifting (BEPS).
Bankruptcy laws contribute to heterogeneity
Bankruptcy laws are different in each country, and this creates an additional cost for foreign investors to assess the risk properly. EU guidelines for efficient bankruptcy practices (e.g. by introducing non-judicial debt settlement schemes), if implemented at the country level, could reduce uncertainties for investors. Better bankruptcy rules and procedures would also further increase the consistency of the assessment of banks’ assets in the banking union, as discussed in the 2014 Economic Survey of the Euro Area. At the same time, such a framework can support investment in knowledge-based capital by not penalising failure too much (Andrews and Criscuolo, 2013).
Differences in competition policies add to heterogeneity
While all EU countries share the same principle on competition policies, the current framework opens the way to some differences on the enforcement of competition law across countries as shown by the competition law and policy indicator (Alemani et al., 2013). Differences should be reduced by moving towards best practices. In particular, in antitrust law, the EU legislation does not harmonise procedures and sanctions. In the case of merger control there are still a few cases when governments overturn a decision concerning the prohibition of merger in a few countries. Some national competition authorities cannot impose interim measures while performing an investigation. In some countries, new public policies that have implication for competition are not subject to any competition assessment. Governments are obliged in a few countries only to reply to the recommendations made in market studies concerning an obstacle or restriction to competition caused by an existing public policy. These differences should be tackled within an updated framework at the EU level.
Public procurement rules have been overhauled
Public procurement markets are also fragmented, thus reducing potential gains from integration. In 2005, import penetration in the EU stood at 7½ per cent of demand in the public sector, against about 19% in the private sector (EC, 2011b). Opening public procurement to other EU members needs to be more ambitious to reduce loopholes in the existing EU Procurement Directive, as discussed in the 2012 Survey (OECD, 2012a). The openness of public procurement varies widely across countries (Figure 11). National policies still need to be improved on a number of issues (e.g. provision of evidentiary documents) to facilitate cross-border participation in practice in many EU countries, and procedures generate

ECO/WKP(2014)55
17
disproportionate cost for small contracts (EC, 2011c). The public procurement legislative package adopted in February 2014 to streamline cumbersome procedures is a move in the right direction. At the same time, this package can promote a more sustainable growth by enabling purchasers to better take into account innovation, environmental and social objectives in their choices (e.g. taking into account life-time costs, sanctioning violation of mandatory social, labour or environmental law).
Figure 11. Cross-border procurement As a percentage of the number of awards, average 2007-09
Source: EC (2011), "Cross-Border Procurement Above EU Thresholds", Final Report, DG Internal Market and Services, March.
The EU Services Directive aims at tackling regulatory barriers
The Services Directive, passed in December 2006 and due to be implemented fully by the end of 2009, marked a small step in removing barriers to services integration, as the final Directive is much less ambitious than the initial proposal. The Services Directive removes discriminatory, disproportionate and unjustified national requirements on service providers, clarifies the requirements to ensure freedom of establishment, adopts the “silence is consent” rule and creates Points of Single Contacts (PSCs) for investors. Its sectorial coverage is broad, but key services were left out because they were already covered by other EU legal acts (such as telecommunications, electricity, financial). The Directive does not eliminate all barriers to trade and all regulatory differences between EU member states. It does not apply the rules of the service providers’ country of origin in a foreign country, which in turn reduces competition from foreign providers.
On the basis of PMR indicators, the Directive has had little impact so far on reducing barriers. PMR indicators show that barriers in services hardly changed between 2008 and 2013, and even seem to have deteriorated in several EU countries (Figure 12). EU member states can maintain a number of regulatory requirements if they are assessed to be non-discriminatory, necessary and proportionate. EU member states were to screen these requirements as part of the transposition process of the directive. This requires judgment on a case-by-case basis. As discussed in EC (2013a), unjustified and disproportionate requirements still remain widespread among EU member states. Administrative barriers to entry can thus be further reduced, and regulatory burdens to cross-border service trade eased. This can be best achieved by considering a revised directive that prohibits more systematically requirements that can be unjustified and disproportionate. But such a process would take time, and action by EU member states is necessary to reduce undue requirements as soon as possible. Measures taken by EU member states to implement the Services Directive have been estimated to increase GDP by approximately 0.8% over 5-10 years. A more ambitious implementation of the Services Directive could generate an additional 0.6%-2.6% of GDP (Monteagudo et al., 2012).
0
5
10
15
20
25
30
0
5
10
15
20
25
30
PO
L
SV
N
LVA
GR
C
ISL
BG
R
LTU
RO
U
ES
T
DE
U
HU
N
NLD
EU
27
MLT
SV
K
FR
A
PR
T
DN
K
FIN
GB
R
CZ
E
LUX
AU
T
IRL
SW
E
ES
P
NO
R
ITA
BE
L
Direct cross-borderIndirect cross-border through affiliates

ECO/WKP(2014)55
18
Figure 12. Barriers in services show little change between 2008 and 2013 in the EU1
Index scale from 0 (least restrictive) to 6 (most restrictive)
1. The set of PMR indicators is calculated with a revised methodology. For more details, see Source. Data for Luxembourg, Mexico,
Poland and Turkey are preliminary. Source: OECD, Product Market Regulation database; OECD (2014), Economic Policy Reform 2014: Going for Growth, Interim
Report, OECD Publishing, Paris; Koske, I. et al. (2014), “The 2013 Update of the OECD Product Market Regulation Indicators: Policy Insights for OECD and non-OECD Countries”, OECD Economics Department Working Papers, OECD Publishing, Paris, forthcoming.
The Commission peer review on the implementation of the Services Directive (EC, 2013a) confirms that there are still many obstacles. For example, there are still too many restrictions on the right of establishment, such as the obligation for companies to have a certain legal form or shareholding and capital requirements. Also, the peer review identifies room for progress in the implementation of the Points of Single Contact (PSC) in many EU member states. This can be achieved in particular by integrating PSCs in e-government structures, as done in some EU member states.
Enforcement of rules adds to barriers
Regulatory reforms cannot be effective unless the rule of law is strong in enforcing their implementation (O’Brien, 2013). In several EU countries civil proceedings are lengthy, especially in Italy. There is a negative correlation between trial length and FDI inflows (Figure 13), as slow civil justice can create uncertainty and costs for investors. This length is related to the structure of justice spending and the structure and governance of courts rather than to the sheer amount of resources devoted to justice (OECD, 2013a). While the harmonisation of civil justice practices across the European Union is out of reach given the deep-rooted differences in legal systems, the EU can consider two types of action to increase civil justice effectiveness in EU member states. First, an EU initiative on the harmonisation and minimum standards on judiciary statistics would help setting objectives. Comparable data on both inputs such as spending (salaries, computerisation…) and outcomes (number of pending and resolved cases, appealing outcomes…) would be needed. Second, country-specific recommendations in the context of the European Semester can include reforms to streamline civil justice procedures, where appropriate.
0
1
2
3
4
5
0
1
2
3
4
5
2013
AU
S
CH
L
CH
E
SW
E
NLD
NZ
L
NO
R
DN
K
FIN IRL
GB
R
KO
R
ES
T
ME
X
SV
N
OE
CD
ISL
JPN
EU
21
PR
T
DE
U
CZ
E
CA
N
SV
K
FR
A
GR
C
ISR
ES
P
AU
T
HU
N
BE
L
TU
R
LUX
PO
L
ITA
2008

ECO/WKP(2014)55
19
Figure 13. Long trial length is associated with a lower share of FDI
1. Total trial length includes 1st instance, 2nd instance and highest court trial lengths. Source: Palumbo, G. et al. (2013), “The Economics of Civil Justice: New Cross-country Data and Empirics”, OECD Economics
Department Working Papers, No. 1060, OECD Publishing, Paris; OECD, Foreign Direct Investment database.
Enforcement of EU laws at the national level remains uneven reducing trade gains
National level enforcement of EU regulations can also create heterogeneity in practice (Pelkmans and Correira de Brito, 2012). The pace of transposition of EU directives has been uneven across EU member states, creating some heterogeneity in practice (Kalemli-Ozcan et al., 2013). The transposition process takes time, since it requires modifications of existing institutional structures, the removal of previous regulations and, in many cases, the establishment of new agencies and infrastructure. Making sure that EU directives are implemented is a prerequisite to foster the Single Market. The recent decrease of the number of infringement cases is encouraging (Figure 14). The EU Pilot introduced in 2008 has helped to reduce infringement cases. This is an online platform used by EU member states and the Commission to clarify factual and legal background of problems arising in relation to the application of EU law. The project was initiated in 2008 with the participation of 15 EU member states. Participation of all EU member states was achieved by mid-2012 (with Croatia joining from the day of accession). Nevertheless, in some areas, such as environment and transport, the number of infringement cases remains high (EC, 2013b).
Figure 14. The number of infringement cases1 is decreasing
1. Infringement proceedings based on multiple complaints are treated jointly under one single case and thus excluded from the
calculation. Source: EC (2013), Single Market Scoreboard - Infringements, Reporting period: 11/2012-05/2013,
http://ec.europa.eu/single-market-scoreboard.
0 500 1000 1500 2000 2500 30000
2
4
6
8
10
12
2012 FDI inflows,% of GDP
0
2
4
6
8
10
12
2012 FDI inflows,% of GDP
Average total trial length in days ¹
CZE
EST
FINFRA
HUN
ITA
PRT
SVK
SVNESP
700
800
900
1000
1100
1200
1300
1400
1500No. of pending cases
700
800
900
1000
1100
1200
1300
1400
1500No. of pending cases
2003 04 05 06 07 08 09 10 11 12 13
EU-Pilot 15

ECO/WKP(2014)55
20
The SOLVIT network created in 2002 is another positive step to improve the implementation capacity of the EU law at national level. This online network for settling cross-border disputes informally over the incorrect application of the Single Market rules is based on mutual co-operation among national SOLVIT centres. The network has also been integrated within the Internal Market Information System (IMI). IMI is a secure online application that allows national, regional and local authorities to communicate easily with their counterparts abroad regarding legislative domains. Fostering the visibility and the capacity of the SOLVIT network may be necessary to fully reap the benefits.
In the longer run, the Single Market needs to move closer to a single rule book. A more integrated Single Market would require a much more similar set of basic institutions across countries, as detailed in the 2012 Survey (OECD, 2012a). Gathering a basic set of rules in a single rule book would considerably reduce informational barriers.
Box 2. Main recommendations to reduce implicit barriers within the Single Market
• Improve the implementation of the Services Directive, in particular by eliminating unjustified and disproportionate restrictions to the cross-border provision of services and to the establishment of businesses.
• Consider a broad-based initiative to develop mutual recognition of standards.
• Identify areas where the heterogeneity of regulations and tax-related procedures can be further reduced and strengthen efforts to enforce the EU law at the national level.
• Promote the reduction of unnecessary product market regulations, with a particular focus to reforms reducing regulatory heterogeneity.
• Move forward with plans to reduce VAT-related administrative burdens, systematically address double taxation issues and increase co-ordination of procedures related to corporate taxation and social security contributions.
• To encourage FDI, consider an initiative to further reduce equity restrictions, approval requirements and other operational restrictions.
• Strengthen recommendations to streamline civil justice procedures.
• Consider an initiative to identify and support best bankruptcy practices, such as bankruptcy laws that do not overly penalise failure.
• Revise the Takeover Directive to render takeovers more profitable, by reducing legal uncertainties, the availability of anti-takeover provisions and limiting the scope of application of the minimum price rules.
Enhancing labour market mobility within the Single Market adds to gains
Potential benefits for growth and employment from trade integration can be reaped faster in countries with flexible labour markets (Kambourov, 2009). Stringent labour market regulations make it difficult for firms under stress to cut redundant employment, as well as impinge on hiring in risky ventures. In the case of the EU, this reinforces the need for removing unjustified labour mobility barriers within the Single Market. The labour reallocation process is impeded by barriers to residential mobility within and between countries as discussed in the 2012 Survey (OECD, 2012a).

ECO/WKP(2014)55
21
Labour market mobility has risen in the EU according to the OECD Migration Outlook (OECD, 2013b). This rising trend mainly reflects emigration from Eastern European countries following their integration within the area that is covered by the EU legal acquis in the field of free movement of workers – see the 2012 Survey (OECD, 2012a) for more details on the modalities of the establishment of free movement of people following this integration. As a result, the number of EU mobile citizens (migrants) has risen since 2004 (Figure 15).
Figure 15. Stock of migrated population within the EU1
1. Population coming from an EU country (28 countries) and living in an EU country that is also a member of the OECD
(21 countries). Source: Eurostat and OECD, International Migration database.
There is also tentative evidence that the migration response to the crisis has been stronger in Europe than in the United States (Jauer et al., 2014). Migration flows towards countries hit by unemployment such as Spain have collapsed (Figure 16). Larger migration flows could reduce somewhat unemployment rates in crisis countries, impact positively on wages and employment levels in destination countries, and mitigate skill shortages (OECD, 2012b).
Figure 16. Immigration flows1 into western EU countries
1. Harmonised data of permanent migrants. Source: OECD calculations based on Eurostat and OECD, International Migration database.
Generally, the relatively low level of labour mobility within the EU can be explained by a number of non-policy factors (linguistic and cultural barriers, family ties), and policy barriers (lack of harmonisation of social security and taxation systems and of professional qualifications, as well as legal or administrative barriers). The EU has addressed some of these policy barriers, e.g. by establishing a EU system of recognition of professional qualifications and a EU system of co-ordination of social security benefits
0.0
0.5
1.0
1.5
2.0
2.5
3.0% of population
0.0
0.5
1.0
1.5
2.0
2.5
3.0% of population
1995 96 97 98 99 2000 01 02 03 04 05 06 07 08 09 10 11
0.0
0.2
0.4
0.6
0.8
1.0
1.2
1.4
1.6
% of population
0.0
0.2
0.4
0.6
0.8
1.0
1.2
1.4
1.6
% of population
2011
FRA PRT GBR FIN ITA DEU SWE IRL ESP BEL NLD DNK AUT CHE
2006
ECO/WKP(2014)55
22
ensuring that EU workers do not lose out on acquired rights when taking a decision to cross borders. The EU regulations on the co-ordination of social security systems cover benefits like first pillar pensions and unemployment benefits. Certain co-ordination mechanisms, such as the aggregation of periods fulfilled in another EU Member State, ensure that the exercise of the right to freedom of movement does not have the effect of depriving a worker of social security advantages which he would have been entitled to if he had spent his working life in only one EU Member State.
However, as discussed in the 2012 Survey (OECD, 2012a) strong impediments to labour mobility can be further removed. A person who goes to another EU member state to seek work can “export” the unemployment benefits rights for a period of 3 months, and national institutions can extend this period up to a maximum of 6 months. Many EU member states apply the minimum period of three months only, such a limited portability can reduce labour mobility. Mobility is especially difficult for public sector jobs, which should be open to other nationals as discussed in the 2012 Survey (OECD, 2012a). Recognition of qualifications remains uneven across EU member states. Cumbersome recognition procedures for skills imposed by national authorities could, in most cases, be replaced by automatic recognition: more than 90% of professionals requesting the recognition of their qualifications in another country receive a positive decision according to the EU regulated professions database.
The EU has adopted the directives on free movement of workers and on acquisition and preservation of supplementary pension rights. These welcome directives require EU member states to take concrete action to guarantee a more effective and homogeneous application of EU law in this area. Their adoption requires that at least one body in every EU member state provides assistance and information to EU workers and their family members on their EU rights, and improves portability of pension rights. These initiatives should be broadened to eliminate double taxation of pensions and develop automatic recognition of documents and qualification.
Apart from measures that generate advantages to national workers, hurdles faced by migrants within each country are also created by inappropriate national policies, such as high housing transaction costs as discussed in the 2012 Survey (OECD, 2012a). Such mobility barriers affect both nationals and non-nationals, and hence reforming national policies will also entail spill-over effects. Within the European Semester, more emphasis could be put on such mobility barriers, where appropriate.
Language barriers are important in the labour mobility field, and they need to be addressed by continuing efforts to strengthen language skills of EU citizens. The Erasmus programme that encourages cross-border mobility of EU students tackles this issue at its roots, but it has limited impact as only 1% of EU students benefit from the programme each year. Foreign language education can be promoted by a wider use of non-national teachers, which accounted for only 1.7% of all teachers in 2005 (EC, 2006 and Figure 17). In this field, country specific design of recruitment processes can act as an implicit barrier to mobility. For language teachers, the recruitment process should put more weight on language skills, so that those whose mother tongue is foreign would have an advantage. Recruiting more non-national language teachers would help overcome the shortage of language teachers in primary education (EC, 2012b). In addition, temporary mobility of national teachers can be substantially increased, as over 70% of all teachers say they are willing to take part in mobility (Williams et al., 2006). This can be enhanced by reconsidering selection procedures so as to give less weight to the command of the foreign language, as well as simplifying the procedures across countries (Williams et al., 2006).

ECO/WKP(2014)55
23
Figure 17. Share of EU25 non-national teachers1 2005
1. Zero denotes no reported non-national teachers. However, it should be noted that the Labour Force Survey reports figures in
thousands, therefore, it is possible that when countries report zero, they may have fewer than 500 non-national teachers. Source: GHK (2006), “Study on Key Education Indicators on Social Inclusion and Efficiency, Mobility, Adult Skills and Active
Citizenship - Lot 2: Mobility od Teachers and Trainers”, Final Report, European Commission DG EAC, Table 3.11.
Dealing with short-term (labour) costs of adjustment makes the gains from Single Market integration more inclusive. In the short run, many workers may lose their jobs as integration advances. Activity losses in low productivity firms can dominate activity gains in productive and exporting firms if factor reallocation is slow. To reduce these losses and resistance to change, more emphasis on efficient active labour market policies may be needed. A comprehensive evaluation of each scheme can help to identify best practices. Training can be particularly important, if workers need to switch to a new specialisation. It can be necessary also to address these short-term cost with some compensation to avoid large welfare losses for some and to make reforms happen, as discussed in OECD (2010a). However, in a repeated game, paying the opponents of reforms may also reinforce opposition to future reforms as perceived weakness of the government can encourage agents to push for maximum concessions (OECD, 2010a).
Box 3. Main recommendation to enhance labour mobility
• Take measures to eliminate double taxation of pensions, develop automatic qualification recognition, and eliminate disproportionate national barriers related to regulated professions.
Better network interconnections across borders would enhance integration gains
Among regulatory barriers that impede trade, regulations in network industries such as airlines, telecommunications, postal services, road transport and electricity are important for trade outcomes (Fournier et al., 2014). If EU countries were to align their ETCR indicator to the best performers (e.g. average of first half), this could boost trade within EU countries by more than 5%.
For the Single Market to function fully, network industry connections (for example, the electricity grid) between countries need to be upgraded to stimulate cross-border competition. Integration of international networks is far from complete as illustrated for instance by price gaps in electricity or telecommunication services across countries (see OECD, 2012a and Figure 18). This reflects a history of national networks. As national regulators address competition, technical or safety issues, transnational firms have to deal with numerous regulators, and no national regulator can fully consider international connections. Strengthening co-operation with a view to move towards cross-border regulators would reduce the regulatory burdens for transnational firms, making it easier for firms to enter new countries and hence in all likelihood reduce the market share of incumbents.
0.0
0.5
1.0
1.5
2.0
2.5
3.0
3.5
4.0Per cent
0.0
0.5
1.0
1.5
2.0
2.5
3.0
3.5
4.0Per cent
C
ZE
ES
T
ITA
LVA
LTU
MLT
SV
K
SV
N
BG
R
RO
U
GR
C
FR
A
PO
L
PR
T
FIN
HU
N
EU
21
NLD
GB
R
ES
P
DE
U
SW
E
DN
K
IRL
AU
T
BE
L

ECO/WKP(2014)55
24
Figure 18. Mobile phone prices are widely dispersed Cost of a basket of 300 calls + 1 GB for a mobile phone,1 VAT included, August 2013
1. Mobile phone price dispersion would be roughly similar if one considers another basket of mobile services, as illustrated in
Source. Source: OECD (2013), Communications Outlook 2013, OECD Publishing, Paris, Figure 7.22 with updated data.
Fragmentation in the transport sector
In transport, road networks have historically better connected cities within countries compared to between countries (Braconier and Pisu, 2013). New road plans are needed to focus on international connections. In the rail passenger services markets, restrictions to international competition reduce efficiency and hence increase transport costs (EC, 2012a). EU institutions should continue to make efforts to open transport markets to competition, as it did in other fields (e.g. telecommunication, energy). The fourth railway package proposed by the Commission would facilitate the entry of new operators by introducing mandatory tendering of public service contracts, addressing risks of cross-subsidisation, reducing administrative and technical barriers. As regards air transport, air traffic management is fragmented, and progress to strengthen co-operation between air navigation service providers has been limited (EC, 2013c). Air traffic management needs to be further integrated to face safety and capacity challenges raised by the growth of air traffic at the least cost (EC, 2013c). Airline flight routes can be shortened, and this would reduce carbon emissions. Cohesion funds can be an appropriate lever to improve international transport connections, provided that private co-investors more systematically bear a large share of risks in transport infrastructure programmes to make sure that the most efficient programmes are chosen.
Goods transported between EU seaports are still subject to the same administrative formalities as goods arriving from outside the EU. These obstacles generate costs and delays for carriers and should be removed, as concerns about custom duty fraud can be addressed by new technologies (e.g. satellite observation). Ships that carry mainly Union goods can already be exempted from these formalities following the regular shipping service procedure if they are properly registered and if they travel only between EU seaports on a predetermined route. However, this procedure is considered cumbersome by the shipping industry (EC, 2013d). The EU “Blue Belt” initiative (EC, 2013d) would simplify the regular shipping service procedure and would introduce an electronic cargo manifest to streamline custom procedures for Union goods of ships that cannot apply for the shipping service procedure because they carry both Union and non-Union goods or make regular stops in third country ports.
0
10
20
30
40
50
60
70
80
90EUR
0
10
20
30
40
50
60
70
80
90EUR
A
UT
ES
T
FIN
NO
R
SW
E
FR
A
GB
R
DN
K
AU
S
ISR
IRL
TU
R
PO
L
CH
E
NLD
EU
21
NZ
L
ISL
OE
CD
LUX
ITA
BE
L
SV
N
CZ
E
DE
U
CA
N
ES
P
SV
K
ME
X
PR
T
KO
R
US
A
CH
L
GR
C
JPN
HU
N
ECO/WKP(2014)55
25
The growth of the digital economy raises new regulatory issues to ensure fair competition
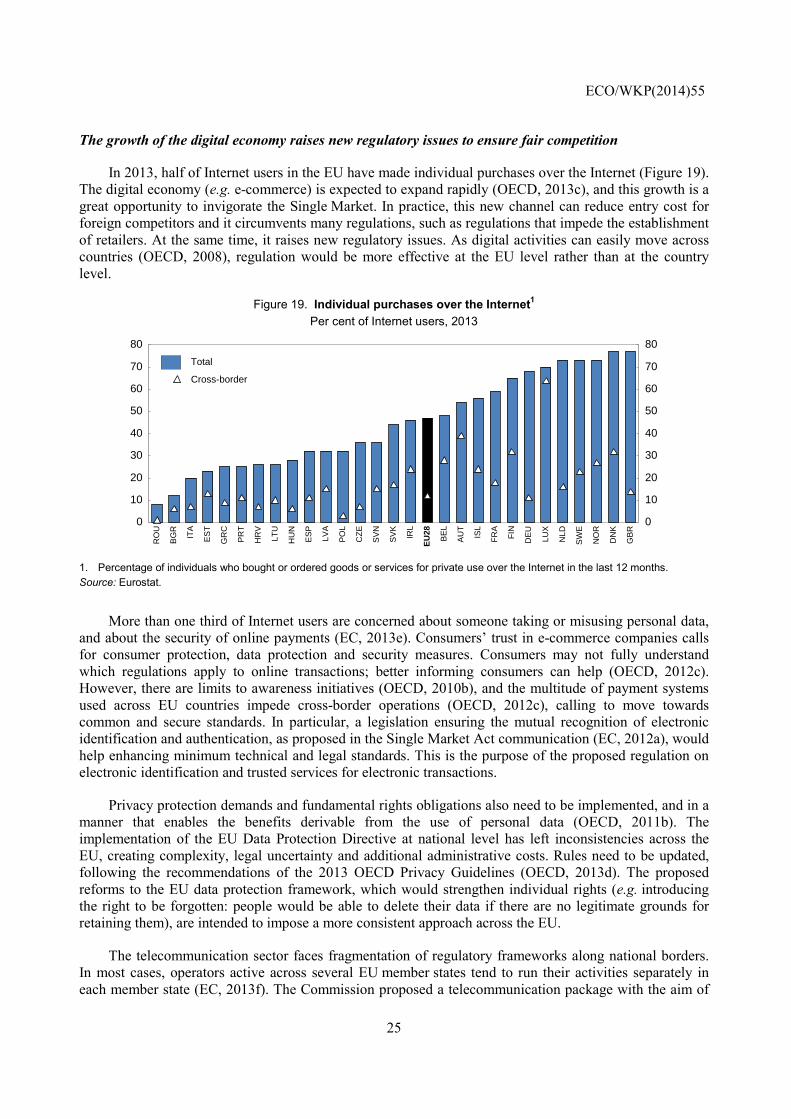
In 2013, half of Internet users in the EU have made individual purchases over the Internet (Figure 19). The digital economy (e.g. e-commerce) is expected to expand rapidly (OECD, 2013c), and this growth is a great opportunity to invigorate the Single Market. In practice, this new channel can reduce entry cost for foreign competitors and it circumvents many regulations, such as regulations that impede the establishment of retailers. At the same time, it raises new regulatory issues. As digital activities can easily move across countries (OECD, 2008), regulation would be more effective at the EU level rather than at the country level.
Figure 19. Individual purchases over the Internet1 Per cent of Internet users, 2013
1. Percentage of individuals who bought or ordered goods or services for private use over the Internet in the last 12 months. Source: Eurostat.
More than one third of Internet users are concerned about someone taking or misusing personal data, and about the security of online payments (EC, 2013e). Consumers’ trust in e-commerce companies calls for consumer protection, data protection and security measures. Consumers may not fully understand which regulations apply to online transactions; better informing consumers can help (OECD, 2012c). However, there are limits to awareness initiatives (OECD, 2010b), and the multitude of payment systems used across EU countries impede cross-border operations (OECD, 2012c), calling to move towards common and secure standards. In particular, a legislation ensuring the mutual recognition of electronic identification and authentication, as proposed in the Single Market Act communication (EC, 2012a), would help enhancing minimum technical and legal standards. This is the purpose of the proposed regulation on electronic identification and trusted services for electronic transactions.
Privacy protection demands and fundamental rights obligations also need to be implemented, and in a manner that enables the benefits derivable from the use of personal data (OECD, 2011b). The implementation of the EU Data Protection Directive at national level has left inconsistencies across the EU, creating complexity, legal uncertainty and additional administrative costs. Rules need to be updated, following the recommendations of the 2013 OECD Privacy Guidelines (OECD, 2013d). The proposed reforms to the EU data protection framework, which would strengthen individual rights (e.g. introducing the right to be forgotten: people would be able to delete their data if there are no legitimate grounds for retaining them), are intended to impose a more consistent approach across the EU.
The telecommunication sector faces fragmentation of regulatory frameworks along national borders. In most cases, operators active across several EU member states tend to run their activities separately in each member state (EC, 2013f). The Commission proposed a telecommunication package with the aim of
0
10
20
30
40
50
60
70
80
0
10
20
30
40
50
60
70
80
Total
Cross-border
RO
U
BG
R
ITA
ES
T
GR
C
PR
T
HR
V
LTU
HU
N
ES
P
LVA
PO
L
CZ
E
SV
N
SV
K
IRL
EU
28
BE
L
AU
T
ISL
FR
A
FIN
DE
U
LUX
NLD
SW
E
NO
R
DN
K
GB
R

ECO/WKP(2014)55
26
reducing this fragmentation, inter alia by eventually eliminating roaming surcharges, harmonising end-user protection rules, simplifying rules for cross-border operation of electronic communications services (EC, 2013h). However, it leaves the existing regulatory framework largely untouched, including in the way that national regulators supervise markets, with the aim to avoid disrupting operations (EC, 2013g). The OECD PMR indicator shows that rules applied to network providers vary across EU member states. For example, whether network access providers are allowed to give network bandwidth priority to content and application providers or not, depends on countries (Koske et al., 2014). The provisions related to net neutrality that are part of the proposed “Connected Continent” package aim at ensuring the openness of the Internet while enhancing the introduction of innovative services (EC, 2013f). However, the European Data Protection Supervisor believes that providers would still be given large rights to manage Internet traffic (EDPS, 2013). This issue needs to be monitored carefully with the aim to prevent dominant providers from undertaking practices that abuse market power in the provision of Internet services.
The deployment of high speed communication infrastructure needs a fair wholesale price, so that associated revenues participate in the coverage of the network’s fixed costs (Laffont and Tirole, 2000). On the other hand, a high level of competition has to be granted by the regulatory environment. To some extent the EU has succeeded in this through local loop unbundling, which introduced new players in the market that innovated and delivered new services at affordable prices. The result is a high basic broadband penetration in many EU countries, combined with affordable prices in most EU countries. The most competitive markets exhibit record levels of investment such as in France (in 2012 investment was the highest since the liberalisation of the market). Achieving sufficient investment in other countries requires an efficient and credible regulator. According to the Commission, there is still a lack of investment in high speed communication networks (EC, 2012a), which could imply a need for better implementation of competition policies, and stable and consistent access regulation throughout the EU so that private firms can set up long-term investment plans. This is the objective pursued by the “Commission Recommendation on consistent non-discrimination obligations and costing methodologies to promote competition and enhance the broadband investment environment” (EC, 2013h). The main mechanism that has so far spurred investment by existing players has been competition, either from competing existing infrastructures (such as cable vs. public switched telephone network), new entrants or publicly-controlled utilities (as in the Scandinavian countries).
In addition, civil engineering costs represent up to 80% of the cost of deploying new networks (EC, 2013i), an important part of which is related to inefficiencies (e.g. in granting permits), which should be suppressed. This deployment would also be facilitated by cutting red tape and by encouraging cross-utility reuse of infrastructures, including those of other utilities, following best practices observed in Lithuania and Portugal (EC, 2013i). Synergies across sectors may significantly reduce the need for civil works. The Commission has proposed measures aiming to reduce the cost of network deployment (EC, 2013i).
Differences in the timing, the conditions and the costs of procedures for acquiring spectrum make it hard to develop integrated wireless networks between countries. Strong reform could be possible, such as harmonisation of spectrum allocation, harmonisation of the dates in which spectrum is being used and assignment of numbering resources. One important example is machine-to-machine communication, which is expected to be the telecommunication market’s main growth driver. Research conducted by the OECD’s Directorate for Science, Technology and Industry indicates that an enormous potential lies in breaking up the exclusive right of spectrum holders to issue SIM cards (OECD, 2012d). Permitting third parties like non-telecom operators to issue their own SIM cards and to freely choose their network would enable businesses and consumers in all sectors to seamlessly switch network providers, to purchase mobile roaming at lower cost and increase reliability, generating large cost savings. The proposed “Connected Continent” package establishes a co-ordinated approach to the assignment of radio spectrum, potentially leading to the consistent availability of this key input throughout the Single Market.

ECO/WKP(2014)55
27
The development of the Internet economy across borders, using mobile devices, is impeded by data roaming prices, which are currently much higher than domestic rates (OECD, 2011c), and well above marginal costs. Effective competition can help to address this barrier to the Single Market, as illustrated with the first ‘off-net roaming’ offers that enable users to use mobile services in other EU countries, as part of their regular bundles, without additional costs. That is why the EU roaming regulation adopted in 2012 introduces competition in the provision of roaming services, by enabling customers to choose a roaming operator distinct from his domestic operator (‘decoupling’ obligation), on a permanent basis or at the destination during travels for data roaming. The regulation also maintains gradually decreasing caps on roaming prices. Addressing barriers to cross-border use of devices, such as in the area of machine-to-machine communication, is likely to quickly transform the mobile market in areas such as data roaming.
Electricity grids lack investments
Commission estimates point to considerable investment needs for networks by 2020 (EUR 140 billion for electricity and EUR 70 billion for gas; EC, 2011a). Renewable energy growth can only occur with additional electrical network infrastructure, with a special focus on interconnection of national networks. Some areas in the EU, like the Iberian Peninsula, still have only limited connections to European electricity and gas networks. Price differences between neighbouring countries such as France and Italy show that network bottlenecks prevent efficient electricity resources allocation (Figure 20). In addition, better interconnection would reduce production capacity needed to handle demand peaks.
Figure 20. Electricity prices for industry EUR per thousand kilowatt hours before taxes, 20121
1. Or latest available data. Source: IEA, Energy Prices database.
Decisive policy actions can support investment in electricity grids. National incumbents with large market shares in home countries have a strong interest in stifling investment in interconnection capacity to protect their own national markets. Ownership unbundling of generation, supply and network activities within vertically-integrated electricity utilities is needed, in the EU member states where they are not realised so far, to address conflicts of interest. Permit procedures should be streamlined where possible. In addition, the Commission should continue its efforts to promote smart grids that minimise consumption to develop binding network codes and guidelines.
Energy regulation is still mostly in the hands of national authorities, contributing to inefficiencies, and co-ordination at the EU level has been slow to develop (Black, 2013). Complex burdens for cross-border firms, low import competition in the energy sector and higher administrative costs reduce efficiency. Varying interest among EU member states explains the lack of co-operation. EU framework should aim at achieving convergence of these interests (e.g. generalising non-state ownership of energy firms), with the ultimate goal to move towards a genuine EU-level regulation of energy. There is a strong case for gains
0
20
40
60
80
100
120
140
160
0
20
40
60
80
100
120
140
160
NO
R
CA
N
ES
T
SW
E
NZ
L
FIN
NLD
DN
K
FR
A
DE
U
LUX
ISR
SV
N
PO
L
BE
L
GR
C
AU
T
ME
X
OE
CD
EU
21
TU
R
HU
N
CH
E
CH
L
GB
R
ES
P
CZ
E
PR
T
IRL
SV
K
JPN
ITA
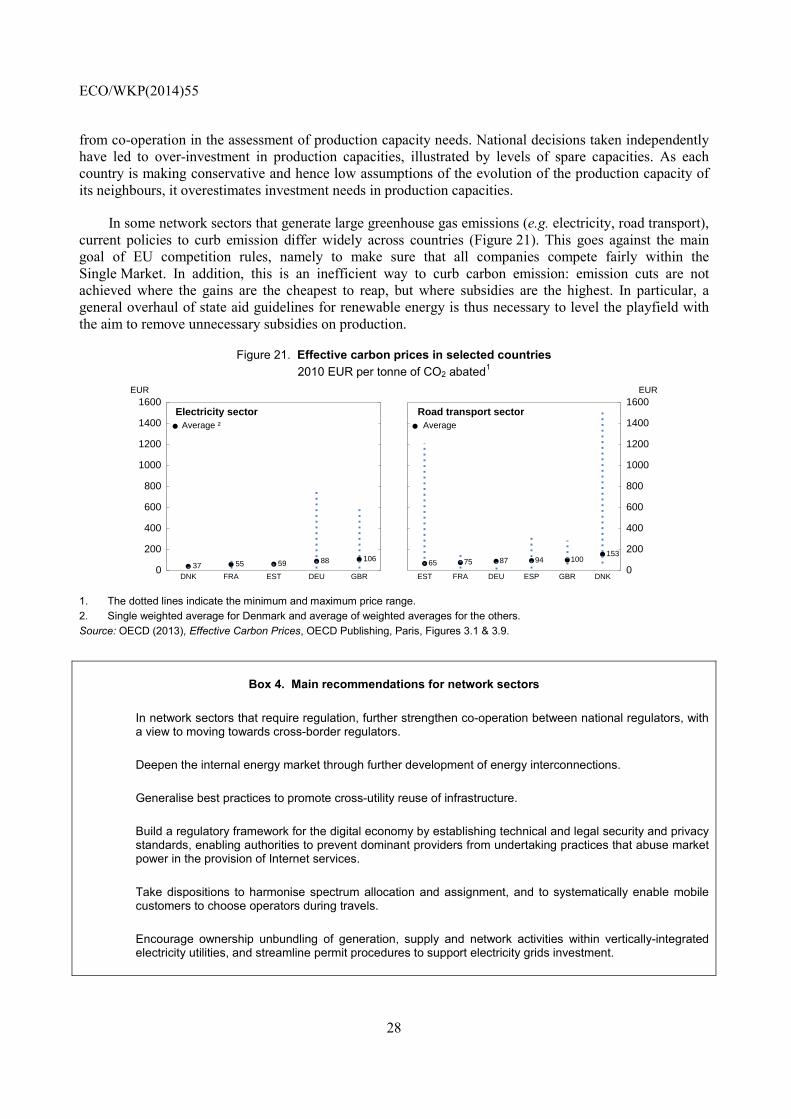
ECO/WKP(2014)55
28
from co-operation in the assessment of production capacity needs. National decisions taken independently have led to over-investment in production capacities, illustrated by levels of spare capacities. As each country is making conservative and hence low assumptions of the evolution of the production capacity of its neighbours, it overestimates investment needs in production capacities.
In some network sectors that generate large greenhouse gas emissions (e.g. electricity, road transport), current policies to curb emission differ widely across countries (Figure 21). This goes against the main goal of EU competition rules, namely to make sure that all companies compete fairly within the Single Market. In addition, this is an inefficient way to curb carbon emission: emission cuts are not achieved where the gains are the cheapest to reap, but where subsidies are the highest. In particular, a general overhaul of state aid guidelines for renewable energy is thus necessary to level the playfield with the aim to remove unnecessary subsidies on production.
Figure 21. Effective carbon prices in selected countries 2010 EUR per tonne of CO2 abated1
1. The dotted lines indicate the minimum and maximum price range. 2. Single weighted average for Denmark and average of weighted averages for the others. Source: OECD (2013), Effective Carbon Prices, OECD Publishing, Paris, Figures 3.1 & 3.9.
Box 4. Main recommendations for network sectors
• In network sectors that require regulation, further strengthen co-operation between national regulators, with a view to moving towards cross-border regulators.
• Deepen the internal energy market through further development of energy interconnections.
• Generalise best practices to promote cross-utility reuse of infrastructure.
• Build a regulatory framework for the digital economy by establishing technical and legal security and privacy standards, enabling authorities to prevent dominant providers from undertaking practices that abuse market power in the provision of Internet services.
• Take dispositions to harmonise spectrum allocation and assignment, and to systematically enable mobile customers to choose operators during travels.
• Encourage ownership unbundling of generation, supply and network activities within vertically-integrated electricity utilities, and streamline permit procedures to support electricity grids investment.
0
200
400
600
800
1000
1200
1400
1600EUR
Electricity sectorAverage ²
37DNK
55
FRA
59
EST
88
DEU
106
GBR0
200
400
600
800
1000
1200
1400
1600EUR
Road transport sectorAverage
65
EST
75
FRA
87
DEU
94
ESP
100
GBR
153
DNK

ECO/WKP(2014)55
29
Free trade agreements (FTAs) can boost integration gains from the Single Market
Building stronger trade ties with the rest of the world would further boost integration gains
The foreign value added content of gross exports in the EU has risen sharply since 1995, as supply chains are becoming more and more global (Figure 22). This points to imports being essential for exports, especially in complex value chains, and hence tariffs and non-tariff barriers are effectively a tax on exports. Further integration of EU firms with these global value chains can enhance trade gains with countries that have different specialisation. This can be done by further opening the EU to the rest of the world.
Figure 22. Foreign value added content of gross exports1
As a share of gross exports
Source: OECD-WTO, Trade in Value Added (TiVA) database and OECD calculations.
Completing the Single Market and building stronger trade ties with the rest of the world are mutually reinforcing goals. Multilateral trade agreements would be the best way to reducing trade barriers. However, multilateral liberalisation progresses slowly: the Doha round started in 2001 and reached agreement on its trade facilitation chapter only in December 2013. Plurilateral agreements, provided that they are open and cover a critical mass of world trade, are a useful tool to address trade barriers among a range of WTO members in certain sectors and can serve as building blocks for multilateralism. Examples in which the EU is involved include the negotiations on an Information Technology Agreement, Trade in Services Agreement and the recently-launched Environmental Goods initiative.
Bilateral FTAs, notably with the United States and Japan, are other important means for EU firms to realise benefits of globalisation of value chains across the world. They should also not only remove tariffs, but also lower barriers beyond the border. This includes barriers to investment, openness of public procurement markets, and alignment of rules and technical product standards, potentially with mutual recognition agreements. In particular, the largest gain from a trade agreement with the United States is to be won from regulatory reforms (OECD, 2005).
As value chains are global, third countries can also benefit from more active trade between two countries. Strengthening the Single Market can stimulate trade between the EU and the rest of the world, and trade agreements with non-EU partners can stimulate trade within the EU. Regulatory impediments to trade within the EU are also important impediments to trade with the rest of the world. Complexity of regulation can be even more costly for non-EU firms that may operate in a very different regulatory environment in their home country. Non-EU exporting firms, that enter the Single Market and lack single entry points for the whole EU, have to deal with regulatory rules on country-by-country basis. The harmonisation and simplification of rules to reduce implicit barriers within the Single Market should ensure that non-EU competitors can reap the same benefits. This can be achieved by promoting EU-wide single entry points for outsiders as well.
18
20
22
24
26
28
30
32
18
20
22
24
26
28
30
32
1995 2000 2005 2008 2009
Euro areaOECD-EUOECD

ECO/WKP(2014)55
30
An agreement is under negotiation with the United States
An FTA with the United States would be a major step: it could cover almost one half of world output and trigger more trade and growth for the two partners. It could become a building block for future multilateral initiatives. Beyond the cut of remaining tariff barriers, this negotiation is an opportunity to reduce non-tariff barriers (NTBs). The existing estimates, while using quite different approaches, suggest gains ranging from around 0.5 to around 3.5% of annual GDP (OECD, 2005; Berden et al., 2009). However, there is significant uncertainty surrounding these estimates. Francois et al. (2013) estimate that an ambitious scenario results in gain in GDP of only 0.5%, while the IFO Institute arrives at estimates of 13% and 10% welfare increase in the United States and the United Kingdom and 5% and 3% increase in Germany and France. The lower gains for France and Germany, despite high barriers reductions, reflect inefficiencies in the resource reallocation process.
The EU-USA FTA negotiation has to be broad based to deliver substantial gains. It could tackle barriers at sub-federal level of government in the United States, as well as at national level in the EU, especially in the services and public procurement sectors where barriers are still high. It could also introduce mutual recognition of standards and procedures, as well as harmonisation of property rights regimes. Overall, some business survey-based estimates suggest that up to 50% of the estimated impact of NTBs – defined as all non-price and non-quantity restrictions on trade – on costs or prices can be removed (Berden et al., 2009). Non-tariff barriers are the highest for food and beverage products and financial services in the United States, and for the business and ICT sector, communications sector, construction, and personal, cultural, other services in the EU (Berden et al., 2009). This negotiation could also cover high tariffs in motor vehicles, textiles, processed foods and agricultural commodities.
Negotiations are going on with many other trade partners
Keeping its engagement to the multilateral trading system, the EU should continue its efforts with other counterparts, with an emphasis on trade agreements with partners that have a large potential for gains, on grounds of size, different specialisations, large trade barriers, or because the partner’s fast trend growth creates major business opportunities. The EU applies FTAs with South Korea, Central America, Peru and Colombia. Agreements were concluded with Georgia and Moldova, and political agreement reached with Canada and Singapore. In addition to the United States, the EU is currently involved in negotiations with Japan, India, Mercosur, Vietnam, Malaysia, Ecuador and Morocco. In particular, rapidly-growing Asian economies already represent a substantial share of EU output (Figure 23), despite the persistence of many tariff and non-tariff barriers suggesting that on-going FTA negotiations with dynamic Asian economies can yield substantial gains. While the EU is pursuing many negotiations at the same time, two out of the five most important trading partners (China and Russia) are not covered by current FTA initiatives.

ECO/WKP(2014)55
31
Figure 23. Exports to dynamic Asian economies1 As a percentage of GDP
1. Dynamic Asian economies refer to China, Chinese Taipei, Hong Kong, India, Indonesia, Malaysia, Philippines, Singapore,
Thailand and Viet Nam. Source: OECD, Trade by Partner Countries and OECD Economic Outlook databases.
Box 5. Main recommendation to promote trade
• Continue the intensive engagement in multilateral trade negotiations, move forward with a trade agreement with the United States to reduce non-tariff barriers, while continuing to negotiate trade agreements with other partners.
0
1
2
3
4
5
6
0
1
2
3
4
5
62007
2012
GR
C
PR
T
ES
P
PO
L
SV
N
LUX
ITA
ES
T
GB
R
CZ
E
FR
A
AU
T
IRL
SV
K
SW
E
DN
K
FIN
EU
21
HU
N
NLD
DE
U
BE
L
ECO/WKP(2014)55
32
Bibliography
Aghion, P., Comin, D., and Howitt, P. (2006), “When Does Domestic Saving Matter for Economic Growth”, NBER Working Papers, No. 12275.
Alemani, E. et al. (2013), “New Indicators of Competition Law and Policy in 2013 for OECD and non-OECD Countries”, OECD Economics Department Working Papers, No. 1104, OECD Publishing, Paris.
Andrews, D. and F. Cingano (2012), “Public Policy and Resource Allocation: Evidence from Firms in OECD Countries”, OECD Economics Department Working Papers, No. 996, OECD Publishing, Paris.
Andrews, D. and C. Criscuolo (2013), “Knowledge-Based Capital, Innovation and Resource Allocation”, OECD Economics Department Working Papers, No. 1046, OECD Publishing, Paris.
van Ark, B. et al. (2013), “Recent Changes in Europe’s Competitive Landscape and Medium-Term Perspectives: How the Sources of Demand and Supply Are Shaping Up”, European Economy Economic Paper, No. 485.
Ben Yahmed, S. and S. Dougherty (2012), “Import Competition, Domestic Regulation and Firm-Level Productivity Growth in the OECD”, OECD Economics Department Working Papers, No. 980, OECD Publishing, Paris.
Berden, K. G. et al. (2009), “Non-Tariff Measures in EU-US Trade and Investment—An Economic Analysis”, Ecorys Nederland BV.
Black, J. (2013), “European Union Energy Regulation”, International Regulatory Co-operation: Case Studies, Vol. 2.
Bloom, N., M. Draca and J. Van Reenen (2011), “Trade Induced Technical Change? The Impact of Chinese Imports on Innovation, IT and Productivity”, NBER Working Paper, No. 16717.
Bloom, N., P. M. Romer, S. J. Terry and J. Van Reenen (2013), “A Trapped-Factors Model of Innovation”, The American Economic Review, Vol. 103, No. 3, May, pp. 208-213.
Braconier, H. and M. Pisu (2013), “Road Connectivity and the Border Effect: Evidence from Europe”, OECD Economics Department Working Papers, No. 1073, OECD Publishing, Paris.
EC (European Commission) (2006), “Study on Key Education Indicators on Social Inclusion and Efficiency, Mobility, Adult Skills and Active Citizenship, Lot 2: Mobility of Teachers and Trainers”, http://ec.europa.eu/education/more-information/moreinformation139_en.
EC (2009), “Copyright in the Knowledge Economy”, COM (2009) 532.

ECO/WKP(2014)55
33
EC (2011a), Executive Summary of Impact Assessment for the proposal for a Regulation on “Guidelines for trans-European energy infrastructure”, SEC(2011) 1234.
EC (2011b), “Final Report - Cross-Border Procurement Above EU Thresholds”, March.
EC (2011c), “Impact Assessment”, Commission Staff Working Paper, SEC (2011) 1585.
EC (2011d), “Impact Assessment”, Commission Staff Working Paper, SEC (2011) 482.
EC (2012a), “Single Market Act II, Together for New Growth”, Communication from the Commission to the European Parliament, the Council, the European Economic and Social Committee and the Committee of the Regions, COM(2012) 573.
EC (2012b), Key Data on Teaching Languages at School in Europe, European Commission Report.
EC (2013a), “On the Outcome of the Peer Review on Legal Form, Shareholding and Tariff Requirements under the Services Directive”, Commission Staff Working Document, SWD (2013) 402.
EC (2013b), “30th Annual Report on Monitoring the application of EU Law”, COM(2013) 726.
EC (2013c), “Accelerating the Implementation of the Single European Sky”, COM(2013) 408.
EC (2013d), “Blue Belt, a Single Transport Area for Shipping”, COM(2013) 510.
EC (2013e), “Cyber Security”, Special EuroBarometer, No. 404.
EC (2013f), “On the Telecommunications Single Market”, COM (2013) 634.
EC (2013g), “Proposal for a Regulation of the European Parliament and of the Council Laying Down Measures Concerning the European Single Market for Electronic Communications and to Achieve a Connected Continent”, COM(2013) 627.
EC (2013h), “Commission Recommendation on Consistent Non-Discrimination Obligations and Costing Methodologies to Promote Competition and Enhance the Broadband Investment Environment”, COM(2013) 5761.
EC (2013i), “Proposal for a Regulation of the European Parliament and of the Council on Measures to Reduce the Cost of Deploying High-Speed Electronic Communications Networks”, COM(2013) 147.
European Data Protection Supervisor (EDPS) (2013), “Opinion of the European Opinion of the European Data Protection Supervisor on the Proposal for a Regulation of the European Parliament and of the Council Laying Down Measures Concerning the European Single Market for Electronic Communications and to Achieve a Connected Continent”, October.
Fournier, J.-M. et al. (2014), “The Heterogeneity of Product Market Regulations”, OECD Economics Department Working Papers, OECD Publishing, Paris, forthcoming.
Fournier, J.-M. et al. (2014), “Implicit Barriers to the EU Single Market, New Empirical Evidence from Gravity Models”, OECD Economics Department Working Papers, OECD Publishing, Paris, forthcoming.
ECO/WKP(2014)55
34
Francois, J. et al. (2013), “Reducing Transatlantic Barriers to Trade and Investment: An Economic Assessment”, Centre for Economic Policy Research, London.
Giroud, X. and H.M. Mueller (2010), “Does Corporate Governance Matter in Competitive Industries?”, Journal of Financial Economics ,No. 95, pp. 312–331.
Humphery-Jenner, M. (2012), “The Impact of the EU Takeover Directive on Takeover Performance and Empire Building”, Journal of Corporate Finance, Vol. 18(2), pp. 254-272.
Jauer, J., T. Liebig, J. P. Martin and P. Puhani (2014), “Migration as an Adjustment Mechanism in the Crisis? A Comparison of Europe and the United States”, OECD Social, Employment and Migration Working Paper, forthcoming.
Kalemli-Ozcan, S., V. Korsun, B. E. Sorensen and C. Villegas-Sanchez (2014), “Who Owns Europe's Firms? Globalization and Foreign Investment in Europe”, OECD Economics Department Working Papers, forthcoming.
Kalemli-Ozcan, S., E. Papaioannou and J.-L. Peydro (2013), “Financial Regulation, Financial Globalization, and the Synchronization of Economic Activity”, Journal of Finance, Vol. 68(3), pp. 1179-1228.
Kalinova, B., A. Palerm and S. Thomsen (2010), “OECD's FDI Restrictiveness Index: 2010 Update”, OECD Working Papers on International Investment, 2010/03, OECD Publishing, Paris.
Kambourov, G. (2009), “Labour Market Regulations and the Sectoral Reallocation of Workers: The Case of Trade Reforms”, Review of Economic Studies, No. 76, pp. 1321–1358.
Koske, I., R. Bitetti, I. Wanner and E. Sutherland (2014), "The Internet Economy: Regulatory Challenges and Practices", OE2013CD Economics Department Working Paper, forthcoming.
Kox, H. and A. Lejour (2005), “Regulatory Heterogeneity as Obstacle for International Services Trade”, CPB Discussion Paper, No. 45.
Kox, H. and A. Lejour (2006), “The Effects of the Services Directive on Intra-EU Trade and FDI”, Revue économique, 2006/4 Vol. 57, pp. 747-769.
Laffont, J.-J. and J. Tirole (2000), Competition in Telecommunication, MIT Press, Cambridge, MA.
Monteagudo, J., A. Rutkowski and D. Lorenzani (2012), “The EconomicIimpact of the Services Directive: A First Assessment Following implementation”, European Economy Economic Paper, No. 456.
Monti, M. (2010), “A New Strategy for the Single Market”, Report to the President of the European Commission.
Nicoletti, G. et al. (2003), “Policies and International Integration: Influences on Trade and Foreign Direct Investment”, OECD Economics Department Working Papers, No. 359, OECD Publishing, Paris.
Nordås, H. K. and H. Kox (2009), “Quantifying Regulatory Barriers to Services Trade”, OECD Trade Policy Papers, No. 85, OECD Publishing, Paris.
O'Brien, P. (2013), “Policy Implementation in Italy: Legislation, Public Administration and the Rule of Law”, OECD Economics Department Working Papers, No. 1064, OECD Publishing, Paris.

ECO/WKP(2014)55
35
OECD (2005), The Benefits of Liberalising Product Markets and Reducing Barriers to International Trade and Investment: The Case of the United States and the European Union, OECD Economics Department Working Papers, No. 463, OECD Publishing, Paris.
OECD (2008), “The Future of the Internet Economy”, OECD Policy Brief, Paris.
OECD (2010a), Making Reforms Happen: Lessons from OECD Countries, OECD Publishing, Paris.
OECD (2010b), “Consumer Policy Toolkit”, OECD, Paris, July.
OECD (2011a), “The Impact of Trade Liberalisation on Jobs and Growth: Technical Note”, OECD Trade Policy Papers, No. 107, OECD Publishing, Paris.
OECD (2011b), “The Evolving Privacy Landscape: 30 Years After the OECD Privacy Guidelines”, Working Party on Information Security and Privacy.
OECD (2011c), “International Mobile Data Roaming”, OECD Digital Economy Papers, No. 180, OECD Publishing, Paris.
OECD (2012a), OECD Economic Surveys: European Union, OECD Publishing, Paris.
OECD (2012b), Free Movement of Workers and Labour Market Adjustment: Recent Experiences from OECD Countries and the European Union, OECD Publishing, Paris.
OECD (2012c), “Report on Consumer Protection in Online and Mobile Payments”, OECD Digital Economy Papers, No. 204, OECD Publishing, Paris.
OECD (2012d), “Machine-to-Machine Communications: Connecting Billions of Devices”, OECD Digital Economy Papers, No. 192, OECD Publishing, Paris.
OECD (2013a), “What Makes Civil Justice Effective”, OECD Economics Department Policy Notes, No. 18, June 2013, OECD Publishing, Paris.
OECD (2013b), International Migration Outlook 2013, OECD Publishing, Paris.
OECD (2013c), The Internet Economy on the Rise: Progress since the Seoul Declaration, OECD Publishing, Paris.
OECD (2013d), The OECD Privacy Framework, OECD Publishing, Paris.
Olley, G.S. and A. Pakes (1996), “The Dynamics of Productivity in the Telecommunications Equipment Industry”, Econometrica, 64(6), pp 1263-97.
Pelkmans, J. and A. Correira de Brito (2012), “Enforcement in the EU Single Market”, Center for European Policy Studies.
van Pottelsberghe de la Potterie, B. and D. François, (2006), “The Cost Factor in Patent Systems”, Université Libre de Bruxelles Working Paper, WP-CEB 06-002, Brussels.
Williams G. et al. (2006), Mobility: Detecting and Removing Obstacles to Foreign Language Teaching Abroad (DROFoLTA), Report to the European Commission Directorate General for Education and Culture, July.
ECO/WKP(2014)55
36
WORKING PAPERS
The full series of Economics Department Working Papers can be consulted at www.oecd.org/eco/workingpapers
1158. An exploration of the determinants of the subjective well-being of Americans during the Great Recession
(August 2014) by Aida Caldera Sánchez and Caroline Tassot 1157. Boosting the development of efficient SMEs in the Netherlands (Septembert 2014) by Rafal Kierzenkowski and Jochebed Kastaneer 1156. Making the banking sector more resilient and reducing household debt in the Netherlands (September 2014) by Rafal Kierzenkowski, Olena Havrylchyk and Pierre Beynet 1155. US long term interest rates and capital flows to emerging economies (July 2014) by Eduardo Olaberria 1154. Productivity measurement with natural capital and bad outputs (July 2014) by Nicola Brandt, Paul Schreyer and Vera Zipperer 1153. Reducing income inequality and poverty and promoting social mobility in Korea (July 2014) by Randall S. Jones and Satoshi Urasawa 1152. Fostering a creative economy to drive Korean growth (July 2014) by Randall S. Jones and Myungkyoo Kim 1151. Economic uncertainties and their impact on activity in Greece compared with Ireland and
Portugal (July 2014) by Jan-David Schneider and Claude Giorno 1150. Workplace stress in the United States: issues and policies (July 2014) by Michael Darden 1149. Taxing the rent of non-renewable resource sectors: a theoretical note (July 2014) by Julien Daubanes and Saraly Andrade de Sá 1148. Health, work and working conditions: a review of the European economic literature (July 2014) by Thomas Barnay 1147. Making the best of new energy resources in the United States (July 2014) by Douglas Sutherland 1146. Improving well-being in the United States (July 2014) by Aida Caldera Sánchez, Patrick Lenain and Sarah Fléche 1145. Deconstructing Canada’s housing markets: finance, affordability and urban sprawl (July 2014) by Calista Cheung Restructurer les marchés canadiens du logement : financements, accessibilité financière et
étalement urbain (Juillet 2014) par Calista Cheung
ECO/WKP(2014)55
37
1144. Women’s role in the Swiss economy (July 2014) by Richard Dutu Le rôle des femmes dans l’économie suisse (Juillet 2014) par Richard Dutu 1143. Overcoming skills shortages in Canada (July 2014) by David Carey Combler les pénuries de compétences au Canada (Juillet 2014) par David Carey 1142. Trade patterns in the 2060 world economy (July 2014) by Jean Chateau, Lionel Fontagné, Jean Fouré, Åsa Johansson and Eduardo Olaberria 1141. The Demand for Skills 1995-2008: A global chain perspective (July 2014) by Bart Los, Marcel P. Timmer and Gaaitzen J. De Vries 1140. International migration: The relationship with economic and policy factors in the home and
destination country (July 2014) by Ben Westmore 1139. Gross earning inequalities in OECD countries and major non-member economies: determinants
and future scenarios (July 2014) by Henrik Braconier and Jenifer Valenzuela Ruiz 1137. Managerial capital and business R&D as enablers of productivity convergence (September 2014) by Dan Andrews and Ben Westmore 1136. Long-term patterns of trade and specialisation (July 2014) by Asa Johansson and Eduardo Olaberria 1135. Consequences of climate change damages for economic growth – a dynamic quantitative
assessment (July 2014) by Rob Dellink, Elisa Lanzi, Jean Chateau, Francesco Bosello, Ramiro Parrado and
Kelly de Bruin 1134. Comparing the robustness of PAYG pension schemes (July 2014) by Falilou Fall 1133. Overcoming vulnerabilities of pension systems (July 2014) by Falilou Fall and Debbie Bloch 1132. Overcoming vulnerabilities of health care systems (July 2014) by Mauro Pisu 1131. Overcoming vulnerability of unemployment insurance schemes (July 2014) by Jon Pareliussen 1130. Vulnerability of social institutions: Lessons from the recent crisis and historical episodes (July 2014) by Falilou Fall, Mauro Pisu, Jon Pareliussen and Debbie Bloch