MARKET Pulse TWO-DAY reversal patterns · TWO-DAY reversal patterns These patterns take an extra...
5
I f you glance at any price chart, you’ll notice that market tops and bottoms seem easy to spot in hind- sight. But trends reverse for count- less reasons, so it is virtually impossible to identify these turning points as they are developing. Last year, we analyzed a reversal-day pattern to find out whether the stock market tended to change direction fol- lowing bars that make new five-day highs (or lows) before closing below (or above) the previous day’s low (or high). (See “Related reading,” p. 53.) The results were mixed. The pattern identified market bottoms accurately, but it failed to find market tops. This outcome simply reinforced market behavior found in previous studies: The market rebounded quickly from sharp sell-offs, but it also continued higher after large gains. Here, we re-examine reversal patterns and search for scenarios that lead to short-term weakness or strength, using the S&P 500 tracking stock (SPY). Overall, SPY is much more likely to weaken after hitting new highs if it changes direction over two days instead of one. Also, two-day reversals found market bottoms nearly as well as the typical one-day, reversal-low definition used in our 2005 analysis (i.e., a new five-day low that closes above yester- day’s high). Two-day reversal highs and lows The following three rules were used to define two-day reversal highs in SPY: 1. The current high is higher than the highs of the past five days. 2. SPY opens in the lower 40 percent of its daily range and closes within the upper 60 percent. 3. The next day’s close is below the current day’s open. The rules are reversed for two-day reversal lows: The current low is lower than the lows of the past five days, SPY must open in the upper 60 percent of its daily range and close in the lower 40 percent, and tomorrow’s close is above today’s open. We studied SPY’s daily price data from Jan. 29, 1993 to Sept. 13, 2006 and found 50 reversal highs and 36 reversal lows that met the criteria. Analyzing the patterns Figure 1 shows four reversal-high pat- terns within a strong uptrend from April to November 1995. Although SPY dropped further after some formations than others, the market declined following each of these patterns, if only briefly. The S&P 500 gained 16.22 percent during this six- month period, but these two-day reversal highs caught some of the few weak days within this rally, suggesting we’re on the right track. In contrast, standard rever- sal days that formed in Figure 1 (not shown) failed to identify any reversals within this uptrend. A closer look at Figure 1’s rever- sal highs shows even when SPY did climb, the market remained below the pattern’s high for at least four days in all cases but one (July 27). Figure 2 shows four reversal- low patterns from mid-April to the end of December 2005. Although all these lows were not perfect entry points, SPY climbed at some point in the first week following each of them. After the patterns formed on Aug. 26 and Dec. 3, SPY 48 www.activetradermag.com • December 2006 • ACTIVE TRADER These reversal patterns found short-term pullbacks within a strong uptrend in 1995 that standard reversal days rules did not identify. FIGURE 1 CATCHING WEAKNESS IN AN UPTREND — 1995 Source: eSignal TWO-DAY reversal patterns These patterns take an extra day to form, but they spot turning points more accurately than standard reversal-day definitions. MARKET Pulse BY DAVID BUKEY
Transcript of MARKET Pulse TWO-DAY reversal patterns · TWO-DAY reversal patterns These patterns take an extra...
If you glance at any price chart,you’ll notice that market tops andbottoms seem easy to spot in hind-sight. But trends reverse for count-
less reasons, so it is virtually impossibleto identify these turning points as theyare developing.
Last year, we analyzed a reversal-daypattern to find out whether the stockmarket tended to change direction fol-lowing bars that make new five-dayhighs (or lows) before closing below (orabove) the previous day’s low (or high).(See “Related reading,” p. 53.)
The results were mixed. The patternidentified market bottoms accurately,but it failed to find market tops. Thisoutcome simply reinforced marketbehavior found in previous studies: Themarket rebounded quickly from sharpsell-offs, but it also continued higherafter large gains.
Here, we re-examine reversal patternsand search for scenarios that lead toshort-term weakness or strength, usingthe S&P 500 tracking stock (SPY).Overall, SPY is much more likely toweaken after hitting new highs if itchanges direction over two days insteadof one. Also, two-day reversals foundmarket bottoms nearly as well as thetypical one-day, reversal-low definitionused in our 2005 analysis (i.e., a newfive-day low that closes above yester-day’s high).
Two-day reversal highs and lowsThe following three rules were used todefine two-day reversal highs in SPY:
1. The current high is higher than the highs of the past five days.
2. SPY opens in the lower 40 percent of its daily range and closes
within the upper 60 percent. 3. The next day’s close is below the
current day’s open.
The rules are reversed for two-dayreversal lows: The current low is lowerthan the lows of the past five days, SPYmust open in the upper 60 percent of itsdaily range and close in the lower 40percent, and tomorrow’s close is abovetoday’s open.
We studied SPY’s daily price datafrom Jan. 29, 1993 to Sept. 13, 2006 andfound 50 reversal highs and 36 reversallows that met the criteria.
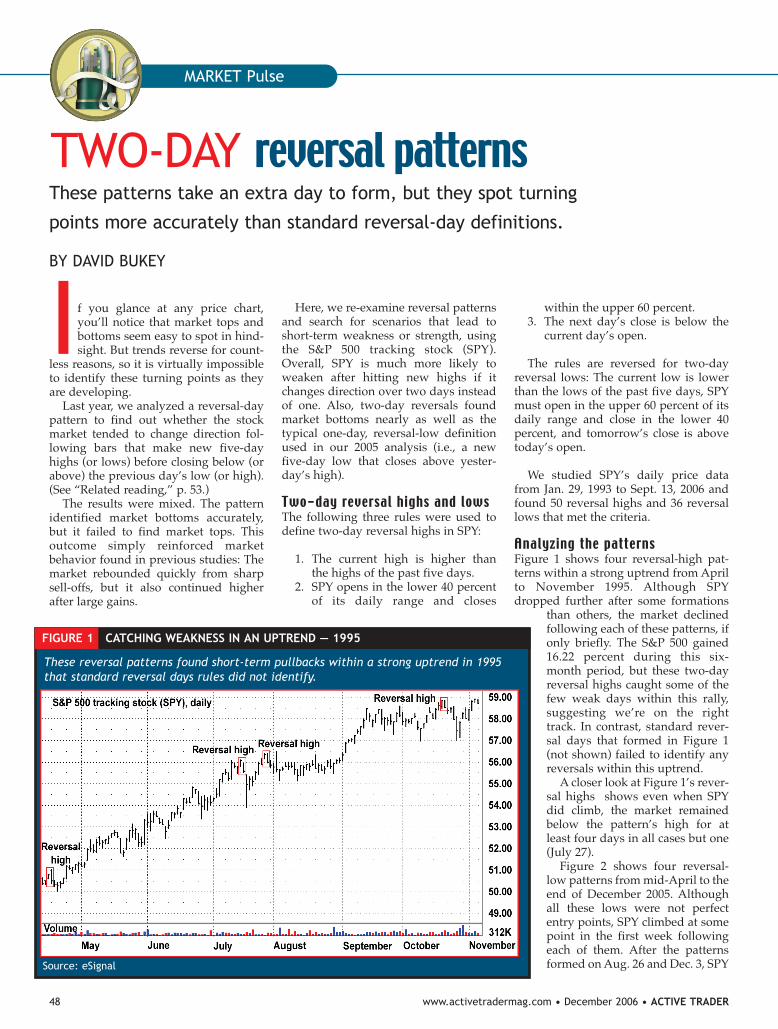
Analyzing the patternsFigure 1 shows four reversal-high pat-terns within a strong uptrend from Aprilto November 1995. Although SPYdropped further after some formations
than others, the market declinedfollowing each of these patterns, ifonly briefly. The S&P 500 gained16.22 percent during this six-month period, but these two-dayreversal highs caught some of thefew weak days within this rally,suggesting we’re on the righttrack. In contrast, standard rever-sal days that formed in Figure 1(not shown) failed to identify anyreversals within this uptrend.
A closer look at Figure 1’s rever-sal highs shows even when SPYdid climb, the market remainedbelow the pattern’s high for atleast four days in all cases but one(July 27).
Figure 2 shows four reversal-low patterns from mid-April to theend of December 2005. Althoughall these lows were not perfectentry points, SPY climbed at somepoint in the first week followingeach of them. After the patternsformed on Aug. 26 and Dec. 3, SPY
48 www.activetradermag.com • December 2006 • ACTIVE TRADER
These reversal patterns found short-term pullbacks within a strong uptrend in 1995that standard reversal days rules did not identify.
FIGURE 1 CATCHING WEAKNESS IN AN UPTREND — 1995
Source: eSignal
TWO-DAY reversal patternsThese patterns take an extra day to form, but they spot turning
points more accurately than standard reversal-day definitions.
MARKET Pulse
BY DAVID BUKEY

rallied at least 1.65 percent thenext week. While the market fellthe day after reversal lows onApril 20 and Aug. 8, it reboundedthe next day.
Some of Figure 2’s patterns pin-pointed more significant lows thanothers, but the market still tradedabove the pattern’s low in the fol-lowing week.
Figure 3 shows three reversalpatterns that formed in 2006. Themarket reacted differently after tworeversal lows that formed inFebruary. SPY traded sidewaysafter the Feb. 7 pattern before it ral-lied 1.41 percent toward the end ofthe first week. But the market failedto climb following the Feb. 27 pat-tern.
However, a reversal-high pat-tern formed between July 3 and 5and represented a critical short-term market high. While SPYclimbed slightly following the pat-tern’s end, it then plunged 3.25 percentby the second week. Again, the markettended to hold above the pattern’s lowor below its high during the first week.
Reversal highs found marketweaknessFigure 4 shows SPY’s average daily per-formance on each of the 10 days follow-ing reversal-high patterns and also com-pares the market’s average cumulativepost-pattern moves to its bench-mark, or typical same-lengthmove (the average of all one-day,two-day…10-day moves) since1993.
The market tended to drop inthe first week after reversal-highpatterns, which supports the priceaction shown in Figures 1 and 3.SPY fell an average 0.12 percenton the first day and another 0.25percent on the second day. By theend of the first week, the markethad dropped 0.57 percent. WhileSPY regained ground in the sec-ond week, it was still underwaterand well below its benchmark(0.36-percent gain) by the 10thday.
Table 1 lists the statistics behindreversal-high patterns and showsSPY’s daily average, median,maximum, minimum, and stan-dard deviation values. The tablealso shows each day’s percentageof gains (Pct. > 0) and measures
how often SPY exceeded the pattern’shigh by that point. Finally, Table 1 showsthe largest up moves (LUM) and largestdown moves (LDM) on each of the fol-lowing 10 days.
Overall, these statistics confirm themarket’s likely decline in the first fourdays following reversal-high patterns.Although the median losses are smallerthan their average counterparts duringthis period, both values still point in thesame direction. Also, the market fell at
least 52 percent of the time from days 1to 4, and its LDMs are larger than itsLUMs.
The table’s final row tracks how oftenSPY jumped above the pattern’s high byeach day’s end. This occurred only 10percent of the time on the first day,meaning SPY held below this level ninetimes out of 10. By the fifth day, the mar-ket still traded below the pattern’s high60 percent of the time.
ACTIVE TRADER • December 2006 • www.activetradermag.com 49
Although two-day reversal lows were not always perfect entry points in 2005, themarket did rally over the course of the week following these patterns.
FIGURE 2 FINDING MARKET LOWS — 2005
Source: eSignal
The market didn’t reverse direction after all these recent reversals, but it did jumpwithin a week of Feb. 8’s reversal low and sold off sharply after the July 3–7 reversal high.
FIGURE 3 TWO-DAY REVERSAL PATTERNS — 2006
Source: eSignal
continued on p. 50

Reversal lows precede bullishreboundsFigure 5 shows SPY’s average dailygains and losses in the two weeks fol-lowing reversal-low patterns. Despite itsinitial 0.15-percent drop, the marketclimbed at least 0.12 percent on each ofthe next five days — a total gain of 1.30percent. Although SPY slid toward theend of the second week, the S&P 500 stillposted a 0.83-percent total gain, whichdoubled its benchmark, or typical 10-dayperformance (0.36 percent).
Table 2 lists the daily statistics behindSPY’s post-reversal-low behavior andsupports the market’s initial weakness
and subsequent rebound shown in Figure5. The market’s first-day drop is fairlysolid: Average and median losses are sim-ilar, the LDM is larger than the LUM, andthe market gained ground just 33 percentof the time. However, SPY’s brief loss waslimited — it remained above the reversalpattern’s low 78 percent of the time.
The market’s week-long rally (days 2to 6) is also reliable. Overall, SPY’s dailyaverage and median gains are roughlyin-line, its intraday jumps are larger thanits intraday drops, and the market ralliedfrom 52 to 64 percent of the time. Finally,even when the market did fall duringthis period, it rarely crossed below the
pattern’s low. By the sixth day, SPY stilltraded above this level 56 percent of thetime.
But Table 2 contains a few discrepan-cies. For instance, SPY’s median gain onthe third day is much smaller than itsaverage (0.09 percent vs. 0.39 percent,respectively). Also, on the fifth day, themarket’s intraday gain is about the sameas its intraday loss, despite other signs ofbullishness.
Stronger reversal patterns, same resultsWe also analyzed how the market behavedfollowing reversal patterns that metstricter requirements. For example, weconsidered scenarios in which SPY hit 10-day highs (or lows) — instead of mere five-day extremes — before reversing direc-tion. Here, the market’s behavior resem-bled its reaction to the five-day reversalpatterns shown in Figures 4 and 5.
We also gauged SPY’s response toreversal highs that reached five-dayhighs before reversing below its low(instead of its open) by the next day’sclose. Again, the rules are reversed forreversal lows, so the next day’s close isabove the current day’s high (not itsopen).
The market tended to drop further onthe second day after strict reversal highsand jump slightly higher following strictreversal lows. But there were no strikingdifferences in SPY’s behavior with these
50 www.activetradermag.com • December 2006 • ACTIVE TRADER
The market fell an average of 0.57 percent in the week after reversal-highpatterns.
FIGURE 4 TWO-DAY REVERSAL HIGHS
These statistics suggest the market tends to be weak following two-day reversal highs. The market dropped more often than itrallied, and in the first week SPY remained below the pattern’s high 60 percent of the time.
TABLE 1 REVERSAL HIGH STATS
50 instances Day 1 LUM LDM Day 2 LUM LDM Day 3 LUM LDM Day 4 LUM LDM Day 5 LUM LDMAvg: -0.12% 0.57% -0.82% -0.25% 0.57% -0.91% -0.01% 0.68% -0.72% -0.15% 0.61% -0.80% -0.03% 0.58% -0.75%Med: -0.04% 0.51% -0.54% -0.15% 0.39% -0.79% -0.03% 0.57% -0.55% -0.07% 0.54% -0.50% 0.08% 0.38% -0.58%Max: 1.99% 3.18% 0.00% 2.23% 2.23% 0.00% 2.92% 2.92% 0.00% 2.04% 2.04% 0.00% 1.46% 1.55% 0.00%Min: -2.34% 0.00% -4.96% -2.89% 0.00% -3.26% -2.28% 0.00% -2.51% -3.34% 0.00% -3.63% -1.94% 0.00% -2.59%Standard deviation: 0.91% 1.09% 0.98% 1.04% 0.84%Pct. > 0: 48% 44% 44% 42% 52%Cumulative percent of up moves that exceed pattern high: 10% 18% 30% 34% 40%
Day 6 LUM LDM Day 7 LUM LDM Day 8 LUM LDM Day 9 LUM LDM Day 10 LUM LDMAvg: 0.05% 0.81% -0.64% 0.08% 0.68% -0.64% -0.13% 0.63% -0.75% 0.23% 0.75% -0.67% 0.08% 0.63% -0.66%Med: 0.13% 0.65% -0.33% 0.00% 0.55% -0.44% -0.06% 0.49% -0.46% 0.14% 0.54% -0.62% 0.11% 0.34% -0.39%Max: 3.79% 4.19% 0.00% 2.33% 2.79% 0.00% 4.67% 5.03% 0.00% 2.71% 2.79% 0.00% 2.37% 2.51% 0.00%Min: -3.81% 0.00% -3.96% -2.89% 0.00% -3.26% -3.12% 0.00% -3.36% -2.12% 0.00% -2.91% -1.98% 0.00% -2.80%Standard deviation: 1.28% 1.00% 1.14% 1.03% 0.91%Pct. > 0: 58% 48% 38% 56% 56%Cumulative percent of up moves that exceed pattern high: 48% 52% 52% 52% 58%

changes, which suggests these patternsidentify turning points reliably.
Better late than neverWhile these patterns caught short-termreversals effectively, they share onedrawback: SPY already reverses direc-tion as the pattern forms, so you won’tcatch the entire move.
During Figure 2’s first reversal low onApril 20, SPY jumped 1.96 percent as thattwo-day pattern formed. After the pat-tern was confirmed on April 21, much ofthe rebound had already occurred, andthe market sold off the next day.
Reversal highs are also vulnerable tothis problem. Figure 1’s first reversal
high on April 13 shows SPY sold off 0.58percent as this pattern formed on April17, 1995, which represented more thanhalf its total decline over the next coupleof days.
Despite these caveats, the market didbehave as expected. Not only did SPYfall an average 0.57 percent in the firstweek after two-day reversal highs, but itoften held below the pattern’s high evenif it continued to climb. Similarly, SPYrallied 1.30 percent from days 2 to 6 fol-lowing two-day reversal lows, and itrarely dropped below that pattern’s loweven if the market continued to fall.Also, additional analysis underscoresthe accuracy of these moves.�
ACTIVE TRADER • December 2006 • www.activetradermag.com 51
The market fell slightly on the first day after reversal low patterns, but itjumped an average of 1.30 percent from the second to the sixth day.
FIGURE 5 TWO-DAY REVERSAL LOWS
These statistics support the market’s rebound following reversal lows, especially from days 2 to 5. Even if the market didn’trally during this period, it held above the pattern’s low 58 percent of the time.
TABLE 2 REVERSAL LOW NUMBERS
36 instances Day 1 LUM LDM Day 2 LUM LDM Day 3 LUM LDM Day 4 LUM LDM Day 5 LUM LDMAvg: -0.15% 0.67% -0.96% 0.17% 0.85% -0.68% 0.37% 0.94% -0.67% 0.49% 1.05% -0.57% 0.12% 0.73% -0.59%Med: -0.19% 0.43% -0.77% 0.20% 0.66% -0.46% 0.09% 0.53% -0.48% 0.33% 0.69% -0.20% 0.16% 0.63% -0.46%Max: 4.38% 5.08% 0.00% 3.23% 3.41% 0.00% 4.87% 5.54% 0.00% 3.75% 3.88% 0.00% 1.99% 3.18% 0.00%Min: -2.68% 0.00% -3.68% -2.49% 0.00% -2.74% -1.05% 0.00% -3.76% -2.42% 0.00% -3.13% -1.82% 0.00% -2.17%Standard deviation: 1.20% 1.19% 1.35% 1.27% 0.84%Pct. > 0: 33.33% 63.89% 52.78% 63.89% 55.56%Cumulative percent of down moves that drop below pattern low: 22.22% 27.78% 36.11% 38.89% 41.67%
Day 6 LUM LDM Day 7 LUM LDM Day 8 LUM LDM Day 9 LUM LDM Day 10 LUM LDMAvg: 0.15% 0.77% -0.78% -0.16% 0.64% -0.80% -0.27% 0.56% -0.94% 0.33% 0.91% -0.64% -0.22% 0.71% -0.88%Med: 0.29% 0.54% -0.61% -0.20% 0.36% -0.43% -0.11% 0.43% -0.50% 0.31% 0.79% -0.34% -0.09% 0.40% -0.65%Max: 3.65% 4.11% 0.00% 3.28% 3.68% 0.00% 1.61% 2.44% 0.00% 3.37% 4.93% 0.00% 1.90% 4.09% 0.00%Min: -2.61% 0.00% -3.10% -2.76% 0.00% -3.56% -3.48% 0.00% -4.96% -3.14% 0.00% -3.35% -2.17% 0.00% -3.08%Standard deviation: 1.22% 1.29% 0.95% 1.17% 1.03%Pct. > 0: 61.11% 38.89% 44.44% 63.89% 47.22%Cumulative percent of down moves that drop below pattern low: 44.44% 50.00% 52.78% 52.78% 55.56%
Related reading “Follow-through or fake-out: Testing20-day highs and lows” Active Trader, April 2006.Should you trade or fade 20-day pricebreakouts? Many traders monitor 20-day breakouts, but these events aren’tnecessarily trade signals. This analysisinvestigates helpful breakout patternsin the S&P 500 tracking stock (SPY)since 1993.
“Can reversal days catch marketturning points?”Active Trader, October 2005.So-called “reversal days” are fairlycommon one-day patterns, but theyare prone to producing false signals.How well have reversal highs and lowspinpointed tops and bottoms in theS&P 500 tracking stock (SPY) over thepast 12 years?
“Spikes and spiders” Active Trader, August 2005.Price spikes are one of the few chartpatterns that are easy to both identifyand analyze. This in-depth look at mar-ket behavior following spike highs andlows uncovers a few surprising tradeopportunities.
The articles listed above are also partof the following article collection:
“Market Pulse collection, Vol. I”This compilation of 12 Market Pulsearticles from 2005 and 2006 is avail-able at a discount to the price of pur-chasing the individual articles. Visit theActive Trader Store for more details.
You can purchase and download past arti-cles at www.activetradermag.com/pur-chase_articles.htm.

Article copyright 2011 by Active Trader Magazine. Reprinted from the December 2006 issue with permission from Active Trader Magazine.
The statements and opinions expressed in this article are those of the author. Fidelity Investments cannot guarantee the accuracy or completeness of any statements or data.
601827.3.0