MARKET PULSE QUARTER 3, 2015 - Worldwide | Nielsen · Vietnam Asia Pacific OOH Consumer Confidence...
19
Prepared by Nielsen November 2015 MARKET PULSE QUARTER 3, 2015
-
Upload
hoangxuyen -
Category
Documents
-
view
212 -
download
0
Transcript of MARKET PULSE QUARTER 3, 2015 - Worldwide | Nielsen · Vietnam Asia Pacific OOH Consumer Confidence...

Prepared by Nielsen November 2015
MARKET PULSE QUARTER 3, 2015
Co
pyr
igh
t ©
2012
Th
e N
iels
en C
om
pan
y. C
on
fid
enti
al a
nd
pro
pri
etar
y.
2
55% 51%
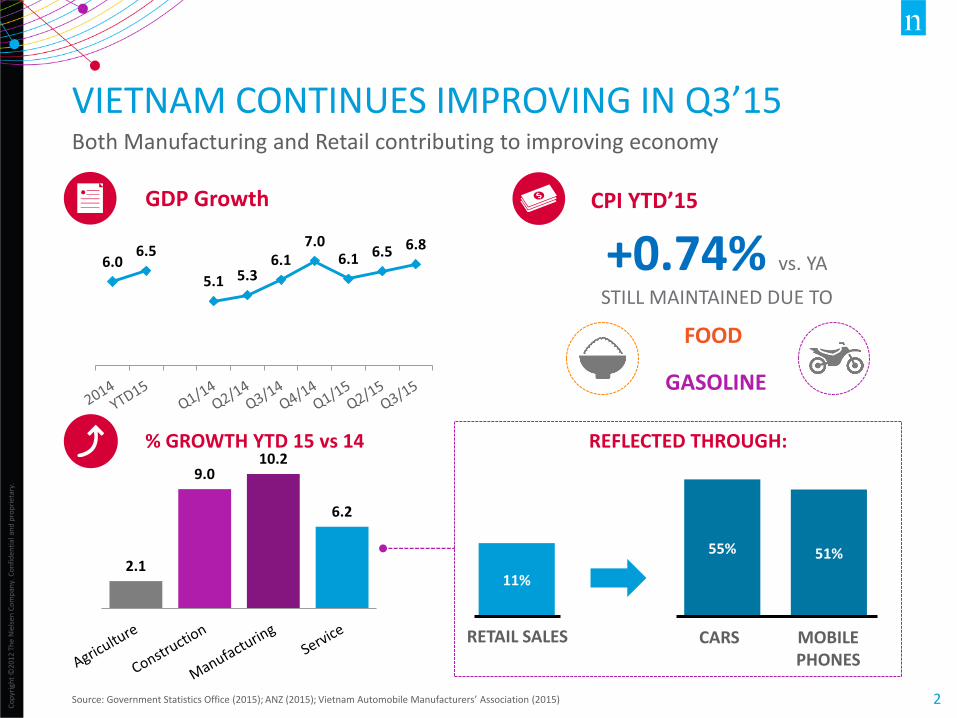
VIETNAM CONTINUES IMPROVING IN Q3’15 Both Manufacturing and Retail contributing to improving economy
Source: Government Statistics Office (2015); ANZ (2015); Vietnam Automobile Manufacturers’ Association (2015)
6.0 6.5
5.1 5.3 6.1
7.0 6.1 6.5 6.8
GDP Growth
+0.74% vs. YA
STILL MAINTAINED DUE TO
CPI YTD’15
FOOD
GASOLINE
RETAIL SALES
11%
CARS
% GROWTH YTD 15 vs 14
2.1
9.0 10.2
6.2
MOBILE PHONES
REFLECTED THROUGH:
Co
pyr
igh
t ©
2012
Th
e N
iels
en C
om
pan
y. C
on
fid
enti
al a
nd
pro
pri
etar
y.
3
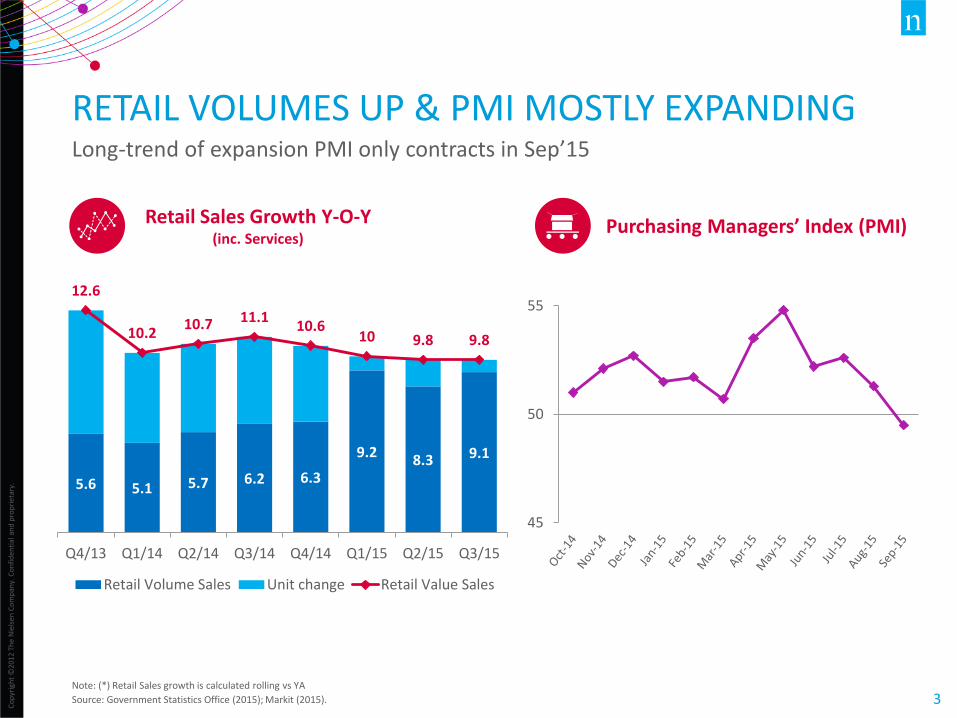
RETAIL VOLUMES UP & PMI MOSTLY EXPANDING Long-trend of expansion PMI only contracts in Sep’15
Note: (*) Retail Sales growth is calculated rolling vs YA
Source: Government Statistics Office (2015); Markit (2015).
45
50
55
Purchasing Managers’ Index (PMI) Retail Sales Growth Y-O-Y (inc. Services)
5.6 5.1 5.7 6.2 6.3
9.2 8.3 9.1
12.6
10.2 10.7 11.1
10.6 10 9.8 9.8
Q4/13 Q1/14 Q2/14 Q3/14 Q4/14 Q1/15 Q2/15 Q3/15
Retail Volume Sales Unit change Retail Value Sales
Co
pyr
igh
t ©
2012
Th
e N
iels
en C
om
pan
y. C
on
fid
enti
al a
nd
pro
pri
etar
y.
4
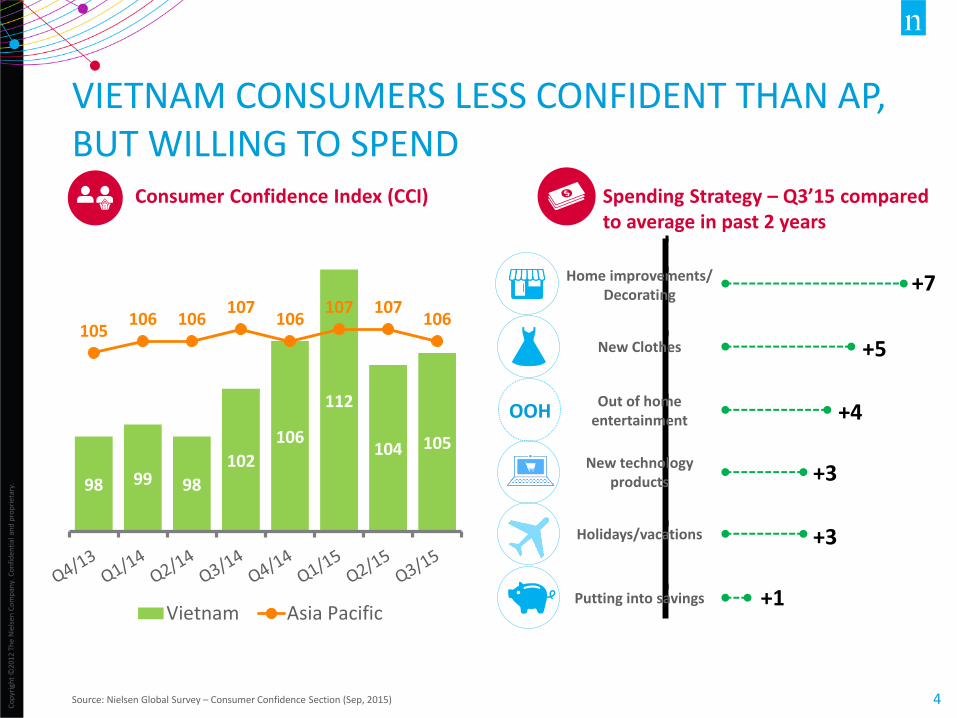
Putting into savings
Holidays/vacations
New technology products
Out of home entertainment
New clothes
Homeimprovements/decorating
Chg in Q3 vs Avg
+7
+5
+4
+3
+3
+1
VIETNAM CONSUMERS LESS CONFIDENT THAN AP, BUT WILLING TO SPEND
Source: Nielsen Global Survey – Consumer Confidence Section (Sep, 2015)
98 99 98
102
106
112
104 105
105 106 106
107 106
107 107 106
Vietnam Asia Pacific
OOH
Consumer Confidence Index (CCI) Spending Strategy – Q3’15 compared to average in past 2 years
Home improvements/ Decorating
New Clothes
Out of home entertainment
New technology products
Holidays/vacations
Putting into savings
Co
pyr
igh
t ©
2012
Th
e N
iels
en C
om
pan
y. C
on
fid
enti
al a
nd
pro
pri
etar
y.
5
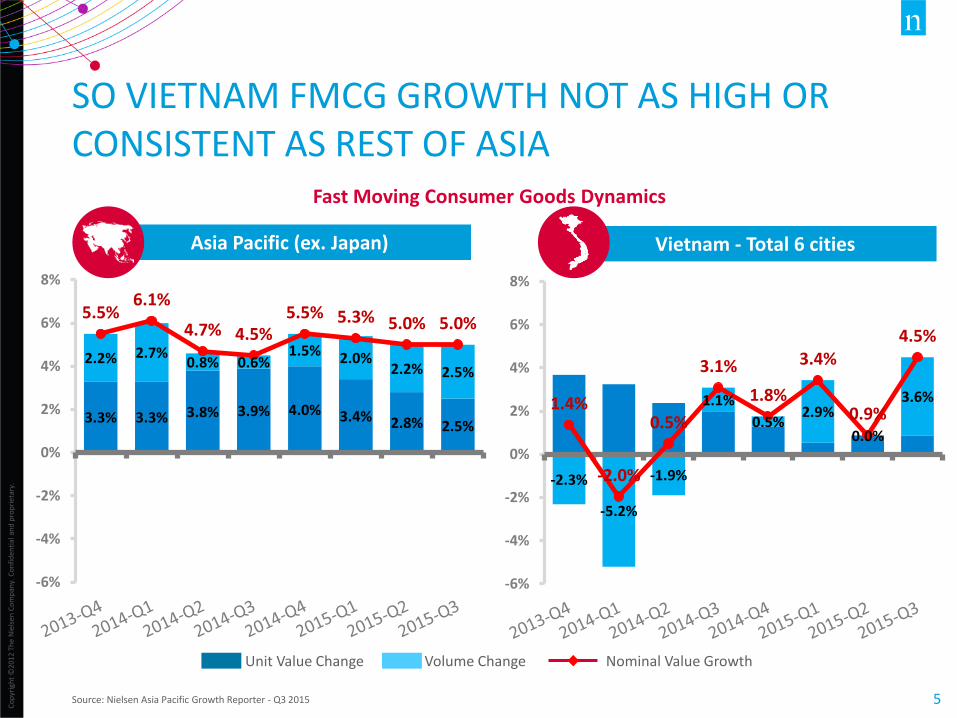
SO VIETNAM FMCG GROWTH NOT AS HIGH OR CONSISTENT AS REST OF ASIA
Source: Nielsen Asia Pacific Growth Reporter - Q3 2015
-2.3%
-5.2%
-1.9%
1.1%
0.5% 2.9%
0.0%
3.6% 1.4%
-2.0%
0.5%
3.1%
1.8%
3.4%
0.9%
4.5%
-6%
-4%
-2%
0%
2%
4%
6%
8%
Vietnam - Total 6 cities
3.3% 3.3% 3.8% 3.9% 4.0% 3.4% 2.8% 2.5%
2.2% 2.7% 0.8% 0.6%
1.5% 2.0% 2.2% 2.5%
5.5% 6.1%
4.7% 4.5% 5.5% 5.3% 5.0% 5.0%
-6%
-4%
-2%
0%
2%
4%
6%
8%
Fast Moving Consumer Goods Dynamics
Asia Pacific (ex. Japan)
Unit Value Change Volume Change Nominal Value Growth
Co
pyr
igh
t ©
2012
Th
e N
iels
en C
om
pan
y. C
on
fid
enti
al a
nd
pro
pri
etar
y.
7
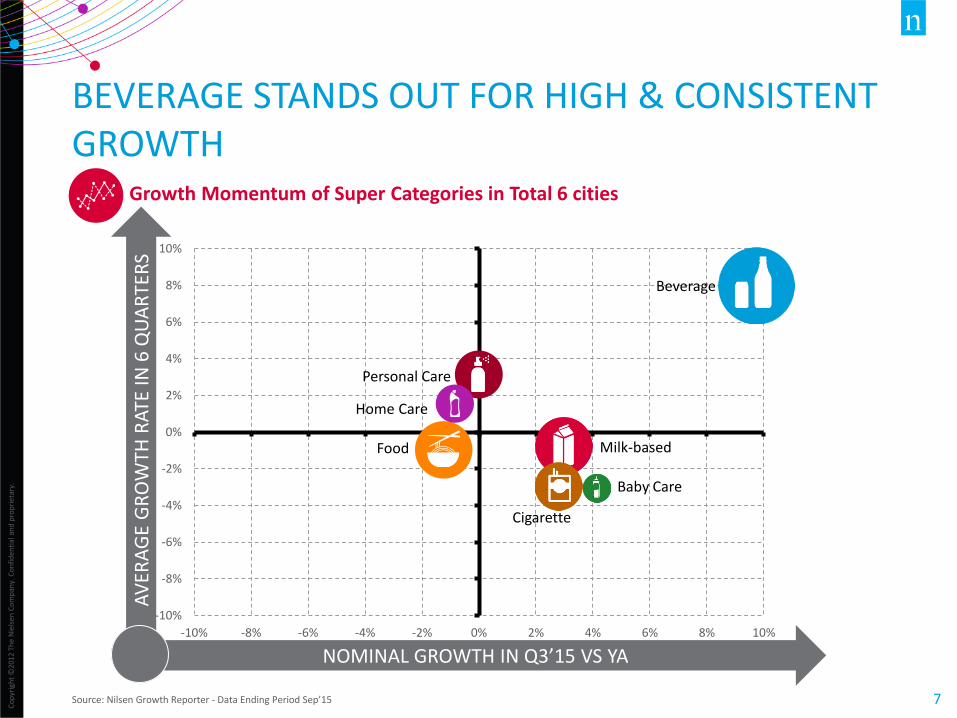
BEVERAGE STANDS OUT FOR HIGH & CONSISTENT GROWTH
Source: Nilsen Growth Reporter - Data Ending Period Sep’15
-10%
-8%
-6%
-4%
-2%
0%
2%
4%
6%
8%
10%
-10% -8% -6% -4% -2% 0% 2% 4% 6% 8% 10%
Beverage
Personal Care
Home Care
Food
Cigarette
Milk-based
Baby Care
Growth Momentum of Super Categories in Total 6 cities
NOMINAL GROWTH IN Q3’15 VS YA
AV
ERA
GE
GR
OW
TH R
ATE
IN 6
QU
AR
TER
S
Co
pyr
igh
t ©
2012
Th
e N
iels
en C
om
pan
y. C
on
fid
enti
al a
nd
pro
pri
etar
y.
8
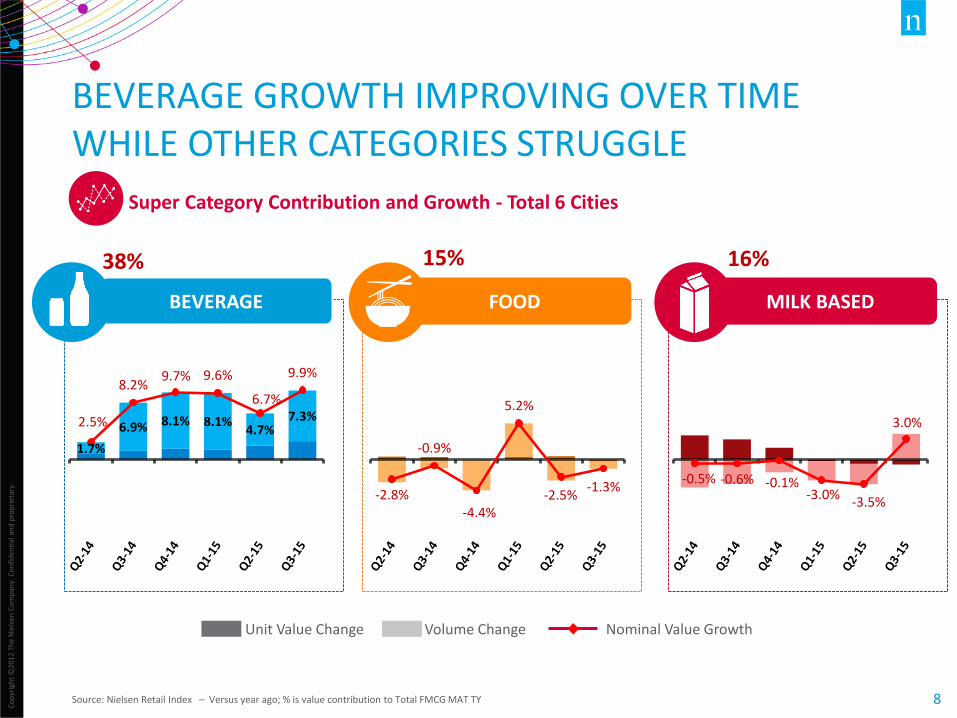
Super Category Contribution and Growth - Total 6 Cities
BEVERAGE GROWTH IMPROVING OVER TIME WHILE OTHER CATEGORIES STRUGGLE
Source: Nielsen Retail Index – Versus year ago; % is value contribution to Total FMCG MAT TY
-2.8%
-0.9%
-4.4%
5.2%
-2.5% -1.3%
1.7%
6.9% 8.1% 8.1% 4.7%
7.3% 2.5%
8.2% 9.7% 9.6%
6.7%
9.9%
-0.5% -0.6% -0.1% -3.0%
-3.5%
3.0%
BEVERAGE FOOD MILK BASED
38% 15% 16%
Unit Value Change Volume Change Nominal Value Growth

Co
pyr
igh
t ©
2012
Th
e N
iels
en C
om
pan
y. C
on
fid
enti
al a
nd
pro
pri
etar
y.
9
MOST CATEGORIES STRUGGLING DESPITE SHORT-TERM IMPROVEMENT
Source: Nielsen Retail Index – Versus year ago; % is value contribution to Total FMCG MAT TY
3.0% 4.5%
-0.6%
3.4%
-0.3%
-0.8% 0.8%
5.6% 3.9%
7.1%
2.1%
-0.1% -2.2%
-2.8%
-5.2%
-4.8%
-4.0%
2.8% 4.3%
0.6%
-10.8%
-11.2%
-5.9%
4.0%
HOME CARE PERSONAL CARE CIGARETTE BABY CARE
6% 9% 13% 4%
Super Category Contribution and Growth - Total 6 Cities
Unit Value Change Volume Change Nominal Value Growth
TRENDS FOR CONSISTENT GROWTH
Co
pyr
igh
t ©
2012
Th
e N
iels
en C
om
pan
y. C
on
fid
enti
al a
nd
pro
pri
etar
y.
11
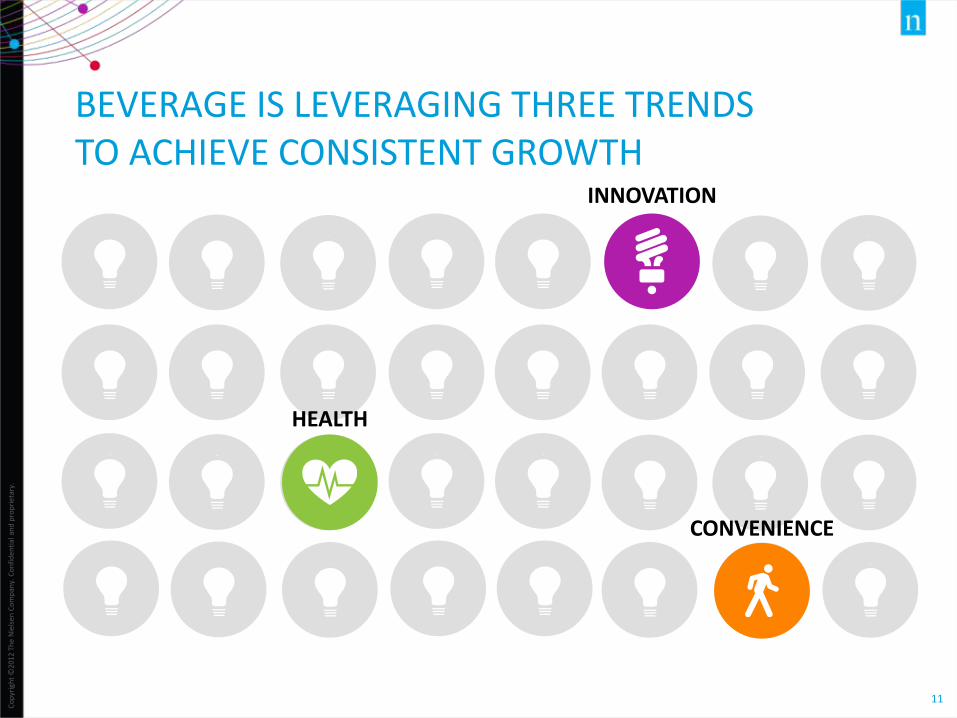
INNOVATION
HEALTH
CONVENIENCE
BEVERAGE IS LEVERAGING THREE TRENDS TO ACHIEVE CONSISTENT GROWTH
Co
pyr
igh
t ©
2012
Th
e N
iels
en C
om
pan
y. C
on
fid
enti
al a
nd
pro
pri
etar
y.
12
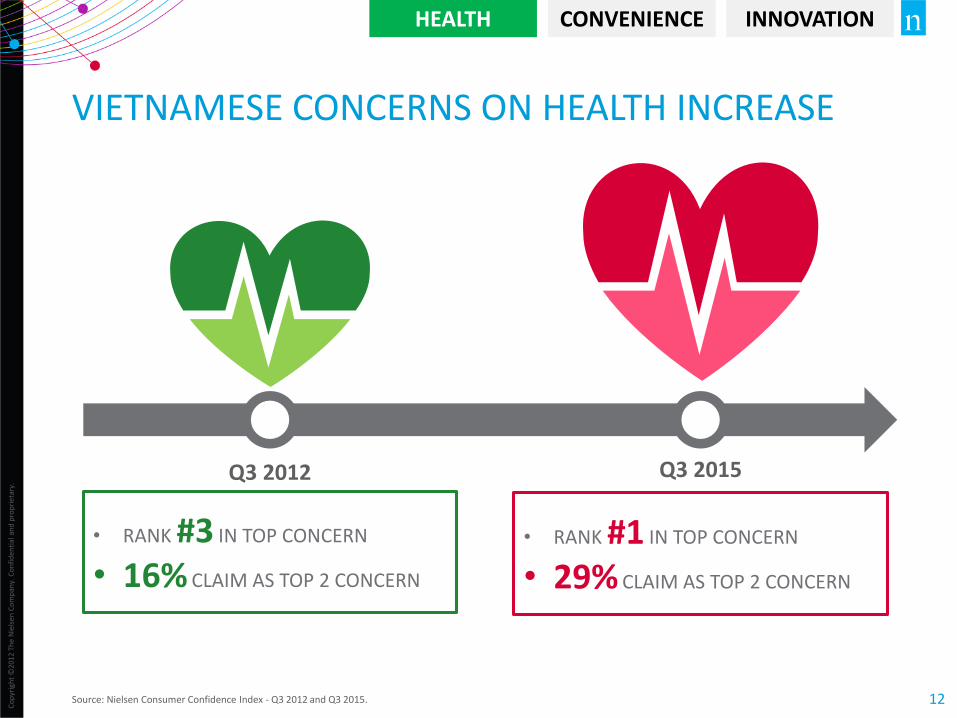
VIETNAMESE CONCERNS ON HEALTH INCREASE
Source: Nielsen Consumer Confidence Index - Q3 2012 and Q3 2015.
Q3 2012 Q3 2015
• RANK #3 IN TOP CONCERN
• 16% CLAIM AS TOP 2 CONCERN
• RANK #1 IN TOP CONCERN
• 29% CLAIM AS TOP 2 CONCERN
HEALTH CONVENIENCE INNOVATION
Co
pyr
igh
t ©
2012
Th
e N
iels
en C
om
pan
y. C
on
fid
enti
al a
nd
pro
pri
etar
y.
13
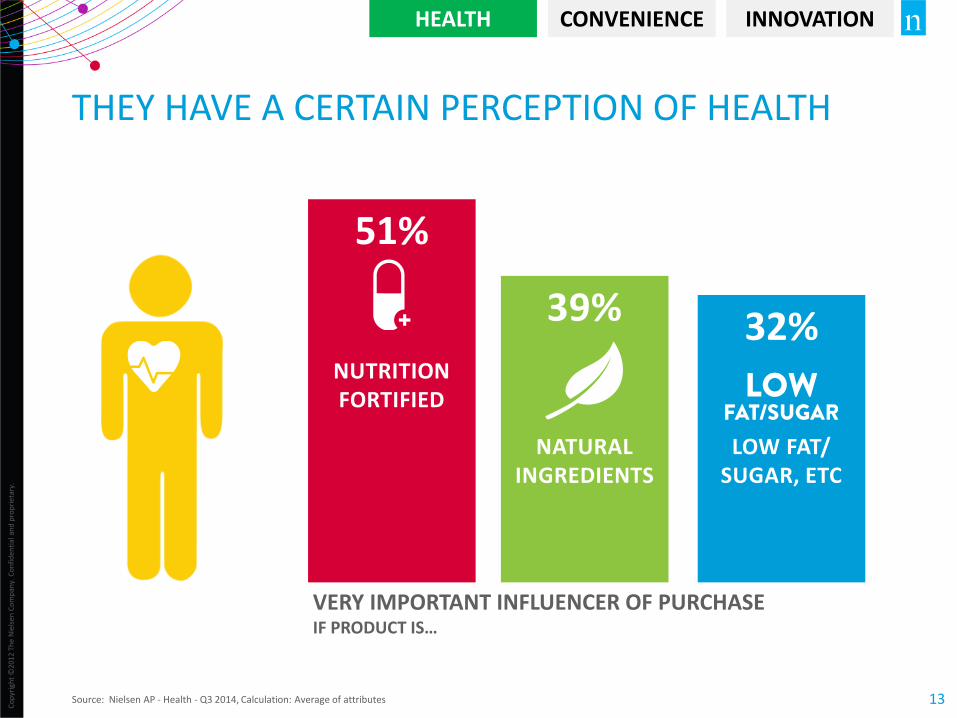
THEY HAVE A CERTAIN PERCEPTION OF HEALTH
Source: Nielsen AP - Health - Q3 2014, Calculation: Average of attributes
39%
51%
NUTRITION FORTIFIED
32%
HEALTH CONVENIENCE INNOVATION
NATURAL INGREDIENTS
LOW FAT/ SUGAR, ETC
VERY IMPORTANT INFLUENCER OF PURCHASE IF PRODUCT IS…
Co
pyr
igh
t ©
2012
Th
e N
iels
en C
om
pan
y. C
on
fid
enti
al a
nd
pro
pri
etar
y.
15
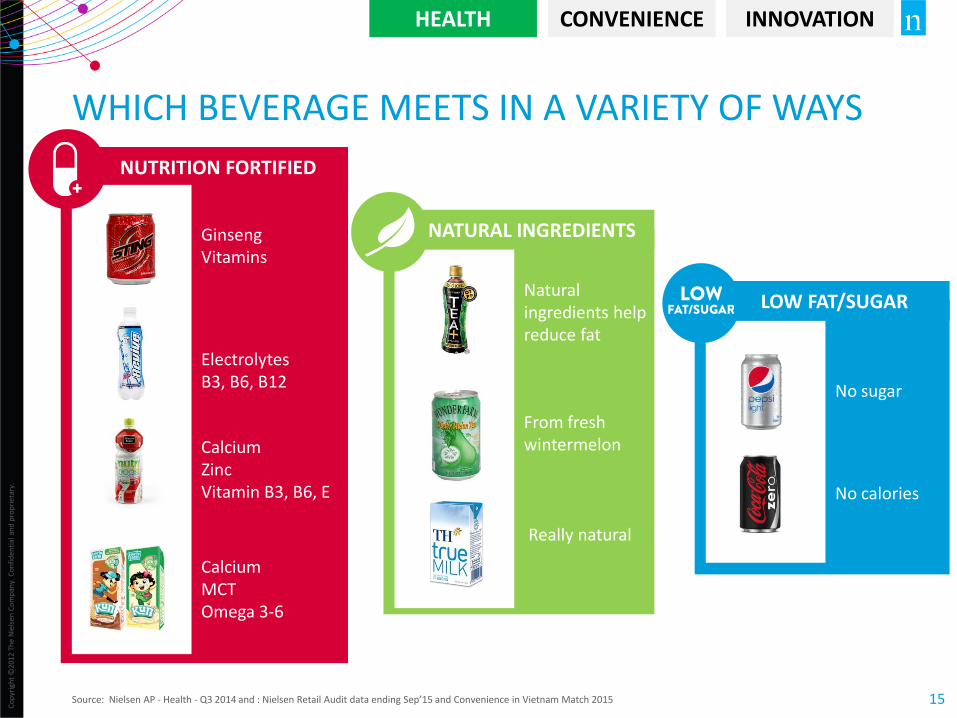
WHICH BEVERAGE MEETS IN A VARIETY OF WAYS
Source: Nielsen AP - Health - Q3 2014 and : Nielsen Retail Audit data ending Sep’15 and Convenience in Vietnam Match 2015
NUTRITION FORTIFIED
HEALTH CONVENIENCE INNOVATION
Ginseng Vitamins
Electrolytes B3, B6, B12
Calcium Zinc Vitamin B3, B6, E
Calcium MCT Omega 3-6
NATURAL INGREDIENTS
Natural ingredients help reduce fat
From fresh wintermelon
Really natural
LOW FAT/SUGAR
No sugar
No calories
Co
pyr
igh
t ©
2012
Th
e N
iels
en C
om
pan
y. C
on
fid
enti
al a
nd
pro
pri
etar
y.
16
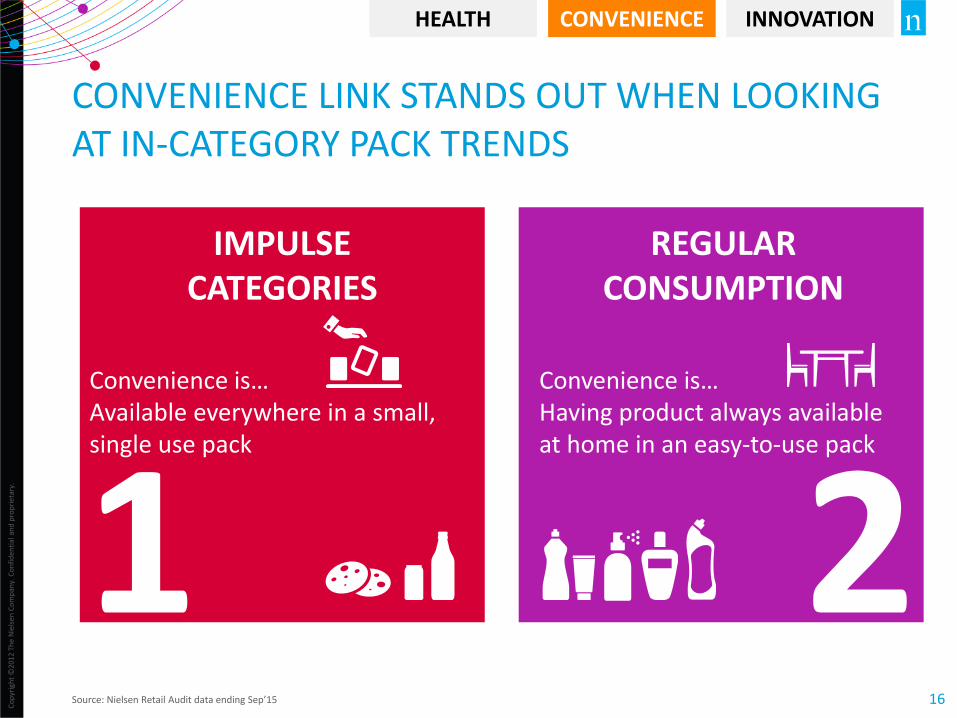
CONVENIENCE LINK STANDS OUT WHEN LOOKING AT IN-CATEGORY PACK TRENDS
Source: Nielsen Retail Audit data ending Sep’15
IMPULSE CATEGORIES
REGULAR CONSUMPTION
Convenience is… Having product always available at home in an easy-to-use pack
2
HEALTH CONVENIENCE INNOVATION
1 Convenience is… Available everywhere in a small, single use pack
Co
pyr
igh
t ©
2012
Th
e N
iels
en C
om
pan
y. C
on
fid
enti
al a
nd
pro
pri
etar
y.
17
FOOD
BEVERAGE
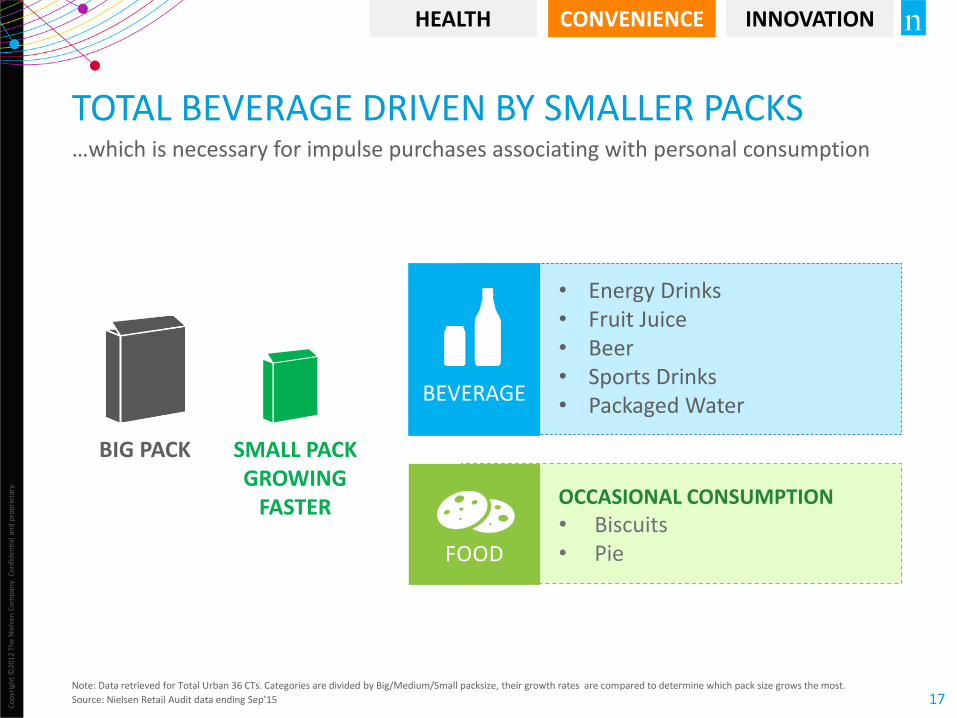
TOTAL BEVERAGE DRIVEN BY SMALLER PACKS …which is necessary for impulse purchases associating with personal consumption
Note: Data retrieved for Total Urban 36 CTs. Categories are divided by Big/Medium/Small packsize, their growth rates are compared to determine which pack size grows the most.
Source: Nielsen Retail Audit data ending Sep’15
• Energy Drinks • Fruit Juice • Beer • Sports Drinks • Packaged Water
OCCASIONAL CONSUMPTION • Biscuits • Pie
BIG PACK SMALL PACK GROWING
FASTER
HEALTH CONVENIENCE INNOVATION
Co
pyr
igh
t ©
2012
Th
e N
iels
en C
om
pan
y. C
on
fid
enti
al a
nd
pro
pri
etar
y.
18
HOME CARE
FOOD
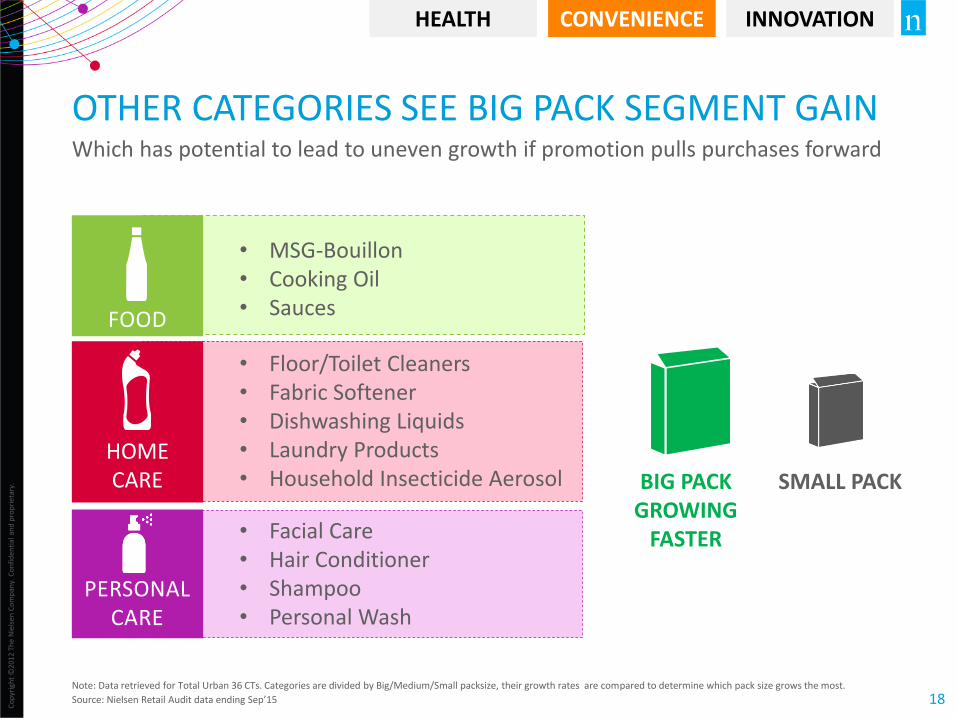
OTHER CATEGORIES SEE BIG PACK SEGMENT GAIN Which has potential to lead to uneven growth if promotion pulls purchases forward
Note: Data retrieved for Total Urban 36 CTs. Categories are divided by Big/Medium/Small packsize, their growth rates are compared to determine which pack size grows the most.
Source: Nielsen Retail Audit data ending Sep’15
• Floor/Toilet Cleaners • Fabric Softener • Dishwashing Liquids • Laundry Products • Household Insecticide Aerosol
• Facial Care • Hair Conditioner • Shampoo • Personal Wash
PERSONAL CARE
HEALTH CONVENIENCE INNOVATION
• MSG-Bouillon • Cooking Oil • Sauces
BIG PACK GROWING
FASTER
SMALL PACK
Co
pyr
igh
t ©
2012
Th
e N
iels
en C
om
pan
y. C
on
fid
enti
al a
nd
pro
pri
etar
y.
19
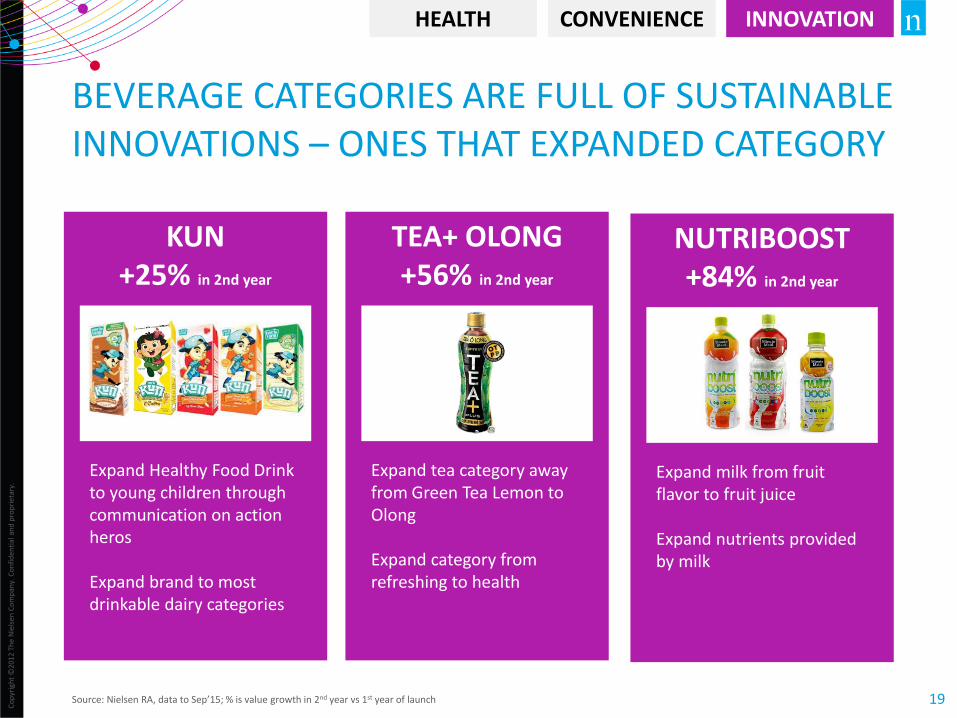
NUTRIBOOST +84% in 2nd year
Expand milk from fruit flavor to fruit juice Expand nutrients provided by milk
KUN +25% in 2nd year
BEVERAGE CATEGORIES ARE FULL OF SUSTAINABLE INNOVATIONS – ONES THAT EXPANDED CATEGORY
Source: Nielsen RA, data to Sep’15; % is value growth in 2nd year vs 1st year of launch
HEALTH CONVENIENCE INNOVATION
Expand Healthy Food Drink to young children through communication on action heros Expand brand to most drinkable dairy categories
TEA+ OLONG +56% in 2nd year
Expand tea category away from Green Tea Lemon to Olong Expand category from refreshing to health

Co
pyr
igh
t ©
2012
Th
e N
iels
en C
om
pan
y. C
on
fid
enti
al a
nd
pro
pri
etar
y.
20
KEY TAKEAWAYS - Q3 2015
POSITIVE GROWTH BUT STILL VOLATILE
AND 0.74% 6.5%
GDP GROWTH YTD SEP15 VS YA
CPI VS YA LOW INFLATION
MANUFACTURING
+10.2% EXPORTS DRIVING
ECONOMY
TREND FOR CONSISTENT GROWTH
FMCG GROWTH
+4.5% HIGHEST GROWTH RATE IN THE LAST 8
QUARTERS
CCI 105 GOOD, BUT LAGGING REST OF ASIA
FMCG GROWTH RATE IMPROVING BUT STILL SEEKING SUSTAINABLE GROWTH
BEVERAGE CATEGORIES THE ONLY ONES ABLE TO SUSTAIN GROWTH
HEALTH INNOVATION CONVENIENCE
• NUTRITION FORTIFIED • NATURAL INGREDIENT • LOW FAT/SUGAR
SUSTAINABLE INNOVATION
• GO SMALL FOR OCCASIONAL PURPOSE
• GO BIG FOR REGULAR CONSUMPTION PURPOSE

THANK YOU