Market probe fopl presentation 2015-05-09_-_v7_-_animated
33
Prepared for: Federation of Ontario Public Libraries Research Task Force May, 2015 FEDERATION OF ONTARIO PUBLIC LIBRARIES RESEARCH
-
Upload
stephen-abram -
Category
Documents
-
view
517 -
download
1
Transcript of Market probe fopl presentation 2015-05-09_-_v7_-_animated

Prepared for: Federation of Ontario Public Libraries Research Task
Force
May, 2015
FEDERATION OF ONTARIO PUBLIC
LIBRARIES RESEARCH

Market Probe 2
Topics
Background
Library Usage
Accessing the Library
Library Services
Value of the Public Library
Future Outlook
Conclusions

Market Probe 3
2015 Survey: Connecting to the past with a view to the future…
• Fourth wave of a study that has been conducted every five years since 2000
• Objectives:
– Understand Ontario residents’ opinions about the use, role and impact of public
libraries, and how those opinions have changed over time
– Separate public opinion by level of usage of public libraries (including non-use)
– Identify areas of strength and weakness for the public library
• Results will be used to:
– Monitor status of the library
– Formulate strategy
– Identify priorities
– Provide input to a new marketing communication plan

Market Probe 4
…through the use of a dual telephone / online survey method
• Significant differences exist between phone and web
respondents
• Also differences in the way people respond to questions
based on methodology
– Multiple response questions
– Rating scale questions
– Social desirability bias
Both surveys made available in
English and French
Telephone Survey
• 600 telephone interviews
conducted from February 26th to
March 16th, 2015
Online Survey
• 1,102 online surveys conducted
from March 5th to March 10th,
2015 using Delvinia’s
AskingCanadians online panel
Age and gender controlled by quotas
Phone Web
Households with children 40% 22%
Graduated college/university 55% 70%
Live in Metro TO / Urban GTA 39% 52%
Born outside Canada 19% 24%

Market Probe 5
Most Ontarians read books, and still primarily in hard copy format
86%
27%
28%
31%
16+ books read
6 to 15 books read
1 to 5 books read
Any Books Read in
Past 12 Months 17%
66%
18%
Most likely to have read no books:
• High school or less education 26%
• <$35K household income 23%
• Singles 20%
• Men 19%
Mostly in electronic
format
Mostly in hard copy
Both equally
Books Read in the Past Year Format of Books Read in the Past Year
Age 18-34: 18%
Age 55+: 38%

Market Probe 6
Bookstore usage has remained steady, with a substantial portion of traffic
swinging to online visits
12%
18%
51%
19%
14%
14%
41%
31%
More than 10 times
6 to 10 times
1 to 5 times
None
In-Person
Online
22%
47%
31%
Online more
About the same
In-person more
Past Year Bookstore Visit
Frequency
26%
21%
37%
17%
25%
21%
38%
16%
27%
22%
34%
16%
34%
22%
31%
12%
More than 10 times
6 to 10 times
1 to 5 times
None
2015
2010
2005
2000
Past Year Bookstore Visit
Frequency
Relative Frequency of Visiting
Bookstore Online and In-Person

Market Probe 7
87%
83%
44%
42%
41%
23%
17%
88%
83%
50%
23%
26%
21%
2015
2010
While Internet penetration has not changed in the last five years, the ways
in which people access the Internet have shifted
Higher among
web panelists
99%
86%
84%
73%
56%
33%
24%
23%
6%
Any Internet
Access
At home
At work
At other places in
the community
using a smartphone
At other places in
the community
using wireless
access
At your public
library
At school
Regular Use of
Internet
Search for specific
information of
interest
Use e-mail, a chat
room or IM
Access the news
Access social
networking sites
Stream movies,
music or other types
of entertainment
Download movies,
music or other types
of entertainment
Download books or
magazines
Create content
Ways Internet Was Accessed in the
Past Year Uses of Internet

Market Probe 8
Respondent Only27%
With Others in Household
42%
Other Household Member(s)
Only7%
No One24% Respondent
Only28%
With Others in Household
41%
Other Household Member(s)
Only10%
No One21%
73%
68%
65%
65%
Yes
2015 2010 2005 2000
Household use of the public library may be slipping slightly, despite a
reported increase in library card ownership
Total Household Usage of the Public Library
2015 2010
49%
26%
22%
8%
50%
31%
23%
8%
47%
27%
19%
7%
51%
24%
17%
9%
Children
Spouse/partner
Others
2015
2010
2005
2000
In Household
Used by Others
(net)
19% among
web panelists
27% among
web panelistsTotal Users
70%
Total Users
69%
Past Year Use of Public Library
by Other Household Members
68% among
web panelists
3% among
web panelists
Have a Library Card

Market Probe 9
For most Ontarians, the public library is located close to home and tends
to be an inviting place
Distance from Home
to Closest Library
70%
20%
5%
1%
4%
5 kilometres or less
6 to 10 kilometres
11 to 20 kilometres
More than 20kilometres
Don’t know
Condition of Library
Closest to Home
56%
28%
2%
13%
Inviting space
Okay, but could usesome improvement
Not pleasant
Never been insidelibrary
Ranges from 64% in
Northern Ontario to
80% in Metro Toronto
5 kilometres or less
6 to 10 kilometres
11 to 20 kilometres
More than 20
kilometres
Don’t know
Inviting space
Okay, but could use
some improvement
Not pleasant
Never been inside
library
Age 18-34: 47%
Age 55+: 62%

Market Probe 10
Nearly one-third of those surveyed have not used the public library in the
past year (although most have used it sometime in the past)
Don’t Use the Public Library
31%
31%
30%
31%
2015
2010
2005
2000
91%9%
Yes (%)
No (%)
Ever used the Public Library
Had a Negative Experience
(All users, current and past)
5%95%
Yes (%)
No (%)
10% among web panelists
Market Probe 11
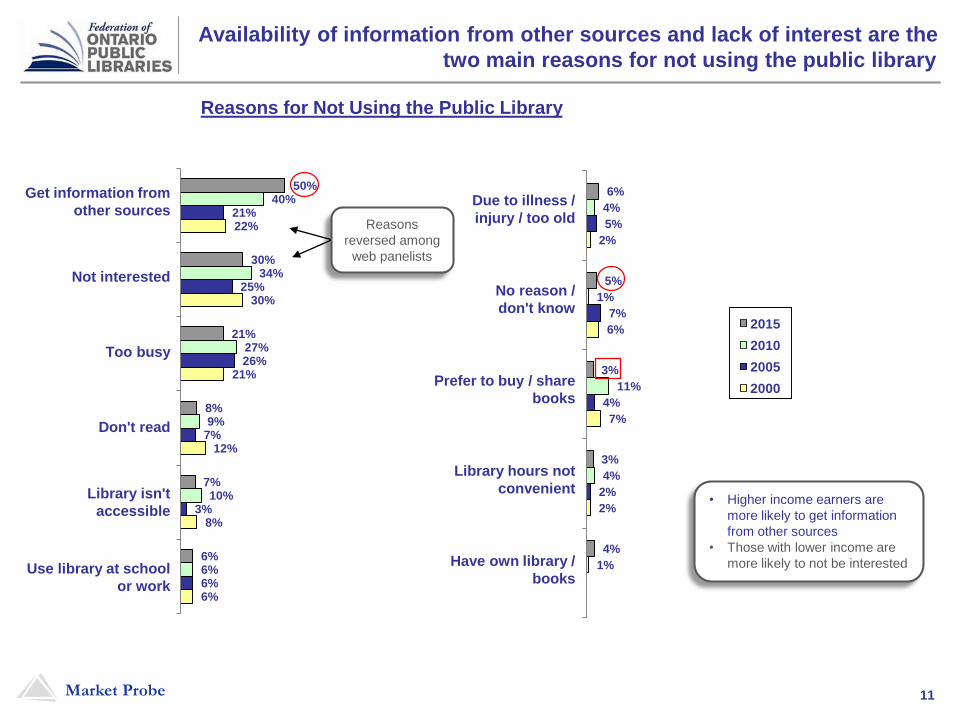
50%
30%
21%
8%
7%
6%
40%
34%
27%
9%
10%
6%
21%
25%
26%
7%
3%
6%
22%
30%
21%
12%
8%
6%
Get informationfrom other sources
Not interested
Too busy
Don't read
Library isn'taccessible
Use library atschool or work
Availability of information from other sources and lack of interest are the
two main reasons for not using the public library
Reasons for Not Using the Public Library
6%
5%
3%
3%
4%
4%
1%
11%
4%
1%
5%
7%
4%
2%
2%
6%
7%
2%
Due to illness /injury / too old
No reason /don't know
Prefer to buy /share books
Library hoursnot convenient
Have ownlibrary / books
Get information from
other sources
Not interested
Too busy
Don't read
Library isn't
accessible
Use library at school
or work
Due to illness /
injury / too old
No reason /
don't know
Prefer to buy / share
books
Library hours not
convenient
Have own library /
books
Reasons
reversed among
web panelists68%
32%
65%
35%
65%
35%
0% 20% 40% 60% 80% 100%
Yes
No
2015
2010
2005
2000
• Higher income earners are
more likely to get information
from other sources
• Those with lower income are
more likely to not be interested
Market Probe 12
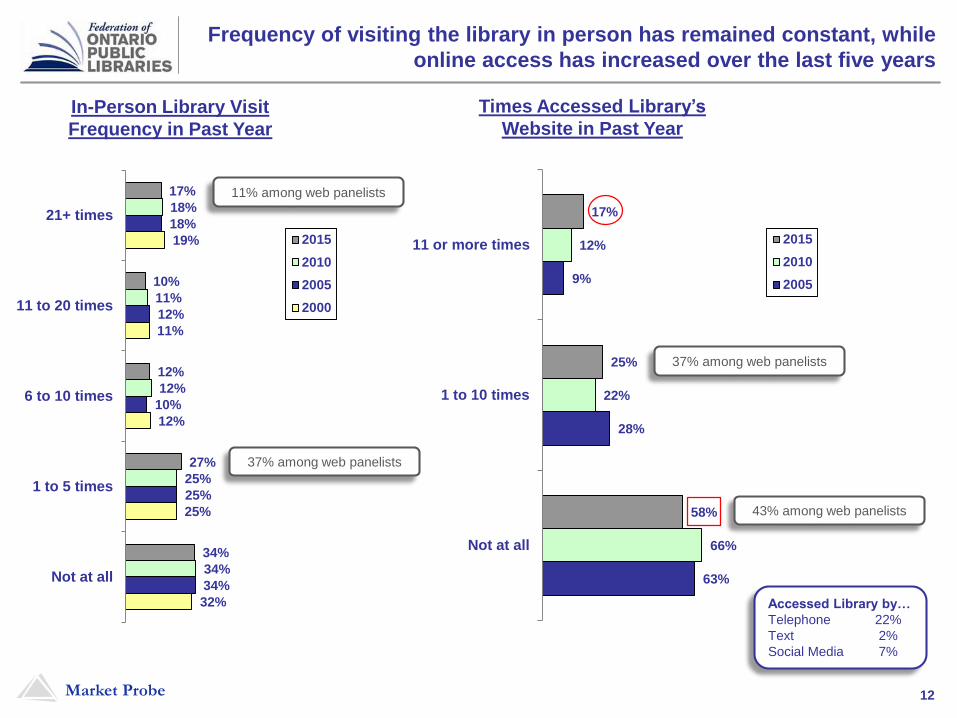
Frequency of visiting the library in person has remained constant, while
online access has increased over the last five years
In-Person Library Visit
Frequency in Past Year
Accessed Library by…
Telephone 22%
Text 2%
Social Media 7%
17%
10%
12%
27%
34%
18%
11%
12%
25%
34%
18%
12%
10%
25%
34%
19%
11%
12%
25%
32%
21+ times
11 to 20 times
6 to 10 times
1 to 5 times
Not at all
2015
2010
2005
2000
Times Accessed Library’s
Website in Past Year
17%
25%
58%
12%
22%
66%
9%
28%
63%
11 or more times
1 to 10 times
Not at all
2015
2010
2005
37% among web panelists
37% among web panelists
43% among web panelists
11% among web panelists

Market Probe 13
Use of the Internet to access the public library is complementing, not
replacing, in-person visits
2010
37%
1% 1%
13%
12%
In-Person
Internet
Phone33%
2%
2015
27%
1% 1%
20%
11%
In-Person
Internet
Phone36%
3%
Ways Users Access the Public Library
Significant differences among
web panelists (2015):
In-person only 19%
In-person / Internet 49%
In-person / phone 3%
Market Probe 14
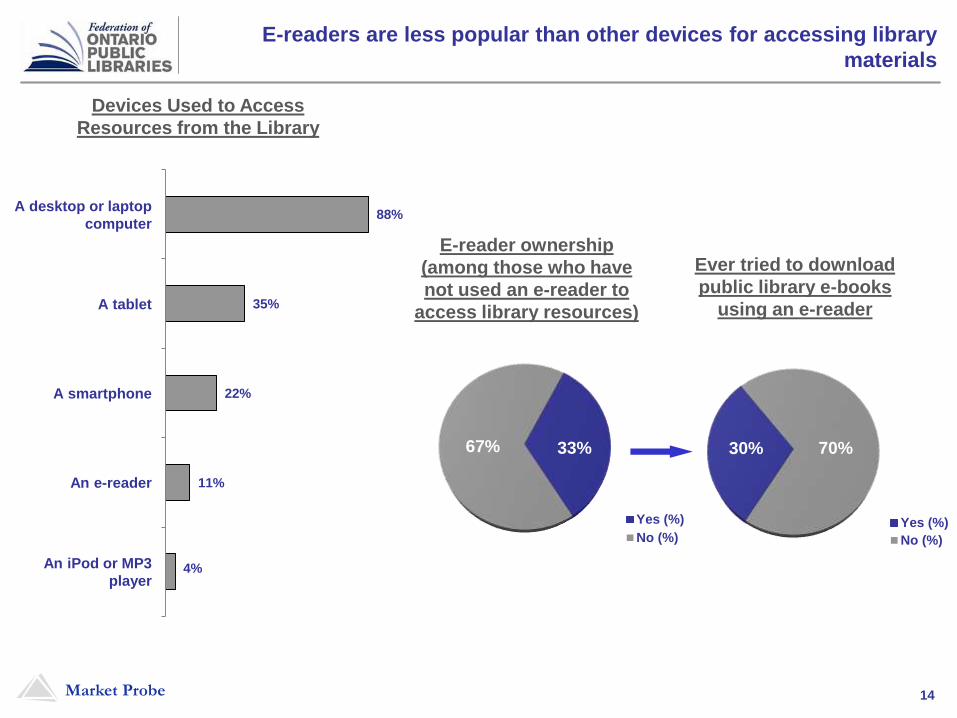
88%
35%
22%
11%
4%
A desktop or laptopcomputer
A tablet
A smartphone
An e-reader
An iPod or MP3player
E-readers are less popular than other devices for accessing library
materials
33%67%
Yes (%)
No (%)
Devices Used to Access
Resources from the Library
E-reader ownership
(among those who have
not used an e-reader to
access library resources)
30% 70%
Yes (%)
No (%)
Ever tried to download
public library e-books
using an e-reader
A desktop or laptop
computer
A tablet
A smartphone
An e-reader
An iPod or MP3
player

Market Probe 15
Bookstores continue to receive more visits than libraries,
especially online
Bookstore vs. Library Visit
Frequency
42%
26%
29%
3%
43%
28%
28%
1%
Bookstores more
About the same
Libraries more
Don't know
2015
2010 9%
21%
26%
12%
21%
10%
13%
15%
19%
10%
25%
18%
Libraryonly
Librarymore
Bothequally
Bookstoremore
Bookstoreonly
Neither
In-Person Usage Online Usage
Relative Frequency of Using Libraries and Bookstores

Market Probe 16
In-person library visitors are engaging in fewer activities, with use of the
library’s wireless network being the only one to register increased usage
Reasons for Personally Using the Public Library
84%
56%
34%
28%
26%
25%
23%
23%
16%
14%
10%
90%
70%
41%
33%
26%
17%
33%
23%
13%
21%
16%
88%
73%
38%
31%
32%
18%
9%
21%
16%
88%
77%
47%
19%
32%
17%
9%
24%
18%
Borrow books, CDs, DVDs or other materials
Get information on a topic of personal
interest
Read or study
Access the Internet using library computers
Relax or socialize
Use the library's wireless network
Access databases / other electronically
stored info*
Take a child to a program or activity
Attend a lecture, program, meeting or
training session
Work assignment or keep up-to-date at work
School or class assignment
86%
59%
44%
35%
31%
31%
27%
25%
18%
21%
27%
Total Household Usage
(2015)
68%
32%
65%
35%
65%
35%
0% 20% 40% 60% 80% 100%
Yes
No
2015
2010
2005
2000
Web panelists indicated
fewer reasons in total and,
in particular, were much
less likely to mention
borrowing materials and
getting information on a
topic of interest
* Wording changed in 2015.
Market Probe 17
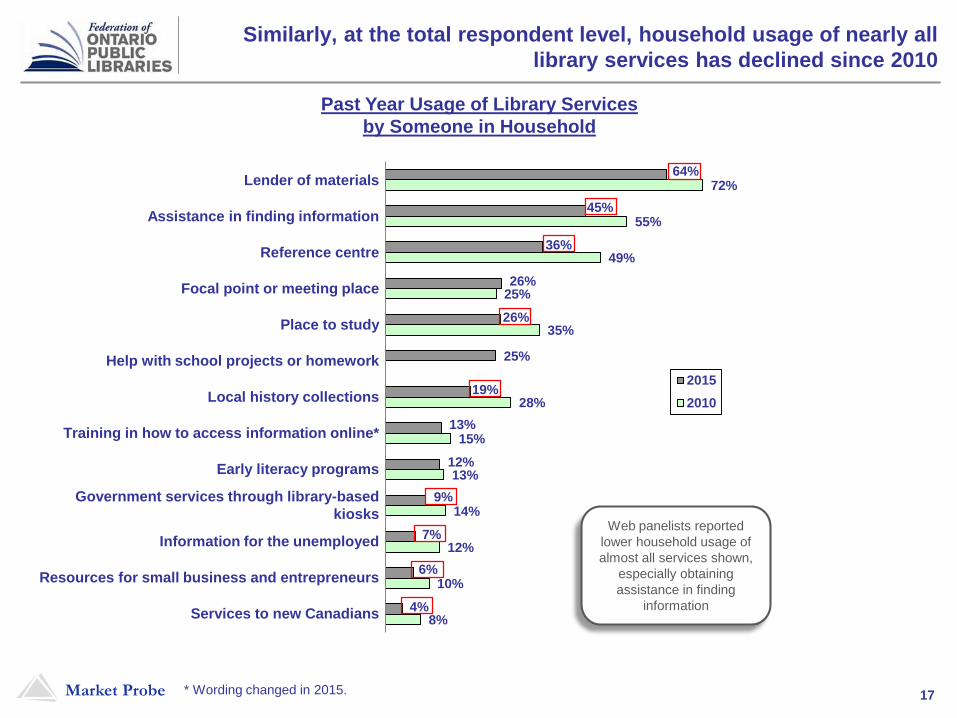
64%
45%
36%
26%
26%
25%
19%
13%
12%
9%
7%
6%
4%
72%
55%
49%
25%
35%
28%
15%
13%
14%
12%
10%
8%
2015
2010
Similarly, at the total respondent level, household usage of nearly all
library services has declined since 2010
Lender of materials
Assistance in finding information
Reference centre
Focal point or meeting place
Place to study
Help with school projects or homework
Local history collections
Training in how to access information online*
Early literacy programs
Government services through library-based
kiosks
Information for the unemployed
Resources for small business and entrepreneurs
Services to new Canadians
Web panelists reported
lower household usage of
almost all services shown,
especially obtaining
assistance in finding
information
Past Year Usage of Library Services
by Someone in Household
* Wording changed in 2015.

Market Probe 18
42%
30%
24%
26%
14%
14%
10%
5%
34%
25%
21%
23%
12%
5%
4%
33%
14%
14%
13%
7%
2%
8%
5%
2%
Check catalogue
Renew an item
Reserve an item
Access other materialsvia library's website
Download an item
Manage / makechanges to library account
Consult a librarian bye-mail, chat or IM
Unlike in-person activities, use of the library by telephone / text and
Internet has increased over the past five years
23%
16%
14%
12%
4%
19%
13%
13%
10%
12%
7%
10%
7%
18%
11%
Consult a librarian
Renew an item
Reserve an item
Enquire / requestchanges to
account
68%
32%
65%
35%
65%
35%
0% 20% 40% 60% 80% 100%
Yes
No
2015
2010
2005
2000
Telephone / Text*
Consult a librarian
Renew an item
Reserve an item
Enquire / request
changes to account
Internet
Check catalogue
Renew an item
Reserve an item
Access other materials
via library's website
Download an item
Manage / make changes
to library account
Consult a librarian by
e-mail, chat or IM
Past Year Use of Public Library by
Telephone / Text
Past Year Use of Public Library by
Internet
57% among
web panelists
* Wording changed in 2015.
Market Probe 19
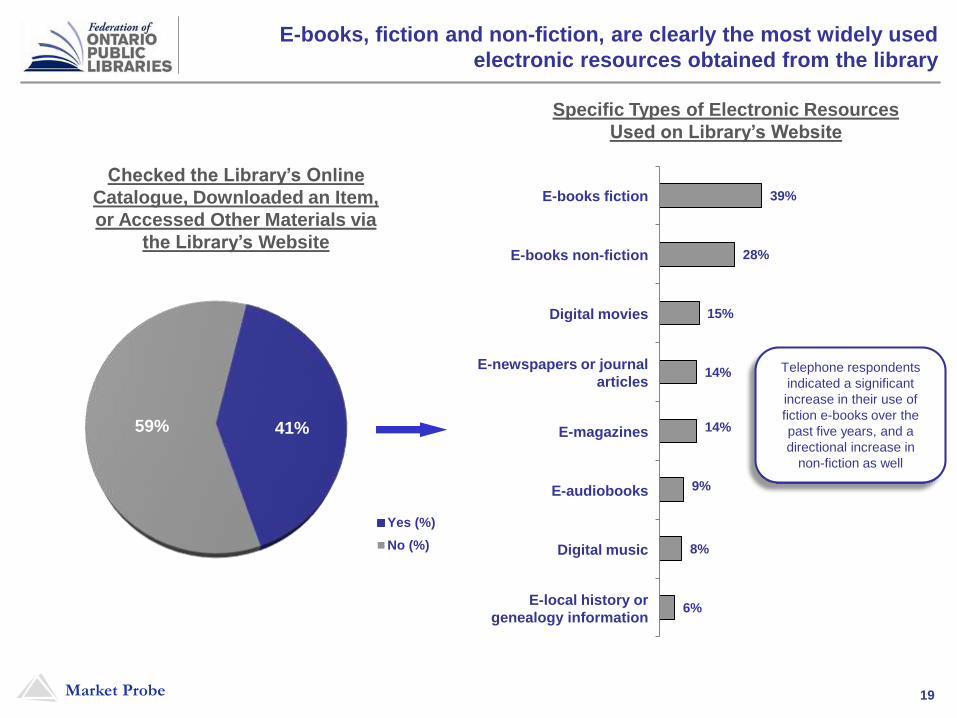
E-books, fiction and non-fiction, are clearly the most widely used
electronic resources obtained from the library
41%59%
Yes (%)
No (%)
39%
28%
15%
14%
14%
9%
8%
6%
E-books fiction
E-books non-fiction
Digital movies
E-newspapers or journal articles
E-magazines
E-audiobooks
Digital music
E-local history orgenealogy information
Checked the Library’s Online
Catalogue, Downloaded an Item,
or Accessed Other Materials via
the Library’s Website
Telephone respondents
indicated a significant
increase in their use of
fiction e-books over the
past five years, and a
directional increase in
non-fiction as well
E-books fiction
E-books non-fiction
Digital movies
E-newspapers or journal
articles
E-magazines
E-audiobooks
Digital music
E-local history or
genealogy information
Specific Types of Electronic Resources
Used on Library’s Website
Market Probe 20
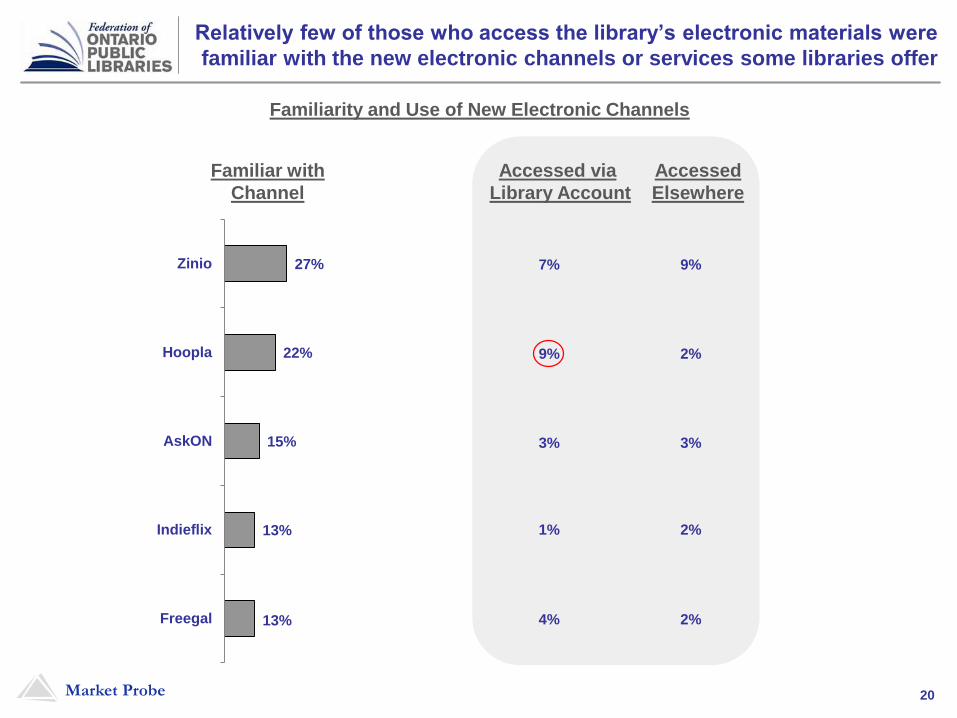
Relatively few of those who access the library’s electronic materials were
familiar with the new electronic channels or services some libraries offer
27%
22%
15%
13%
13%
Zinio
Hoopla
AskON
Indieflix
Freegal
Familiar with
Channel
Accessed via
Library Account
Accessed
Elsewhere
Familiarity and Use of New Electronic Channels
7% 9%
9% 2%
3% 3%
1% 2%
4% 2%
Market Probe 21
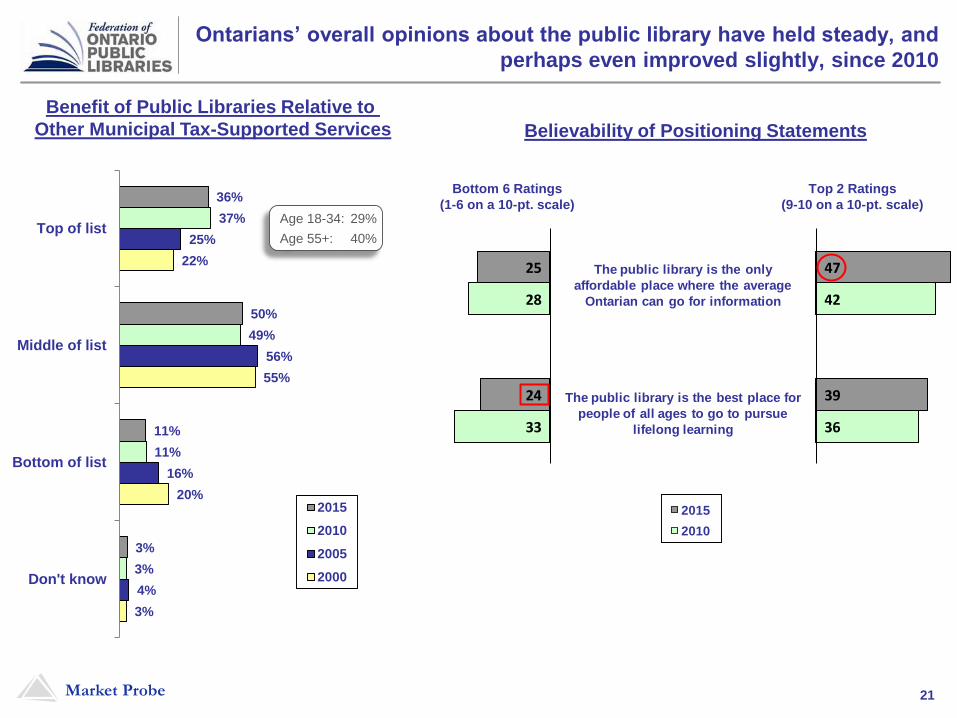
47
39
42
36
25
24
28
33
The public library is the only
affordable place where the average
Ontarian can go for information
The public library is the best place for
people of all ages to go to pursue
lifelong learning
Bottom 6 Ratings
(1-6 on a 10-pt. scale)
Top 2 Ratings
(9-10 on a 10-pt. scale)36%
50%
11%
3%
37%
49%
11%
3%
25%
56%
16%
4%
22%
55%
20%
3%
Top of list
Middle of list
Bottom of list
Don't know
2015
2010
2005
2000
Ontarians’ overall opinions about the public library have held steady, and
perhaps even improved slightly, since 2010
68%
32%
65%
35%
65%
35%
0% 20% 40% 60% 80% 100%
Yes
No
2015
2010
2005
2000
Benefit of Public Libraries Relative to
Other Municipal Tax-Supported Services Believability of Positioning Statements
Bottom 6 Ratings
(1-6 on a 10-pt. scale)
Top 2 Ratings
(9-10 on a 10-pt. scale)Age 18-34: 29%
Age 55+: 40%

Market Probe 22
56%
54%
50%
46%
34%
32%
31%
30%
29%
28%
26%
26%
25%
19%
Most Ontarians acknowledge the public library’s role in advancing
literacy, equal opportunity, and quality of life in their communities
Public libraries are important because they promote literacy and a love
of reading
By providing free access to materials and resources, the public library
plays an important role in giving everyone a chance to succeed
Having a public library improves the quality of life in a community
Public libraries are welcoming, friendly places
The public library is the only affordable place where the average
Ontarian can go for information
Public libraries provide many services people would have a hard time
finding elsewhere
The public library provides valuable resources to increase health
literacy within the communities it serves
The public library is the best place for people of all ages to go to pursue
lifelong learning
Public libraries have done a good job of keeping up with new
technologies
The public library serves as an important meeting place and focal point
within the community
The public library is continually expanding the services it offers
It is very easy to find whatever you are looking for at the public library
Now that information is available from so many different sources,
people need public libraries more than ever
By providing access to information from a wide variety of sources,
public libraries promote an understanding of political issues
% Strongly Agree
Believability of Positioning Statements
42% 65%
47% 59%
39% 60%
35% 52%
25% 35%
24% 37%
24% 31%
25% 30%
22% 36%
22% 28%
23% 28%
18% 30%
20% 25%
17% 17%
By Age
18-34 55+

Market Probe 23
The perceived value of several library services has increased over the
past five years
68%
32%
65%
35%
65%
35%
0% 20% 40% 60% 80% 100%
Yes
No
2015
2010
2005
2000
Perceived Value of Library Services
* Wording changed in 2015.
68
60
56
54
50
45
45
40
37
31
31
28
21
69
46
55
45
42
47
27
30
24
22
25
18
9
13
15
14
17
20
18
26
31
33
35
39
45
9
22
13
21
22
16
35
33
39
44
39
46
Lender of materials
Early literacy programs
Reference centre
Provider of support for school
projects or homework
Place to study
Local history collections
Assistance in finding information
Services to new Canadians
Information for the unemployed
Trainer in how to access
info online*
Focal point or meeting place
Government services through library-
based kiosks
Resources for small business and
entrepreneurs
Bottom 6 Ratings
(1-6 on a 10-pt. scale)
Top 2 Ratings
(9-10 on a 10-pt. scale)
n/an/a
Web panelists’
ratings were lower
for almost all
services, likely due
to methodology
Bottom 6 Ratings
(1-6 on a 10-pt. scale)
Top 2 Ratings
(9-10 on a 10-pt. scale)

Market Probe 24
0
40
80
Assistance in Finding Information
Early Literacy Progams
Focal Point or Meeting Place
Government Services Kiosks
Information for the Unemployed
Lender of Materials
Local History CollectionsPlace to Study
Reference Centre
Resources for Small Business
Services to New Canadians
Support for School Projects or Homework
Training in How to Access Info Online
There is a bigger gap between web panelists’ perceived value and usage
of assistance with finding information versus phone respondents
0
40
80
Assistance in f inding information
Early literacy programs
Focal point or meeting place
Government services through library-based kiosks
Information for the unemployed
Lender of materials
Local history collectionsPlace to study
Provider of support for school projects or homework
Reference centre
Resources for small business and entrepreneurs
Services to new Canadians
Training in how to access info online
Percent Valuing the Service Percent Using the Service
Telephone Survey Online Survey
Value & Usage Combined
0
40
80
Assistance in Finding Information
Early Literacy Programs
Focal Point or Meeting Place
Government Services Kiosks
Information for the Unemployed
Lender of Materials
Local History CollectionsPlace to Study
Reference Centre
Resources for Small Business
Services to New Canadians
Support for School Projects or Homework
Training in How to Access Info Online
Market Probe 25
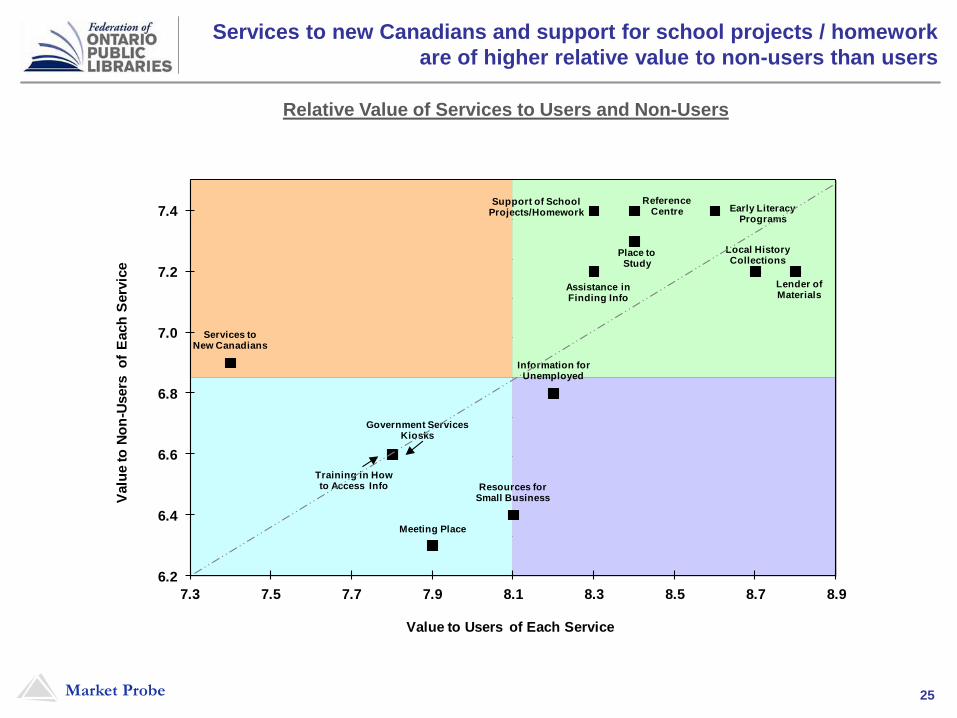
Services to new Canadians and support for school projects / homework
are of higher relative value to non-users than users
Relative Value of Services to Users and Non-Users
Lender of Materials
Reference Centre
Government Services Kiosks
Meeting Place
Early Literacy Programs
Place to Study
Local History Collections
Training in How to Access Info
Information for Unemployed
Resources for Small Business
Assistance in Finding Info
Services to New Canadians
Support of School Projects/Homework
6.2
6.4
6.6
6.8
7.0
7.2
7.4
7.3 7.5 7.7 7.9 8.1 8.3 8.5 8.7 8.9
Valu
e to
No
n-U
sers
o
f E
ach
Serv
ice
Value to Users of Each Service

Market Probe 26
Most Ontarians feel that, hypothetically, a local library closing would have
more impact on the community than on themselves and their families
64%
29%
7%
32%
45%
23%
Major Impact
Minor Impact
No Impact at all
Community
Family
Telephone survey
respondents were
more likely than
web panelists to
think there would
be major impacts
Major Minor None
Major 29% 30% 6%
Minor 3% 15% 11%
None 0% 0% 6%
Family Impact
Co
mm
un
ity I
mp
act
Impact of Public Library Closing on…
Age 18-34: 57%
Age 55+: 72%
Age 18-34: 24%
Age 55+: 36%

Market Probe 27
Views remain mixed as to whether libraries will become more or less
important in the future
26%
43%
27%
5%
23%
44%
29%
4%
27%
45%
23%
6%
27%
41%
25%
7%
More important
No change
Less important
Don't know
2015
2010
2005
2000
Opinion of Future Importance of Public Libraries

Market Probe 28
19%
15%
15%
16%
10%
12%
12%
9%
9%
7%
36%
35%
35%
29%
33%
27%
26%
26%
24%
24%
55%
50%
49%
44%
44%
39%
38%
35%
33%
31%
Very Likely Somewhat Likely Total
Interest in new library service concepts varies, in many cases
based on age
A program that allows people to try out the newest tech devices or
applications, such as 3D printers or laser cutters
Library kiosks located throughout the community where people can
check out books, movies or music without having to go to the
library itself
A personalized online account that gives you recommendations
based on your past library activity
A cell phone app that allows you to access library services from
your mobile phone
An online research service where you could pose questions and get
responses from librarians
A cell phone app that helps you locate material easily in the library
using GPS
E-book readers already loaded with the book you want to read
Instruction on how to use handheld reading devices and tablets
Classes on how to download library e-books to handheld devices
A digital media lab where you could create and upload new digital
content like your own movies or e-books
Likelihood of Using Different Library Services
64% 46%
57% 39%
61% 39%
62% 24%
43% 37%
54% 19%
45% 34%
31% 40%
30% 38%
42% 21%
By Age
18-34 55+

Market Probe 29
66%
51%
45%
35%
34%
30%
26%
19%
8%
Communication preferences also differ by age, but email does rank
highest among all groups
Articles in the local paper
Information on the library's website
Social media
Notices at the library
Notices in community centres or other public places
Inserts with your tax bill or other local government
mailings
Notices in schools
Talks / presentations to community groups
Best Way to Inform about What’s Going On at the Library
59% 73%
40% 63%
36% 48%
46% 22%
31% 34%
28% 32%
20% 32%
21% 12%
6% 12%
By Age
18-34 55+

Market Probe 30
Connecting to the past: the public library continues to deliver value as
patrons’ usage patterns evolve
• Overall opinions and value perceptions of the library remain very strong.
– Its position in people’s minds relative to other tax-supported services is consistent with
previous studies, and reactions to earlier positioning statements have improved
slightly.
– The public acknowledges the library’s role in advancing literacy, equal opportunity, and
quality of life in Ontario communities.
– The value of certain services (e.g., for young children, new Canadians, and the
unemployed) has increased over the past five years.
– A majority of residents feel if their local library were to close, it would have a major
impact on the community (but not necessarily on them personally).
• Numbers of library users have remained consistent, but usage patterns
have changed.
– The number of library non-users has been extremely steady over the last 15 years.
– Library card ownership has increased; still, household usage levels may be softening
slightly.
– Reported in-person library visit frequency has remained the same over the years, but in
2015, the number of people using the library both online and in-person has surpassed
the number of in-person-only visitors.
– Usage of many services is lower than reported previously, indicating that library users
may be becoming more selective in choosing which services to use.
Market Probe 31
View to the future: the library needs to determine which investments to
make (and which to skip) in the face of technological and social change
• Regular review of strategies and tactics becomes even more important as
technology, channel, and media preferences change.
– Electronic access is complementing, not replacing, in-person usage; therefore,
duplication of hard copy and electronic materials, plus increased channel costs, will be
the norm for the foreseeable future.
– Ensuring compatibility with an ever expanding array of electronic devices will continue
to pose challenges.
• Communicating about new service offerings will be as important as
providing them.
– Traditional library services are not increasing in usage or perceived value.
– Interest in new services is fragmented, meaning trade-offs will need to made.
– Communications about new services will have to be geared to the proper segments to
create sufficient awareness, interest, and take-up.
– People’s preference for email suggests that creation of contact lists, user groups and
advisory panels may be required in order to maintain a dialogue with library users.
• How the library can best serve a future generation of users remains
uncertain.
– Older people’s respect for the heritage and social contribution of the public library
system will not necessarily be passed down to a younger generation.
– Not every library can afford to be all things to all people; there may be an increasing
need to develop centrally and deliver locally.

Market Probe 32
The biggest challenge of all…
All future strategies and plans should be designed with the
objective of convincing more people that the public library can be
of as much value to them personally as they think it is to others.

Market Probe
The Federation would like to thank the
Ontario Ministry of Tourism and Culture
for the historical data
Market Probe


![Tender No[1]. 2009crisgm P-II Lms-fmm Tender 08-09-29!05!09_](https://static.fdocuments.us/doc/165x107/55260b834a7959d4488b4f2b/tender-no1-2009crisgm-p-ii-lms-fmm-tender-08-09-290509.jpg)