Market Overview: Minneapolis Vertical Construction
45
Market Overview: Minneapolis Vertical Construction 2015
Transcript of Market Overview: Minneapolis Vertical Construction

0 ACEC of Minnesota | Trends Presentation Vertical Markets | October 27, 2015 © 2015 FMI Corporation
Market Overview: Minneapolis Vertical Construction
2015

1 ACEC of Minnesota | Trends Presentation Vertical Markets | October 27, 2015 © 2015 FMI Corporation
Macro Trends US Market at-Large
2 ACEC of Minnesota | Trends Presentation Vertical Markets | October 27, 2015 © 2015 FMI Corporation
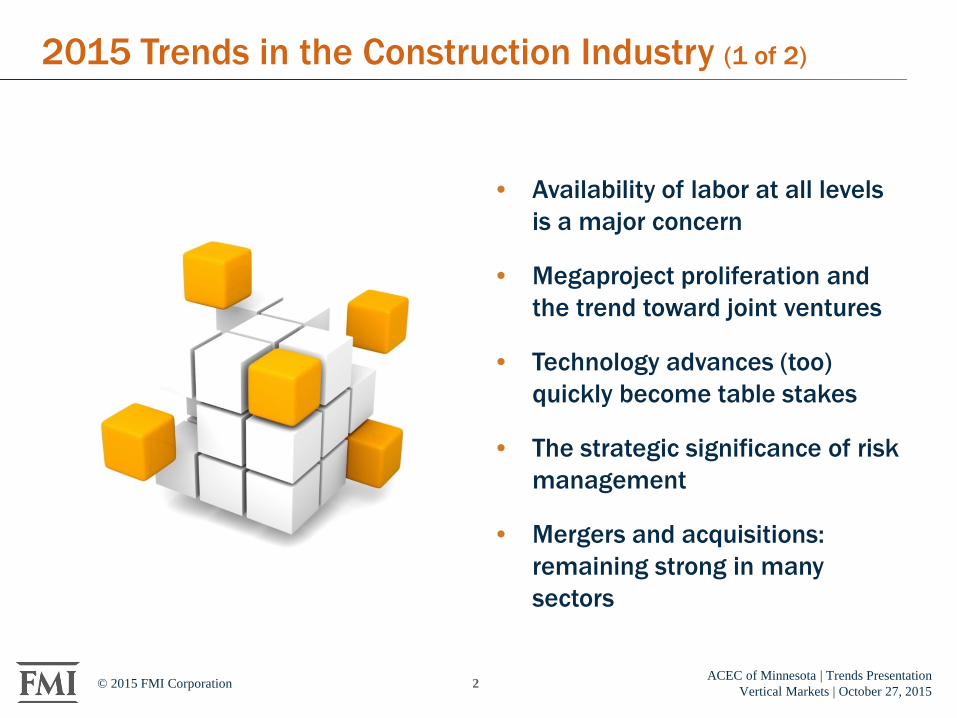
2015 Trends in the Construction Industry (1 of 2)
• Availability of labor at all levels is a major concern
• Megaproject proliferation and the trend toward joint ventures
• Technology advances (too) quickly become table stakes
• The strategic significance of risk management
• Mergers and acquisitions: remaining strong in many sectors
3 ACEC of Minnesota | Trends Presentation Vertical Markets | October 27, 2015 © 2015 FMI Corporation
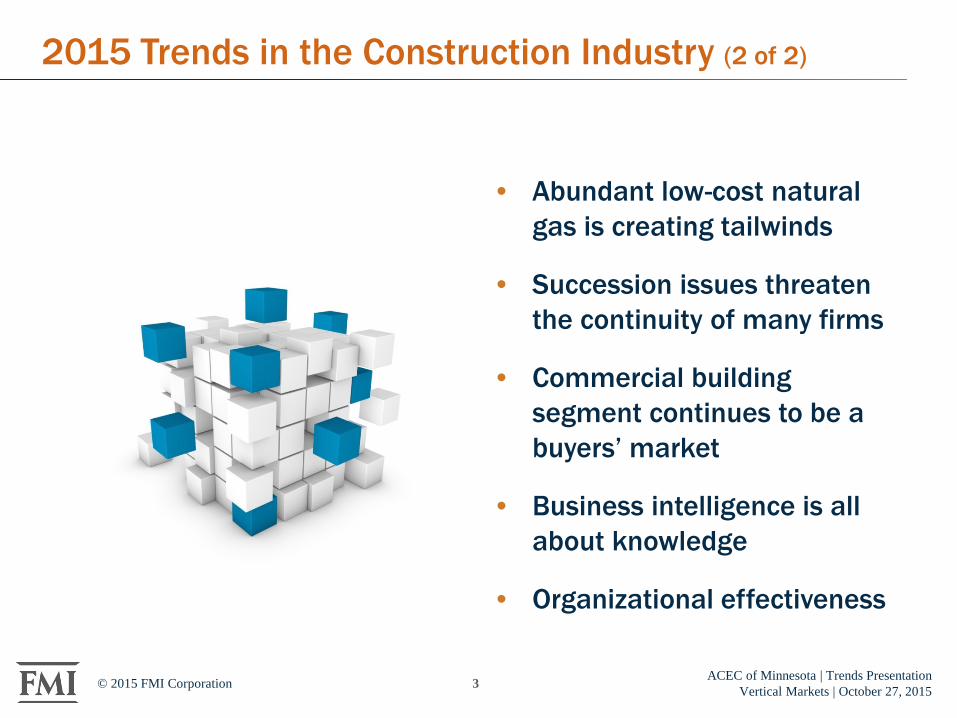
2015 Trends in the Construction Industry (2 of 2)
• Abundant low-cost natural gas is creating tailwinds
• Succession issues threaten the continuity of many firms
• Commercial building segment continues to be a buyers’ market
• Business intelligence is all about knowledge
• Organizational effectiveness

4 ACEC of Minnesota | Trends Presentation Vertical Markets | October 27, 2015 © 2015 FMI Corporation
2015 U.S. Highlights
• High-volume nonresidential segments in 2015 – Power ($93.5 billion) – Highway and Street ($86.4 billion) – Educational ($82.3 billion)
• Strongest percentage gainers in
2015 – Manufacturing (18.0%) – Lodging (15.0%) – Office (14.0%)
• Weakest segments in 2015
– Public Safety (-3.0%) – Religious (0.0%) – Educational (3.0%)
Total Put in Place
Year %
2013 7
2014 5
2015 6
5 ACEC of Minnesota | Trends Presentation Vertical Markets | October 27, 2015 © 2015 FMI Corporation
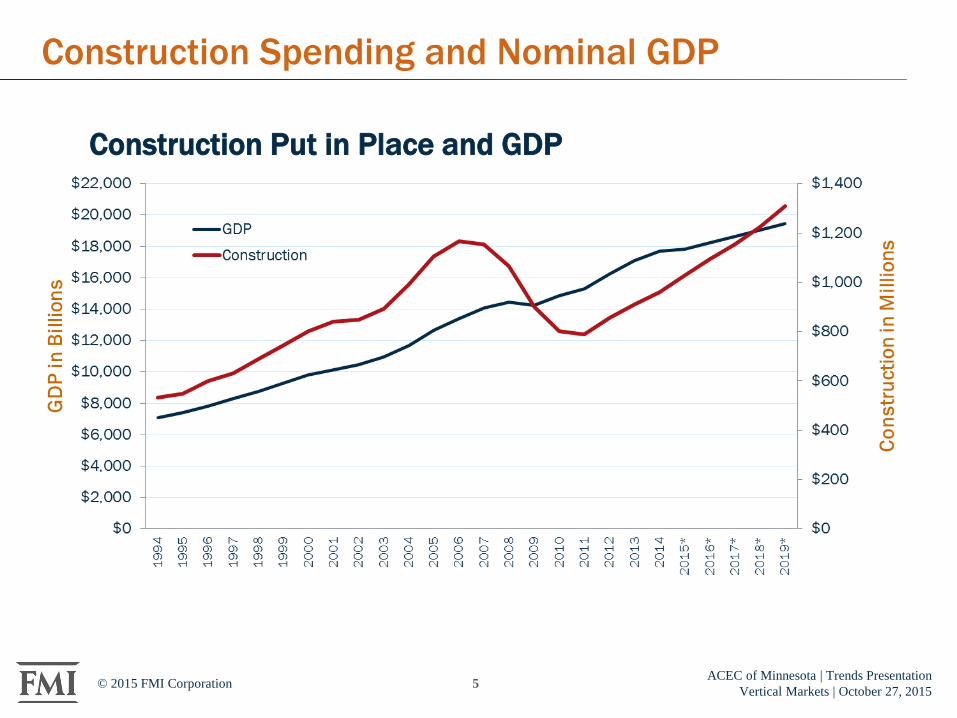
Construction Spending and Nominal GDP
Construction Put in Place and GDP

6 ACEC of Minnesota | Trends Presentation Vertical Markets | October 27, 2015 © 2015 FMI Corporation
* FMI Forecast
Construction Put in Place
Construction Spending

7 ACEC of Minnesota | Trends Presentation Vertical Markets | October 27, 2015 © 2015 FMI Corporation
* FMI Forecast
Construction Put in Place and GDP
Construction as a Percentage of GDP

8 ACEC of Minnesota | Trends Presentation Vertical Markets | October 27, 2015 © 2015 FMI Corporation
Source: AIA
Above 50
Below 50
Architecture Billing Index (ABI)

9 ACEC of Minnesota | Trends Presentation Vertical Markets | October 27, 2015 © 2015 FMI Corporation
Jobs and Unemployment Employment and Unemployment Rates | 1970- 2015

10 ACEC of Minnesota | Trends Presentation Vertical Markets | October 27, 2015 © 2015 FMI Corporation
Source: U.S. Department of Labor, AGC of America
Construction Unemployment vs. National Unemployment
Jobs and Unemployment
Construction added 280,000 jobs over the past year.

11 ACEC of Minnesota | Trends Presentation Vertical Markets | October 27, 2015 © 2015 FMI Corporation
Source: U.S. Department of Labor
Inflation Remains Under Control — CPI
Consumer Price Index
-3.0%
-2.0%
-1.0%
0.0%
1.0%
2.0%
3.0%
4.0%
5.0%
6.0%
7.0%
Jan
-87
Ma
y-8
7S
ep
-87
Jan
-88
Ma
y-8
8S
ep
-88
Jan
-89
Ma
y-8
9S
ep
-89
Jan
-90
Ma
y-9
0S
ep
-90
Jan
-91
Ma
y-9
1S
ep
-91
Jan
-92
Ma
y-9
2S
ep
-92
Jan
-93
Ma
y-9
3S
ep
-93
Jan
-94
Ma
y-9
4S
ep
-94
Jan
-95
Ma
y-9
5S
ep
-95
Jan
-96
Ma
y-9
6S
ep
-96
Jan
-97
Ma
y-9
7S
ep
-97
Jan
-98
Ma
y-9
8S
ep
-98
Jan
-99
Ma
y-9
9S
ep
-99
Jan
-00
Ma
y-0
0S
ep
-00
Jan
-01
Ma
y-0
1S
ep
-01
Jan
-02
Ma
y-0
2S
ep
-02
Jan
-03
Ma
y-0
3S
ep
-03
Jan
-04
Ma
y-0
4S
ep
-04
Jan
-05
Ma
y-0
5S
ep
-05
Jan
-06
Ma
y-0
6S
ep
-06
Jan
-07
Ma
y-0
7S
ep
-07
Jan
-08
Ma
y-0
8S
ep
-08
Jan
-09
Ma
y-0
9S
ep
-09
Jan
-10
Ma
y-1
0S
ep
-10
Jan
-11
Ma
y-1
1S
ep
-11
Jan
-12
Ma
y-1
21
2-S
ep
13
-Ja
n1
3-M
ay
13
-Se
p1
4-J
an
14
-Ma
y1
4-S
ep
Jan
-15
Ma
y-1
5
% C
ha
ng
e

12 ACEC of Minnesota | Trends Presentation Vertical Markets | October 27, 2015 © 2015 FMI Corporation
ENR 400 Share of Total Construction Put in Place

13 ACEC of Minnesota | Trends Presentation Vertical Markets | October 27, 2015 © 2015 FMI Corporation
Source: U.S. Census Bureau
National Population: 321,043,478 (June 2015) 3.98% increase from 2010 Census
Illinois 12,882,135
New York 19,651,127
Florida 19,552,860
Texas 26,448,193
California 38,332,521
Top-Five States
Population Growth
State Change 2010 to 2013North Dakota 7.6%Texas 5.2%Utah 5.0%Colorado 4.8%Florida 4.0%
Top Five by Growth Rate

14 ACEC of Minnesota | Trends Presentation Vertical Markets | October 27, 2015 © 2015 FMI Corporation
Population Growth
Baby boomers are currently the largest segment of the U.S. population. There are between 72 million and 79 million baby boomers (approximately 28% of the U.S. population).
Did you know? • Since January 1, 2011, more than 10,000 baby boomers have turned 65 every day.
• More than 30% of U.S. investors currently in their
60s have more than 80% of their 401(k) invested in equities.
• Approximately 3 out of 4 Americans start claiming Social Security benefits from the moment they turn 62.
• According to a recent AARP survey of baby boomers, 40% of them plan to work “until they drop.”
Source: U.S. Census Bureau

15 ACEC of Minnesota | Trends Presentation Vertical Markets | October 27, 2015 © 2015 FMI Corporation
States Ranked by Percent Change in Population | 2000 - 2030
Population Growth by State (1 of 2)
Source: U.S. Department of Labor
16 ACEC of Minnesota | Trends Presentation Vertical Markets | October 27, 2015 © 2015 FMI Corporation
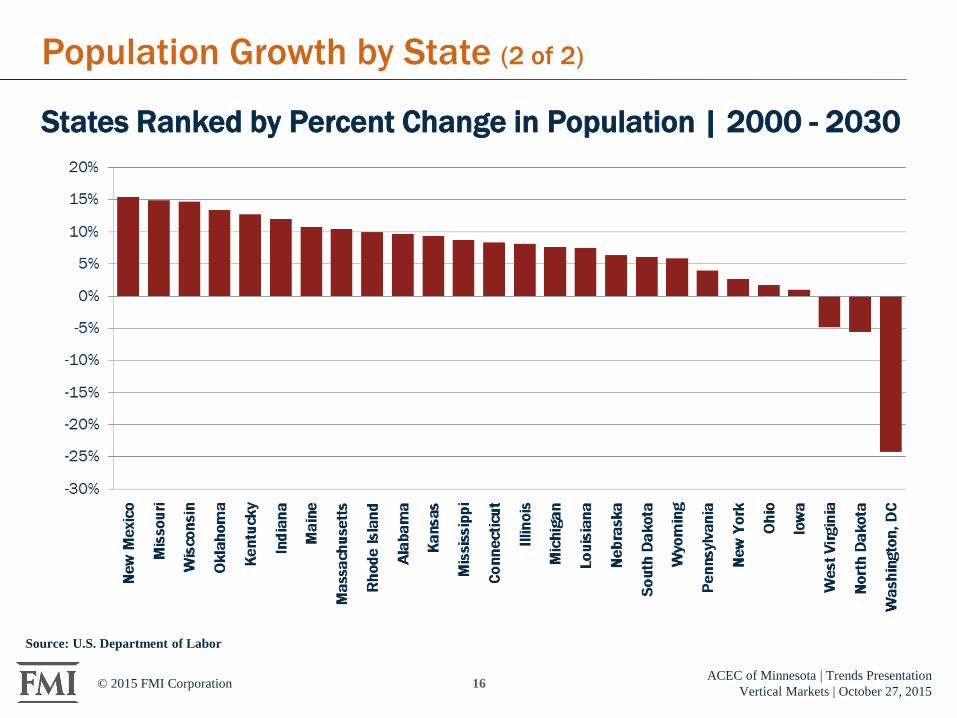
Population Growth by State (2 of 2)
States Ranked by Percent Change in Population | 2000 - 2030
Source: U.S. Department of Labor

17 ACEC of Minnesota | Trends Presentation Vertical Markets | October 27, 2015 © 2015 FMI Corporation
Population Growth
• Nontraditional and single-person households will increase. This trend has been exacerbated by the recent recession.
• The elderly is the fastest-growing segment over the next few years, outpacing growth of the working-aged.
• Increased net immigration. • 88% of the U.S. population growth
will occur in the South and West between 2000 and 2030.
• Five states that will experience the largest net population increase: Florida, California, Texas, Arizona and North Carolina.
– Florida, California and Texas will account for 46% of total U.S. population growth.
Source: U.S. Census Bureau
Decade
1980
1990
2000
2010
Non-Family Households
26.2%
29.2%
31.2%
32.7%
<5
Forecast Population Growth 2010-2015
5-13
14-17
18-24
25-44
4.6%
5.1%
0.2%
0.6%
3.3%
45-64
≥65
≥85
≥100
Total
3.6%
16.4%
9.4%
32.1%
4.9%

18 ACEC of Minnesota | Trends Presentation Vertical Markets | October 27, 2015 © 2015 FMI Corporation
*Improvements include additions, alterations and major replacements. They do not include maintenance and repairs. * Source: Building permits, Construction Put in Place and trade sources. This report is based on multiple sources, prepared and believed accurate by FMI, but accuracy is not guaranteed by FMI nor by its employees.
U.S. Construction Put in Place Millions of Current Dollars3rd Quarter 2015 Forecast (based on Q2 2015 Actuals)
2015 2016 2017 2018 2019RESIDENTIAL BUILDINGSSingle Fami ly 209,415 229,917 249,885 274,366 299,167
Multi fami ly 56,151 63,136 68,108 72,596 79,413 Improvements* 110,125 115,485 119,937 125,609 133,529
Total Residential 375,691 408,538 437,931 472,571 512,109 NONRESIDENTIAL BUILDINGSLodging 18,539 20,762 22,521 23,476 24,916 Office 52,579 56,306 57,660 61,229 66,691 Commercia l 67,659 74,414 79,134 80,770 84,696 Heal th Care 40,416 41,898 44,277 47,454 50,129 Educational 82,277 85,810 88,956 93,825 99,362 Rel igious 3,237 3,317 3,394 3,488 3,610 Publ ic Safety 9,079 9,284 9,695 10,041 10,516 Amusement and Recreation 18,499 19,972 20,662 21,650 22,760 Transportation 45,655 49,917 54,086 57,278 60,842 Communication 17,742 18,716 19,237 19,971 20,792 Manufacturing 68,282 71,850 75,920 81,427 86,970
Total Nonresidential Buildings 423,964 452,247 475,542 500,609 531,285 NONBUILDING STRUCTURES Power 93,540 96,715 99,238 108,749 118,521 Highway and Street 86,350 87,855 89,683 90,317 91,934 Sewage and Waste Disposa l 24,808 25,731 26,729 27,481 28,381 Water Supply 13,842 14,260 14,485 14,851 15,507 Conservation and Development 7,747 8,144 8,562 9,177 9,820
Total Nonbuilding Structures 226,286 232,705 238,697 250,575 264,162
Total Put in Place 1,025,941 1,093,490 1,152,170 1,223,755 1,307,555
19 ACEC of Minnesota | Trends Presentation Vertical Markets | October 27, 2015 © 2015 FMI Corporation
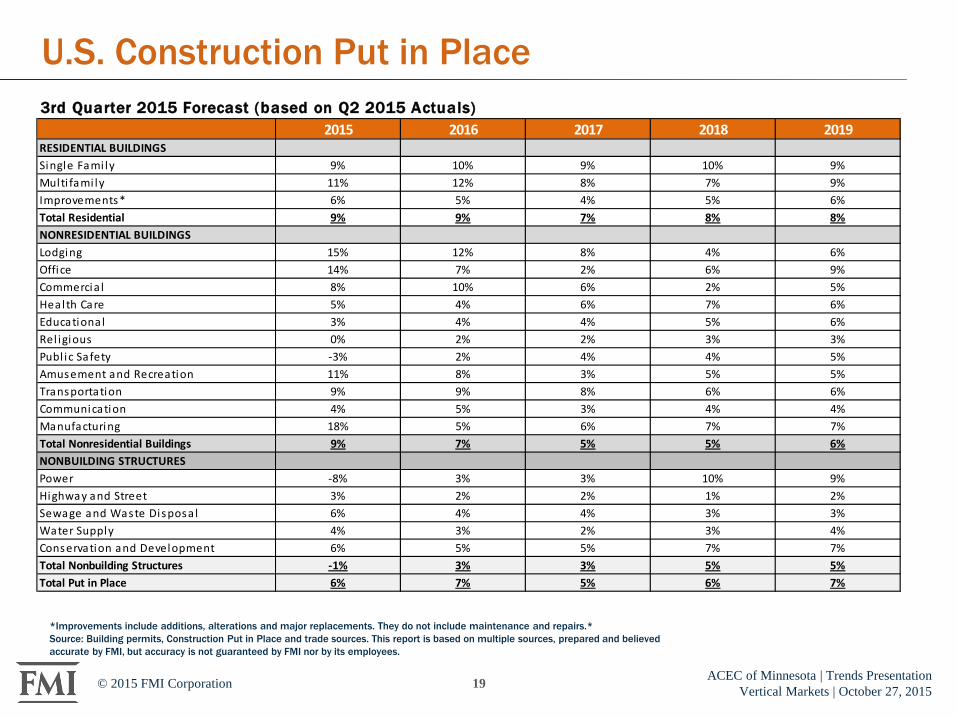
*Improvements include additions, alterations and major replacements. They do not include maintenance and repairs.* Source: Building permits, Construction Put in Place and trade sources. This report is based on multiple sources, prepared and believed accurate by FMI, but accuracy is not guaranteed by FMI nor by its employees.
U.S. Construction Put in Place 3rd Quarter 2015 Forecast (based on Q2 2015 Actuals)
2015 2016 2017 2018 2019RESIDENTIAL BUILDINGSSingle Fami ly 9% 10% 9% 10% 9%Multi fami ly 11% 12% 8% 7% 9%Improvements* 6% 5% 4% 5% 6%Total Residential 9% 9% 7% 8% 8%NONRESIDENTIAL BUILDINGSLodging 15% 12% 8% 4% 6%Office 14% 7% 2% 6% 9%Commercia l 8% 10% 6% 2% 5%Health Care 5% 4% 6% 7% 6%Educational 3% 4% 4% 5% 6%Rel igious 0% 2% 2% 3% 3%Publ ic Safety -3% 2% 4% 4% 5%Amusement and Recreation 11% 8% 3% 5% 5%Transportation 9% 9% 8% 6% 6%Communication 4% 5% 3% 4% 4%Manufacturing 18% 5% 6% 7% 7%Total Nonresidential Buildings 9% 7% 5% 5% 6%NONBUILDING STRUCTURES Power -8% 3% 3% 10% 9%Highway and Street 3% 2% 2% 1% 2%Sewage and Waste Disposa l 6% 4% 4% 3% 3%Water Supply 4% 3% 2% 3% 4%Conservation and Development 6% 5% 5% 7% 7%Total Nonbuilding Structures -1% 3% 3% 5% 5%Total Put in Place 6% 7% 5% 6% 7%

20 ACEC of Minnesota | Trends Presentation Vertical Markets | October 27, 2015 © 2015 FMI Corporation
U.S. Multifamily Housing Construction
• Construction put in place rose 31.5% in 2014 and will rise another 10.8% in 2015 to $56.2 billion.
• Rents rising as population shifts to the city and forgoes homeownership for now.
• Market drivers: – Children of baby boomers
forming fewer households – Immigration – Foreclosure rates down – Potential homebuyers
deferring purchasing decisions – Hard to get credit even for
highly creditworthy borrowers – Vacancies remain around 4.5%
with most new capacity being absorbed.
Source: FMI Third Quarter Outlook 2015

21 ACEC of Minnesota | Trends Presentation Vertical Markets | October 27, 2015 © 2015 FMI Corporation
U.S. Lodging Construction
• Our latest forecast expects growth to slow to just 15%, after reaching 20% in 2014.
• Baby boomers are the largest group of nonbusiness travelers. • Room starts are increasing. • Occupancy rates and RevPar are up. • According to Lodging Econometrics,
the pipeline “has shown seven consecutive quarters of growth.” Most hotels in the planning phase are upscale and large luxury properties.
Source: FMI Third Quarter Outlook 2015

22 ACEC of Minnesota | Trends Presentation Vertical Markets | October 27, 2015 © 2015 FMI Corporation
U.S. Office Construction • Office construction has slowed since reaching 21% in 2014, but the current
rate of 15% growth for 2015 continues to show that there is still steam in the office construction recovery.
• According to the National Association of Realtors, “Office construction has slowed since reaching 21% in 2014, but the current rate of 15% growth for 2015 continues to show that there is still steam in the office construction recovery. ”
• New office space is being absorbed at a faster rate than existing office space with rent increases falling back somewhat.
• CBRE reports, “The national gross asking lease rate for office space increased by 1.9% to $28.65 in the first quarter of 2015.”
Source: FMI Third Quarter Outlook 2015
23 ACEC of Minnesota | Trends Presentation Vertical Markets | October 27, 2015 © 2015 FMI Corporation
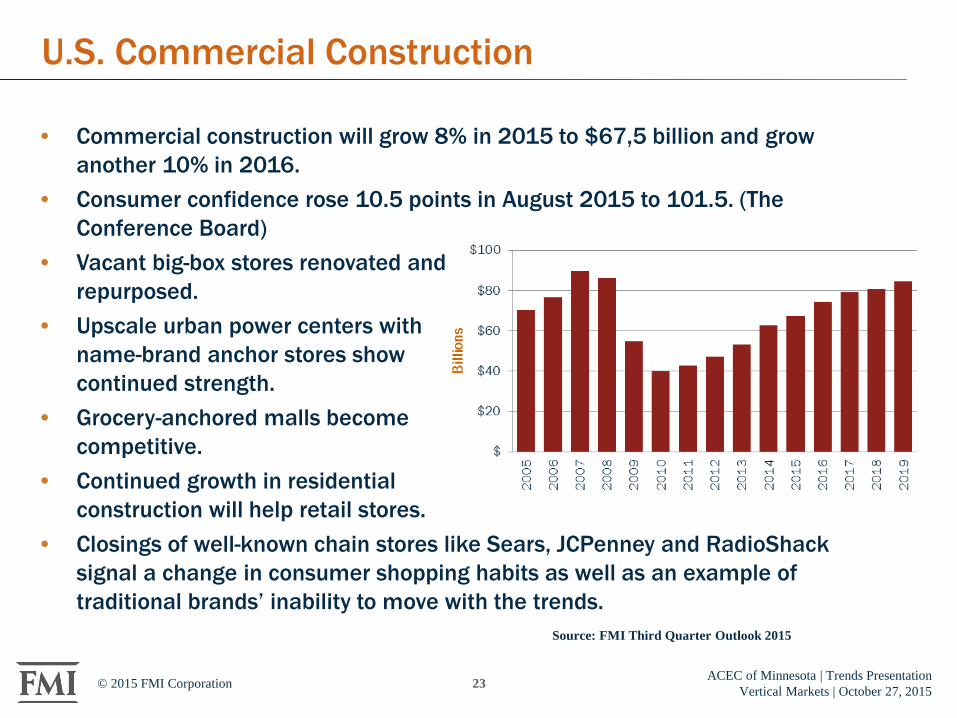
U.S. Commercial Construction
• Commercial construction will grow 8% in 2015 to $67,5 billion and grow another 10% in 2016.
• Consumer confidence rose 10.5 points in August 2015 to 101.5. (The Conference Board)
• Vacant big-box stores renovated and repurposed.
• Upscale urban power centers with name-brand anchor stores show continued strength.
• Grocery-anchored malls become competitive.
• Continued growth in residential construction will help retail stores.
• Closings of well-known chain stores like Sears, JCPenney and RadioShack signal a change in consumer shopping habits as well as an example of traditional brands’ inability to move with the trends.
Source: FMI Third Quarter Outlook 2015

24 ACEC of Minnesota | Trends Presentation Vertical Markets | October 27, 2015 © 2015 FMI Corporation
U.S. Health Care Construction
• Health care construction is returning to a more historical growth rate for 2015 through our forecast horizon of 2019.
• Health care construction will use more modern construction techniques, such as prefabrication, BIM and IPD (integrated project delivery).
• VA hospitals rocked by poor management and patient care, old facilities and huge construction cost overruns. • Trending toward more ambulatory
care centers. • Trend toward rebuilding existing
facilities to use modern hospital design and allow for greater use of technology.
Source: FMI Third Quarter Outlook 2015
25 ACEC of Minnesota | Trends Presentation Vertical Markets | October 27, 2015 © 2015 FMI Corporation
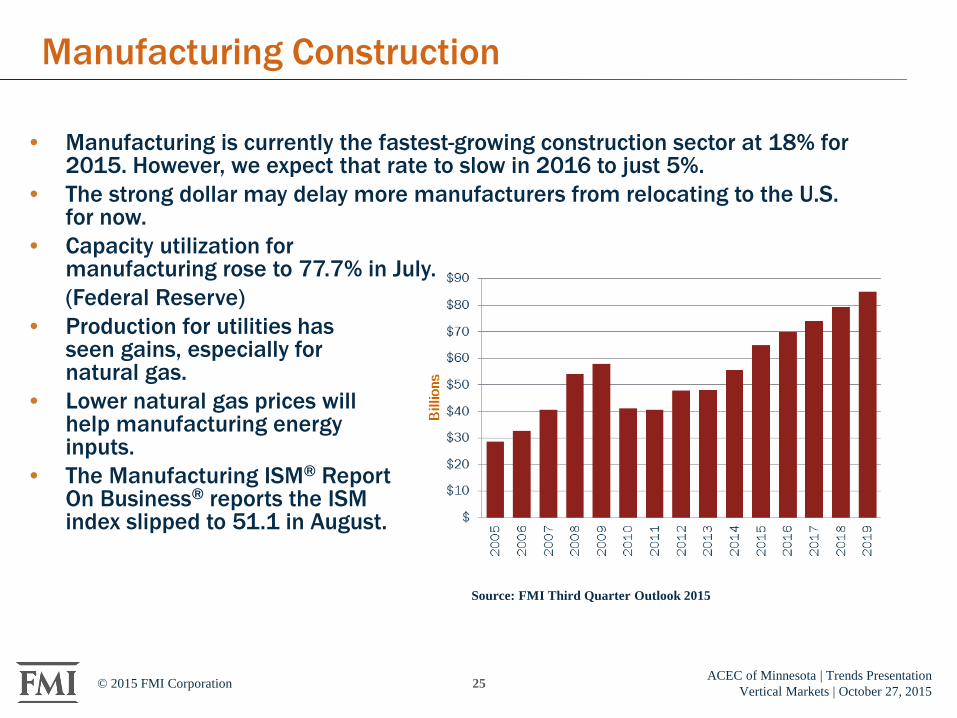
Manufacturing Construction
• Manufacturing is currently the fastest-growing construction sector at 18% for 2015. However, we expect that rate to slow in 2016 to just 5%.
• The strong dollar may delay more manufacturers from relocating to the U.S. for now.
• Capacity utilization for manufacturing rose to 77.7% in July.
(Federal Reserve) • Production for utilities has
seen gains, especially for natural gas.
• Lower natural gas prices will help manufacturing energy inputs.
• The Manufacturing ISM® Report On Business® reports the ISM index slipped to 51.1 in August.
Source: FMI Third Quarter Outlook 2015
26 ACEC of Minnesota | Trends Presentation Vertical Markets | October 27, 2015 © 2015 FMI Corporation
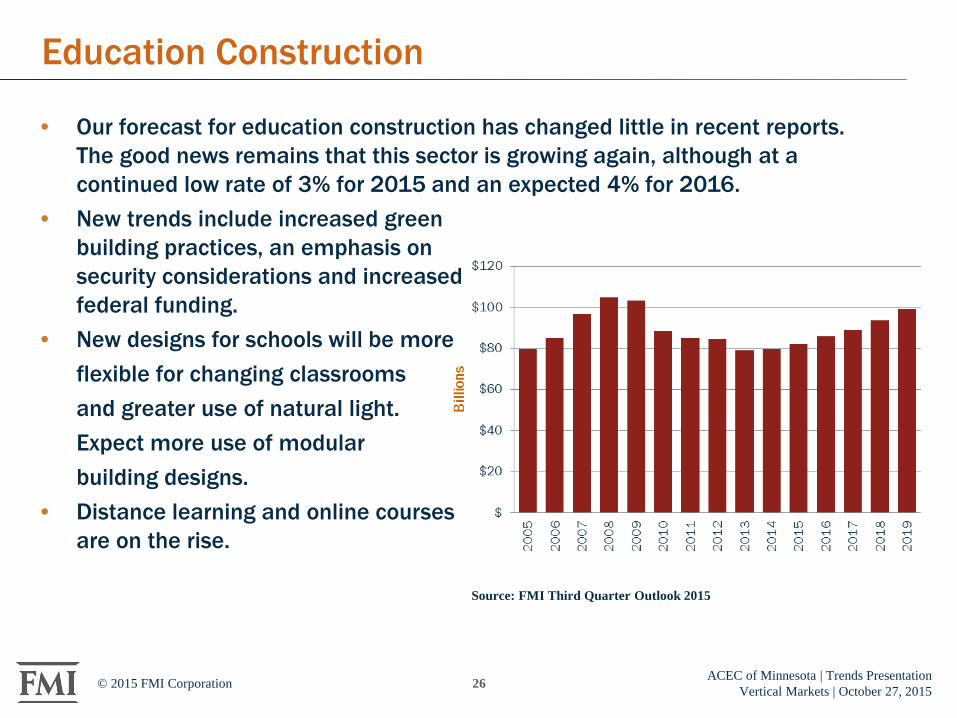
Education Construction
• Our forecast for education construction has changed little in recent reports. The good news remains that this sector is growing again, although at a continued low rate of 3% for 2015 and an expected 4% for 2016.
• New trends include increased green building practices, an emphasis on security considerations and increased federal funding.
• New designs for schools will be more flexible for changing classrooms and greater use of natural light. Expect more use of modular building designs. • Distance learning and online courses
are on the rise.
Source: FMI Third Quarter Outlook 2015

27 ACEC of Minnesota | Trends Presentation Vertical Markets | October 27, 2015 © 2015 FMI Corporation
State Forecast: Minnesota
28 ACEC of Minnesota | Trends Presentation Vertical Markets | October 27, 2015 © 2015 FMI Corporation
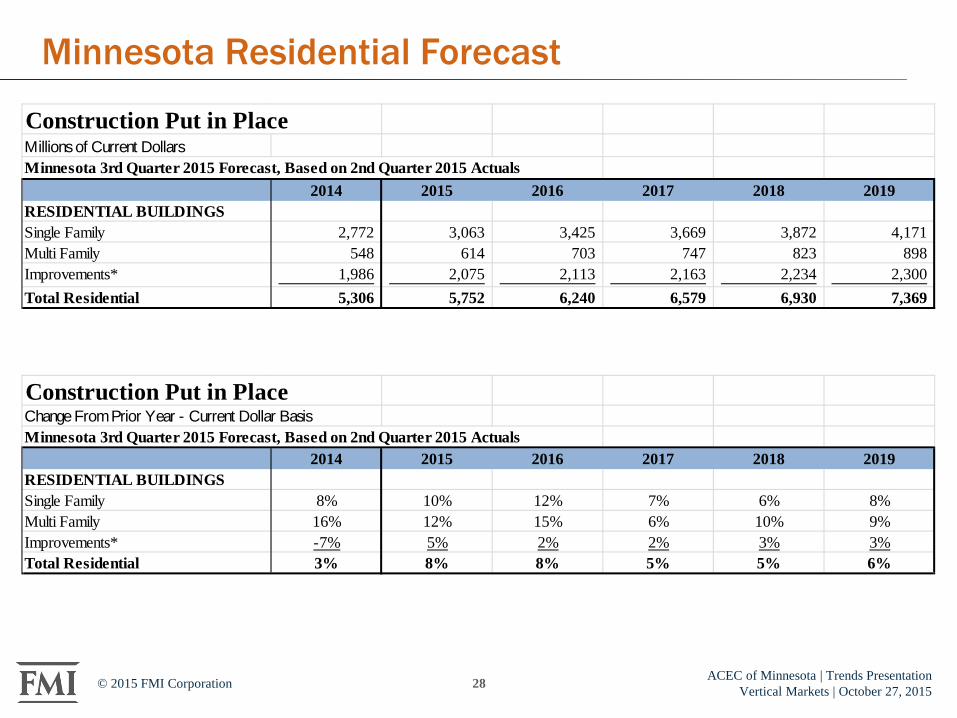
Minnesota Residential Forecast
Construction Put in PlaceMillions of Current DollarsMinnesota 3rd Quarter 2015 Forecast, Based on 2nd Quarter 2015 Actuals
2014 2015 2016 2017 2018 2019RESIDENTIAL BUILDINGSSingle Family 2,772 3,063 3,425 3,669 3,872 4,171 Multi Family 548 614 703 747 823 898 Improvements* 1,986 2,075 2,113 2,163 2,234 2,300 Total Residential 5,306 5,752 6,240 6,579 6,930 7,369
Construction Put in PlaceChange From Prior Year - Current Dollar BasisMinnesota 3rd Quarter 2015 Forecast, Based on 2nd Quarter 2015 Actuals
2014 2015 2016 2017 2018 2019RESIDENTIAL BUILDINGSSingle Family 8% 10% 12% 7% 6% 8%Multi Family 16% 12% 15% 6% 10% 9%Improvements* -7% 5% 2% 2% 3% 3%Total Residential 3% 8% 8% 5% 5% 6%
29 ACEC of Minnesota | Trends Presentation Vertical Markets | October 27, 2015 © 2015 FMI Corporation
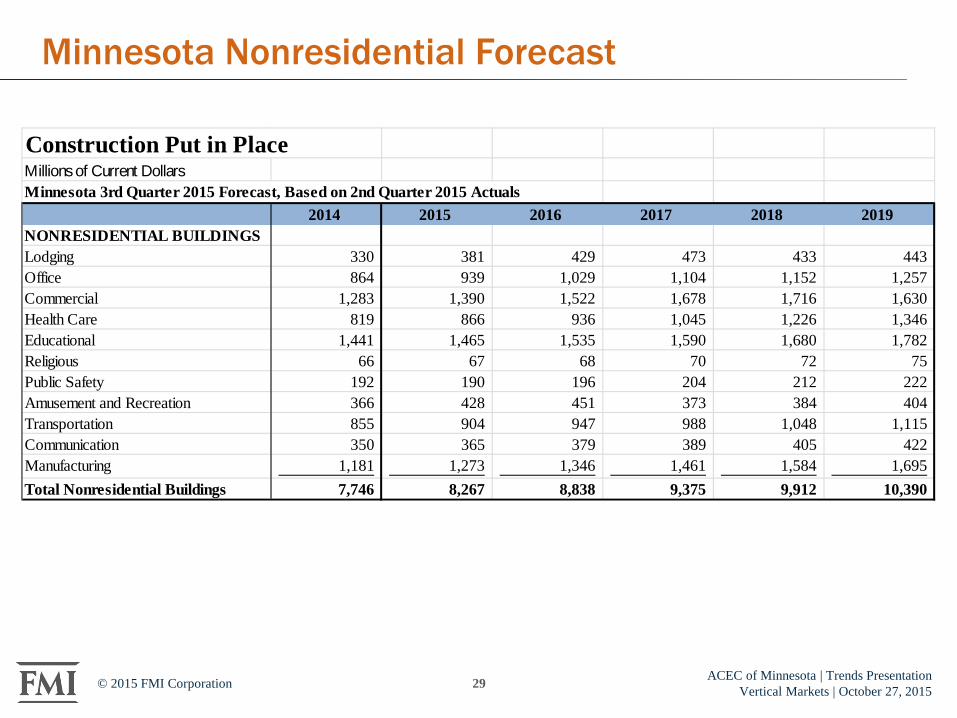
Minnesota Nonresidential Forecast
Construction Put in PlaceMillions of Current DollarsMinnesota 3rd Quarter 2015 Forecast, Based on 2nd Quarter 2015 Actuals
2014 2015 2016 2017 2018 2019NONRESIDENTIAL BUILDINGSLodging 330 381 429 473 433 443 Office 864 939 1,029 1,104 1,152 1,257 Commercial 1,283 1,390 1,522 1,678 1,716 1,630 Health Care 819 866 936 1,045 1,226 1,346 Educational 1,441 1,465 1,535 1,590 1,680 1,782 Religious 66 67 68 70 72 75 Public Safety 192 190 196 204 212 222 Amusement and Recreation 366 428 451 373 384 404 Transportation 855 904 947 988 1,048 1,115 Communication 350 365 379 389 405 422 Manufacturing 1,181 1,273 1,346 1,461 1,584 1,695 Total Nonresidential Buildings 7,746 8,267 8,838 9,375 9,912 10,390

30 ACEC of Minnesota | Trends Presentation Vertical Markets | October 27, 2015 © 2015 FMI Corporation
Minnesota Nonresidential Forecast
Construction Put in PlaceChange From Prior Year - Current Dollar BasisMinnesota 3rd Quarter 2015 Forecast, Based on 2nd Quarter 2015 Actuals
2014 2015 2016 2017 2018 2019NONRESIDENTIAL BUILDINGSLodging 19% 15% 12% 10% -8% 2%Office 10% 9% 10% 7% 4% 9%Commercial 17% 8% 9% 10% 2% -5%Health Care -2% 6% 8% 12% 17% 10%Educational 0% 2% 5% 4% 6% 6%Religious -10% 0% 3% 2% 3% 4%Public Safety -2% -1% 3% 4% 4% 5%Amusement and Recreation 13% 17% 5% -17% 3% 5%Transportation 5% 6% 5% 4% 6% 6%Communication -5% 4% 4% 3% 4% 4%Manufacturing 13% 8% 6% 9% 8% 7%Total Nonresidential Buildings 7% 7% 7% 6% 6% 5%

31 ACEC of Minnesota | Trends Presentation Vertical Markets | October 27, 2015 © 2015 FMI Corporation
Local Trends by Market Sector Metro: Minneapolis

32 ACEC of Minnesota | Trends Presentation Vertical Markets | October 27, 2015 © 2015 FMI Corporation
Economic Outlook
• Leading Indicators: – Moody’s Economy.com forecast is extremely optimistic
for metro Minneapolis-St. Paul. – Population growth is expected to average nearly 40,000
per year (1.1%) from 2015-2019. – Jobs are forecast by an average of 42,500 (2.2%) per
year from 2015 from 2017. • Job growth is slowing, but it isn’t due to a shortage of openings,
but rather by a shortage of workers. • By 2017, there may not be enough unemployed workers left.
33 ACEC of Minnesota | Trends Presentation Vertical Markets | October 27, 2015 © 2015 FMI Corporation
In the News
• Permitting – On September 23, 2015, the department of Community
Planning and Economic Development announced that Minneapolis exceeded $1 Billion in new construction permits issued. This marked the fourth consecutive year reaching this mark.
– Total permits issued in 2014 surpassed $2 Billion. The decrease in 2015 is expected, as the new U.S. Bank Stadium, Wells Fargo & Co. office towers, and surrounding developments acquired most of their permits in 2014.

34 ACEC of Minnesota | Trends Presentation Vertical Markets | October 27, 2015 © 2015 FMI Corporation
In the News
• Permitting – The top five 2015 construction projects in Minneapolis
by building permit valuation were as follows: • Downtown East: $79,896,867 • Embassy Suites Hotel: $50,868,521 • Xcel Energy Headquarters: $44,363,000 • Portland Towers: $38,746,656 • Greystar Apartments: $35,966,000
“City officials anticipate that several large projects in the approval pipeline will be permitted in the coming weeks.”

35 ACEC of Minnesota | Trends Presentation Vertical Markets | October 27, 2015 © 2015 FMI Corporation
Multifamily Residential Market
• Rents – During the 2nd Quarter of 2015, the average asking rent
in metro Minneapolis was $1,118. This represented the fastest growth in the Midwest, and twelfth most rapid in the nation
– Rents have increased every quarter since Q2 2010 – Average rents in 2015 are expected to finish at $1,139.
• Vacancy – Vacancy drifted upwards by 30 basis points (Q2) to 3.2% – This is the highest level since year-end 2010 – 2015 is expected to finish at 3.7%
Source: REIS Observer. Metro Minneapolis. October 2, 2015.

36 ACEC of Minnesota | Trends Presentation Vertical Markets | October 27, 2015 © 2015 FMI Corporation
Multifamily Residential Market
• Supply and Demand – As of July 1,884 new apartments had completed
construction in 2015, outpacing the 1,367 units of net absorption.
– Another 1,137 apartments were completed in August and September, leaving 4,130 units under construction.
– These units have been spread widely around the metro area, with only 687 units under construction in central Minneapolis.

37 ACEC of Minnesota | Trends Presentation Vertical Markets | October 27, 2015 © 2015 FMI Corporation
Retail Market
• Economic Factors – “After posting modest numbers for two consecutive
quarters, the MSP Retail Market is being prepped for what could be an explosion of new retail space in the near future.”
– Vacancy rate is expected to keep falling to 11.3% at year-end 2015, and 9.3% at year-end 2019.
– Rent gains of 1.0% this year are expected to increase to between 2% and 3% in the coming years.

38 ACEC of Minnesota | Trends Presentation Vertical Markets | October 27, 2015 © 2015 FMI Corporation
Retail Market
• Construction – Through July, 177,300 SF of new neighborhood center
space was delivered in 2015. – The 90,000 SF Hy-Vee project completed in September,
leaving 340,000 SF of neighborhood space under construction.
– 2.7 Million SF of new space is planned in the power center markets (including Ridgedale Center and Mall of America).
Source: CBRE Retail Market Overview, Q2, 2015.

39 ACEC of Minnesota | Trends Presentation Vertical Markets | October 27, 2015 © 2015 FMI Corporation
Industrial Market
• Economic Factors – Q3 2015 marked the 21st
consecutive quarter of positive absorption for the Minneapolis/St. Paul industrial market.
– According to CBRE Research, there is roughly 12.2 million sq. ft. of planned/scheduled construction being considered across the metro.
– The largest deal of the quarter was the 185,500- sq.-ft. renewal of Data Recognition Corporation in 7300 Northland Drive in Brooklyn Park.

40 ACEC of Minnesota | Trends Presentation Vertical Markets | October 27, 2015 © 2015 FMI Corporation
Industrial Market
• Construction – At total of eight projects
comprised the 1.2 Million SF delivered in Q3 2015, of which 77% was located in the Northwest submarket.
– Since the beginning of 2014, the market has had approximately 2.7 Million SF of product delivered, roughly 70% of which is still available.
– Developers are now starting to pull back, with just 425,000 SF of industrial space currently under construction.

41 ACEC of Minnesota | Trends Presentation Vertical Markets | October 27, 2015 © 2015 FMI Corporation
Office Market
• Economics – Rent gains have been weak as of late, rising only 1% in
2015. – However, gains are anticipated to be strong in the
coming years, with effective rent rising around 4.0% in 2017, and 5% in 2019.
– The vacancy rate is forecast to end next year at 15.5% and 2019 at just 13.0%.
42 ACEC of Minnesota | Trends Presentation Vertical Markets | October 27, 2015 © 2015 FMI Corporation
Office Market
• Construction – Multi-tenant development has been picking up as of late,
with 1.68 Million SF of space under construction. – Reis predicts an active year for 2016, with nearly 1.6
Million SF of new supply, and 1.7 Million SF of net absorption.

43 ACEC of Minnesota | Trends Presentation Vertical Markets | October 27, 2015 © 2015 FMI Corporation
Brian Dwyer Consultant
FMI Corporation 210 University Boulevard Suite 800 Denver, CO 80206 Tel: 303.398.7239 Email: [email protected]
www.fminet.com

44 ACEC of Minnesota | Trends Presentation Vertical Markets | October 27, 2015 © 2015 FMI Corporation
ABOUT FMI FMI is a leading provider of management consulting, investment banking* and research to the engineering and construction industry. We work in all segments of the industry providing clients with value-added business solutions, including:
• Strategic Advisory • Market Research and Business Development • Leadership and Talent Development • Project and Process Improvement • Mergers, Acquisitions and Financial Consulting* • Compensation Benchmarking and Consulting • Risk Management Consulting
Founded by Dr. Emol A. Fails in 1953, FMI has professionals in offices across the United States. FMI delivers innovative, customized solutions to contractors, construction materials producers, manufacturers and suppliers of building materials and equipment, owners and developers, engineers and architects, utilities and construction industry trade associations. FMI is an advisor you can count on to build and maintain a successful business, from your leadership to your site managers. *Investment banking services provided by FMI Capital Advisors, Inc., a registered broker-dealer and whollyowned subsidiary of FMI.