Market Outlook Q2 201 7 · 2018-06-29 · × Long government funds led the ... Most importantly, we...
14
? Market Outlook Q2 2017 Talking Points × The S&P 500 gained 3.09% during the second quarter. × Healthcare, financial services and industrials stocks outperformed during the quarter. × Energy and communication services stocks finished the quarter in the red. × The market-cap-weighted price/fair value estimate ratio for our equity analysts' coverage universe is 1.05, suggesting that the market overall is slightly overvalued. × Energy is currently the most undervalued sector, with a price/fair value estimate ratio of 0.96. Basic materials remains the most overvalued sector, with a price/fair value estimate of 1.24. × The large growth category led the pack this quarter among style-based fund categories, while small value lagged. × Most international-equity Morningstar Categories enjoyed strong gains during the quarter, with the exception of Latin America stock funds. × Long government funds led the fixed-income pack during the quarter. Morningstar, Inc. Contents 1 Talking Points 2 Stock Market Outlook: Equity Valuations Look Lofty 4 Second Quarter in U.S. Stock Funds: Growth on Fire 6 International-Stock Funds Continue to Prosper 8 Bonds In The Second Quarter: The Flattening 10 Index Returns 11 Fund Category Returns
Transcript of Market Outlook Q2 201 7 · 2018-06-29 · × Long government funds led the ... Most importantly, we...

?
Market Outlook Q2 2017
Talking Points
× The S&P 500 gained 3.09% during the second quarter.
× Healthcare, financial services and industrials stocks outperformed during the quarter.
× Energy and communication services stocks finished the quarter in the red.
× The market-cap-weighted price/fair value estimate ratio for our equity analysts' coverage universe is
1.05, suggesting that the market overall is slightly overvalued.
× Energy is currently the most undervalued sector, with a price/fair value estimate ratio of 0.96. Basic
materials remains the most overvalued sector, with a price/fair value estimate of 1.24.
× The large growth category led the pack this quarter among style-based fund categories, while small
value lagged.
× Most international-equity Morningstar Categories enjoyed strong gains during the quarter, with the
exception of Latin America stock funds.
× Long government funds led the fixed-income pack during the quarter.
Morningstar, Inc.
Contents 1 Talking Points 2 Stock Market Outlook:
Equity Valuations Look Lofty 4 Second Quarter in U.S. Stock Funds:
Growth on Fire 6 International-Stock Funds Continue to Prosper 8 Bonds In The Second Quarter: The
Flattening 10 Index Returns 11 Fund Category Returns

Market Outlook | 11 July 2017
Page 2 of 14
Stock Market Outlook: Equity Valuations Look Lofty It's getting harder to find undervalued stocks with so much optimism factored into stock prices.
× The Morningstar Global Markets Index has returned more than 11.72% year to date and 18.68% over
the past year.
× The market-cap-weighted price/fair value estimate ratio for our equity analysts' coverage universe
is 1.05.
× Energy is currently the most undervalued sector, with a price/fair value estimate ratio of 0.96. Basic
materials remains the most overvalued sector, with a price/fair value estimate ratio of 1.24.
In April Morningstar equity analysts began incorporating expected U.S. tax reform into valuation model
assumptions. We currently believe that U.S. corporate tax reform is more likely than not to occur during
the Trump administration, despite continued delays to the administration's agenda on other legislative
items such as repeal of the Affordable Care Act.
The assumptions that we will use in our valuation models are based on Trump's and the House
Republican plans but modified for what we believe are reasonable compromises needed for tax reform
to occur. Most importantly, we are only incorporating a U.S. federal corporate tax cut down to 25%
instead of 20% or 15%. As a reminder, the Trump administration's proposal calls for a 15% tax rate.
Our more shallow tax cut assumption when combined with our other policy assumptions make the
reform package close to budget-neutral on a dynamic basis. Largely offsetting the federal revenue loss
from the headline tax cut is the elimination of corporate tax credits (excluding research and
development), a one-time tax revenue gain from a tax on cash held overseas, and additional tax revenue
from near-term economic growth stimulated by tax reform.
Healthcare reform in the U.S. has dominated popular headlines. Our equity analysts' view is that should
the Senate's healthcare bill become law, it should be a net positive for pharmaceutical and device firms
and a mixed impact for hospitals and managed care firms. Pharmaceutical and device firms currently
face various fees and taxes that would be eliminated under the proposed American Health Care Act,
while hospitals and managed care firms could suffer from volume declines that would be offset by the
eliminations of regulations and fees.
That said, there are challenges still to translating the House's and Senate's healthcare bill into law. The
Senate Republicans' bill shares many similarities with the House GOP's, including the elimination of
mandates, the option for states to redefine essential benefits, and a move toward capping Medicaid
spending. Republicans control 52 seats in the Senate as well as the vice president's tie-breaking vote,
By Elizabeth Collins, CFA Published 6/28/17
Market Outlook | 11 July 2017
Page 3 of 14
but Republican senators from states that have expanded Medicaid face negative reactions from both
constituents as well as governors that would oppose capping Medicaid. While Republican leaders want
a vote on the bill as soon as possible, many individual senators are seeking delays so that they have time
to assess the wisest move forward for their political careers.
In late May, OPEC and certain other countries agreed to extend their oil production cuts by nine months.
The cuts makes sense, given that stocks within OECD countries are still 13% above the top of the 2010-
14 range. Although the production cuts could help meet the objective of bringing inventories into the
targeted range, the cartel might pay a steep long-term price for any near-term benefit.
Our equity analysts believe the cartel is underestimating the ability of shale producers in the U.S. to
rapidly increase volumes in a $50-$55/bbl environment (West Texas Intermediate). Our energy sector
team's 2018 and midcycle forecasts for WTI are still $45/bbl and $55/bbl, respectively, compared with
spot prices around $44 per barrel these days.
Meanwhile, investor demand continues to prop up gold prices at $1,200 to $1,300 per ounce, with ETF
gold holdings largely recovered to levels last seen before the December 2016 rate hike. But as the
Federal Reserve continues to pursue rate increases, prices look primed to fall. Additional rate hikes by
the Fed would further discourage investor flows into gold and have the potential to unleash
accumulated ETF holdings back into the market, pressuring prices. Longer term, we're more optimistic,
as we expect rising Chinese and Indian jewelry demand to fill the gap of shrinking investor demand for
the yellow metal. K

Market Outlook | 11 July 2017
Page 4 of 14
First Quarter U.S. Equity Funds: Growth Dominates Value Growth funds and technology dominated, while value and energy struggled.
As the second quarter winds to a close, the market still favors U.S. equity funds. Eight of the nine
Morningstar Style Box categories have posted solid gains for the quarter to date through June 27, with
small value’s slightly negative quarter-to-date category return the outlier.
U.S. growth equity funds have continued to dominate value offerings in 2017, reversing the pattern seen
in 2016. Large-growth was the top-performing diversified U.S. equity Morningstar Category for both the
quarter and year to date as of late June, with mid- and small-growth not far behind. Strong performance
in growth-oriented sectors, including technology, fueled big rewards for many funds, though tech stocks
pulled back a bit toward quarter-end.
The energy sector, a value haven and market darling in 2016, changed course in 2017 as oil prices slid
during the quarter. Commodity-related stocks, such as precious metals and natural resources, also were
losers in this short span. Financials stocks, which had a big tailwind in late 2016 on optimism about the
potential for less regulation under the Trump administration, also cooled off.
Winners
Morgan Stanley Institutional Growth MSEQX, which holds nearly half of its assets in technology stocks,
was up almost 11% for the quarter through June 27, landing at the top of the large-growth category—
quite different from its 2016 showing, when it posted a loss. Top position Tesla TSLA continued its
ascent, and about half of its holdings posted double-digit gains for the quarter.
Fidelity OTC FOCPX gained 9.4% for the quarter to date, more than doubling its Nasdaq Composite
benchmark as the Nasdaq-traded stocks it favors rallied.
T. Rowe Price Blue Chip Growth TRBCX and T. Rowe Price Institutional Large Cap Growth TRLGX landed
in the large-growth category’s top decile, getting an extra boost from out-of-benchmark Chinese Internet
names Tencent TCEHY and Alibaba BABA.
Fidelity Growth Company FDGRX benefited from a huge position in Nvidia NVDA—a holding since
2008—as well as a mix of smaller growth plays, including Wayfair W.
Baron Partners BPTRX, a mid-growth fund, was up more than 14% for the quarter to date through
June 27. Beyond a huge position in Tesla (18% of assets as of March), it also benefited from Zillow
Group ZG and Panera Bread PNRA, which surged after agreeing to a buyout with JAB Holdings during
the quarter.
By Katie Rushkewicz Reichart Published 6/29/17

Market Outlook | 11 July 2017
Page 5 of 14
Alger Small Cap Focus AOFIX was among the top small-cap finishers for the quarter, buoyed by Metidata
Solutions MDSO and Universal Display Corp OLED.
Losers
Among the funds that had a rougher go, Fairholme FAIRX lost more than 6% for the quarter to date
through June 27, as its Sears-related holdings continued to bleed.
Large-value fund Poplar Forest Partners IPFPX cooled off after a strong finish in 2016. A few holdings,
including MSC Industrial Direct MSM and Mattel MAT, posted double-digit losses for the quarter.
It’s unsurprising to see deep-value fund Hotchkis & Wiley Mid-Cap Value HWMIX land near the bottom
of its category for the quarter. Beyond its value leanings, it also held nearly 20% in energy, a clear
headwind for the period. K

Market Outlook | 11 July 2017
Page 6 of 14
International-Stock Funds Continue to Prosper Growth beats value overseas as it has in the United States.
International-stock funds encountered generally favorable conditions in the second quarter of 2017, just
as they did in the first quarter of the year.
The currency climate always plays a major role in the performance of funds that invest in foreign
equities. The vast majority of such funds normally hedge little or none of their exposure to foreign
currencies, so their returns suffer whenever the euro, British pound, Swiss franc, Japanese yen, and
other currencies depreciate versus the U.S. dollar.
But the inverse is also true, which helped boost returns for U.S.-based funds investing abroad. The euro
and the other major European currencies appreciated versus the U.S. dollar in the second quarter,
and stocks in most of the larger markets in the region posted modest to moderate gains amid improving
or positive macroeconomic and geopolitical developments, including the decisive and encouraging
election results in France. As a result, the typical Europe-stock fund returned 8.4% for the quarter
through June 28.
The Japanese yen did decline a little versus the U.S. dollar during the period, but that country's stocks
posted solid returns as the labor market improved and domestic demand and consumption
strengthened. The average Japan-stock offering, therefore, gained 6.5% in the quarter. The Chinese
renminbi has been fairly flat versus the U.S. dollar, and the other emerging-Asia currencies have posted
mixed results versus the greenback, while the equities in those markets have generally earned nice
gains. Thus, the typical China-region, Pacific/Asia ex-Japan, and diversified Pacific/Asia funds returned
8.6%, 8.1%, and 7.3%, respectively, for the quarter through June 28.
The currencies of many non-Asian markets in the developing world did not appreciate or depreciate very
markedly versus the U.S. dollar, and the stocks in those countries fared pretty well overall because of
generally good micro and macro conditions. Consequently, the typical diversified emerging-markets fund
returned 6.2% this quarter. Brazil was a notable exception, though, as its currency and stocks have
struggled because of political and other concerns. Consequently, the average Latin America fund, which
has nearly 60% of its assets in Brazilian equities, lost 2.6% for the quarter through June 28, which was
the worst performance of any international-stock Morningstar Category.
Foreign small/mid-cap and foreign large-cap funds—which invest approximately 45% to 60% of their
assets in Europe, 15% to 25% in Japan, and 5% to 15% in emerging markets—also posted pretty good
gains in the second quarter. Growth stocks handily outgained value stocks overseas during the period—
as was the case in the United States—while smaller caps returned somewhat more than large caps.
Thus, the average foreign small/mid-growth fund, which gained 9.4%, fared the best among these six
By William Samuel Rocco Published 7/3/17

Market Outlook | 11 July 2017
Page 7 of 14
categories of foreign-stock offerings, and the average foreign large-value fund, which returned 5.8%, did
the worst.
A number of prominent international-stock funds performed considerably better than their average peers
during the quarter. For example, Matthews Asia Growth MPACX, which has a Morningstar Analyst
Rating of Silver, benefited from its growth bias and its exposure to smaller caps as well as its managers'
stock selection, and it gained 2.9 percentage points more than the diversified Pacific/Asia norm of 7.3%
for the quarter through June 28. Bronze-rated Fidelity Emerging Markets FEMKX outpaced the
diversified emerging-markets average by more than 4 percentage points, because its growth-oriented
strategy and several of its technology holdings have paid off. And while the typical foreign large-growth
fund returned 9.1%, Silver-rated Artisan International ARTIX gained 11%, thanks to the strong
performance of many of its German and other European names.
Finally, several well-known foreign-stock funds lagged far behind their typical rivals for the quarter
through June 28. Bronze-rated Templeton Foreign TEMFX has been slowed by its large weightings and
stock selection in the weak energy and basic-materials sectors; it returned 3.7% whereas the average
foreign large-value gained 5.8%. Silver-rated Lazard Emerging Markets Equity LZEMX returned 3.7
percentage points less than the diversified emerging-markets norm of 6.2%, as several of its Russian and
other holdings have struggled. And although the typical foreign large-blend fund gained 7.2%, Gold-
rated Dodge & Cox International Stock DODFX returned 6.0%, hurt by the fact that it is more value-
oriented than most of its rivals, as well as by some of its Brazilian and other names. K

Market Outlook | 11 July 2017
Page 8 of 14
Bonds in the Second Quarter: The Flattening Despite a Fed rate hike, most Morningstar bond categories showed gains.
Nearly every taxable-bond Morningstar Category posted a positive return for the three months ended
June 30 as credit spreads tightened and the yield curve flattened.
The Fed and the Flattening Yield Curve
Long-term bonds did well last quarter as the yield curve flattened. The short end of the curve shifted up
as the Federal Reserve raised interest rates in June for the second time this year, but investor appetite
for Treasury bonds pushed the longer end of the curve down. The Fed also announced plans to reduce
the size of its balance sheet—meaning it would stop reinvesting coupon payments and eventually begin
selling bonds—but the market largely shrugged at the news. The yield on the 10-year finished the
quarter at 2.31%, down 9 basis points from the end of March. This dynamic was especially helpful for
funds with super long durations, such as Vanguard Long-Term Investment-Grade VWESX and PIMCO
Long Duration Total Return PLRIX, whose 13- and 14-year durations, respectively, pushed both funds’
returns up 5.0% and 4.7% for the quarter. Those funds’ long durations, however, are not the norm for
their categories and can cause wide performance swings.
The flattening curve also aided the Bloomberg Barclays U.S. Aggregate Bond Index, which gained 1.5%
for the quarter, in line with the second-quarter return for the average intermediate-bond fund. One of
the biggest winners in the intermediate-bond category was Western Asset Core Plus Bond WACPX,
which gained nearly 2.7%, as a longer-than-average duration, a sizable position in the Mexican peso,
and a short position on the Japanese yen paid off.
The worst-performing category was the inflation-protected bond group, which suffered a 0.5% loss on
average for the quarter. Ultrashort-bond and short-term government funds were also laggards but still
managed to post modest gains in the face of rising yields.
Spread Compression Continues
Credit spreads continued to tighten modestly this quarter following the Fed’s June rate hike. Through
June 23 the yield spread on the investment-grade Morningstar Corporate Bond Index had tightened 12
basis points from the start of 2017 to 116 basis points over a comparable Treasury bond, which is tighter
than its long-term average of 167 basis points. Most of that tightening (8 basis points) took place in the
second quarter, helping the average fund in the corporate-bond category to a gain of 2.3%. The average
fund in the corporate-bond category has a longer duration than the Aggregate Index, so the flattening
yield curve also played a role in the strong returns for the category. Funds in this category hold mostly
investment-grade corporates, but some hold sizable stakes in junk-rated corporates. Last quarter, AAA
and BBB rated bonds outperformed middle-quality investment-grade bonds and higher-quality junk
bonds fared better than lower quality junk bonds--again, largely because of the yield-curve dynamics as
higher-rated bonds are more interest-rate sensitive. MFS Corporate Bond MFBFX benefited from this
By Cara Esser, CFA Published 7/6/17

Market Outlook | 11 July 2017
Page 9 of 14
dynamic as its managers focus primarily on BBB and BB rated bonds. The fund’s 2.6% gain ranked just
outside the category’s best quartile for the quarter.
The average high-yield bond fund gained just 1.7% for the quarter. Funds that skewed higher quality
and had lower energy allocations tended to fare better, as higher-rated junk bonds outperformed lower-
quality offerings and as spreads on energy-related bonds widened after oil prices slid to a low of $43 per
barrel in June. The option-adjusted spread on the BofA Merrill Lynch U.S. High Yield Index widened in
June but managed to close the quarter lower than where it started (377 basis points over Treasuries as
of June 30 versus 392 basis points at the end of March). Vanguard High-Yield Corporate VWEHX landed
near the top of the high-yield peer group in the second quarter thanks to its more-conservative profile
and an overweighting in healthcare, which benefited from a strong quarter for pharmaceutical firms.
Continued Strength in Emerging Markets
Emerging-markets local-currency bonds were among the best-performing funds this quarter, with the
average fund in the category up 2.9%. Emerging-markets currencies have been on a tear this year, with
most posting positive returns for the year to date. The Mexican peso, up 7% for the quarter, gained
nearly 22% for the year to date. Other strong-performing currencies included the Polish zloty, Turkish lira,
and Czech koruna, each up more than 7% for the quarter. T. Rowe Price Emerging Markets Bond PREMX
gained 2.1% for the quarter, thanks in part to large allocations to both the Mexican peso and Turkish lira.
The Fed’s interest rate hike sent the U.S. dollar higher against some developed-markets currencies, most
notably the yen. Against the U.S. dollar, the euro strengthened significantly during the quarter. Within
the world-bond category, funds with larger allocations to emerging-markets currencies, and those with
small or no allocation to the yen, did particularly well, including Legg Mason Brandywine Global
Opportunities Bond GOBSX and Prudential Global Total Return GTRAX. They were each up more than
4.0% for the quarter, better than the world-bond average of 2.1%.
A Quiet Quarter for Munis
Extending the rally that began in early 2017, municipal bonds posted modest gains during the second
quarter against a backdrop of limited supply. Despite negative headlines out of Connecticut, Puerto Rico,
and Illinois, as well as uncertainty around tax reform and infrastructure spending, the average
intermediate-term muni fund gained 1.7% during the second quarter. Muni bonds across the quality
spectrum, across sectors, and in most states posted positive returns for the three months ended June
30. Longer-duration funds generally outperformed those with shorter durations because of the flattening
yield curve. High-yield muni-bond funds also performed well, up 2.2% for the quarter. Those that held
smaller allocations to troubled Puerto Rico performed even better, including American High-Income
Municipal Bond AMHIX, MFS Municipal High Income MMHYX, and BlackRock High Yield Municipal
MAYHX, each up 2.5% or more for the quarter. K

Market Outlook | 11 July 2017
Page 10 of 14
Index Returns
Source: Morningstar Direct. Data as of 6-30-17. 3-, 5-, and 10-year returns annualized.

Market Outlook | 11 July 2017
Page 11 of 14
Fund Category Returns
Source: Morningstar Direct. Data as of 6-30-17. 3-, 5-, and 10-year returns annualized.

Market Outlook | 11 July 2017
Page 12 of 14
Fund Category Returns (Continued)
Source: Morningstar Direct. Data as of 6-30-17. 3-, 5-, and 10-year returns annualized.
Market Outlook | 11 July 2017
Page 13 of 14
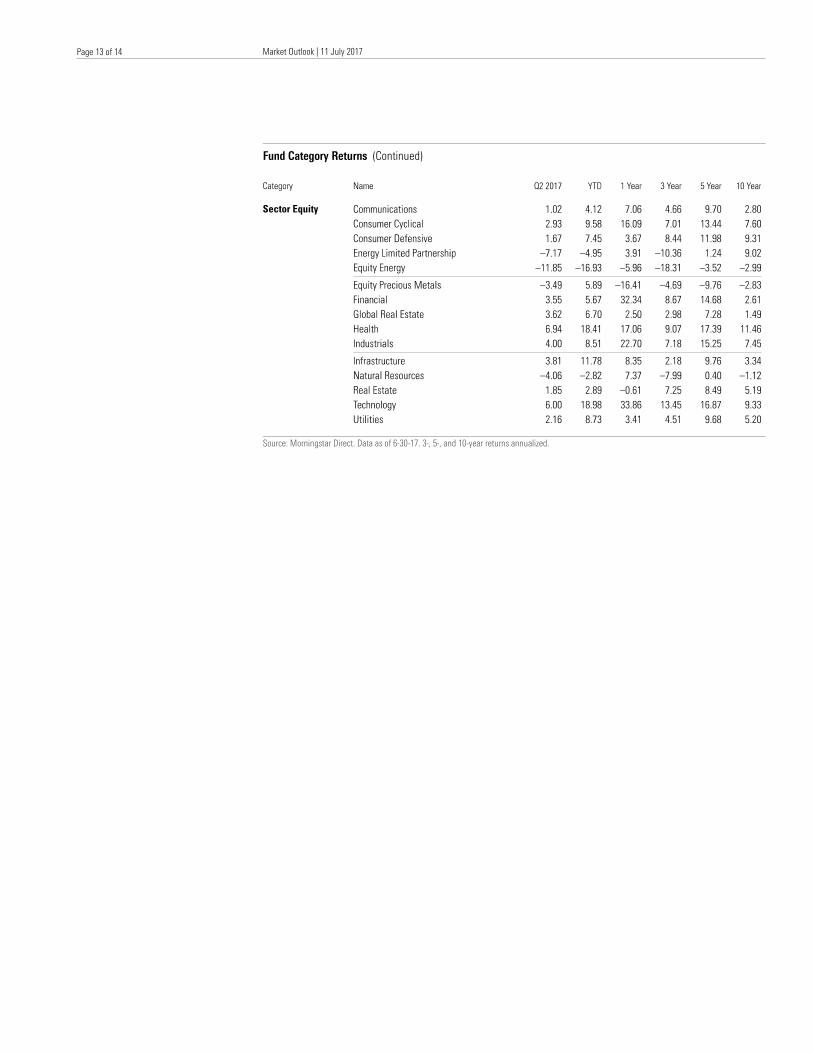
Fund Category Returns (Continued)
Source: Morningstar Direct. Data as of 6-30-17. 3-, 5-, and 10-year returns annualized.

Market Outlook | 11 July 2017
Page 14 of 14
About Morningstar
Morningstar, Inc. is a leading provider of independent investment research in North America,
Europe, Australia, and Asia. The company offers an extensive line of products and services for individual
investors, financial advisors, asset managers, and retirement plan providers and sponsors.
www.morningstar.com
?
22 West Washington Street
Chicago, IL 60602 USA
©2017 Morningstar. All Rights Reserved. Morningstar's Market Outlook is produced and offered by Morningstar, Inc., which is
not registered with the U.S. Securities and Exchange Commission as a Nationally Recognized Statistical Rating Organization
(“NRSRO”). Unless otherwise provided in a separate agreement, you may use this report only in the country in which its original
distributor is based. The information, data, analyses and opinions presented herein do not constitute investment advice; are
provided solely for informational purposes and therefore are not an offer to buy or sell a security; and are not warranted to be
correct, complete or accurate. The opinions expressed are as of the date written and are subject to change without notice. Except
as otherwise required by law, Morningstar shall not be responsible for any trading decisions, damages or other losses resulting
from, or related to, the information, data, analyses or opinions or their use. The information contained herein is the proprietary
property of Morningstar and may not be reproduced, in whole or in part, or used in any manner, without the prior written consent
of Morningstar. To order reprints, call +1 312-696-6100. To license the research, call +1 312-696-6869.