
Market Outlook 2018.pdf · Mid-cap was down 4.6% and small-cap by 3.1%. YTD, small and mid-cap has...
36
Market Outlook March 2018
Transcript of Market Outlook 2018.pdf · Mid-cap was down 4.6% and small-cap by 3.1%. YTD, small and mid-cap has...
Market Outlook
March 2018

EQUITY MARKET
Global equity market snapshot: February 2018
Source: Bloomberg, SBIMF Research
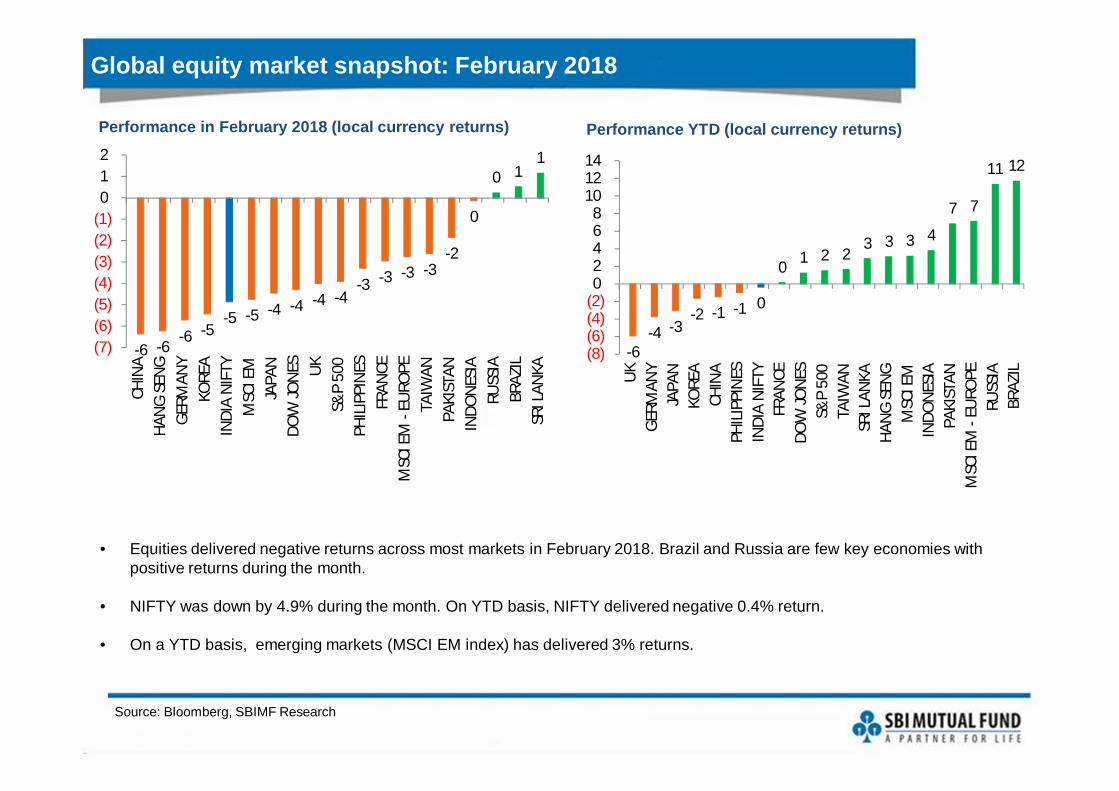
• Equities delivered negative returns across most markets in February 2018. Brazil and Russia are few key economies with positive returns during the month.
• NIFTY was down by 4.9% during the month. On YTD basis, NIFTY delivered negative 0.4% return.
• On a YTD basis, emerging markets (MSCI EM index) has delivered 3% returns.
Performance in February 2018 (local currency returns) Performance YTD (local currency returns)
-6 -6-6 -5
-5 -5 -4 -4 -4 -4-3 -3 -3 -3
-2
0
0 11
(7)(6)(5)(4)(3)(2)(1)012
CHIN
AHA
NG
SEN
GG
ERM
ANY
KORE
AIN
DIA
NIF
TYM
SCI E
MJA
PAN
DOW
JON
ES UK
S&P
500
PHIL
IPPI
NES
FRAN
CEM
SCI E
M -
EURO
PETA
IWAN
PAKI
STAN
INDO
NES
IARU
SSIA
BRAZ
ILSR
I LAN
KA
-6-4 -3
-2 -1 -1 0
0 1 2 23 3 3 4
7 7
11 12
(8)(6)(4)(2)02468
101214
UK
GER
MAN
YJA
PAN
KORE
ACH
INA
PHIL
IPPI
NES
INDI
A N
IFTY
FRAN
CEDO
W JO
NES
S&P
500
TAIW
ANSR
I LAN
KAHA
NG
SEN
GM
SCI E
MIN
DON
ESIA
PAKI
STAN
MSC
I EM
- EU
ROPE
RUSS
IABR
AZIL
Weaker FII traction in the emerging market equity in February
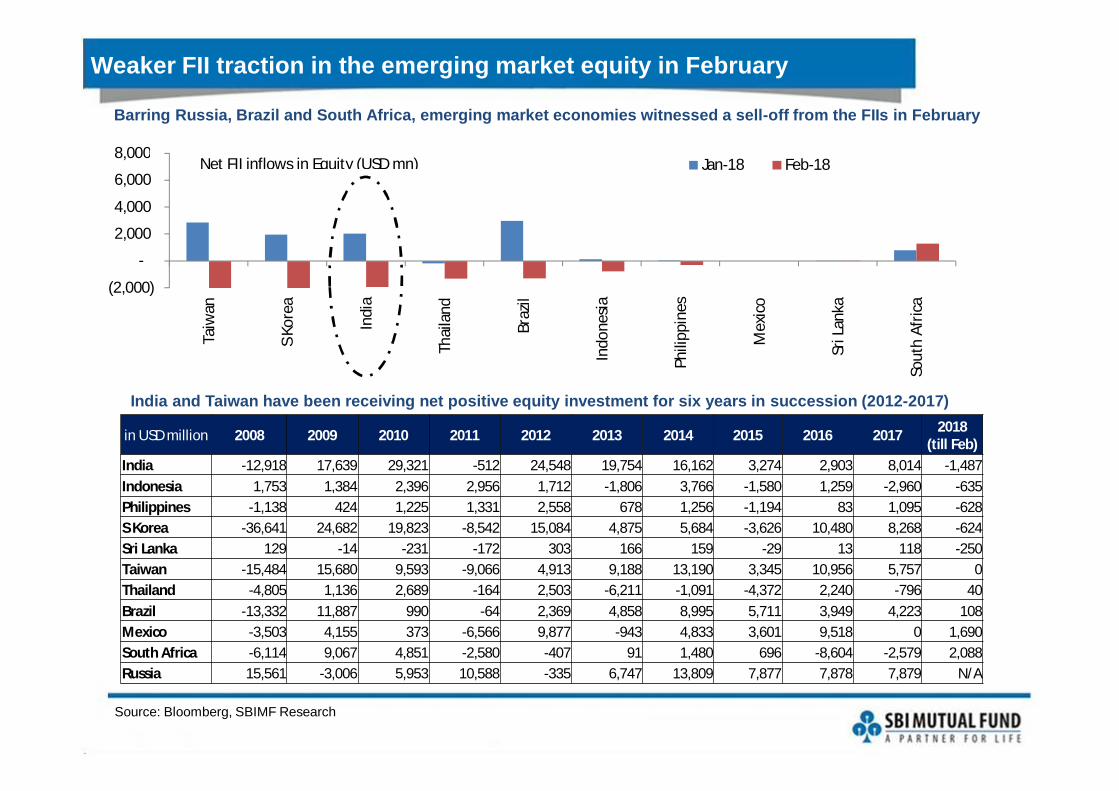
Barring Russia, Brazil and South Africa, emerging market economies witnessed a sell-off from the FIIs in February
Source: Bloomberg, SBIMF Research
(2,000)
-
2,000
4,000
6,000
8,000
Taiw
an
S Ko
rea
Indi
a
Thai
land
Braz
il
Indo
nesia
Phili
ppin
es
Mex
ico
Sri L
anka
Sout
h Af
rica
Jan-18 Feb-18Net FII inflows in Equity (USD mn)
in USD million 2008 2009 2010 2011 2012 2013 2014 2015 2016 2017 2018 (till Feb)
India -12,918 17,639 29,321 -512 24,548 19,754 16,162 3,274 2,903 8,014 -1,487Indonesia 1,753 1,384 2,396 2,956 1,712 -1,806 3,766 -1,580 1,259 -2,960 -635Philippines -1,138 424 1,225 1,331 2,558 678 1,256 -1,194 83 1,095 -628S Korea -36,641 24,682 19,823 -8,542 15,084 4,875 5,684 -3,626 10,480 8,268 -624Sri Lanka 129 -14 -231 -172 303 166 159 -29 13 118 -250Taiwan -15,484 15,680 9,593 -9,066 4,913 9,188 13,190 3,345 10,956 5,757 0Thailand -4,805 1,136 2,689 -164 2,503 -6,211 -1,091 -4,372 2,240 -796 40Brazil -13,332 11,887 990 -64 2,369 4,858 8,995 5,711 3,949 4,223 108Mexico -3,503 4,155 373 -6,566 9,877 -943 4,833 3,601 9,518 0 1,690South Africa -6,114 9,067 4,851 -2,580 -407 91 1,480 696 -8,604 -2,579 2,088Russia 15,561 -3,006 5,953 10,588 -335 6,747 13,809 7,877 7,878 7,879 N/A
India and Taiwan have been receiving net positive equity investment for six years in succession (2012-2017)
Indian stock market snapshot: February 2018
Performance in February 2018
Source: Bloomberg, SBIMF Research
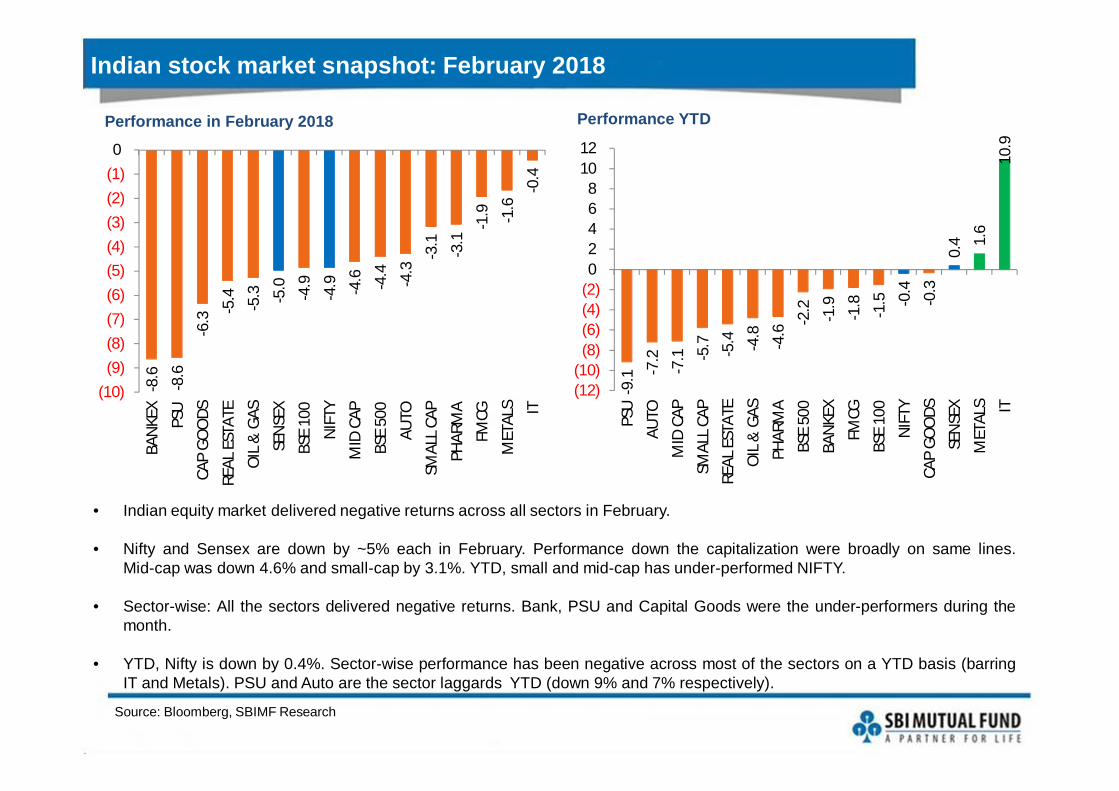
• Indian equity market delivered negative returns across all sectors in February.
• Nifty and Sensex are down by ~5% each in February. Performance down the capitalization were broadly on same lines.Mid-cap was down 4.6% and small-cap by 3.1%. YTD, small and mid-cap has under-performed NIFTY.
• Sector-wise: All the sectors delivered negative returns. Bank, PSU and Capital Goods were the under-performers during themonth.
• YTD, Nifty is down by 0.4%. Sector-wise performance has been negative across most of the sectors on a YTD basis (barringIT and Metals). PSU and Auto are the sector laggards YTD (down 9% and 7% respectively).
Performance YTD
-8.6
-8.6
-6.3 -5
.4 -5.3 -5
.0
-4.9
-4.9 -4.6 -4.4 -4.3
-3.1
-3.1
-1.9 -1.6
-0.4
(10)(9)(8)(7)(6)(5)(4)(3)(2)(1)0
BAN
KEX
PSU
CAP
GOO
DS
REAL
EST
ATE
OIL
& G
AS
SEN
SEX
BSE
100
NIF
TY
MID
CAP
BSE
500
AUTO
SMAL
L CA
P
PHAR
MA
FMCG
MET
ALS IT
-9.1 -7
.2
-7.1 -5
.7 -5.4 -4.8
-4.6
-2.2 -1.9
-1.8
-1.5 -0
.4
-0.3
0.4 1.
6
10.9
(12)(10)
(8)(6)(4)(2)02468
1012
PSU
AUTO
MID
CAP
SMAL
L CA
PRE
AL E
STAT
E
OIL
& G
AS
PHAR
MA
BSE
500
BAN
KEX
FMCG
BSE
100
NIF
TY
CAP
GOO
DSSE
NSE
X
MET
ALS IT
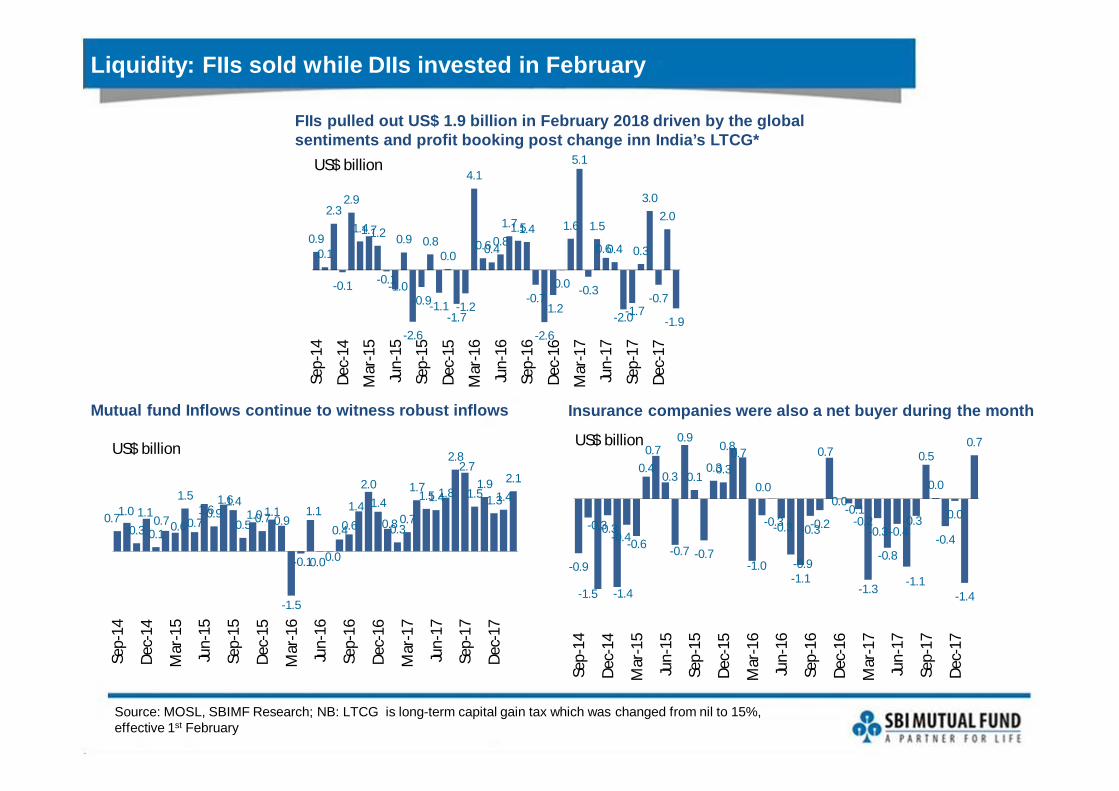
Liquidity: FIIs sold while DIIs invested in February
FIIs pulled out US$ 1.9 billion in February 2018 driven by the global sentiments and profit booking post change inn India’s LTCG*
Source: MOSL, SBIMF Research; NB: LTCG is long-term capital gain tax which was changed from nil to 15%, effective 1st February
Mutual fund Inflows continue to witness robust inflows Insurance companies were also a net buyer during the month
0.90.1
2.3
-0.1
2.9
1.41.71.2
-0.1-1.0
0.9
-2.6
-0.9
0.8
-1.1
0.0
-1.7-1.2
4.1
0.60.40.81.71.51.4
-0.7
-2.6
-1.2
0.0
1.6
5.1
-0.3
1.5
0.60.4
-2.0-1.7
0.3
3.0
-0.7
2.0
-1.9Se
p-14
Dec-
14
Mar
-15
Jun-
15
Sep-
15
Dec-
15
Mar
-16
Jun-
16
Sep-
16
Dec-
16
Mar
-17
Jun-
17
Sep-
17
Dec-
17
US$ billion
0.71.00.3
1.1
0.10.7 0.6
1.5
0.71.60.9
1.61.4
0.51.00.71.1
0.9
-1.5
-0.1
1.1
0.00.0
0.40.61.4
2.01.4
0.80.30.7
1.71.51.41.8
2.82.7
1.51.9
1.31.42.1
Sep-
14
Dec-
14
Mar
-15
Jun-
15
Sep-
15
Dec-
15
Mar
-16
Jun-
16
Sep-
16
Dec-
16
Mar
-17
Jun-
17
Sep-
17
Dec-
17
US$ billion
-0.9
-0.3
-1.5
-0.3
-1.4
-0.4-0.6
0.40.7
0.3
-0.7
0.9
0.1
-0.7
0.30.3
0.80.7
-1.0
-0.3
0.0
-0.3
-0.9-1.1
-0.3-0.2
0.7
0.0-0.1
-0.2
-1.3
-0.3
-0.8
-0.4
-1.1
-0.3
0.5
0.0
-0.4
0.0
-1.4
0.7
Sep-
14
Dec-
14
Mar
-15
Jun-
15
Sep-
15
Dec-
15
Mar
-16
Jun-
16
Sep-
16
Dec-
16
Mar
-17
Jun-
17
Sep-
17
Dec-
17
US$ billion
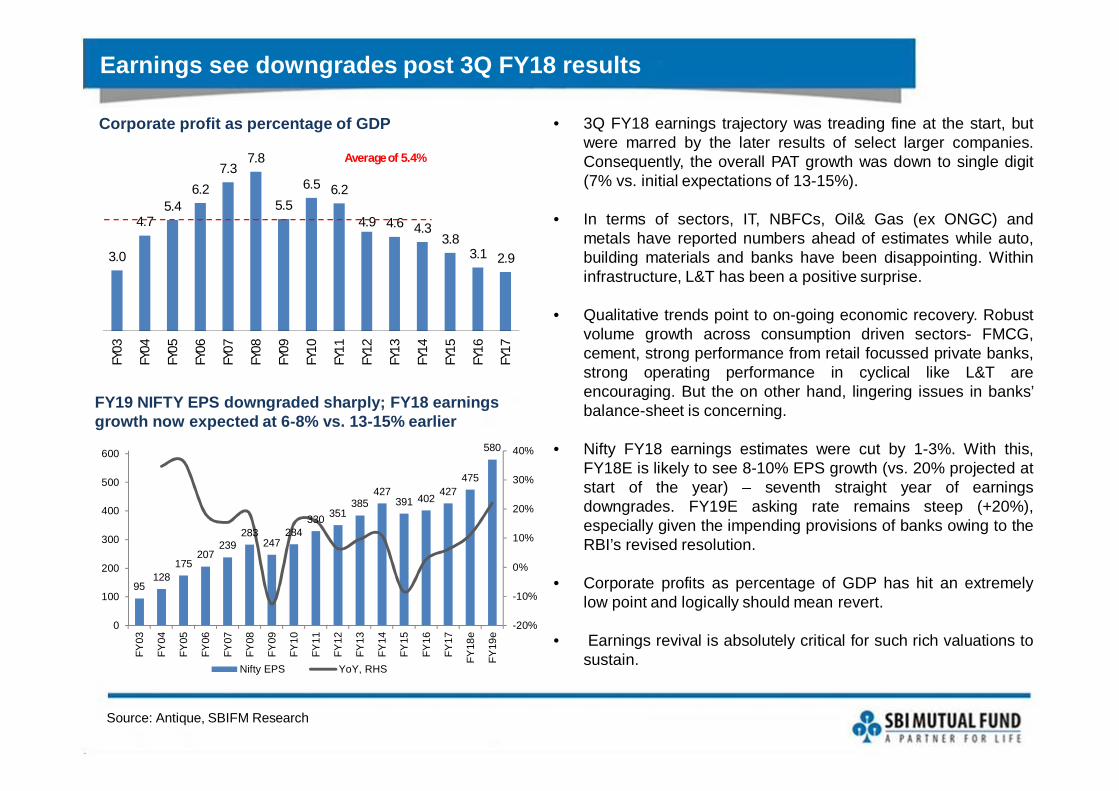
Earnings see downgrades post 3Q FY18 results
Source: Antique, SBIFM Research
FY19 NIFTY EPS downgraded sharply; FY18 earnings growth now expected at 6-8% vs. 13-15% earlier
• 3Q FY18 earnings trajectory was treading fine at the start, butwere marred by the later results of select larger companies.Consequently, the overall PAT growth was down to single digit(7% vs. initial expectations of 13-15%).
• In terms of sectors, IT, NBFCs, Oil& Gas (ex ONGC) andmetals have reported numbers ahead of estimates while auto,building materials and banks have been disappointing. Withininfrastructure, L&T has been a positive surprise.
• Qualitative trends point to on-going economic recovery. Robustvolume growth across consumption driven sectors- FMCG,cement, strong performance from retail focussed private banks,strong operating performance in cyclical like L&T areencouraging. But the on other hand, lingering issues in banks’balance-sheet is concerning.
• Nifty FY18 earnings estimates were cut by 1-3%. With this,FY18E is likely to see 8-10% EPS growth (vs. 20% projected atstart of the year) – seventh straight year of earningsdowngrades. FY19E asking rate remains steep (+20%),especially given the impending provisions of banks owing to theRBI’s revised resolution.
• Corporate profits as percentage of GDP has hit an extremelylow point and logically should mean revert.
• Earnings revival is absolutely critical for such rich valuations tosustain.
3.0
4.75.4
6.27.3
7.8
5.56.5 6.2
4.9 4.6 4.33.8
3.1 2.9
FY03
FY04
FY05
FY06
FY07
FY08
FY09
FY10
FY11
FY12
FY13
FY14
FY15
FY16
FY17
Average of 5.4%
Corporate profit as percentage of GDP
95128
175207
239283
247284
330 351385
427391 402 427
475
580
-20%
-10%
0%
10%
20%
30%
40%
0
100
200
300
400
500
600
FY03
FY04
FY05
FY06
FY07
FY08
FY09
FY10
FY11
FY12
FY13
FY14
FY15
FY16
FY17
FY18
e
FY19
e
Nifty EPS YoY, RHS
Source: CMIE economic outlook, SBIMF Research,
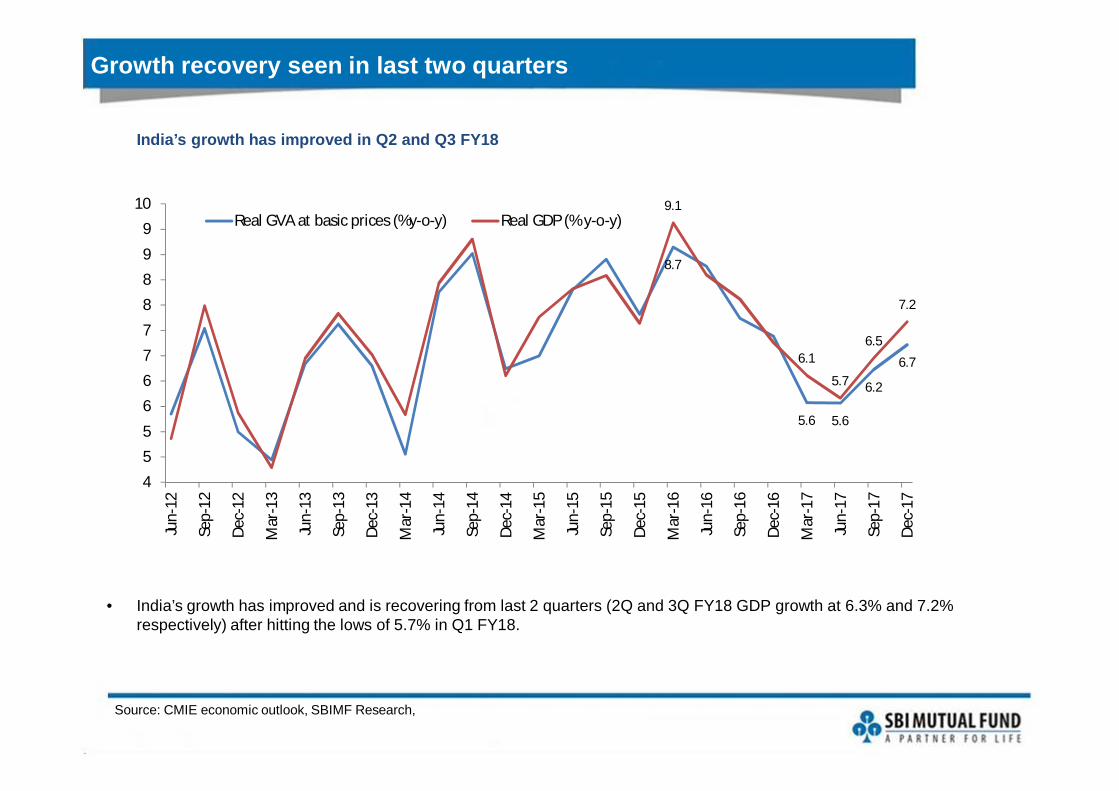
Growth recovery seen in last two quarters
India’s growth has improved in Q2 and Q3 FY18
8.7
5.6 5.6
6.2
6.7
9.1
6.1
5.7
6.5
7.2
4
55
667
7
8
89
9
10
Jun-
12
Sep-
12
Dec-
12
Mar
-13
Jun-
13
Sep-
13
Dec-
13
Mar
-14
Jun-
14
Sep-
14
Dec-
14
Mar
-15
Jun-
15
Sep-
15
Dec-
15
Mar
-16
Jun-
16
Sep-
16
Dec-
16
Mar
-17
Jun-
17
Sep-
17
Dec-
17
Real GVA at basic prices (%y-o-y) Real GDP (% y-o-y)
• India’s growth has improved and is recovering from last 2 quarters (2Q and 3Q FY18 GDP growth at 6.3% and 7.2% respectively) after hitting the lows of 5.7% in Q1 FY18.
Source: CMIE economic outlook, SBIMF Research,
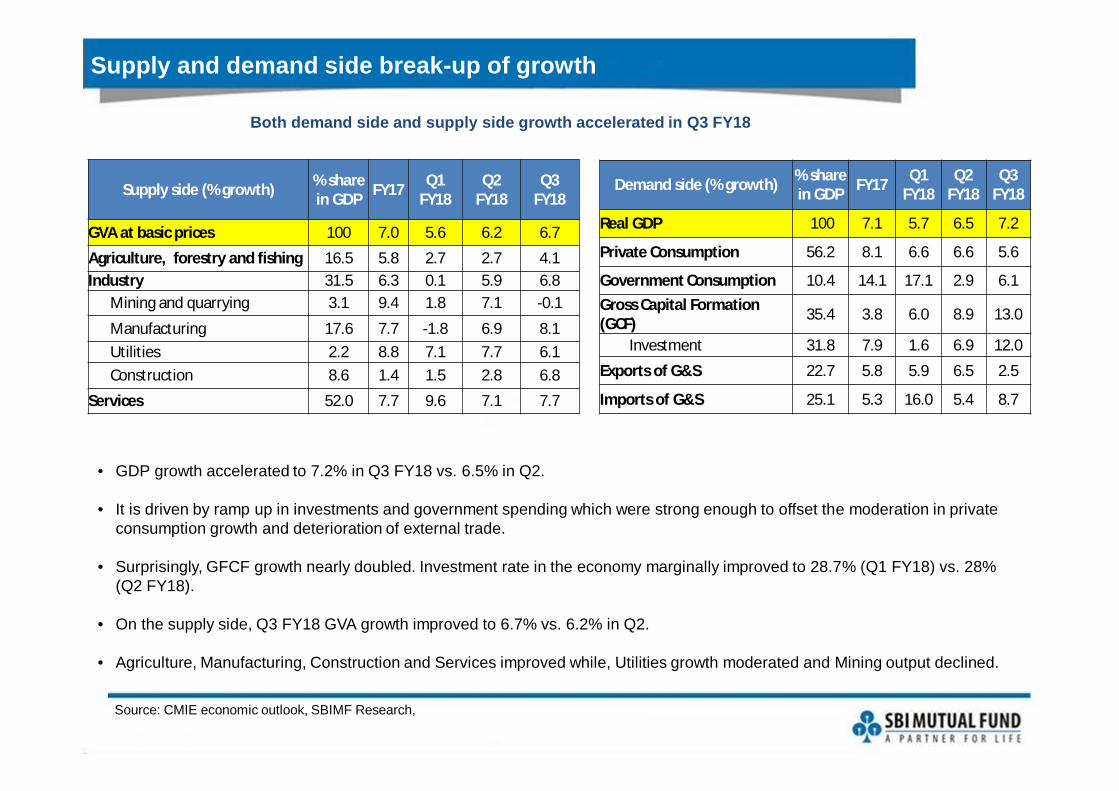
Supply and demand side break-up of growth
Both demand side and supply side growth accelerated in Q3 FY18
Demand side (% growth) % share in GDP FY17 Q1
FY18Q2
FY18Q3
FY18
Real GDP 100 7.1 5.7 6.5 7.2
Private Consumption 56.2 8.1 6.6 6.6 5.6
Government Consumption 10.4 14.1 17.1 2.9 6.1Gross Capital Formation (GCF) 35.4 3.8 6.0 8.9 13.0
Investment 31.8 7.9 1.6 6.9 12.0
Exports of G&S 22.7 5.8 5.9 6.5 2.5
Imports of G&S 25.1 5.3 16.0 5.4 8.7
Supply side (% growth) % share in GDP FY17 Q1
FY18Q2
FY18Q3
FY18
GVA at basic prices 100 7.0 5.6 6.2 6.7
Agriculture, forestry and fishing 16.5 5.8 2.7 2.7 4.1Industry 31.5 6.3 0.1 5.9 6.8
Mining and quarrying 3.1 9.4 1.8 7.1 -0.1
Manufacturing 17.6 7.7 -1.8 6.9 8.1Utilities 2.2 8.8 7.1 7.7 6.1Construction 8.6 1.4 1.5 2.8 6.8
Services 52.0 7.7 9.6 7.1 7.7
• GDP growth accelerated to 7.2% in Q3 FY18 vs. 6.5% in Q2.
• It is driven by ramp up in investments and government spending which were strong enough to offset the moderation in private consumption growth and deterioration of external trade.
• Surprisingly, GFCF growth nearly doubled. Investment rate in the economy marginally improved to 28.7% (Q1 FY18) vs. 28% (Q2 FY18).
• On the supply side, Q3 FY18 GVA growth improved to 6.7% vs. 6.2% in Q2.
• Agriculture, Manufacturing, Construction and Services improved while, Utilities growth moderated and Mining output declined.
Source: CMIE economic outlook, SBIMF Research,
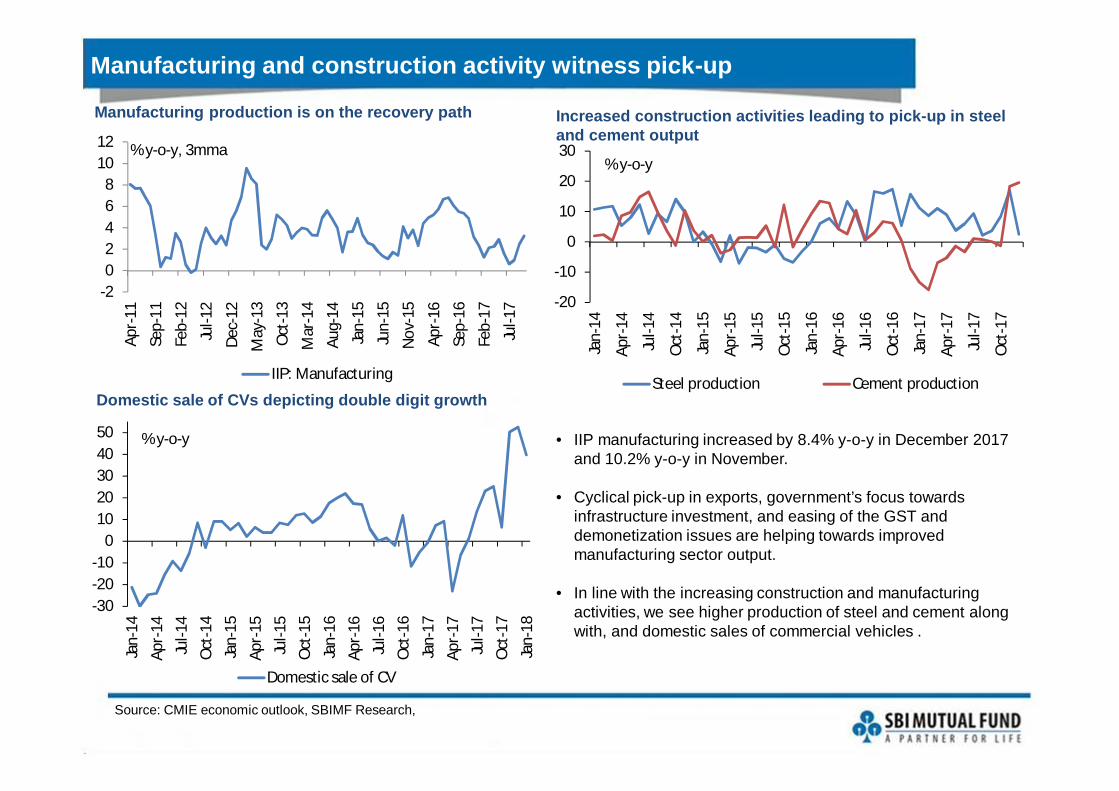
Manufacturing and construction activity witness pick-up
Increased construction activities leading to pick-up in steel and cement output
Manufacturing production is on the recovery path
-20
-10
0
10
20
30
Jan-
14
Apr-
14
Jul-1
4
Oct
-14
Jan-
15
Apr-
15
Jul-1
5
Oct
-15
Jan-
16
Apr-
16
Jul-1
6
Oct
-16
Jan-
17
Apr-
17
Jul-1
7
Oct
-17
% y-o-y
Steel production Cement production
• IIP manufacturing increased by 8.4% y-o-y in December 2017 and 10.2% y-o-y in November.
• Cyclical pick-up in exports, government’s focus towards infrastructure investment, and easing of the GST and demonetization issues are helping towards improved manufacturing sector output.
• In line with the increasing construction and manufacturing activities, we see higher production of steel and cement along with, and domestic sales of commercial vehicles .
-202468
1012
Apr-
11
Sep-
11
Feb-
12
Jul-1
2
Dec-
12
May
-13
Oct
-13
Mar
-14
Aug-
14
Jan-
15
Jun-
15
Nov
-15
Apr-
16
Sep-
16
Feb-
17
Jul-1
7
IIP: Manufacturing
% y-o-y, 3mma
-30-20-10
01020304050
Jan-
14Ap
r-14
Jul-1
4O
ct-1
4Ja
n-15
Apr-
15Ju
l-15
Oct
-15
Jan-
16Ap
r-16
Jul-1
6O
ct-1
6Ja
n-17
Apr-
17Ju
l-17
Oct
-17
Jan-
18
% y-o-y
Domestic sale of CV
Domestic sale of CVs depicting double digit growth
-3
0
3
6
9
12
15
18
Jun-
12
Nov
-12
Apr-
13
Sep-
13
Feb-
14
Jul-1
4
Dec-
14
May
-15
Oct
-15
Mar
-16
Aug-
16
Jan-
17
Jun-
17
Nov
-17
GFCF (Investments)
Source: CMIE economic outlook, FICCI, SBIMF Research,
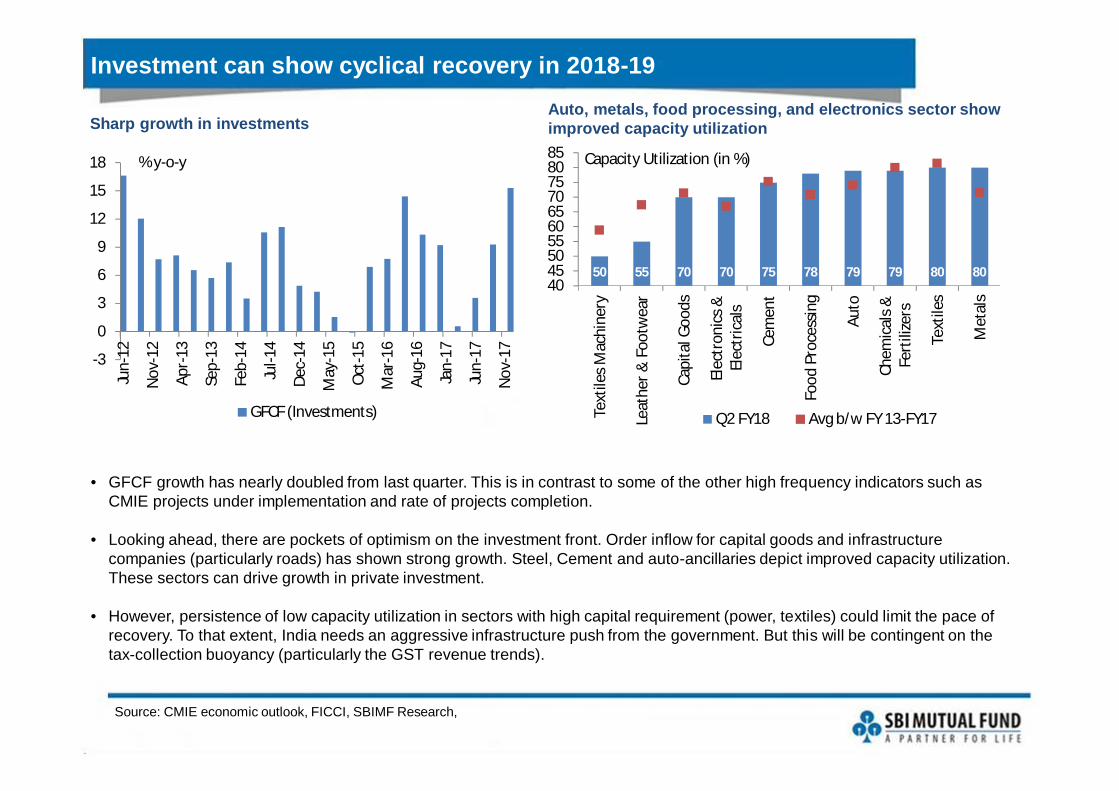
Sharp growth in investments
% y-o-y
• GFCF growth has nearly doubled from last quarter. This is in contrast to some of the other high frequency indicators such as CMIE projects under implementation and rate of projects completion.
• Looking ahead, there are pockets of optimism on the investment front. Order inflow for capital goods and infrastructure companies (particularly roads) has shown strong growth. Steel, Cement and auto-ancillaries depict improved capacity utilization.These sectors can drive growth in private investment.
• However, persistence of low capacity utilization in sectors with high capital requirement (power, textiles) could limit the pace of recovery. To that extent, India needs an aggressive infrastructure push from the government. But this will be contingent on the tax-collection buoyancy (particularly the GST revenue trends).
Investment can show cyclical recovery in 2018-19
50 55 70 70 75 78 79 79 80 8040455055606570758085
Text
iles M
achi
nery
Leat
her &
Foo
twea
r
Capi
tal G
oods
Elec
tron
ics &
Elec
tric
als
Cem
ent
Food
Pro
cess
ing
Auto
Chem
ical
s &Fe
rtili
zers
Text
iles
Met
als
Q2 FY18 Avg b/w FY 13-FY17
Capacity Utilization (in %)
Auto, metals, food processing, and electronics sector show improved capacity utilization
Source: CMIE economic outlook, SBIMF Research,
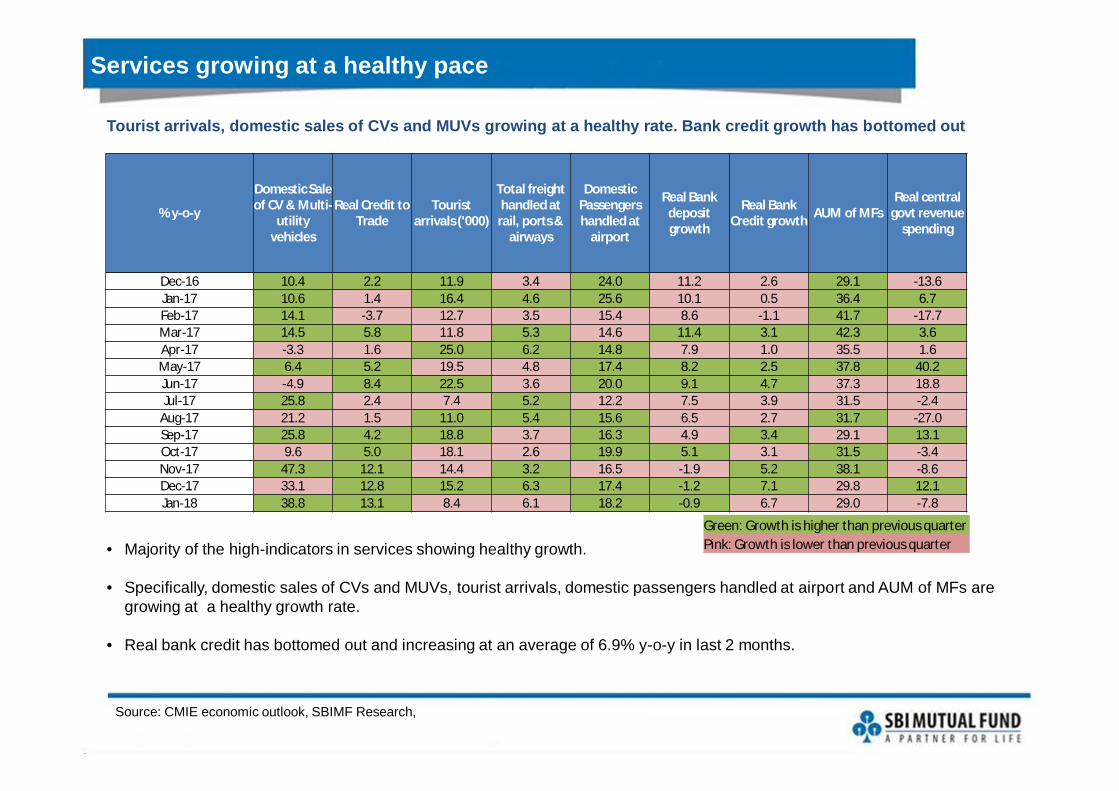
Services growing at a healthy pace
Tourist arrivals, domestic sales of CVs and MUVs growing at a healthy rate. Bank credit growth has bottomed out
• Majority of the high-indicators in services showing healthy growth.
• Specifically, domestic sales of CVs and MUVs, tourist arrivals, domestic passengers handled at airport and AUM of MFs are growing at a healthy growth rate.
• Real bank credit has bottomed out and increasing at an average of 6.9% y-o-y in last 2 months.
% y-o-y
Domestic Sale of CV & Multi-
utility vehicles
Real Credit to Trade
Tourist arrivals ('000)
Total freight handled at
rail, ports & airways
Domestic Passengers handled at
airport
Real Bank deposit growth
Real Bank Credit growth AUM of MFs
Real central govt revenue
spending
Dec-16 10.4 2.2 11.9 3.4 24.0 11.2 2.6 29.1 -13.6Jan-17 10.6 1.4 16.4 4.6 25.6 10.1 0.5 36.4 6.7Feb-17 14.1 -3.7 12.7 3.5 15.4 8.6 -1.1 41.7 -17.7Mar-17 14.5 5.8 11.8 5.3 14.6 11.4 3.1 42.3 3.6Apr-17 -3.3 1.6 25.0 6.2 14.8 7.9 1.0 35.5 1.6May-17 6.4 5.2 19.5 4.8 17.4 8.2 2.5 37.8 40.2Jun-17 -4.9 8.4 22.5 3.6 20.0 9.1 4.7 37.3 18.8Jul-17 25.8 2.4 7.4 5.2 12.2 7.5 3.9 31.5 -2.4
Aug-17 21.2 1.5 11.0 5.4 15.6 6.5 2.7 31.7 -27.0Sep-17 25.8 4.2 18.8 3.7 16.3 4.9 3.4 29.1 13.1Oct-17 9.6 5.0 18.1 2.6 19.9 5.1 3.1 31.5 -3.4Nov-17 47.3 12.1 14.4 3.2 16.5 -1.9 5.2 38.1 -8.6Dec-17 33.1 12.8 15.2 6.3 17.4 -1.2 7.1 29.8 12.1Jan-18 38.8 13.1 8.4 6.1 18.2 -0.9 6.7 29.0 -7.8
Green: Growth is higher than previous quarterPink: Growth is lower than previous quarter
Source: CMIE economic outlook, SBIMF Research,
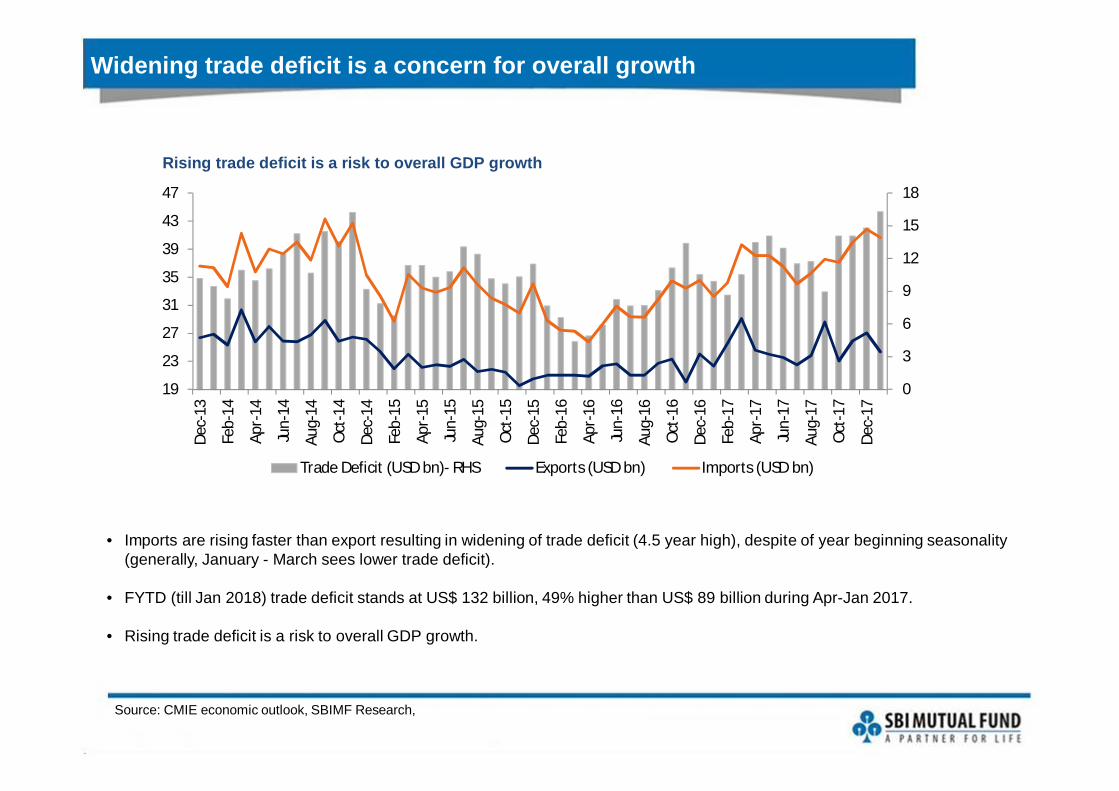
Widening trade deficit is a concern for overall growth
Rising trade deficit is a risk to overall GDP growth
• Imports are rising faster than export resulting in widening of trade deficit (4.5 year high), despite of year beginning seasonality (generally, January - March sees lower trade deficit).
• FYTD (till Jan 2018) trade deficit stands at US$ 132 billion, 49% higher than US$ 89 billion during Apr-Jan 2017.
• Rising trade deficit is a risk to overall GDP growth.
0
3
6
9
12
15
18
19
23
27
31
35
39
43
47De
c-13
Feb-
14
Apr-
14
Jun-
14
Aug-
14
Oct
-14
Dec-
14
Feb-
15
Apr-
15
Jun-
15
Aug-
15
Oct
-15
Dec-
15
Feb-
16
Apr-
16
Jun-
16
Aug-
16
Oct
-16
Dec-
16
Feb-
17
Apr-
17
Jun-
17
Aug-
17
Oct
-17
Dec-
17
Trade Deficit (USD bn)- RHS Exports (USD bn) Imports (USD bn)
Source: CMIE economic outlook, SBIMF Research,
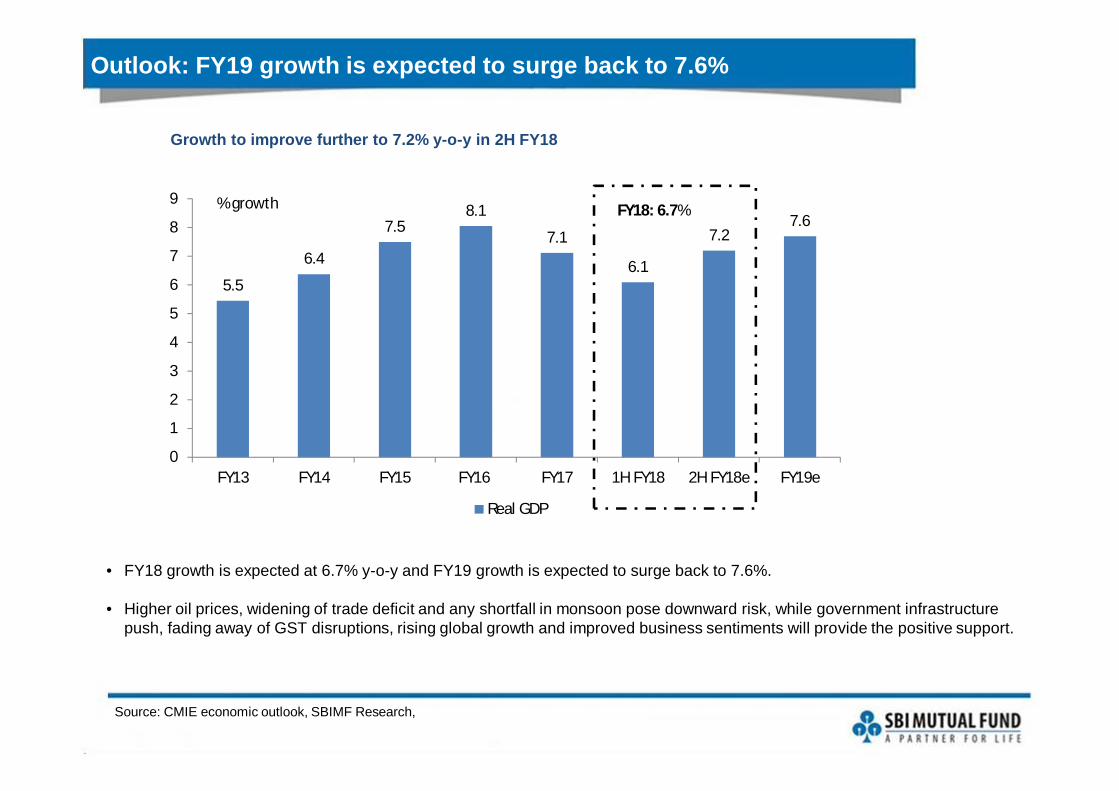
Outlook: FY19 growth is expected to surge back to 7.6%
Growth to improve further to 7.2% y-o-y in 2H FY18
5.5
6.4
7.58.1
7.1
6.1
7.27.6
0
1
2
3
4
5
6
7
8
9
FY13 FY14 FY15 FY16 FY17 1H FY18 2H FY18e FY19e
Real GDP
% growth FY18: 6.7%
• FY18 growth is expected at 6.7% y-o-y and FY19 growth is expected to surge back to 7.6%.
• Higher oil prices, widening of trade deficit and any shortfall in monsoon pose downward risk, while government infrastructurepush, fading away of GST disruptions, rising global growth and improved business sentiments will provide the positive support.
Source: Morgan Stanley, SBIMF Research,
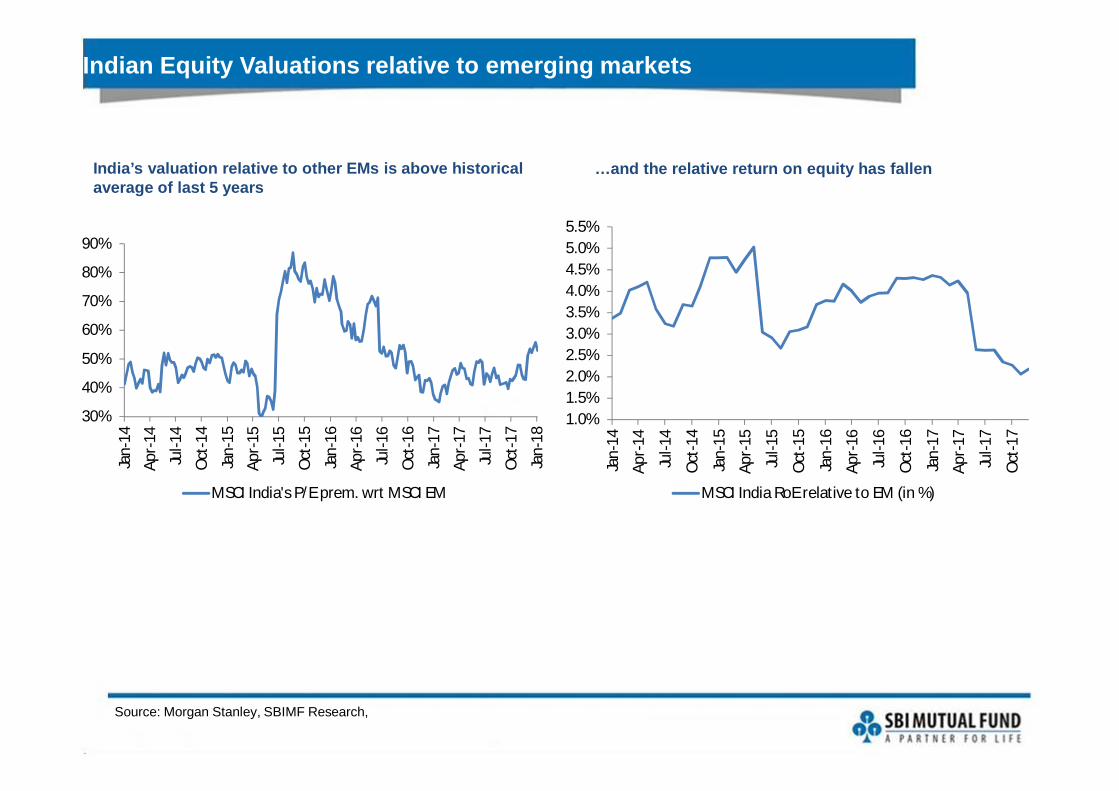
Indian Equity Valuations relative to emerging markets
India’s valuation relative to other EMs is above historical average of last 5 years
…and the relative return on equity has fallen
30%
40%
50%
60%
70%
80%
90%
Jan-
14
Apr-
14
Jul-1
4
Oct
-14
Jan-
15
Apr-
15
Jul-1
5
Oct
-15
Jan-
16
Apr-
16
Jul-1
6
Oct
-16
Jan-
17
Apr-
17
Jul-1
7
Oct
-17
Jan-
18
MSCI India's P/E prem. wrt MSCI EM
1.0%1.5%2.0%2.5%3.0%3.5%4.0%4.5%5.0%5.5%
Jan-
14
Apr-
14
Jul-1
4
Oct
-14
Jan-
15
Apr-
15
Jul-1
5
Oct
-15
Jan-
16
Apr-
16
Jul-1
6
Oct
-16
Jan-
17
Apr-
17
Jul-1
7
Oct
-17
MSCI India RoE relative to EM (in %)
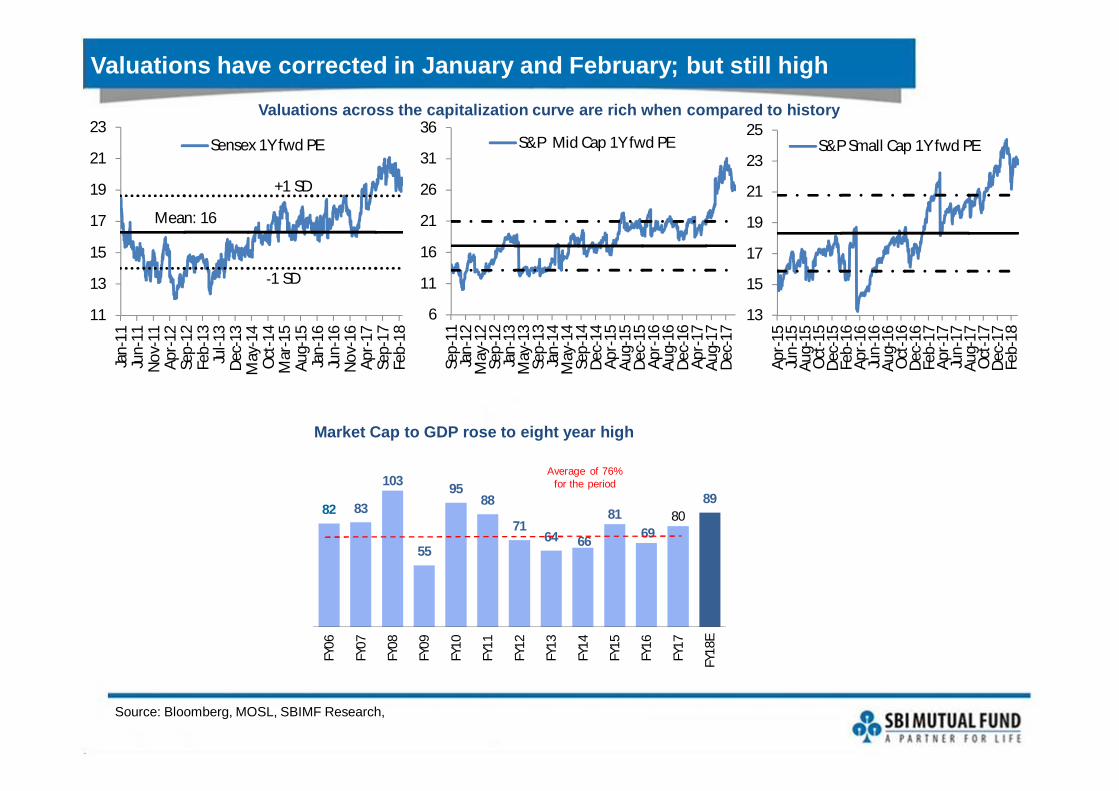
Valuations have corrected in January and February; but still high Valuations across the capitalization curve are rich when compared to history
Source: Bloomberg, MOSL, SBIMF Research,
82 83
103
55
9588
7164 66
8169
8089
FY06
FY07
FY08
FY09
FY10
FY11
FY12
FY13
FY14
FY15
FY16
FY17
FY18
E
Average of 76% for the period
Market Cap to GDP rose to eight year high
11
13
15
17
19
21
23Ja
n-11
Jun-
11N
ov-1
1Ap
r-12
Sep-
12Fe
b-13
Jul-1
3De
c-13
May
-14
Oct
-14
Mar
-15
Aug-
15Ja
n-16
Jun-
16N
ov-1
6Ap
r-17
Sep-
17Fe
b-18
Sensex 1Y fwd PE
Mean: 16
+1 SD
-1 SD
6
11
16
21
26
31
36
Sep-
11Ja
n-12
May
-12
Sep-
12Ja
n-13
May
-13
Sep-
13Ja
n-14
May
-14
Sep-
14De
c-14
Apr-
15Au
g-15
Dec-
15Ap
r-16
Aug-
16De
c-16
Apr-
17Au
g-17
Dec-
17
S&P Mid Cap 1Y fwd PE
13
15
17
19
21
23
25
Apr-
15Ju
n-15
Aug-
15O
ct-1
5De
c-15
Feb-
16Ap
r-16
Jun-
16Au
g-16
Oct
-16
Dec-
16Fe
b-17
Apr-
17Ju
n-17
Aug-
17O
ct-1
7De
c-17
Feb-
18
S&P Small Cap 1Y fwd PE
Source: Bloomberg, SBIMF Research,
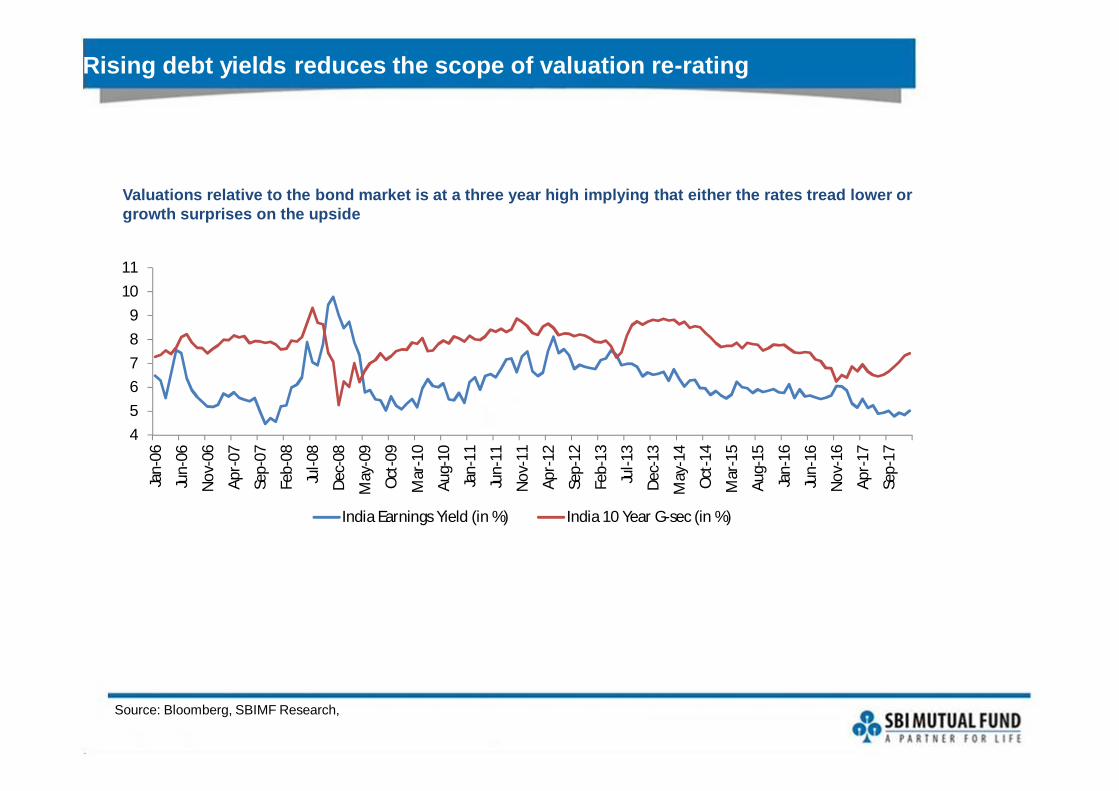
Rising debt yields reduces the scope of valuation re-rating
Valuations relative to the bond market is at a three year high implying that either the rates tread lower or growth surprises on the upside
456789
1011
Jan-
06
Jun-
06
Nov
-06
Apr-
07
Sep-
07
Feb-
08
Jul-0
8
Dec-
08
May
-09
Oct
-09
Mar
-10
Aug-
10
Jan-
11
Jun-
11
Nov
-11
Apr-
12
Sep-
12
Feb-
13
Jul-1
3
Dec-
13
May
-14
Oct
-14
Mar
-15
Aug-
15
Jan-
16
Jun-
16
Nov
-16
Apr-
17
Sep-
17
India Earnings Yield (in %) India 10 Year G-sec (in %)
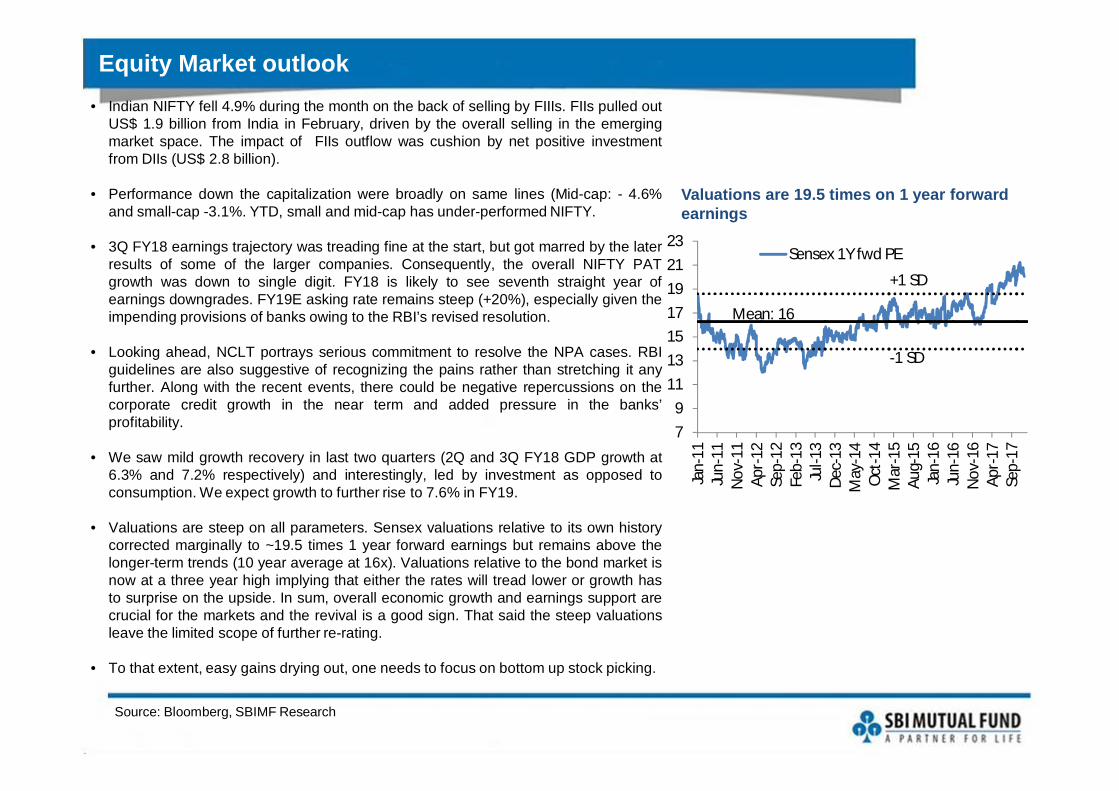
Equity Market outlook• Indian NIFTY fell 4.9% during the month on the back of selling by FIIIs. FIIs pulled out
US$ 1.9 billion from India in February, driven by the overall selling in the emergingmarket space. The impact of FIIs outflow was cushion by net positive investmentfrom DIIs (US$ 2.8 billion).
• Performance down the capitalization were broadly on same lines (Mid-cap: - 4.6%and small-cap -3.1%. YTD, small and mid-cap has under-performed NIFTY.
• 3Q FY18 earnings trajectory was treading fine at the start, but got marred by the laterresults of some of the larger companies. Consequently, the overall NIFTY PATgrowth was down to single digit. FY18 is likely to see seventh straight year ofearnings downgrades. FY19E asking rate remains steep (+20%), especially given theimpending provisions of banks owing to the RBI’s revised resolution.
• Looking ahead, NCLT portrays serious commitment to resolve the NPA cases. RBIguidelines are also suggestive of recognizing the pains rather than stretching it anyfurther. Along with the recent events, there could be negative repercussions on thecorporate credit growth in the near term and added pressure in the banks’profitability.
• We saw mild growth recovery in last two quarters (2Q and 3Q FY18 GDP growth at6.3% and 7.2% respectively) and interestingly, led by investment as opposed toconsumption. We expect growth to further rise to 7.6% in FY19.
• Valuations are steep on all parameters. Sensex valuations relative to its own historycorrected marginally to ~19.5 times 1 year forward earnings but remains above thelonger-term trends (10 year average at 16x). Valuations relative to the bond market isnow at a three year high implying that either the rates will tread lower or growth hasto surprise on the upside. In sum, overall economic growth and earnings support arecrucial for the markets and the revival is a good sign. That said the steep valuationsleave the limited scope of further re-rating.
• To that extent, easy gains drying out, one needs to focus on bottom up stock picking.
Valuations are 19.5 times on 1 year forward earnings
Source: Bloomberg, SBIMF Research
79
11131517192123
Jan-
11Ju
n-11
Nov
-11
Apr-
12Se
p-12
Feb-
13Ju
l-13
Dec-
13M
ay-1
4O
ct-1
4M
ar-1
5Au
g-15
Jan-
16Ju
n-16
Nov
-16
Apr-
17Se
p-17
Sensex 1Y fwd PE
Mean: 16
+1 SD
-1 SD
Fixed Income Market
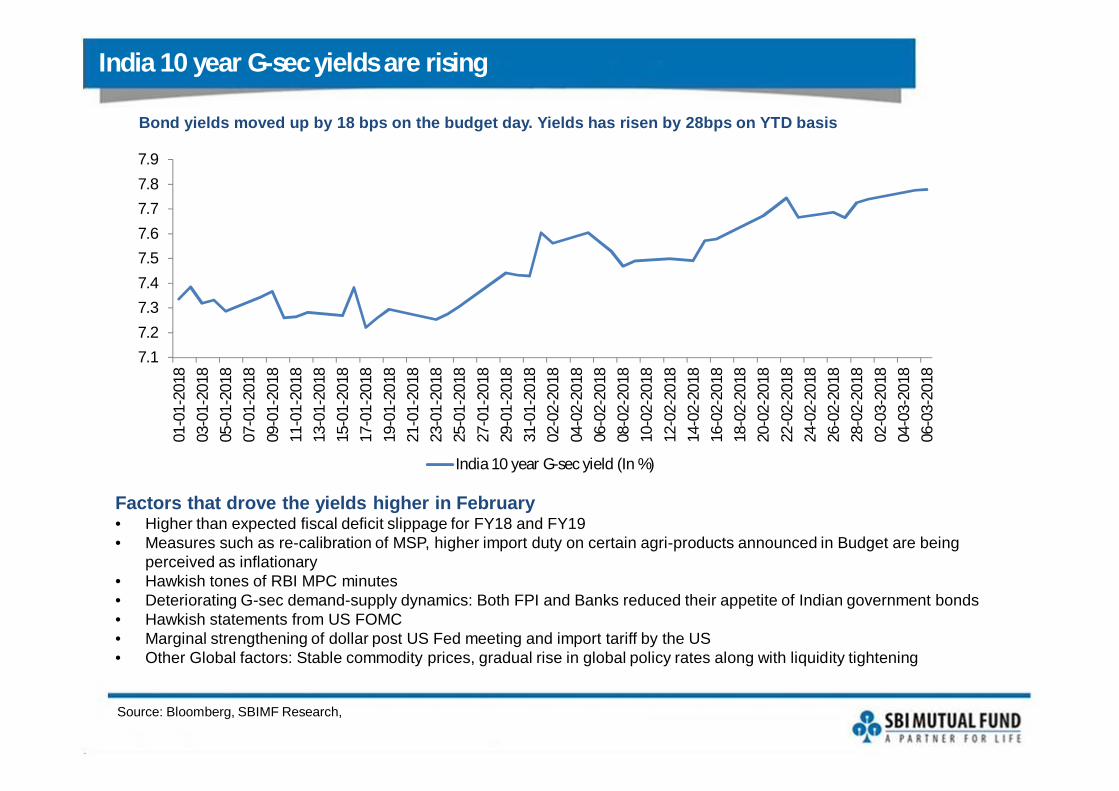
India 10 year G-sec yields are rising
Source: Bloomberg, SBIMF Research,
Factors that drove the yields higher in February• Higher than expected fiscal deficit slippage for FY18 and FY19• Measures such as re-calibration of MSP, higher import duty on certain agri-products announced in Budget are being
perceived as inflationary• Hawkish tones of RBI MPC minutes• Deteriorating G-sec demand-supply dynamics: Both FPI and Banks reduced their appetite of Indian government bonds• Hawkish statements from US FOMC• Marginal strengthening of dollar post US Fed meeting and import tariff by the US• Other Global factors: Stable commodity prices, gradual rise in global policy rates along with liquidity tightening
Bond yields moved up by 18 bps on the budget day. Yields has risen by 28bps on YTD basis
7.17.27.37.47.57.67.77.87.9
01-0
1-20
1803
-01-
2018
05-0
1-20
1807
-01-
2018
09-0
1-20
1811
-01-
2018
13-0
1-20
1815
-01-
2018
17-0
1-20
1819
-01-
2018
21-0
1-20
1823
-01-
2018
25-0
1-20
1827
-01-
2018
29-0
1-20
1831
-01-
2018
02-0
2-20
1804
-02-
2018
06-0
2-20
1808
-02-
2018
10-0
2-20
1812
-02-
2018
14-0
2-20
1816
-02-
2018
18-0
2-20
1820
-02-
2018
22-0
2-20
1824
-02-
2018
26-0
2-20
1828
-02-
2018
02-0
3-20
1804
-03-
2018
06-0
3-20
18
India 10 year G-sec yield (In %)
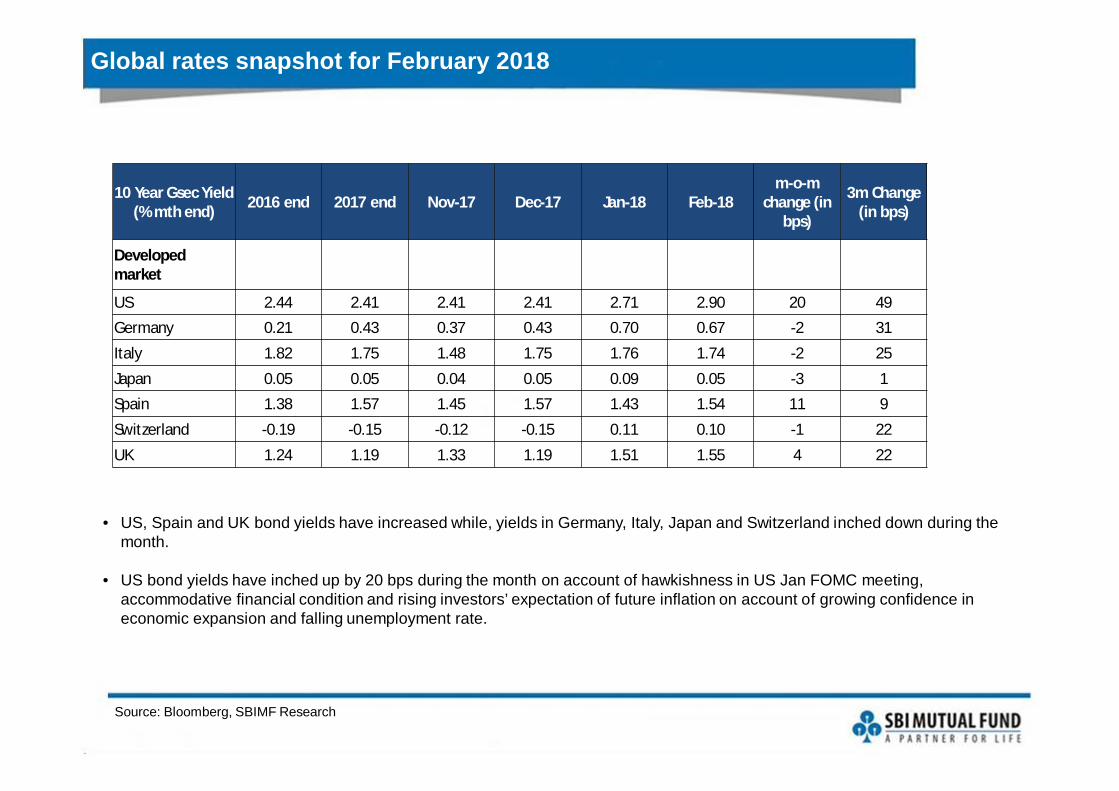
Global rates snapshot for February 2018
Source: Bloomberg, SBIMF Research
10 Year Gsec Yield (% mth end) 2016 end 2017 end Nov-17 Dec-17 Jan-18 Feb-18
m-o-m change (in
bps)
3m Change (in bps)
Developed market
US 2.44 2.41 2.41 2.41 2.71 2.90 20 49Germany 0.21 0.43 0.37 0.43 0.70 0.67 -2 31
Italy 1.82 1.75 1.48 1.75 1.76 1.74 -2 25
Japan 0.05 0.05 0.04 0.05 0.09 0.05 -3 1Spain 1.38 1.57 1.45 1.57 1.43 1.54 11 9
Switzerland -0.19 -0.15 -0.12 -0.15 0.11 0.10 -1 22
UK 1.24 1.19 1.33 1.19 1.51 1.55 4 22
• US, Spain and UK bond yields have increased while, yields in Germany, Italy, Japan and Switzerland inched down during the month.
• US bond yields have inched up by 20 bps during the month on account of hawkishness in US Jan FOMC meeting, accommodative financial condition and rising investors’ expectation of future inflation on account of growing confidence in economic expansion and falling unemployment rate.
Emerging market bond yields – February 2018
Source: Bloomberg, SBIMF Research
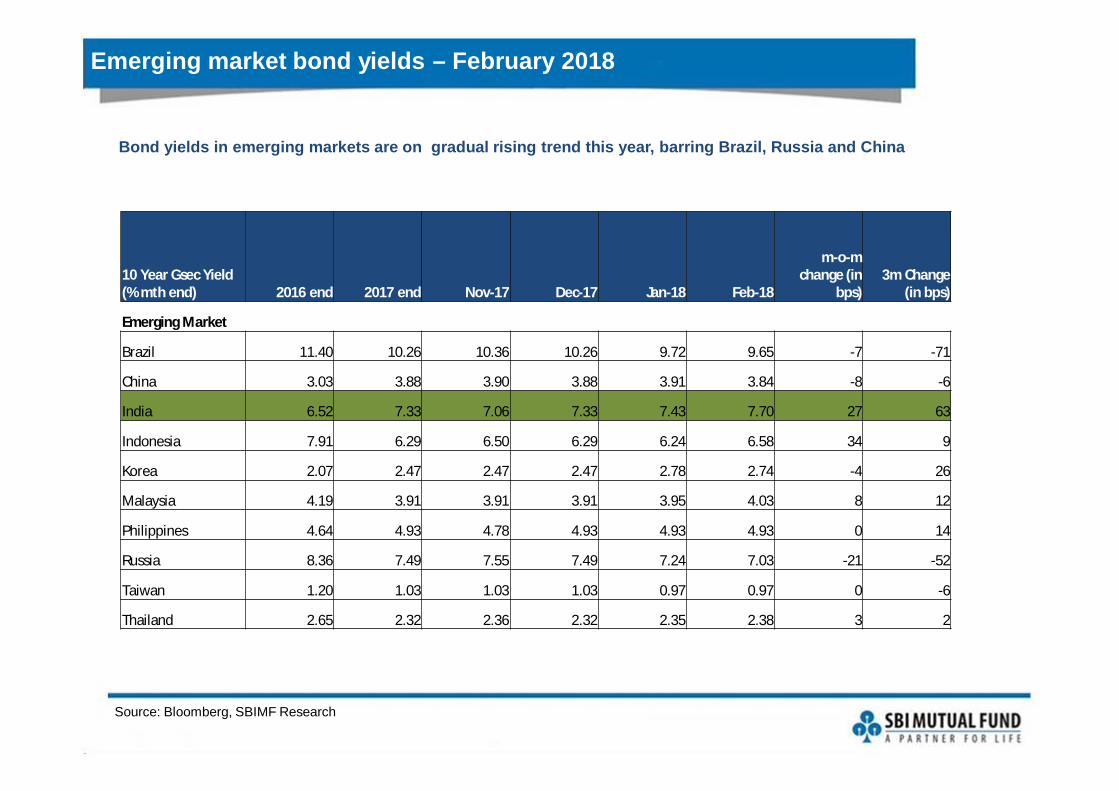
10 Year Gsec Yield (% mth end) 2016 end 2017 end Nov-17 Dec-17 Jan-18 Feb-18
m-o-m change (in
bps)3m Change
(in bps)
Emerging Market
Brazil 11.40 10.26 10.36 10.26 9.72 9.65 -7 -71
China 3.03 3.88 3.90 3.88 3.91 3.84 -8 -6
India 6.52 7.33 7.06 7.33 7.43 7.70 27 63
Indonesia 7.91 6.29 6.50 6.29 6.24 6.58 34 9
Korea 2.07 2.47 2.47 2.47 2.78 2.74 -4 26
Malaysia 4.19 3.91 3.91 3.91 3.95 4.03 8 12
Philippines 4.64 4.93 4.78 4.93 4.93 4.93 0 14
Russia 8.36 7.49 7.55 7.49 7.24 7.03 -21 -52
Taiwan 1.20 1.03 1.03 1.03 0.97 0.97 0 -6
Thailand 2.65 2.32 2.36 2.32 2.35 2.38 3 2
Bond yields in emerging markets are on gradual rising trend this year, barring Brazil, Russia and China
India Rates Snapshot for February 2018
Source: Bloomberg, PPAC, CCIL, SBIMF Research; NB: **Crude oil price is average $/barrel for the month, rest of the data are % month end; *Corporate bond rate is for AAA rated bonds ,*** Refers to PSU Banks CD rate; # INR and Oil price changes are % change
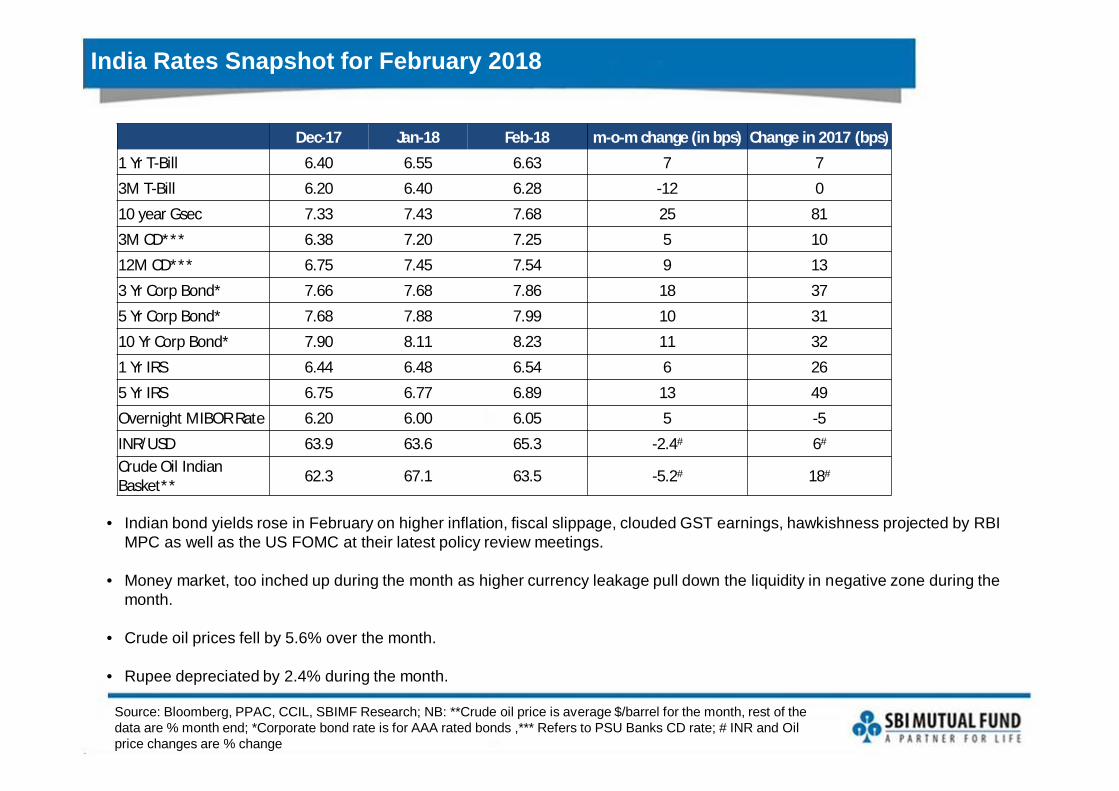
Dec-17 Jan-18 Feb-18 m-o-m change (in bps) Change in 2017 (bps)
1 Yr T-Bill 6.40 6.55 6.63 7 7
3M T-Bill 6.20 6.40 6.28 -12 0
10 year Gsec 7.33 7.43 7.68 25 81
3M CD*** 6.38 7.20 7.25 5 10
12M CD*** 6.75 7.45 7.54 9 13
3 Yr Corp Bond* 7.66 7.68 7.86 18 37
5 Yr Corp Bond* 7.68 7.88 7.99 10 31
10 Yr Corp Bond* 7.90 8.11 8.23 11 32
1 Yr IRS 6.44 6.48 6.54 6 26
5 Yr IRS 6.75 6.77 6.89 13 49
Overnight MIBOR Rate 6.20 6.00 6.05 5 -5
INR/USD 63.9 63.6 65.3 -2.4# 6#
Crude Oil Indian Basket** 62.3 67.1 63.5 -5.2# 18#
• Indian bond yields rose in February on higher inflation, fiscal slippage, clouded GST earnings, hawkishness projected by RBI MPC as well as the US FOMC at their latest policy review meetings.
• Money market, too inched up during the month as higher currency leakage pull down the liquidity in negative zone during the month.
• Crude oil prices fell by 5.6% over the month.
• Rupee depreciated by 2.4% during the month.
Yield curve has risen in February 2018
Source: Bloomberg, SBIMF Research
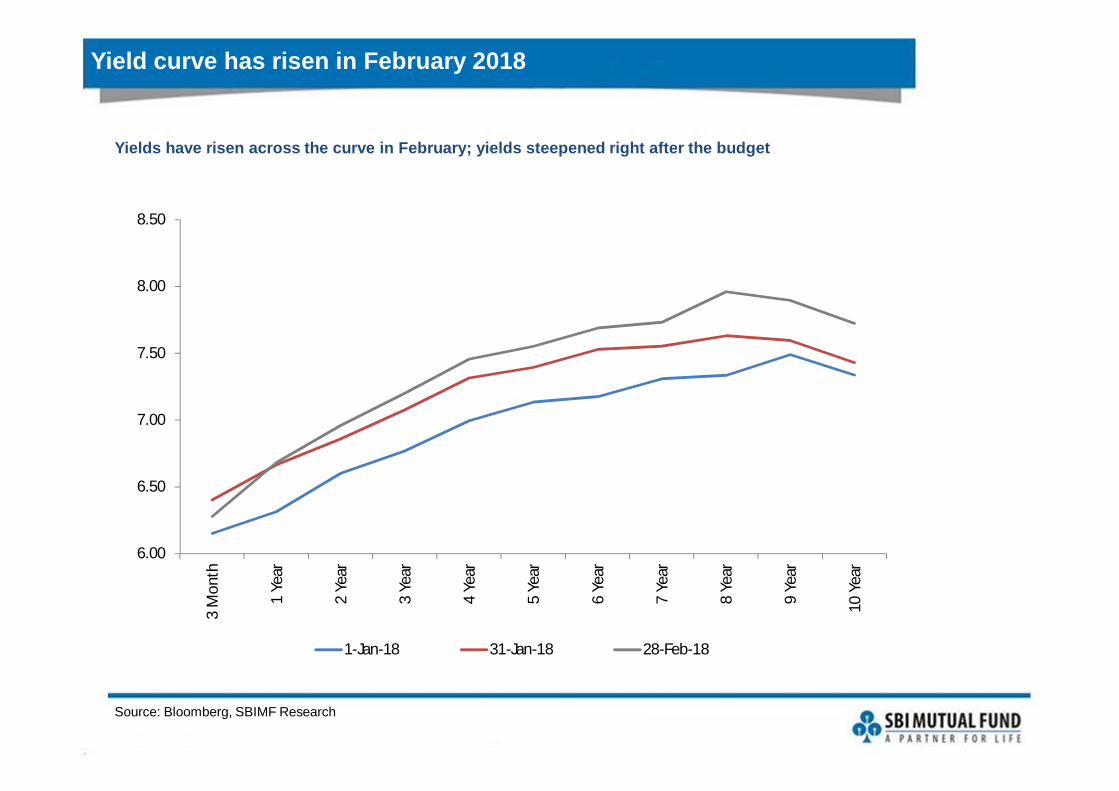
Yields have risen across the curve in February; yields steepened right after the budget
6.00
6.50
7.00
7.50
8.00
8.503
Mon
th
1 Ye
ar
2 Ye
ar
3 Ye
ar
4 Ye
ar
5 Ye
ar
6 Ye
ar
7 Ye
ar
8 Ye
ar
9 Ye
ar
10 Y
ear
1-Jan-18 31-Jan-18 28-Feb-18
… But growth-inflation mix warrants an unchanged policy rate in 2018
Source: CMIE economic outlook, CSO, SBIMF Research
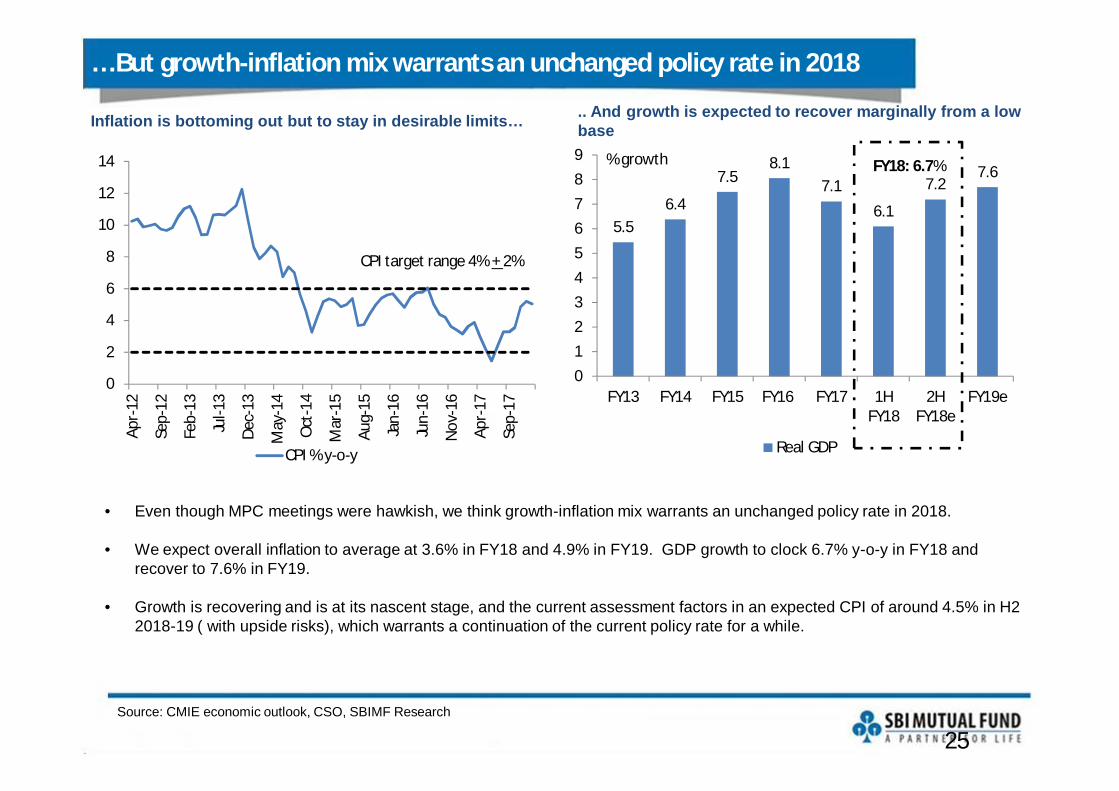
Inflation is bottoming out but to stay in desirable limits…
• Even though MPC meetings were hawkish, we think growth-inflation mix warrants an unchanged policy rate in 2018.
• We expect overall inflation to average at 3.6% in FY18 and 4.9% in FY19. GDP growth to clock 6.7% y-o-y in FY18 and recover to 7.6% in FY19.
• Growth is recovering and is at its nascent stage, and the current assessment factors in an expected CPI of around 4.5% in H2 2018-19 ( with upside risks), which warrants a continuation of the current policy rate for a while.
25
.. And growth is expected to recover marginally from a low base
0
2
4
6
8
10
12
14
Apr-
12
Sep-
12
Feb-
13
Jul-1
3
Dec-
13
May
-14
Oct
-14
Mar
-15
Aug-
15
Jan-
16
Jun-
16
Nov
-16
Apr-
17
Sep-
17
CPI % y-o-y
CPI target range 4% + 2%
5.56.4
7.58.1
7.16.1
7.27.6
0123456789
FY13 FY14 FY15 FY16 FY17 1HFY18
2HFY18e
FY19e
Real GDP
% growth FY18: 6.7%
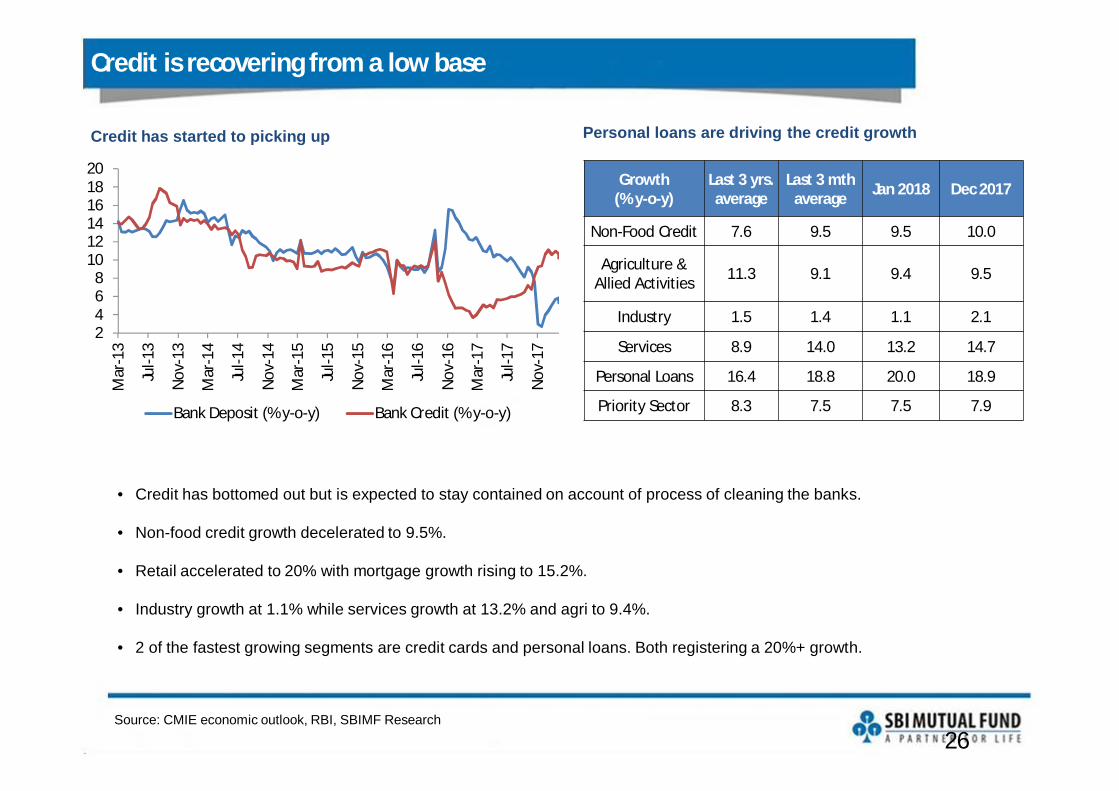
Credit is recovering from a low base
Source: CMIE economic outlook, RBI, SBIMF Research
Credit has started to picking up
• Credit has bottomed out but is expected to stay contained on account of process of cleaning the banks.
• Non-food credit growth decelerated to 9.5%.
• Retail accelerated to 20% with mortgage growth rising to 15.2%.
• Industry growth at 1.1% while services growth at 13.2% and agri to 9.4%.
• 2 of the fastest growing segments are credit cards and personal loans. Both registering a 20%+ growth.
26
Personal loans are driving the credit growth
Growth (% y-o-y)
Last 3 yrs. average
Last 3 mth average Jan 2018 Dec 2017
Non-Food Credit 7.6 9.5 9.5 10.0
Agriculture & Allied Activities 11.3 9.1 9.4 9.5
Industry 1.5 1.4 1.1 2.1
Services 8.9 14.0 13.2 14.7
Personal Loans 16.4 18.8 20.0 18.9
Priority Sector 8.3 7.5 7.5 7.9
2468
101214161820
Mar
-13
Jul-1
3
Nov
-13
Mar
-14
Jul-1
4
Nov
-14
Mar
-15
Jul-1
5
Nov
-15
Mar
-16
Jul-1
6
Nov
-16
Mar
-17
Jul-1
7
Nov
-17
Bank Deposit (% y-o-y) Bank Credit (% y-o-y)
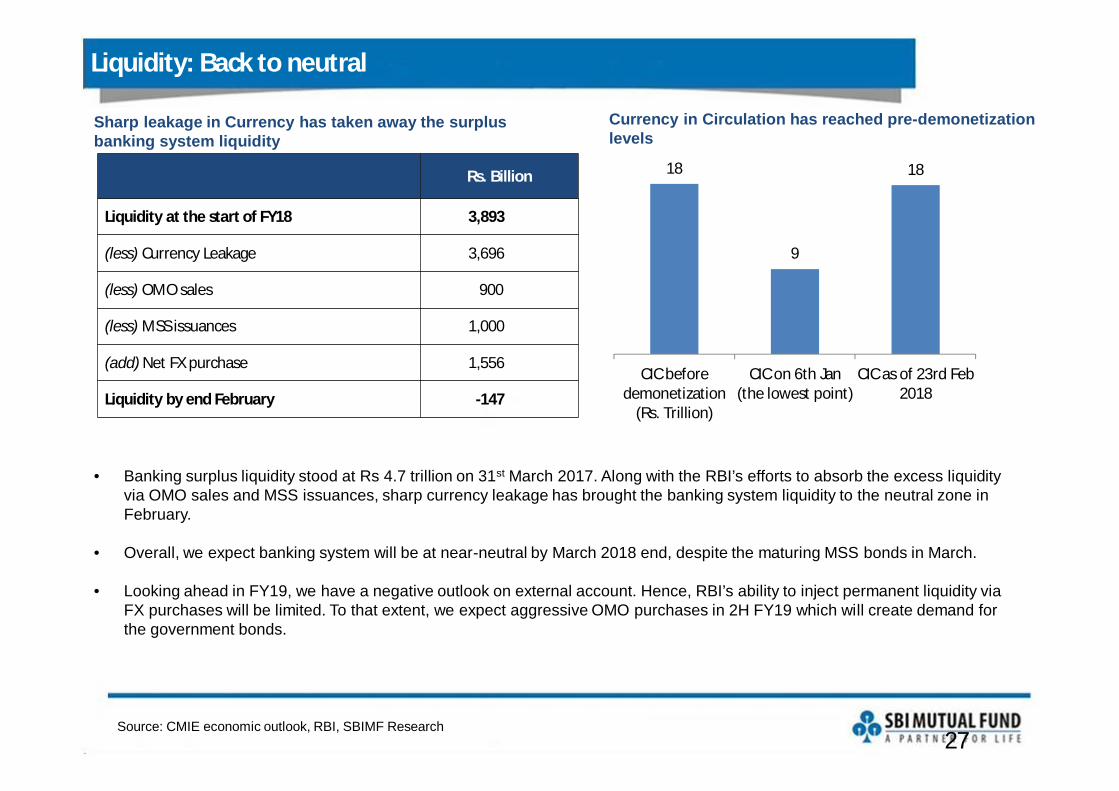
Liquidity: Back to neutral
Source: CMIE economic outlook, RBI, SBIMF Research
Sharp leakage in Currency has taken away the surplus banking system liquidity
• Banking surplus liquidity stood at Rs 4.7 trillion on 31st March 2017. Along with the RBI’s efforts to absorb the excess liquidity via OMO sales and MSS issuances, sharp currency leakage has brought the banking system liquidity to the neutral zone in February.
• Overall, we expect banking system will be at near-neutral by March 2018 end, despite the maturing MSS bonds in March.
• Looking ahead in FY19, we have a negative outlook on external account. Hence, RBI’s ability to inject permanent liquidity viaFX purchases will be limited. To that extent, we expect aggressive OMO purchases in 2H FY19 which will create demand for the government bonds.
27
Rs. Billion
Liquidity at the start of FY18 3,893
(less) Currency Leakage 3,696
(less) OMO sales 900
(less) MSS issuances 1,000
(add) Net FX purchase 1,556
Liquidity by end February -147
18
9
18
CIC beforedemonetization
(Rs. Trillion)
CIC on 6th Jan(the lowest point)
CIC as of 23rd Feb2018
Currency in Circulation has reached pre-demonetization levels
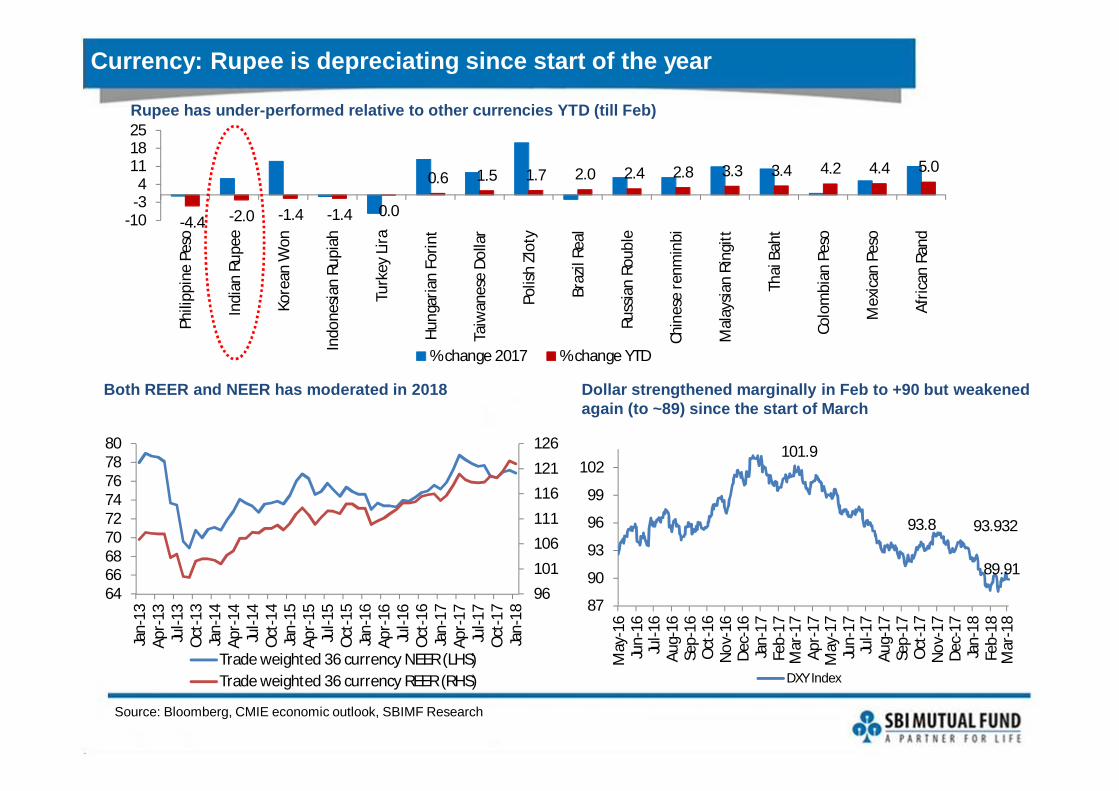
Currency: Rupee is depreciating since start of the year
Source: Bloomberg, CMIE economic outlook, SBIMF Research
Rupee has under-performed relative to other currencies YTD (till Feb)
-4.4 -2.0 -1.4 -1.4 0.0
0.6 1.5 1.7 2.0 2.4 2.8 3.3 3.4 4.2 4.4 5.0
-10-34
111825
Phili
ppin
e Pe
so
Indi
an R
upee
Kore
an W
on
Indo
nesia
n Ru
piah
Turk
ey L
ira
Hung
aria
n Fo
rint
Taiw
anes
e Do
llar
Polis
h Zl
oty
Braz
il Re
al
Russ
ian
Roub
le
Chin
ese
renm
inbi
Mal
aysia
n Ri
ngitt
Thai
Bah
t
Colo
mbi
an P
eso
Mex
ican
Pes
o
Afric
an R
and
% change 2017 % change YTD
Both REER and NEER has moderated in 2018
101.9
93.8 93.932
89.91
87
90
93
96
99
102
May
-16
Jun-
16Ju
l-16
Aug-
16Se
p-16
Oct
-16
Nov
-16
Dec-
16Ja
n-17
Feb-
17M
ar-1
7Ap
r-17
May
-17
Jun-
17Ju
l-17
Aug-
17Se
p-17
Oct
-17
Nov
-17
Dec-
17Ja
n-18
Feb-
18M
ar-1
8
DXY Index
Dollar strengthened marginally in Feb to +90 but weakened again (to ~89) since the start of March
96101106111116121126
646668707274767880
Jan-
13Ap
r-13
Jul-1
3O
ct-1
3Ja
n-14
Apr-
14Ju
l-14
Oct
-14
Jan-
15Ap
r-15
Jul-1
5O
ct-1
5Ja
n-16
Apr-
16Ju
l-16
Oct
-16
Jan-
17Ap
r-17
Jul-1
7O
ct-1
7Ja
n-18
Trade weighted 36 currency NEER (LHS)Trade weighted 36 currency REER (RHS)
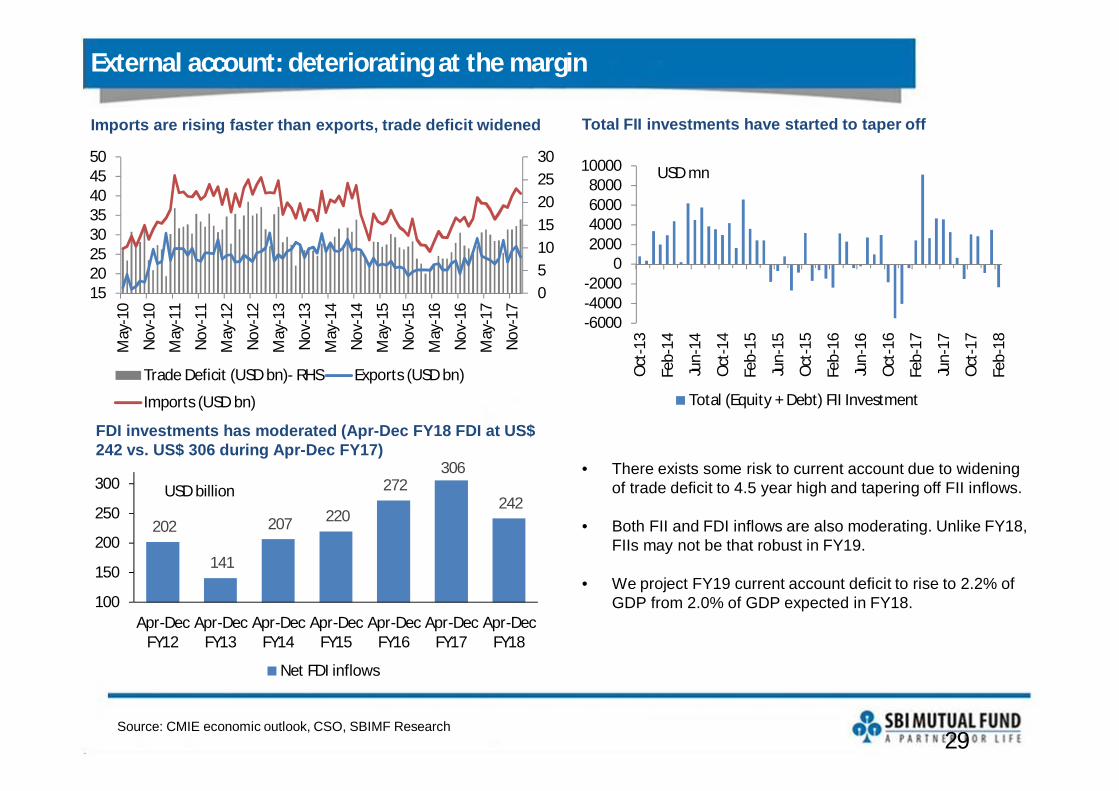
External account: deteriorating at the margin
Source: CMIE economic outlook, CSO, SBIMF Research
Imports are rising faster than exports, trade deficit widened
• There exists some risk to current account due to widening of trade deficit to 4.5 year high and tapering off FII inflows.
• Both FII and FDI inflows are also moderating. Unlike FY18, FIIs may not be that robust in FY19.
• We project FY19 current account deficit to rise to 2.2% of GDP from 2.0% of GDP expected in FY18.
29
051015202530
1520253035404550
May
-10
Nov
-10
May
-11
Nov
-11
May
-12
Nov
-12
May
-13
Nov
-13
May
-14
Nov
-14
May
-15
Nov
-15
May
-16
Nov
-16
May
-17
Nov
-17
Trade Deficit (USD bn)- RHS Exports (USD bn)
Imports (USD bn)
Total FII investments have started to taper off
-6000-4000-2000
02000400060008000
10000
Oct
-13
Feb-
14
Jun-
14
Oct
-14
Feb-
15
Jun-
15
Oct
-15
Feb-
16
Jun-
16
Oct
-16
Feb-
17
Jun-
17
Oct
-17
Feb-
18
Total (Equity + Debt) FII Investment
USD mn
FDI investments has moderated (Apr-Dec FY18 FDI at US$ 242 vs. US$ 306 during Apr-Dec FY17)
202
141
207 220
272 306
242
100
150
200
250
300
Apr-DecFY12
Apr-DecFY13
Apr-DecFY14
Apr-DecFY15
Apr-DecFY16
Apr-DecFY17
Apr-DecFY18
Net FDI inflows
USD billion
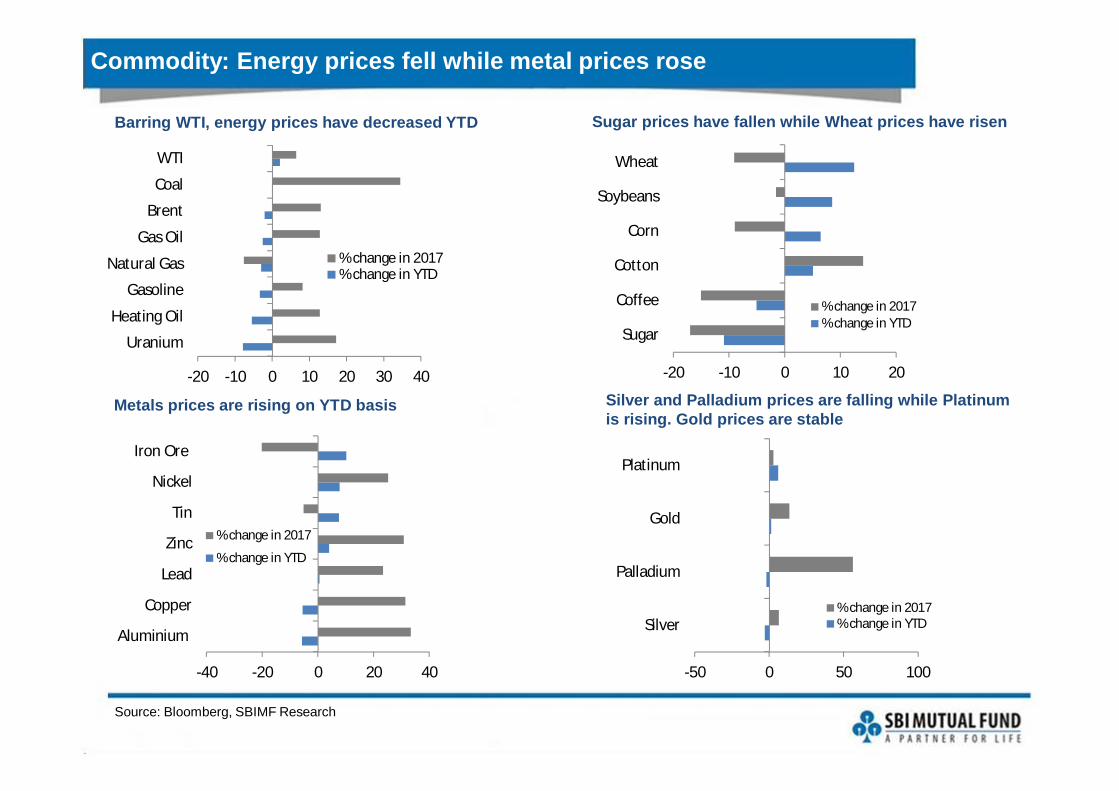
Commodity: Energy prices fell while metal prices rose
Source: Bloomberg, SBIMF Research
Barring WTI, energy prices have decreased YTD
-20 -10 0 10 20 30 40
Uranium
Heating Oil
Gasoline
Natural Gas
Gas Oil
Brent
Coal
WTI
% change in 2017% change in YTD
-20 -10 0 10 20
Sugar
Coffee
Cotton
Corn
Soybeans
Wheat
% change in 2017% change in YTD
-40 -20 0 20 40
Aluminium
Copper
Lead
Zinc
Tin
Nickel
Iron Ore
% change in 2017
% change in YTD
-50 0 50 100
Silver
Palladium
Gold
Platinum
% change in 2017% change in YTD
Metals prices are rising on YTD basis
Sugar prices have fallen while Wheat prices have risen
Silver and Palladium prices are falling while Platinum is rising. Gold prices are stable
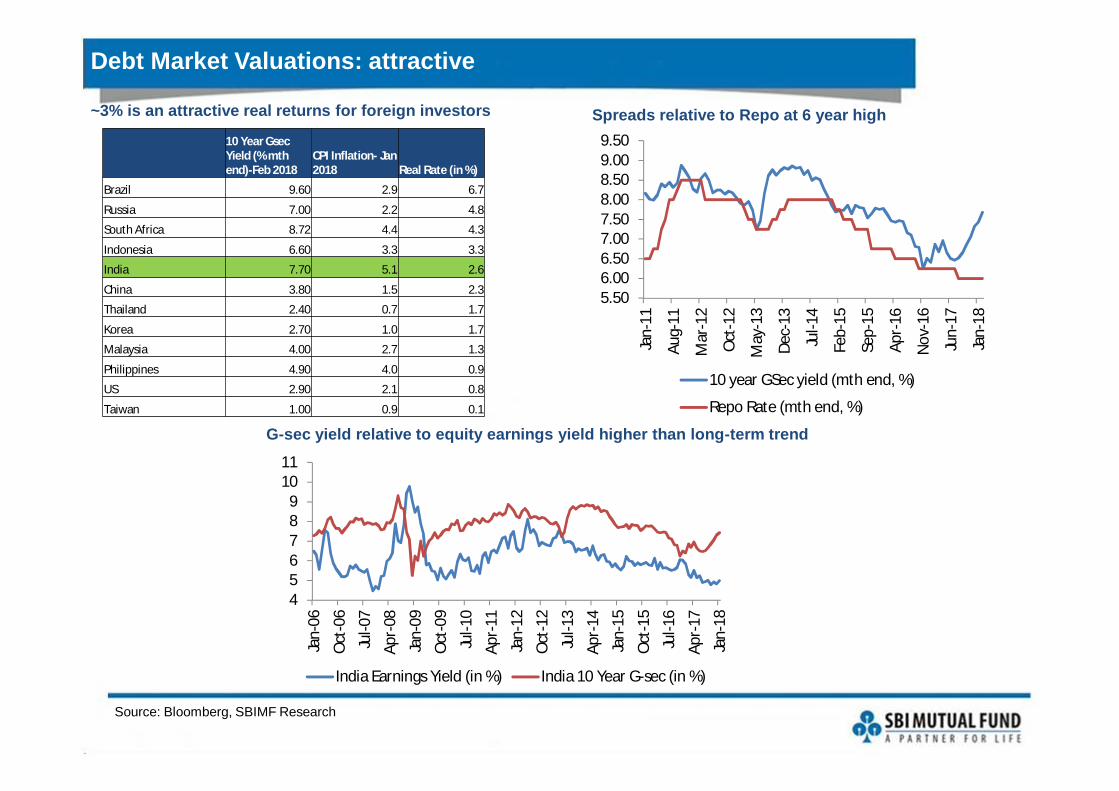
Debt Market Valuations: attractive
Source: Bloomberg, SBIMF Research
~3% is an attractive real returns for foreign investors Spreads relative to Repo at 6 year high10 Year Gsec Yield (% mth end)-Feb 2018
CPI Inflation- Jan 2018 Real Rate (in %)
Brazil 9.60 2.9 6.7
Russia 7.00 2.2 4.8
South Africa 8.72 4.4 4.3
Indonesia 6.60 3.3 3.3
India 7.70 5.1 2.6
China 3.80 1.5 2.3
Thailand 2.40 0.7 1.7
Korea 2.70 1.0 1.7
Malaysia 4.00 2.7 1.3
Philippines 4.90 4.0 0.9
US 2.90 2.1 0.8
Taiwan 1.00 0.9 0.1
5.506.006.507.007.508.008.509.009.50
Jan-
11
Aug-
11
Mar
-12
Oct
-12
May
-13
Dec-
13
Jul-1
4
Feb-
15
Sep-
15
Apr-
16
Nov
-16
Jun-
17
Jan-
18
10 year GSec yield (mth end, %)
Repo Rate (mth end, %)
456789
1011
Jan-
06
Oct
-06
Jul-0
7
Apr-
08
Jan-
09
Oct
-09
Jul-1
0
Apr-
11
Jan-
12
Oct
-12
Jul-1
3
Apr-
14
Jan-
15
Oct
-15
Jul-1
6
Apr-
17
Jan-
18
India Earnings Yield (in %) India 10 Year G-sec (in %)
G-sec yield relative to equity earnings yield higher than long-term trend
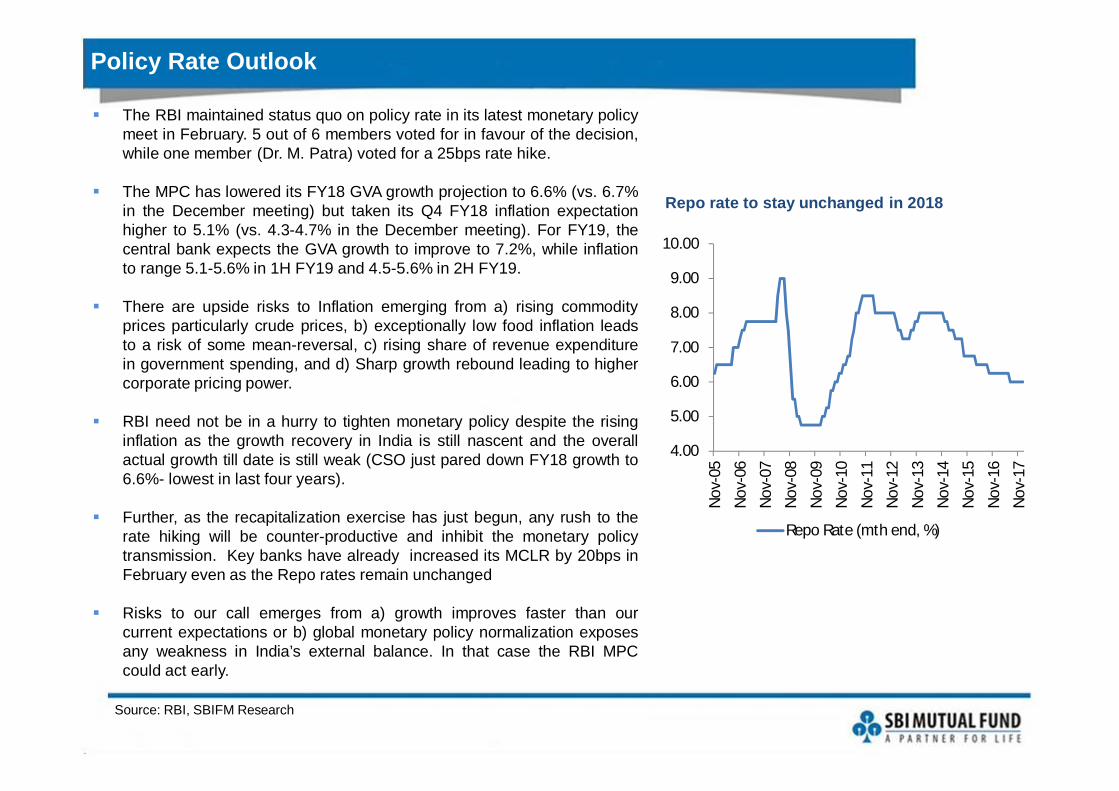
The RBI maintained status quo on policy rate in its latest monetary policymeet in February. 5 out of 6 members voted for in favour of the decision,while one member (Dr. M. Patra) voted for a 25bps rate hike.
The MPC has lowered its FY18 GVA growth projection to 6.6% (vs. 6.7%in the December meeting) but taken its Q4 FY18 inflation expectationhigher to 5.1% (vs. 4.3-4.7% in the December meeting). For FY19, thecentral bank expects the GVA growth to improve to 7.2%, while inflationto range 5.1-5.6% in 1H FY19 and 4.5-5.6% in 2H FY19.
There are upside risks to Inflation emerging from a) rising commodityprices particularly crude prices, b) exceptionally low food inflation leadsto a risk of some mean-reversal, c) rising share of revenue expenditurein government spending, and d) Sharp growth rebound leading to highercorporate pricing power.
RBI need not be in a hurry to tighten monetary policy despite the risinginflation as the growth recovery in India is still nascent and the overallactual growth till date is still weak (CSO just pared down FY18 growth to6.6%- lowest in last four years).
Further, as the recapitalization exercise has just begun, any rush to therate hiking will be counter-productive and inhibit the monetary policytransmission. Key banks have already increased its MCLR by 20bps inFebruary even as the Repo rates remain unchanged
Risks to our call emerges from a) growth improves faster than ourcurrent expectations or b) global monetary policy normalization exposesany weakness in India’s external balance. In that case the RBI MPCcould act early.
Policy Rate Outlook
Source: RBI, SBIFM Research
Repo rate to stay unchanged in 2018
4.00
5.00
6.00
7.00
8.00
9.00
10.00
Nov
-05
Nov
-06
Nov
-07
Nov
-08
Nov
-09
Nov
-10
Nov
-11
Nov
-12
Nov
-13
Nov
-14
Nov
-15
Nov
-16
Nov
-17
Repo Rate (mth end, %)
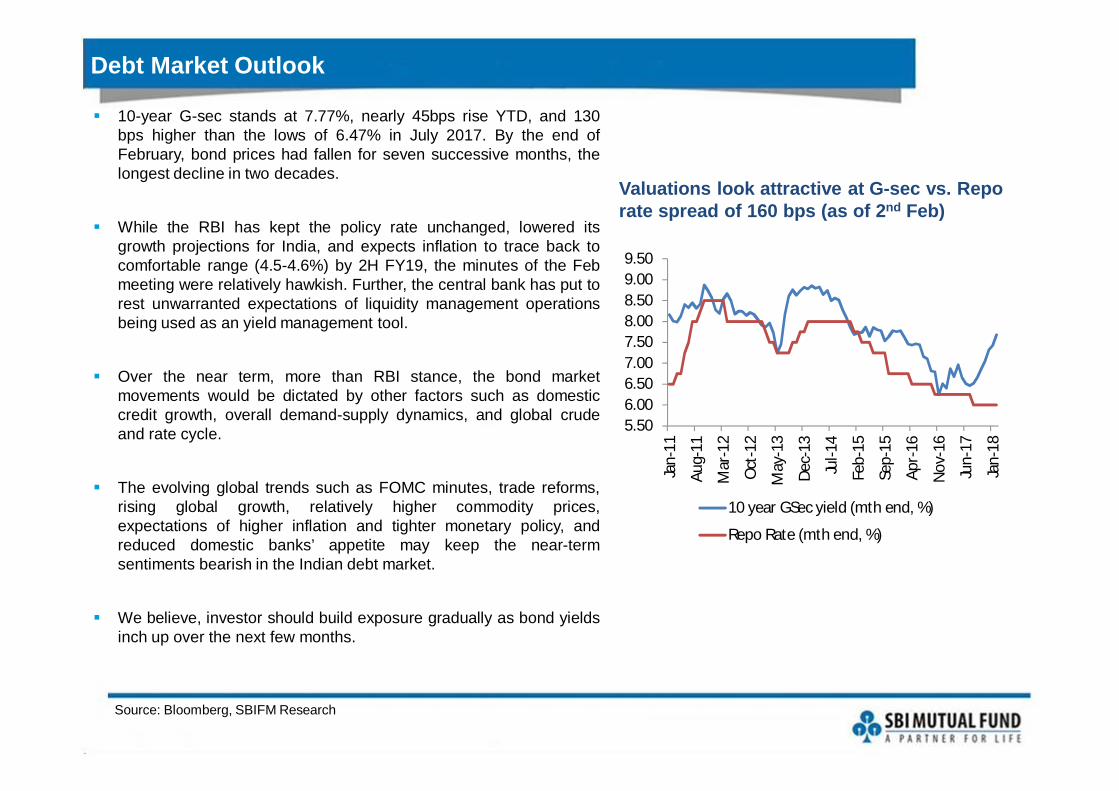
10-year G-sec stands at 7.77%, nearly 45bps rise YTD, and 130bps higher than the lows of 6.47% in July 2017. By the end ofFebruary, bond prices had fallen for seven successive months, thelongest decline in two decades.
While the RBI has kept the policy rate unchanged, lowered itsgrowth projections for India, and expects inflation to trace back tocomfortable range (4.5-4.6%) by 2H FY19, the minutes of the Febmeeting were relatively hawkish. Further, the central bank has put torest unwarranted expectations of liquidity management operationsbeing used as an yield management tool.
Over the near term, more than RBI stance, the bond marketmovements would be dictated by other factors such as domesticcredit growth, overall demand-supply dynamics, and global crudeand rate cycle.
The evolving global trends such as FOMC minutes, trade reforms,rising global growth, relatively higher commodity prices,expectations of higher inflation and tighter monetary policy, andreduced domestic banks’ appetite may keep the near-termsentiments bearish in the Indian debt market.
We believe, investor should build exposure gradually as bond yieldsinch up over the next few months.
Debt Market Outlook
Source: Bloomberg, SBIFM Research
Valuations look attractive at G-sec vs. Repo rate spread of 160 bps (as of 2nd Feb)
5.506.006.507.007.508.008.509.009.50
Jan-
11
Aug-
11
Mar
-12
Oct
-12
May
-13
Dec-
13
Jul-1
4
Feb-
15
Sep-
15
Apr-
16
Nov
-16
Jun-
17
Jan-
18
10 year GSec yield (mth end, %)
Repo Rate (mth end, %)
Thank you
Disclaimer
This presentation is for information purposes only and is not an offer to sell or a solicitation to buy anymutual fund units/securities. These views alone are not sufficient and should not be used for thedevelopment or implementation of an investment strategy. It should not be construed as investmentadvice to any party. All opinions and estimates included here constitute our view as of this date and aresubject to change without notice. Neither SBI Funds Management Private Limited, nor any personconnected with it, accepts any liability arising from the use of this information. The recipient of thismaterial should rely on their investigations and take their own professional advice.
Mutual Funds investments are subject to market risks, read all scheme related documentscarefully.
Asset Management Company: SBI Funds Management Private Limited (A joint venture with SBI andAMUNDI). Trustee Company: SBI Mutual Fund Trustee Company Private Limited.
Contact Details
SBI Funds Management Private Limited
(A joint venture between SBI and AMUNDI)
Corporate Office:9th Floor, Crescenzo, C-38 & 39, G Block,Bandra Kurla Complex,Bandra (East), Mumbai - 400 051Tel: +91 22 6179 3000Fax: +91 22 6742 5687/88/89/90/91Website: www.sbimf.com
Call: 1800 425 5425
Visit us @ www.youtube.com/user/sbimutualfund
SMS: “SBIMF” to 56161
Email: [email protected]
Visit us @ www.facebook.com/SBIMF