Market Outlook, 19 June 2013
14
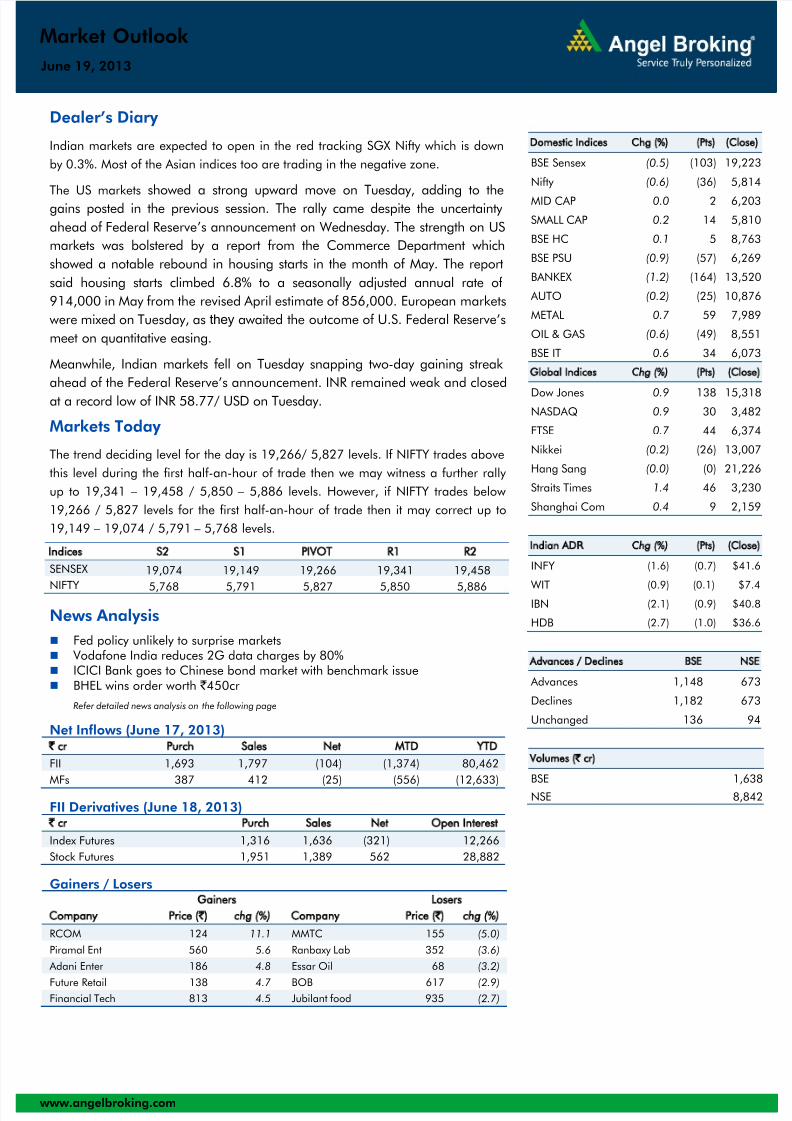
www.angelbroking.com Market Outlook June 19, 2013 Dealer’s Diary Indian markets are expected to open in the red tracking SGX Nifty which is down by 0.3%. Most of the Asian indices too are trading in the negative zone. The US markets showed a strong upward move on Tuesday, adding to the gains posted in the previous session. The rally came despite the uncertainty ahead of Federal Reserve’s announcement on Wednesday. The strength on US markets was bolstered by a report from the Commerce Department which showed a notable rebound in housing starts in the month of May. The report said housing starts climbed 6.8% to a seasonally adjusted annual rate of 914,000 in May from the revised April estimate of 856,000. European markets were mixed on Tuesday, as they awaited the outcome of U.S. Federal Reserve’s meet on quantitative easing. Meanwhile, Indian markets fell on Tuesday snapping two-day gaining streak ahead of the Federal Reserve’s announcement. INR remained weak and closed at a record low of INR 58.77/ USD on Tuesday. Markets Today The trend deciding level for the day is 19,266/ 5,827 levels. If NIFTY trades above this level during the first half-an-hour of trade then we may witness a further rally up to 19,341 – 19,458 / 5,850 – 5,886 levels. However, if NIFTY trades below 19,266 / 5,827 levels for the first half-an-hour of trade then it may correct up to 19,149 – 19,074 / 5,791 – 5,768 levels. Indices S2 S1 PIVOT R1 R2 SENSEX 19,074 19,149 19,266 19,341 19,458 NIFTY 5,768 5,791 5,827 5,850 5,886 News Analysis Fed policy unlikely to surprise markets Vodafone India reduces 2G data charges by 80% ICICI Bank goes to Chinese bond market with benchmark issue BHEL wins order worth ` 450cr Refer detailed news analysis on the following page Net Inflows (June 17, 2013) ` cr Purch Sales Net MTD YTD FII 1,693 1,797 (104) (1,374) 80,462 MFs 387 412 (25) (556) (12,633) FII Derivatives (June 18, 2013) ` cr Purch Sales Net Open Interest Index Futures 1,316 1,636 (321) 12,266 Stock Futures 1,951 1,389 562 28,882 Gainers / Losers Gainers Losers Company Price ( ` ) chg (%) Company Price ( ` ) chg (%) RCOM 124 11.1 MMTC 155 (5.0) Piramal Ent 560 5.6 Ranbaxy Lab 352 (3.6) Adani Enter 186 4.8 Essar Oil 68 (3.2) Future Retail 138 4.7 BOB 617 (2.9) Financial Tech 813 4.5 Jubilant food 935 (2.7) Domestic Indices Chg (%) (Pts) (Close) BSE Sensex (0.5) (103) 19,223 Nifty (0.6) (36) 5,814 MID CAP 0.0 2 6,203 SMALL CAP 0.2 14 5,810 BSE HC 0.1 5 8,763 BSE PSU (0.9) (57) 6,269 BANKEX (1.2) (164) 13,520 AUTO (0.2) (25) 10,876 METAL 0.7 59 7,989 OIL & GAS (0.6) (49) 8,551 BSE IT 0.6 34 6,073 Global Indices Chg (%) (Pts) (Close) Dow Jones 0.9 138 15,318 NASDAQ 0.9 30 3,482 FTSE 0.7 44 6,374 Nikkei (0.2) (26) 13,007 Hang Sang (0.0) (0) 21,226 Straits Times 1.4 46 3,230 Shanghai Com 0.4 9 2,159 Indian AD R Chg (%) (Pts) (Close) INFY (1.6) (0.7) $41.6 WIT (0.9) (0.1) $7.4 IBN (2.1) (0.9) $40.8 HDB (2.7) (1.0) $36.6 Advances / Declines BSE NSE Advances 1,148 673 Declines 1,182 673 Unchanged 136 94 Volumes ( ` cr) BSE 1,638 NSE 8,842
-
Upload
angel-broking -
Category
Documents
-
view
214 -
download
0
Transcript of Market Outlook, 19 June 2013
7/28/2019 Market Outlook, 19 June 2013
http://slidepdf.com/reader/full/market-outlook-19-june-2013 1/13
www.angelbroking.com
Market Outlook June 19, 2013
Dealer’s Diary
Indian markets are expected to open in the red tracking SGX Nifty which is down
by 0.3%. Most of the Asian indices too are trading in the negative zone.
The US markets showed a strong upward move on Tuesday, adding to the
gains posted in the previous session. The rally came despite the uncertainty
ahead of Federal Reserve’s announcement on Wednesday. The strength on US
markets was bolstered by a report from the Commerce Department which
showed a notable rebound in housing starts in the month of May. The report
said housing starts climbed 6.8% to a seasonally adjusted annual rate of
914,000 in May from the revised April estimate of 856,000. European markets
were mixed on Tuesday, as they awaited the outcome of U.S. Federal Reserve’s
meet on quantitative easing.
Meanwhile, Indian markets fell on Tuesday snapping two-day gaining streak
ahead of the Federal Reserve’s announcement. INR remained weak and closed
at a record low of INR 58.77/ USD on Tuesday.
Markets Today
The trend deciding level for the day is 19,266/ 5,827 levels. If NIFTY trades above
this level during the first half-an-hour of trade then we may witness a further rally
up to 19,341 – 19,458 / 5,850 – 5,886 levels. However, if NIFTY trades below
19,266 / 5,827 levels for the first half-an-hour of trade then it may correct up to
19,149 – 19,074 / 5,791 – 5,768 levels.
Indices S2 S1 PIVOT R1 R2
SENSEX 19,074 19,149 19,266 19,341 19,458
NIFTY 5,768 5,791 5,827 5,850 5,886
News Analysis
Fed policy unlikely to surprise markets Vodafone India reduces 2G data charges by 80% ICICI Bank goes to Chinese bond market with benchmark issue BHEL wins order worth ` 450cr
Refer detailed news analysis on the following page
Net Inflows (June 17, 2013)` cr Purch Sales Net MTD YTD
FII 1,693 1,797 (104) (1,374) 80,462
MFs 387 412 (25) (556) (12,633)
FII Derivatives (June 18, 2013)` cr Purch Sales Net Open Interest
Index Futures 1,316 1,636 (321) 12,266
Stock Futures 1,951 1,389 562 28,882
Gainers / LosersGainers Losers
Company Price (`) chg (%) Company Price (`) chg (%)
RCOM 124 11.1 MMTC 155 (5.0)
Piramal Ent 560 5.6 Ranbaxy Lab 352 (3.6)
Adani Enter 186 4.8 Essar Oil 68 (3.2)
Future Retail 138 4.7 BOB 617 (2.9)Financial Tech 813 4.5 Jubilant food 935 (2.7)
Domestic Indices Chg (%) (Pts) (Close)
BSE Sensex (0.5) (103) 19,223
Nifty (0.6) (36) 5,814
MID CAP 0.0 2 6,203
SMALL CAP 0.2 14 5,810
BSE HC 0.1 5 8,763
BSE PSU (0.9) (57) 6,269
BANKEX (1.2) (164) 13,520
AUTO (0.2) (25) 10,876
METAL 0.7 59 7,989
OIL & GAS (0.6) (49) 8,551
BSE IT 0.6 34 6,073
Global Indices Chg (%) (Pts) (Close)
Dow Jones 0.9 138 15,318NASDAQ 0.9 30 3,482
FTSE 0.7 44 6,374
Nikkei (0.2) (26) 13,007
Hang Sang (0.0) (0) 21,226
Straits Times 1.4 46 3,230
Shanghai Com 0.4 9 2,159
Indian ADR Chg (%) (Pts) (Close)
INFY (1.6) (0.7) $41.6
WIT (0.9) (0.1) $7.4IBN (2.1) (0.9) $40.8
HDB (2.7) (1.0) $36.6
Advances / Declines BSE NSE
Advances 1,148 673
Declines 1,182 673
Unchanged 136 94
Volumes (` cr)
BSE 1,638
NSE 8,842
7/28/2019 Market Outlook, 19 June 2013
http://slidepdf.com/reader/full/market-outlook-19-june-2013 2/13
www.angelbroking.com
Market Outlook June 19, 2013
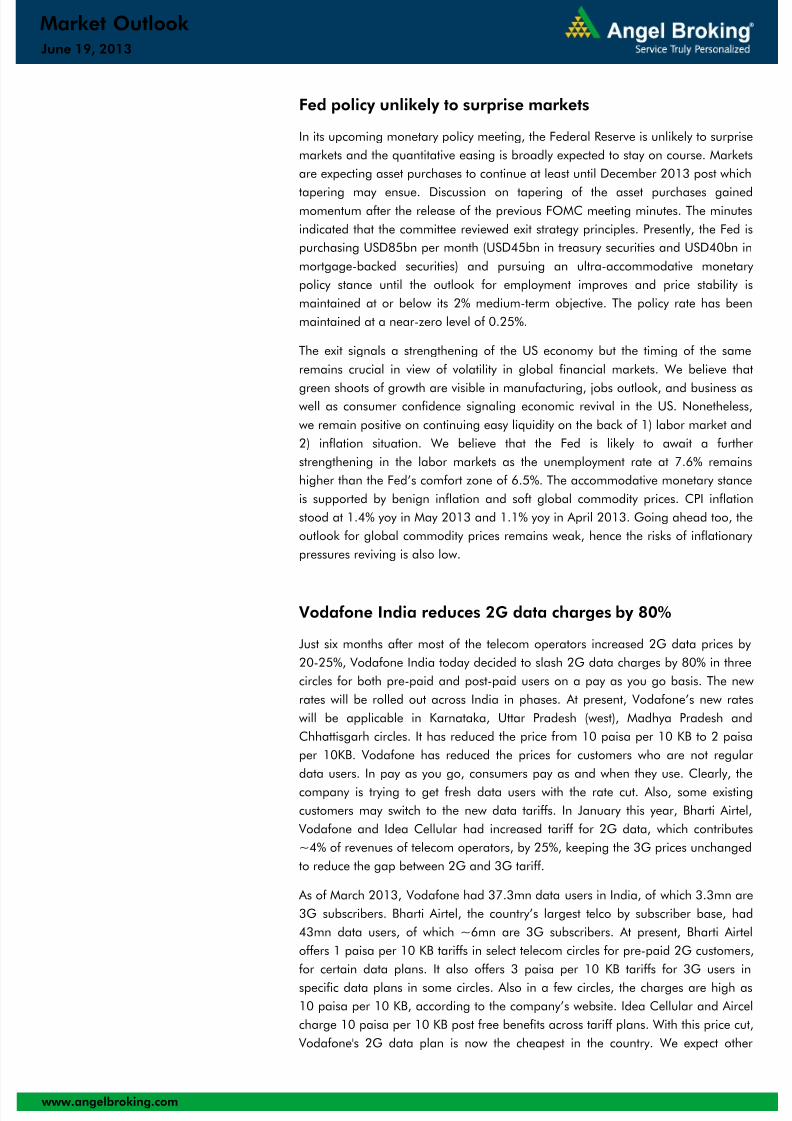
Fed policy unlikely to surprise markets
In its upcoming monetary policy meeting, the Federal Reserve is unlikely to surprise
markets and the quantitative easing is broadly expected to stay on course. Markets
are expecting asset purchases to continue at least until December 2013 post which
tapering may ensue. Discussion on tapering of the asset purchases gainedmomentum after the release of the previous FOMC meeting minutes. The minutes
indicated that the committee reviewed exit strategy principles. Presently, the Fed is
purchasing USD85bn per month (USD45bn in treasury securities and USD40bn in
mortgage-backed securities) and pursuing an ultra-accommodative monetary
policy stance until the outlook for employment improves and price stability is
maintained at or below its 2% medium-term objective. The policy rate has been
maintained at a near-zero level of 0.25%.
The exit signals a strengthening of the US economy but the timing of the same
remains crucial in view of volatility in global financial markets. We believe that
green shoots of growth are visible in manufacturing, jobs outlook, and business aswell as consumer confidence signaling economic revival in the US. Nonetheless,
we remain positive on continuing easy liquidity on the back of 1) labor market and
2) inflation situation. We believe that the Fed is likely to await a further
strengthening in the labor markets as the unemployment rate at 7.6% remains
higher than the Fed’s comfort zone of 6.5%. The accommodative monetary stance
is supported by benign inflation and soft global commodity prices. CPI inflation
stood at 1.4% yoy in May 2013 and 1.1% yoy in April 2013. Going ahead too, the
outlook for global commodity prices remains weak, hence the risks of inflationary
pressures reviving is also low.
Vodafone India reduces 2G data charges by 80%
Just six months after most of the telecom operators increased 2G data prices by
20-25%, Vodafone India today decided to slash 2G data charges by 80% in three
circles for both pre-paid and post-paid users on a pay as you go basis. The new
rates will be rolled out across India in phases. At present, Vodafone’s new rates
will be applicable in Karnataka, Uttar Pradesh (west), Madhya Pradesh and
Chhattisgarh circles. It has reduced the price from 10 paisa per 10 KB to 2 paisa
per 10KB. Vodafone has reduced the prices for customers who are not regular
data users. In pay as you go, consumers pay as and when they use. Clearly, the
company is trying to get fresh data users with the rate cut. Also, some existing
customers may switch to the new data tariffs. In January this year, Bharti Airtel,
Vodafone and Idea Cellular had increased tariff for 2G data, which contributes
~4% of revenues of telecom operators, by 25%, keeping the 3G prices unchanged
to reduce the gap between 2G and 3G tariff.
As of March 2013, Vodafone had 37.3mn data users in India, of which 3.3mn are
3G subscribers. Bharti Airtel, the country’s largest telco by subscriber base, had
43mn data users, of which ~6mn are 3G subscribers. At present, Bharti Airtel
offers 1 paisa per 10 KB tariffs in select telecom circles for pre-paid 2G customers,
for certain data plans. It also offers 3 paisa per 10 KB tariffs for 3G users in
specific data plans in some circles. Also in a few circles, the charges are high as
10 paisa per 10 KB, according to the company’s website. Idea Cellular and Aircel
charge 10 paisa per 10 KB post free benefits across tariff plans. With this price cut,
Vodafone's 2G data plan is now the cheapest in the country. We expect other

7/28/2019 Market Outlook, 19 June 2013
http://slidepdf.com/reader/full/market-outlook-19-june-2013 3/13
www.angelbroking.com
Market Outlook June 19, 2013
players in the industry to follow Vodafone’s move to make Internet access
affordable for customers who use mobile Internet in a limited way and inturn
increase the share of data subscribers in the overall subscriber base. Currently, we
maintain our Neutral rating on the overall telecom sector.
ICICI Bank goes to Chinese bond market with benchmark issue
ICICI Bank has hit the Chinese bond market with a benchmark issue of around
USD 500mn, according to some media reports. Its three-year tenor benchmark
issue is to be issued to the offshore Chinese investors and will be denominated in
the Renminbi or Yuan. An initial pricing guidance of 4.125% has been offered by
the bank. In January the bank had raised Singapore dollar 225 million from a
seven-year bond sale scheme through its Dubai branch at a coupon rate of
3.65%. The stock currently trades at 1.6x FY2015E P/ABV. We maintain our Buy
rating on the stock with a target price of `1,503.
BHEL wins order worth ` 450cr
BHEL has won an order worth ` 450cr, for renovation and modernization of a 210
MW thermal unit in Maharashtra. The order placed by Maharashtra State Power
Generation Corporation envisages design, engineering, manufacture, supply and
erection as well as commissioning of critical parts of the Boiler, Turbine and
Generator, along with their controls and instrumentation. Major equipment for the
contract will be manufactured and supplied by BHEL's plants at Trichy, Ranipet,
Haridwar, Hyderabad and Bangalore. We remain Neutral on the stock.
Economic and Political News
FIPB clears 16 FDI proposals worth ` 1,647cr
Ceiling prices of over 300 drugs to be fixed by month-end: NPPA
New financial products needed to push infra development: FM
69 power plants yet to sign FSA with CIL: CoalMin tells PMO
Govt launches schemes for free generic drugs at health centres
Corporate News VA Tech Wabag's JV gets ` 262cr project in Nepal
Bharti ties up with J&K Bank to offer 'airtel money' services
Opto Circuits' group company's partner bags CE nods for coronary stent
Religare promoters to sell 22.75% stake to meet banking rules
ONGC hires drilling rig for ` 2.39cr per day Source: Economic Times, Business Standard, Business Line, Financial Express, Mint
7/28/2019 Market Outlook, 19 June 2013
http://slidepdf.com/reader/full/market-outlook-19-june-2013 4/13
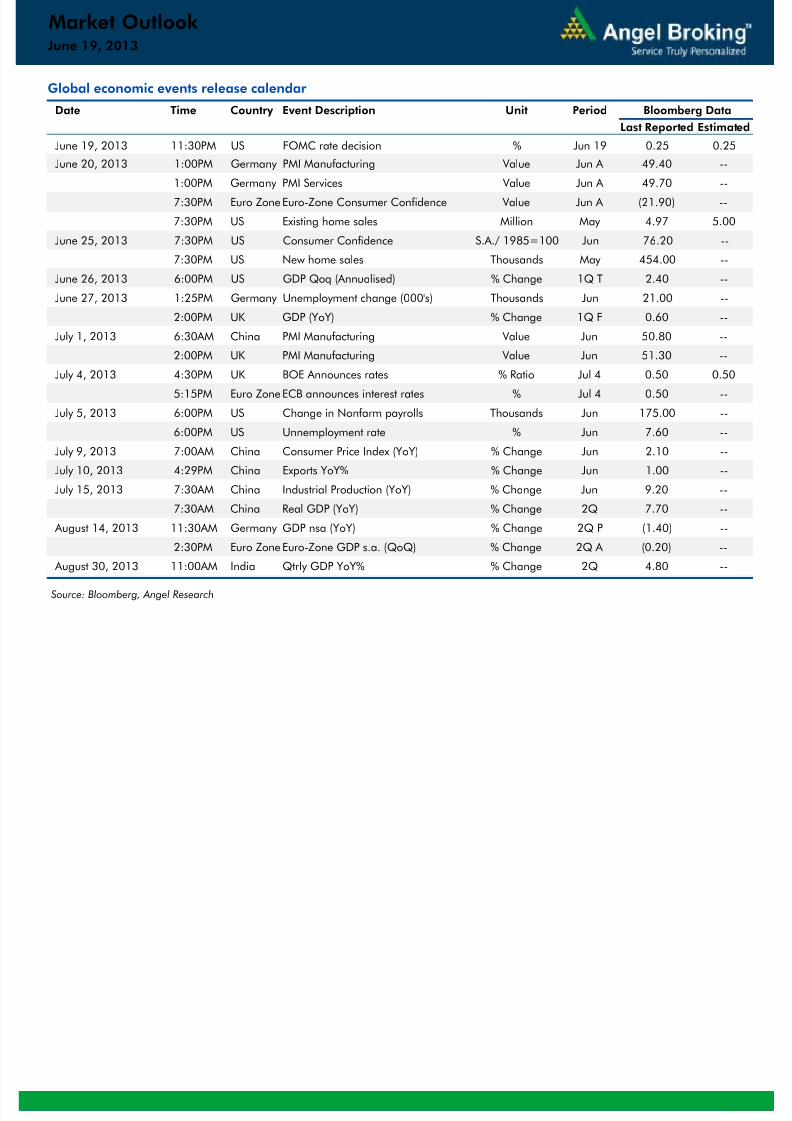
Global economic events release calendar
Date Time Country Event Description Unit Period Bloomberg Data
Last Reported Estimated
June 19, 2013 11:30PM US FOMC rate decision % Jun 19 0.25 0.25
June 20, 2013 1:00PM Germany PMI Manufacturing Value Jun A 49.40 --
1:00PM Germany PMI Services Value Jun A 49.70 --
7:30PM Euro Zone Euro-Zone Consumer Confidence Value Jun A (21.90) --
7:30PM US Existing home sales Million May 4.97 5.00
June 25, 2013 7:30PM US Consumer Confidence S.A./ 1985=100 Jun 76.20 --
7:30PM US New home sales Thousands May 454.00 --
June 26, 2013 6:00PM US GDP Qoq (Annualised) % Change 1Q T 2.40 --
June 27, 2013 1:25PM Germany Unemployment change (000's) Thousands Jun 21.00 --
2:00PM UK GDP (YoY) % Change 1Q F 0.60 --
July 1, 2013 6:30AM China PMI Manufacturing Value Jun 50.80 --
2:00PM UK PMI Manufacturing Value Jun 51.30 --
July 4, 2013 4:30PM UK BOE Announces rates % Ratio Jul 4 0.50 0.50
5:15PM Euro Zone ECB announces interest rates % Jul 4 0.50 --
July 5, 2013 6:00PM US Change in Nonfarm payrolls Thousands Jun 175.00 --
6:00PM US Unnemployment rate % Jun 7.60 --
July 9, 2013 7:00AM China Consumer Price Index (YoY) % Change Jun 2.10 --
July 10, 2013 4:29PM China Exports YoY% % Change Jun 1.00 --
July 15, 2013 7:30AM China Industrial Production (YoY) % Change Jun 9.20 --
7:30AM China Real GDP (YoY) % Change 2Q 7.70 --
August 14, 2013 11:30AM Germany GDP nsa (YoY) % Change 2Q P (1.40) --
2:30PM Euro Zone Euro-Zone GDP s.a. (QoQ) % Change 2Q A (0.20) --
August 30, 2013 11:00AM India Qtrly GDP YoY% % Change 2Q 4.80 --
Source: Bloomberg, Angel Research
June 19, 2013
Market Outlook

7/28/2019 Market Outlook, 19 June 2013
http://slidepdf.com/reader/full/market-outlook-19-june-2013 5/13
Market Outlook
June 19, 2013
www.angelbroking.com
Macro watch
Exhibit 1: Quarterly GDP trends
Source: CSO, Angel Research
Exhibit 2: IIP trends
Source: MOSPI, Angel Research
Exhibit 3: Monthly WPI inflation trends
Source: MOSPI, Angel Research
Exhibit 4: Manufacturing and services PMI
Source: Market, Angel Research; Note: Level above 50 indicates expansion
Exhibit 5: Exports and imports growth trends
Source: Bloomberg, Angel Research
Exhibit 6: Key policy rates
Source: RBI, Angel Research
9.3
7.7
11.4
9.5
8.69.2
9.9
7.5
6.56.0
5.1 5.4 5.24.7 4.8
3.0
4.0
5.0
6.0
7.0
8.0
9.0
10.0
11.0
12.0
2 Q F Y 1 0
3 Q F Y 1 0
4 Q F Y 1 0
1 Q F Y 1 1
2 Q F Y 1 1
3 Q F Y 1 1
4 Q F Y 1 1
1 Q F Y 1 2
2 Q F Y 1 2
3 Q F Y 1 2
4 Q F Y 1 2
1 Q F Y 1 3
2 Q F Y 1 3
3 Q F Y 1 3
4 Q F Y 1 3
(%)
2.5
(2.0)
(0.1)
2.0
(0.7)
8.4
(1.0) (0.6)
2.5
0.5
3.42.3
(4.0)
(2.0)
-
2.0
4.0
6.0
8.0
10.0
M a y - 1
2
J u n - 1
2
J u
l - 1 2
A u g - 1
2
S e p - 1
2
O c
t - 1 2
N o v - 1
2
D e c - 1
2
J a n - 1
3
F e
b - 1
3
M a r - 1
3
A p r - 1
3
(%)
7.58.0 8.1
7.3 7.2 7.3 7.3 7.3
5.74.9 4.7
0.0
1.0
2.0
3.0
4.0
5.0
6.0
7.0
8.0
9.0
J u
l - 1 2
A u g - 1
2
S e p - 1
2
O c
t - 1 2
N o v - 1
2
D e c - 1
2
J a n - 1
3
F e
b - 1
3
M a r - 1
3
A p r - 1
3
M a y - 1
3
(%)
48.0
50.0
52.0
54.0
56.0
58.0
M a r - 1
2
A p r - 1
2
M a y - 1
2
J u n - 1
2
J u
l - 1 2
A u g - 1
2
S e p - 1
2
O c
t - 1 2
N o v - 1
2
D e c - 1
2
J a n - 1
3
F e
b - 1
3
M a r - 1
3
A p r - 1
3
M a y - 1
3
Mfg. PMI Services PMI
(15.0)
0.0
15.0
J u n - 1
2
J u
l - 1 2
A u g - 1
2
S e p - 1
2
O c
t - 1 2
N o v - 1
2
D e c - 1
2
J a n - 1
3
F e
b - 1
3
M a r - 1
3
A p r - 1
3
M a y - 1
3
Exports yoy growth Imports yoy growth(%)
3.00
4.00
5.00
6.00
7.00
8.00
9.00
J u l - 1 2
A u g - 1
2
S e p - 1
2
O c t - 1 2
N o v - 1
2
D e c - 1
2
J a n - 1
3
F e b - 1
3
M a r - 1 3
A p r - 1 3
M a y - 1
3
J u n - 1
3
Repo rate Reverse Repo rate CRR (%)
7/28/2019 Market Outlook, 19 June 2013
http://slidepdf.com/reader/full/market-outlook-19-june-2013 6/13
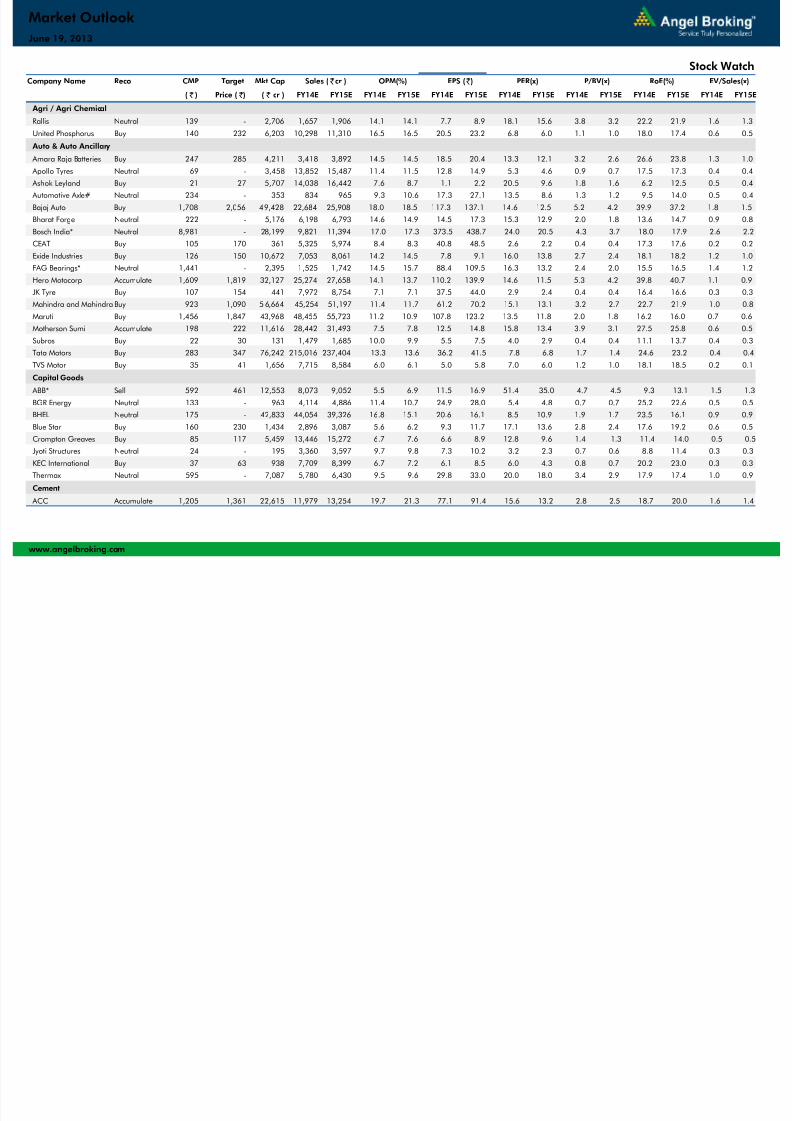
Company Name Reco CMP Target Mkt Cap Sales ( Čcr ) OPM(%) EPS (Č) PER(x) P/BV(x) RoE(%) EV/Sales(x)
( Č ) Price ( Č) ( Č cr ) FY14E FY15E FY14E FY15E FY14E FY15E FY14E FY15E FY14E FY15E FY14E FY15E FY14E FY15E
Agri / Agri Chemical
Rallis Neutral 139 - 2,706 1,657 1,906 14.1 14.1 7.7 8.9 18.1 15.6 3.8 3.2 22.2 21.9 1.6 1.3
United Phosphorus Buy 140 232 6,203 10,298 11,310 16.5 16.5 20.5 23.2 6.8 6.0 1.1 1.0 18.0 17.4 0.6 0.5
Auto & Auto Ancillary
Amara Raja Batteries Buy 247 285 4,211 3,418 3,892 14.5 14.5 18.5 20.4 13.3 12.1 3.2 2.6 26.6 23.8 1.3 1.0
Apollo Tyres Neutral 69 - 3,458 13,852 15,487 11.4 11.5 12.8 14.9 5.3 4.6 0.9 0.7 17.5 17.3 0.4 0.4
Ashok Leyland Buy 21 27 5,707 14,038 16,442 7.6 8.7 1.1 2.2 20.5 9.6 1.8 1.6 6.2 12.5 0.5 0.4
Automotive Axle# Neutral 234 - 353 834 965 9.3 10.6 17.3 27.1 13.5 8.6 1.3 1.2 9.5 14.0 0.5 0.4Bajaj Auto Buy 1,708 2,056 49,428 22,684 25,908 18.0 18.5 117.3 137.1 14.6 12.5 5.2 4.2 39.9 37.2 1.8 1.5
Bharat Forge Neutral 222 - 5,176 6,198 6,793 14.6 14.9 14.5 17.3 15.3 12.9 2.0 1.8 13.6 14.7 0.9 0.8
Bosch India* Neutral 8,981 - 28,199 9,821 11,394 17.0 17.3 373.5 438.7 24.0 20.5 4.3 3.7 18.0 17.9 2.6 2.2
CEAT Buy 105 170 361 5,325 5,974 8.4 8.3 40.8 48.5 2.6 2.2 0.4 0.4 17.3 17.6 0.2 0.2
Exide Industries Buy 126 150 10,672 7,053 8,061 14.2 14.5 7.8 9.1 16.0 13.8 2.7 2.4 18.1 18.2 1.2 1.0
FAG Bearings* Neutral 1,441 - 2,395 1,525 1,742 14.5 15.7 88.4 109.5 16.3 13.2 2.4 2.0 15.5 16.5 1.4 1.2
Hero Motocorp Accumulate 1,609 1,819 32,127 25,274 27,658 14.1 13.7 110.2 139.9 14.6 11.5 5.3 4.2 39.8 40.7 1.1 0.9
JK Tyre Buy 107 154 441 7,972 8,754 7.1 7.1 37.5 44.0 2.9 2.4 0.4 0.4 16.4 16.6 0.3 0.3
Mahindra and Mahindra Buy 923 1,090 5 6,664 45,254 51,197 11.4 11.7 61.2 70.2 15.1 13.1 3.2 2.7 22.7 21.9 1.0 0.8
Maruti Buy 1,456 1,847 43,968 48,455 55,723 11.2 10.9 107.8 123.2 13.5 11.8 2.0 1.8 16.2 16.0 0.7 0.6
Motherson Sumi Accumulate 198 222 11,616 28,442 31,493 7.5 7.8 12.5 14.8 15.8 13.4 3.9 3.1 27.5 25.8 0.6 0.5
Subros Buy 22 30 131 1,479 1,685 10.0 9.9 5.5 7.5 4.0 2.9 0.4 0.4 11.1 13.7 0.4 0.3
Tata Motors Buy 283 347 76,242 215,016 237,404 13.3 13.6 36.2 41.5 7.8 6.8 1.7 1.4 24.6 23.2 0.4 0.4
TVS Motor Buy 35 41 1,656 7,715 8,584 6.0 6.1 5.0 5.8 7.0 6.0 1.2 1.0 18.1 18.5 0.2 0.1
Capital Goods
ABB* Sell 592 461 12,553 8,073 9,052 5.5 6.9 11.5 16.9 51.4 35.0 4.7 4.5 9.3 13.1 1.5 1.3BGR Energy Neutral 133 - 963 4,114 4,886 11.4 10.7 24.9 28.0 5.4 4.8 0.7 0.7 25.2 22.6 0.5 0.5
BHEL Neutral 175 - 42,833 44,054 39,326 16.8 15.1 20.6 16.1 8.5 10.9 1.9 1.7 23.5 16.1 0.9 0.9
Blue Star Buy 160 230 1,434 2,896 3,087 5.6 6.2 9.3 11.7 17.1 13.6 2.8 2.4 17.6 19.2 0.6 0.5
Crompton Greaves Buy 85 117 5,459 13,446 15,272 6.7 7.6 6.6 8.9 12.8 9.6 1.4 1.3 11.4 14.0 0.5 0.5
Jyoti Structures Neutral 24 - 195 3,360 3,597 9.7 9.8 7.3 10.2 3.2 2.3 0.7 0.6 8.8 11.4 0.3 0.3
KEC International Buy 37 63 938 7,709 8,399 6.7 7.2 6.1 8.5 6.0 4.3 0.8 0.7 20.2 23.0 0.3 0.3
Thermax Neutral 595 - 7,087 5,780 6,430 9.5 9.6 29.8 33.0 20.0 18.0 3.4 2.9 17.9 17.4 1.0 0.9
Cement
ACC Accumulate 1,205 1,361 22,615 11,979 13,254 19.7 21.3 77.1 91.4 15.6 13.2 2.8 2.5 18.7 20.0 1.6 1.4
www.angelbroking.com
Market Outlook
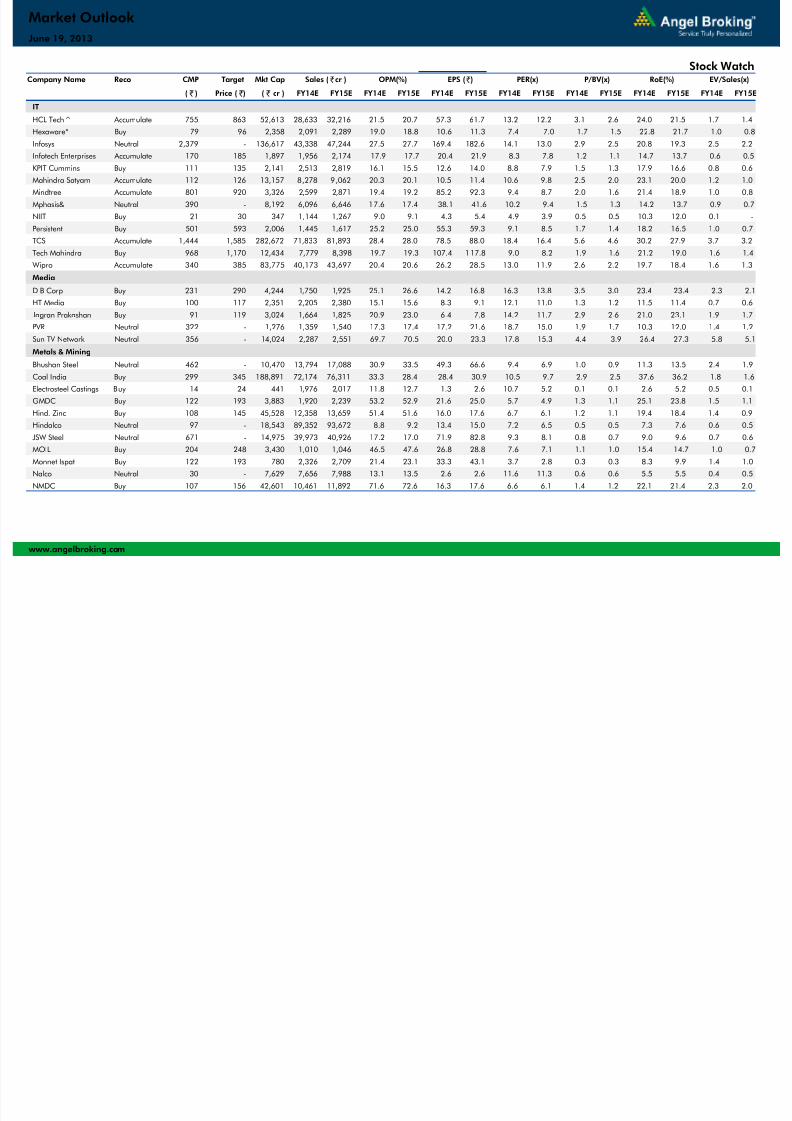
Stock Watch
June 19, 2013
7/28/2019 Market Outlook, 19 June 2013
http://slidepdf.com/reader/full/market-outlook-19-june-2013 7/13
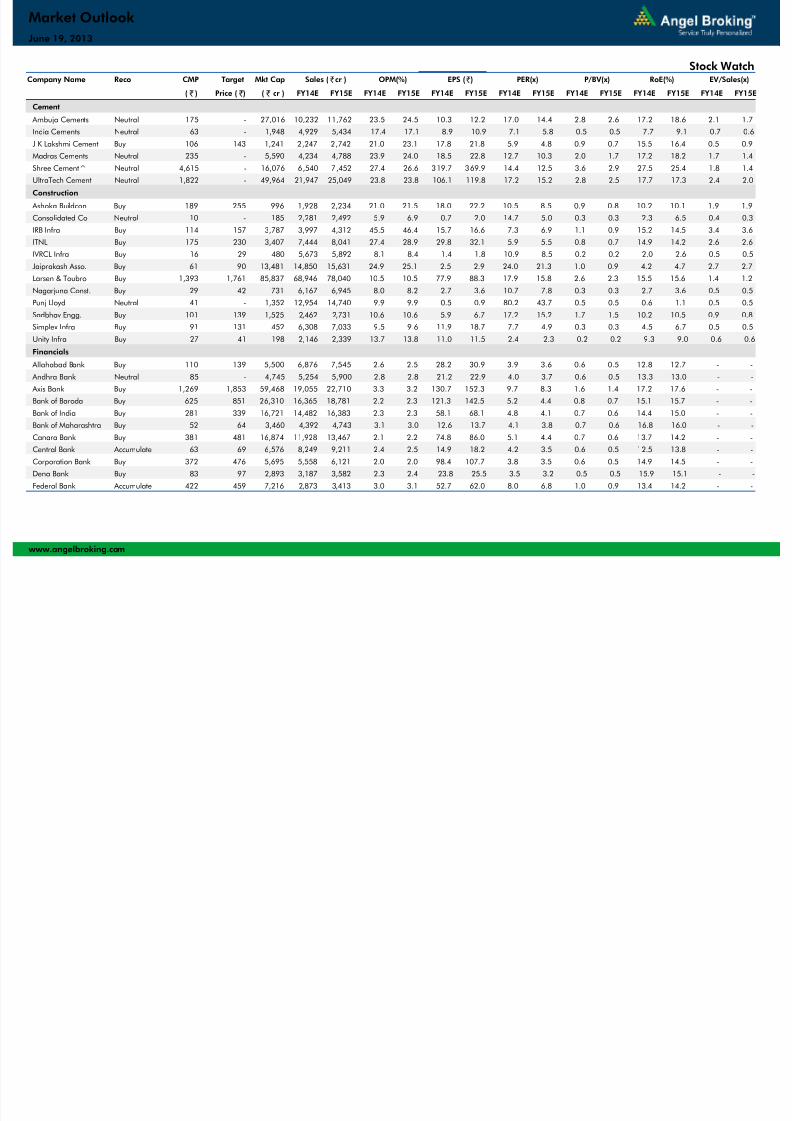
Company Name Reco CMP Target Mkt Cap Sales ( Čcr ) OPM(%) EPS (Č) PER(x) P/BV(x) RoE(%) EV/Sales(x)
( Č ) Price ( Č) ( Č cr ) FY14E FY15E FY14E FY15E FY14E FY15E FY14E FY15E FY14E FY15E FY14E FY15E FY14E FY15E
Cement
Ambuja Cements Neutral 175 - 27,016 10,232 11,762 23.5 24.5 10.3 12.2 17.0 14.4 2.8 2.6 17.2 18.6 2.1 1.7
India Cements Neutral 63 - 1,948 4,929 5,434 17.4 17.1 8.9 10.9 7.1 5.8 0.5 0.5 7.7 9.1 0.7 0.6
J K Lakshmi Cement Buy 106 143 1,241 2,247 2,742 21.0 23.1 17.8 21.8 5.9 4.8 0.9 0.7 15.5 16.4 0.5 0.9
Madras Cements Neutral 235 - 5,590 4,234 4,788 23.9 24.0 18.5 22.8 12.7 10.3 2.0 1.7 17.2 18.2 1.7 1.4
Shree Cement^ Neutral 4,615 - 16,076 6,540 7,452 27.4 26.6 319.7 369.9 14.4 12.5 3.6 2.9 27.5 25.4 1.8 1.4
UltraTech Cement Neutral 1,822 - 49,964 21,947 25,049 23.8 23.8 106.1 119.8 17.2 15.2 2.8 2.5 17.7 17.3 2.4 2.0
Construction Ashoka Buildcon Buy 189 255 996 1,928 2,234 21.0 21.5 18.0 22.2 10.5 8.5 0.9 0.8 10.2 10.1 1.9 1.9
Consolidated Co Neutral 10 - 185 2,281 2,492 5.9 6.9 0.7 2.0 14.7 5.0 0.3 0.3 2.3 6.5 0.4 0.3
IRB Infra Buy 114 157 3,787 3,997 4,312 45.5 46.4 15.7 16.6 7.3 6.9 1.1 0.9 15.2 14.5 3.4 3.6
ITNL Buy 175 230 3,407 7,444 8,041 27.4 28.9 29.8 32.1 5.9 5.5 0.8 0.7 14.9 14.2 2.6 2.6
IVRCL Infra Buy 16 29 480 5,673 5,892 8.1 8.4 1.4 1.8 10.9 8.5 0.2 0.2 2.0 2.6 0.5 0.5
Jaiprakash Asso. Buy 61 90 13,481 14,850 15,631 24.9 25.1 2.5 2.9 24.0 21.3 1.0 0.9 4.2 4.7 2.7 2.7
Larsen & Toubro Buy 1,393 1,761 85,837 68,946 78,040 10.5 10.5 77.9 88.3 17.9 15.8 2.6 2.3 15.5 15.6 1.4 1.2
Nagarjuna Const. Buy 29 42 731 6,167 6,945 8.0 8.2 2.7 3.6 10.7 7.8 0.3 0.3 2.7 3.6 0.5 0.5
Punj Lloyd Neutral 41 - 1,352 12,954 14,740 9.9 9.9 0.5 0.9 80.2 43.7 0.5 0.5 0.6 1.1 0.5 0.5
Sadbhav Engg. Buy 101 139 1,525 2,462 2,731 10.6 10.6 5.9 6.7 17.2 15.2 1.7 1.5 10.2 10.5 0.9 0.8
Simplex Infra Buy 91 131 452 6,308 7,033 9.5 9.6 11.9 18.7 7.7 4.9 0.3 0.3 4.5 6.7 0.5 0.5
Unity Infra Buy 27 41 198 2,146 2,339 13.7 13.8 11.0 11.5 2.4 2.3 0.2 0.2 9.3 9.0 0.6 0.6
Financials
Allahabad Bank Buy 110 139 5,500 6,876 7,545 2.6 2.5 28.2 30.9 3.9 3.6 0.6 0.5 12.8 12.7 - -
Andhra Bank Neutral 85 - 4,745 5,254 5,900 2.8 2.8 21.2 22.9 4.0 3.7 0.6 0.5 13.3 13.0 - -
Axis Bank Buy 1,269 1,853 59,468 19,055 22,710 3.3 3.2 130.7 152.3 9.7 8.3 1.6 1.4 17.2 17.6 - -Bank of Baroda Buy 625 851 26,310 16,365 18,781 2.2 2.3 121.3 142.5 5.2 4.4 0.8 0.7 15.1 15.7 - -
Bank of India Buy 281 339 16,721 14,482 16,383 2.3 2.3 58.1 68.1 4.8 4.1 0.7 0.6 14.4 15.0 - -
Bank of Maharashtra Buy 52 64 3,460 4,392 4,743 3.1 3.0 12.6 13.7 4.1 3.8 0.7 0.6 16.8 16.0 - -
Canara Bank Buy 381 481 16,874 11,928 13,467 2.1 2.2 74.8 86.0 5.1 4.4 0.7 0.6 13.7 14.2 - -
Central Bank Accumulate 63 69 6,576 8,249 9,211 2.4 2.5 14.9 18.2 4.2 3.5 0.6 0.5 12.5 13.8 - -
Corporation Bank Buy 372 476 5,695 5,558 6,121 2.0 2.0 98.4 107.7 3.8 3.5 0.6 0.5 14.9 14.5 - -
Dena Bank Buy 83 97 2,893 3,187 3,582 2.3 2.4 23.8 25.5 3.5 3.2 0.5 0.5 15.9 15.1 - -
Federal Bank Accumulate 422 459 7,216 2,873 3,413 3.0 3.1 52.7 62.0 8.0 6.8 1.0 0.9 13.4 14.2 - -
www.angelbroking.com
Market Outlook
Stock Watch
June 19, 2013
7/28/2019 Market Outlook, 19 June 2013
http://slidepdf.com/reader/full/market-outlook-19-june-2013 8/13
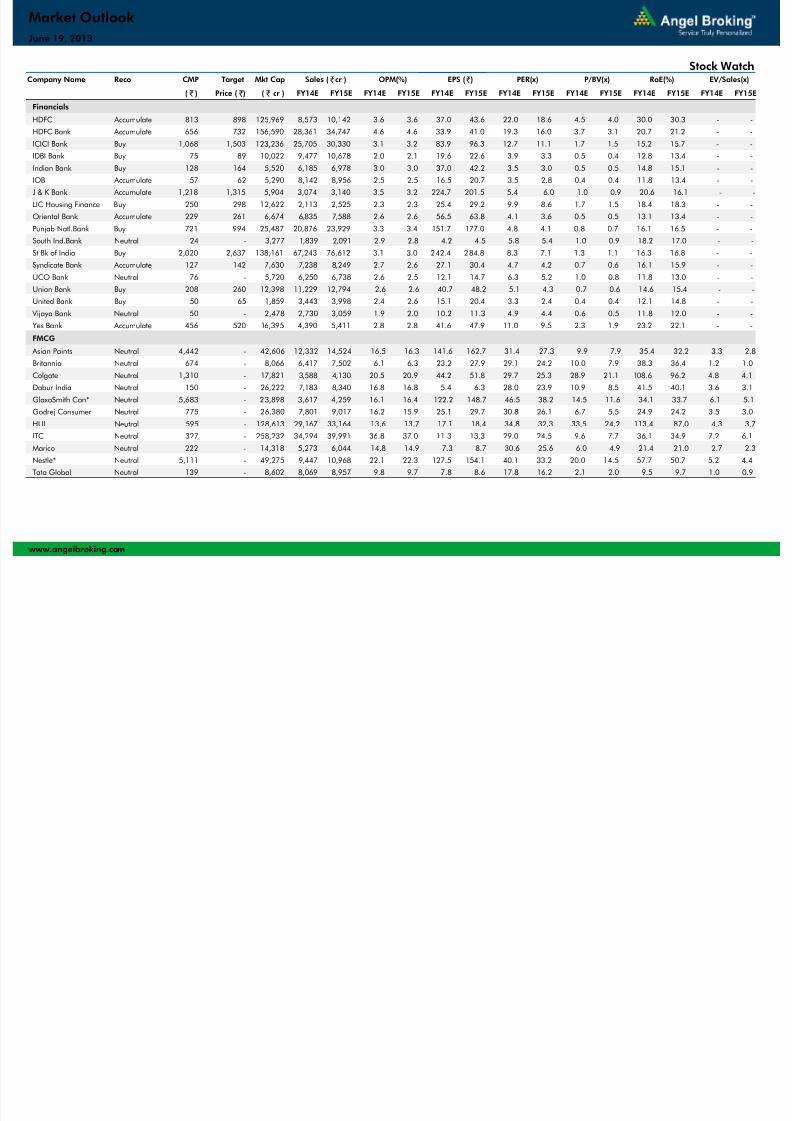
Company Name Reco CMP Target Mkt Cap Sales ( Čcr ) OPM(%) EPS (Č) PER(x) P/BV(x) RoE(%) EV/Sales(x)
( Č ) Price ( Č) ( Č cr ) FY14E FY15E FY14E FY15E FY14E FY15E FY14E FY15E FY14E FY15E FY14E FY15E FY14E FY15E
Financials
HDFC Accumulate 813 898 125,969 8,573 10,142 3.6 3.6 37.0 43.6 22.0 18.6 4.5 4.0 30.0 30.3 - -
HDFC Bank Accumulate 656 732 156,590 28,361 34,747 4.6 4.6 33.9 41.0 19.3 16.0 3.7 3.1 20.7 21.2 - -
ICICI Bank Buy 1,068 1,503 123,236 25,705 30,330 3.1 3.2 83.9 96.3 12.7 11.1 1.7 1.5 15.2 15.7 - -
IDBI Bank Buy 75 89 10,022 9,477 10,678 2.0 2.1 19.6 22.6 3.9 3.3 0.5 0.4 12.8 13.4 - -
Indian Bank Buy 128 164 5,520 6,185 6,978 3.0 3.0 37.0 42.2 3.5 3.0 0.5 0.5 14.8 15.1 - -
IOB Accumulate 57 62 5,290 8,142 8,956 2.5 2.5 16.5 20.7 3.5 2.8 0.4 0.4 11.8 13.4 - -
J & K Bank Accumulate 1,218 1,315 5,904 3,074 3,140 3.5 3.2 224.7 201.5 5.4 6.0 1.0 0.9 20.6 16.1 - -LIC Housing Finance Buy 250 298 12,622 2,113 2,525 2.3 2.3 25.4 29.2 9.9 8.6 1.7 1.5 18.4 18.3 - -
Oriental Bank Accumulate 229 261 6,674 6,835 7,588 2.6 2.6 56.5 63.8 4.1 3.6 0.5 0.5 13.1 13.4 - -
Punjab Natl.Bank Buy 721 994 25,487 20,876 23,929 3.3 3.4 151.7 177.0 4.8 4.1 0.8 0.7 16.1 16.5 - -
South Ind.Bank Neutral 24 - 3,277 1,839 2,091 2.9 2.8 4.2 4.5 5.8 5.4 1.0 0.9 18.2 17.0 - -
St Bk of India Buy 2,020 2,637 138,161 67,243 76,612 3.1 3.0 242.4 284.8 8.3 7.1 1.3 1.1 16.3 16.8 - -
Syndicate Bank Accumulate 127 142 7,630 7,238 8,249 2.7 2.6 27.1 30.4 4.7 4.2 0.7 0.6 16.1 15.9 - -
UCO Bank Neutral 76 - 5,720 6,250 6,738 2.6 2.5 12.1 14.7 6.3 5.2 1.0 0.8 11.8 13.0 - -
Union Bank Buy 208 260 12,398 11,229 12,794 2.6 2.6 40.7 48.2 5.1 4.3 0.7 0.6 14.6 15.4 - -
United Bank Buy 50 65 1,859 3,443 3,998 2.4 2.6 15.1 20.4 3.3 2.4 0.4 0.4 12.1 14.8 - -
Vijaya Bank Neutral 50 - 2,478 2,730 3,059 1.9 2.0 10.2 11.3 4.9 4.4 0.6 0.5 11.8 12.0 - -
Yes Bank Accumulate 456 520 16,395 4,390 5,411 2.8 2.8 41.6 47.9 11.0 9.5 2.3 1.9 23.2 22.1 - -
FMCG
Asian Paints Neutral 4,442 - 42,606 12,332 14,524 16.5 16.3 141.6 162.7 31.4 27.3 9.9 7.9 35.4 32.2 3.3 2.8
Britannia Neutral 674 - 8,066 6,417 7,502 6.1 6.3 23.2 27.9 29.1 24.2 10.0 7.9 38.3 36.4 1.2 1.0
Colgate Neutral 1,310 - 17,821 3,588 4,130 20.5 20.9 44.2 51.8 29.7 25.3 28.9 21.1 108.6 96.2 4.8 4.1
Dabur India Neutral 150 - 26,222 7,183 8,340 16.8 16.8 5.4 6.3 28.0 23.9 10.9 8.5 41.5 40.1 3.6 3.1
GlaxoSmith Con* Neutral 5,683 - 23,898 3,617 4,259 16.1 16.4 122.2 148.7 46.5 38.2 14.5 11.6 34.1 33.7 6.1 5.1
Godrej Consumer Neutral 775 - 26,380 7,801 9,017 16.2 15.9 25.1 29.7 30.8 26.1 6.7 5.5 24.9 24.2 3.5 3.0
HUL Neutral 595 - 128,613 29,167 33,164 13.6 13.7 17.1 18.4 34.8 32.3 33.5 24.2 113.4 87.0 4.3 3.7
ITC Neutral 327 - 258,232 34,294 39,991 36.8 37.0 11.3 13.3 29.0 24.5 9.6 7.7 36.1 34.9 7.2 6.1
Marico Neutral 222 - 14,318 5,273 6,044 14.8 14.9 7.3 8.7 30.6 25.6 6.0 4.9 21.4 21.0 2.7 2.3
Nestle* Neutral 5,111 - 49,275 9,447 10,968 22.1 22.3 127.5 154.1 40.1 33.2 20.0 14.5 57.7 50.7 5.2 4.4
Tata Global Neutral 139 - 8,602 8,069 8,957 9.8 9.7 7.8 8.6 17.8 16.2 2.1 2.0 9.5 9.7 1.0 0.9
www.angelbroking.com
Market Outlook
Stock Watch
June 19, 2013
7/28/2019 Market Outlook, 19 June 2013
http://slidepdf.com/reader/full/market-outlook-19-june-2013 9/13
Company Name Reco CMP Target Mkt Cap Sales ( Čcr ) OPM(%) EPS (Č) PER(x) P/BV(x) RoE(%) EV/Sales(x)
( Č ) Price ( Č) ( Č cr ) FY14E FY15E FY14E FY15E FY14E FY15E FY14E FY15E FY14E FY15E FY14E FY15E FY14E FY15E
IT
HCL Tech^ Accumulate 755 863 52,613 28,633 32,216 21.5 20.7 57.3 61.7 13.2 12.2 3.1 2.6 24.0 21.5 1.7 1.4
Hexaware* Buy 79 96 2,358 2,091 2,289 19.0 18.8 10.6 11.3 7.4 7.0 1.7 1.5 22.8 21.7 1.0 0.8
Infosys Neutral 2,379 - 136,617 43,338 47,244 27.5 27.7 169.4 182.6 14.1 13.0 2.9 2.5 20.8 19.3 2.5 2.2
Infotech Enterprises Accumulate 170 185 1,897 1,956 2,174 17.9 17.7 20.4 21.9 8.3 7.8 1.2 1.1 14.7 13.7 0.6 0.5
KPIT Cummins Buy 111 135 2,141 2,513 2,819 16.1 15.5 12.6 14.0 8.8 7.9 1.5 1.3 17.9 16.6 0.8 0.6
Mahindra Satyam Accumulate 112 126 13,157 8,278 9,062 20.3 20.1 10.5 11.4 10.6 9.8 2.5 2.0 23.1 20.0 1.2 1.0
Mindtree Accumulate 801 920 3,326 2,599 2,871 19.4 19.2 85.2 92.3 9.4 8.7 2.0 1.6 21.4 18.9 1.0 0.8Mphasis& Neutral 390 - 8,192 6,096 6,646 17.6 17.4 38.1 41.6 10.2 9.4 1.5 1.3 14.2 13.7 0.9 0.7
NIIT Buy 21 30 347 1,144 1,267 9.0 9.1 4.3 5.4 4.9 3.9 0.5 0.5 10.3 12.0 0.1 -
Persistent Buy 501 593 2,006 1,445 1,617 25.2 25.0 55.3 59.3 9.1 8.5 1.7 1.4 18.2 16.5 1.0 0.7
TCS Accumulate 1,444 1,585 282,672 71,833 81,893 28.4 28.0 78.5 88.0 18.4 16.4 5.6 4.6 30.2 27.9 3.7 3.2
Tech Mahindra Buy 968 1,170 12,434 7,779 8,398 19.7 19.3 107.4 117.8 9.0 8.2 1.9 1.6 21.2 19.0 1.6 1.4
Wipro Accumulate 340 385 83,775 40,173 43,697 20.4 20.6 26.2 28.5 13.0 11.9 2.6 2.2 19.7 18.4 1.6 1.3
Media
D B Corp Buy 231 290 4,244 1,750 1,925 25.1 26.6 14.2 16.8 16.3 13.8 3.5 3.0 23.4 23.4 2.3 2.1
HT Media Buy 100 117 2,351 2,205 2,380 15.1 15.6 8.3 9.1 12.1 11.0 1.3 1.2 11.5 11.4 0.7 0.6
Jagran Prakashan Buy 91 119 3,024 1,664 1,825 20.9 23.0 6.4 7.8 14.2 11.7 2.9 2.6 21.0 23.1 1.9 1.7
PVR Neutral 322 - 1,276 1,359 1,540 17.3 17.4 17.2 21.6 18.7 15.0 1.9 1.7 10.3 12.0 1.4 1.2
Sun TV Network Neutral 356 - 14,024 2,287 2,551 69.7 70.5 20.0 23.3 17.8 15.3 4.4 3.9 26.4 27.3 5.8 5.1
Metals & Mining
Bhushan Steel Neutral 462 - 10,470 13,794 17,088 30.9 33.5 49.3 66.6 9.4 6.9 1.0 0.9 11.3 13.5 2.4 1.9
Coal India Buy 299 345 188,891 72,174 76,311 33.3 28.4 28.4 30.9 10.5 9.7 2.9 2.5 37.6 36.2 1.8 1.6
Electrosteel Castings Buy 14 24 441 1,976 2,017 11.8 12.7 1.3 2.6 10.7 5.2 0.1 0.1 2.6 5.2 0.5 0.1GMDC Buy 122 193 3,883 1,920 2,239 53.2 52.9 21.6 25.0 5.7 4.9 1.3 1.1 25.1 23.8 1.5 1.1
Hind. Zinc Buy 108 145 45,528 12,358 13,659 51.4 51.6 16.0 17.6 6.7 6.1 1.2 1.1 19.4 18.4 1.4 0.9
Hindalco Neutral 97 - 18,543 89,352 93,672 8.8 9.2 13.4 15.0 7.2 6.5 0.5 0.5 7.3 7.6 0.6 0.5
JSW Steel Neutral 671 - 14,975 39,973 40,926 17.2 17.0 71.9 82.8 9.3 8.1 0.8 0.7 9.0 9.6 0.7 0.6
MOIL Buy 204 248 3,430 1,010 1,046 46.5 47.6 26.8 28.8 7.6 7.1 1.1 1.0 15.4 14.7 1.0 0.7
Monnet Ispat Buy 122 193 780 2,326 2,709 21.4 23.1 33.3 43.1 3.7 2.8 0.3 0.3 8.3 9.9 1.4 1.0
Nalco Neutral 30 - 7,629 7,656 7,988 13.1 13.5 2.6 2.6 11.6 11.3 0.6 0.6 5.5 5.5 0.4 0.5
NMDC Buy 107 156 42,601 10,461 11,892 71.6 72.6 16.3 17.6 6.6 6.1 1.4 1.2 22.1 21.4 2.3 2.0
www.angelbroking.com
Market Outlook
Stock Watch
June 19, 2013

7/28/2019 Market Outlook, 19 June 2013
http://slidepdf.com/reader/full/market-outlook-19-june-2013 10/13
Company Name Reco CMP Target Mkt Cap Sales ( Čcr ) OPM(%) EPS (Č) PER(x) P/BV(x) RoE(%) EV/Sales(x)
( Č ) Price ( Č) ( Č cr ) FY14E FY15E FY14E FY15E FY14E FY15E FY14E FY15E FY14E FY15E FY14E FY15E FY14E FY15E
Metals & Mining
SAIL Neutral 53 - 22,075 44,060 54,786 9.4 11.5 5.2 7.2 10.2 7.5 0.5 0.5 5.2 6.8 0.8 0.6
Sesa Goa Buy 140 166 12,172 3,742 4,426 32.9 32.8 30.0 29.8 4.7 4.7 0.6 0.6 14.3 12.5 4.0 3.3
Sterlite Inds Buy 82 100 27,389 44,462 45,568 23.2 24.7 18.1 20.2 4.5 4.0 0.5 0.4 11.3 11.4 0.6 0.5
Tata Steel Buy 266 378 25,849 140,917 151,537 9.7 10.8 30.9 47.6 8.6 5.6 0.8 0.7 9.6 13.4 0.6 0.5
Sarda Buy 101 153 363 1,494 1,568 19.1 20.3 31.3 36.5 3.2 2.8 0.4 0.3 11.8 12.4 0.6 0.5
Prakash Industries Buy 30 45 405 2,615 2,776 12.1 12.0 9.8 10.4 3.1 2.9 0.2 0.2 6.5 6.5 0.4 0.4
Godawari Power andIspat Buy 76 102 249 2,344 2,509 14.9 15.4 38.7 47.0 2.0 1.6 0.2 0.2 12.3 12.9 0.5 0.4
Oil & Gas
Cairn India Buy 290 345 55,398 16,482 16,228 69.4 53.3 53.3 49.6 5.4 5.9 0.8 0.8 16.5 13.6 2.0 1.7
GAIL Neutral 297 - 37,661 52,102 52,876 15.7 16.1 34.1 35.7 8.7 8.3 1.4 1.2 16.4 15.3 0.3 0.2
ONGC Buy 309 372 264,493 170,063 193,024 36.3 36.9 34.7 38.3 8.9 8.1 1.5 1.4 18.3 17.9 1.3 1.0
Reliance Industries Neutral 789 - 254,851 380,031 407,721 9.9 69.3 69.3 78.0 11.4 10.1 1.1 1.0 11.5 11.7 0.6 0.6
Gujarat Gas* Neutral 208 - 2,670 3,707 3,850 11.7 12.4 23.7 25.7 8.8 8.1 2.5 2.1 29.6 28.2 0.6 0.5
Indraprastha Gas Neutral 279 - 3,905 3,700 4,218 23.4 22.8 26.7 30.4 10.5 9.2 2.2 1.8 22.7 21.8 1.1 0.9
Petronet LNG Buy 132 167 9,870 40,356 40,872 5.8 6.4 15.0 16.7 8.8 7.9 1.8 1.6 23.0 21.5 0.3 0.3
Gujarat State PetronetLtd.
Neutral 53 - 3,005 1,171 1,287 91.9 91.9 10.1 11.3 5.3 4.7 0.9 0.7 17.3 16.8 - -
Pharmaceuticals
Alembic Pharma Accumulate 129 139 2,427 1,736 2,008 17.1 18.9 10.7 13.9 12.0 9.3 3.8 2.8 35.0 34.7 1.5 1.2
Aurobindo Pharma Buy 166 271 4,828 6,641 7,637 15.9 15.9 17.3 20.6 9.6 8.1 1.5 1.3 19.5 18.9 1.2 1.0
Aventis* Neutral 2,470 - 5,688 1,682 1,917 16.6 16.6 92.4 99.1 26.7 24.9 3.8 3.8 15.7 14.8 3.0 2.5
Cadila Healthcare Buy 741 929 15,168 7,280 8,640 15.5 15.7 38.3 46.5 19.3 15.9 4.2 3.4 23.5 23.5 2.4 2.0
Cipla Buy 379 477 30,419 9,274 10,796 23.1 23.1 21.0 23.8 18.0 15.9 2.9 2.5 17.2 16.8 3.0 2.5Dr Reddy's Buy 2,157 2,535 36,647 13,377 15,350 20.4 20.1 112.3 126.8 19.2 17.0 4.1 3.4 23.5 21.8 2.8 2.4
Dishman Pharma Buy 60 168 480 1,394 1,534 22.5 22.4 15.0 16.8 4.0 3.5 0.4 0.4 11.0 11.2 1.0 0.8
GSK Pharma* Neutral 2,469 - 20,912 2,854 3,145 28.6 28.6 76.6 83.3 32.2 29.6 9.7 8.8 31.1 31.0 6.5 5.8
Indoco Remedies Buy 64 78 594 760 922 15.3 15.3 6.1 7.8 10.6 8.3 1.3 1.1 12.9 14.7 1.0 0.8
Ipca labs Neutral 641 - 8,084 3,243 3,826 20.5 21.5 36.0 44.4 17.8 14.4 4.2 3.3 26.0 25.4 2.6 2.2
Lupin Buy 760 877 34,026 11,641 13,933 21.3 21.3 34.8 41.8 21.8 18.2 5.1 4.0 26.2 24.8 3.0 2.4
Ranbaxy* Neutral 374 - 15,818 11,400 12,060 10.5 12.5 17.5 22.5 21.4 16.6 3.4 3.0 17.0 19.1 1.3 1.2
Sun Pharma Neutral 949 - 98,171 13,509 15,846 41.0 41.0 33.0 39.8 28.8 23.9 5.8 4.8 22.0 22.0 6.7 5.5
Power
GIPCL Accumulate 70 78 1,059 1,444 1,482 33.4 33.0 13.7 14.8 5.1 4.7 0.6 0.5 12.3 12.0 0.8 0.6
www.angelbroking.com
Market Outlook
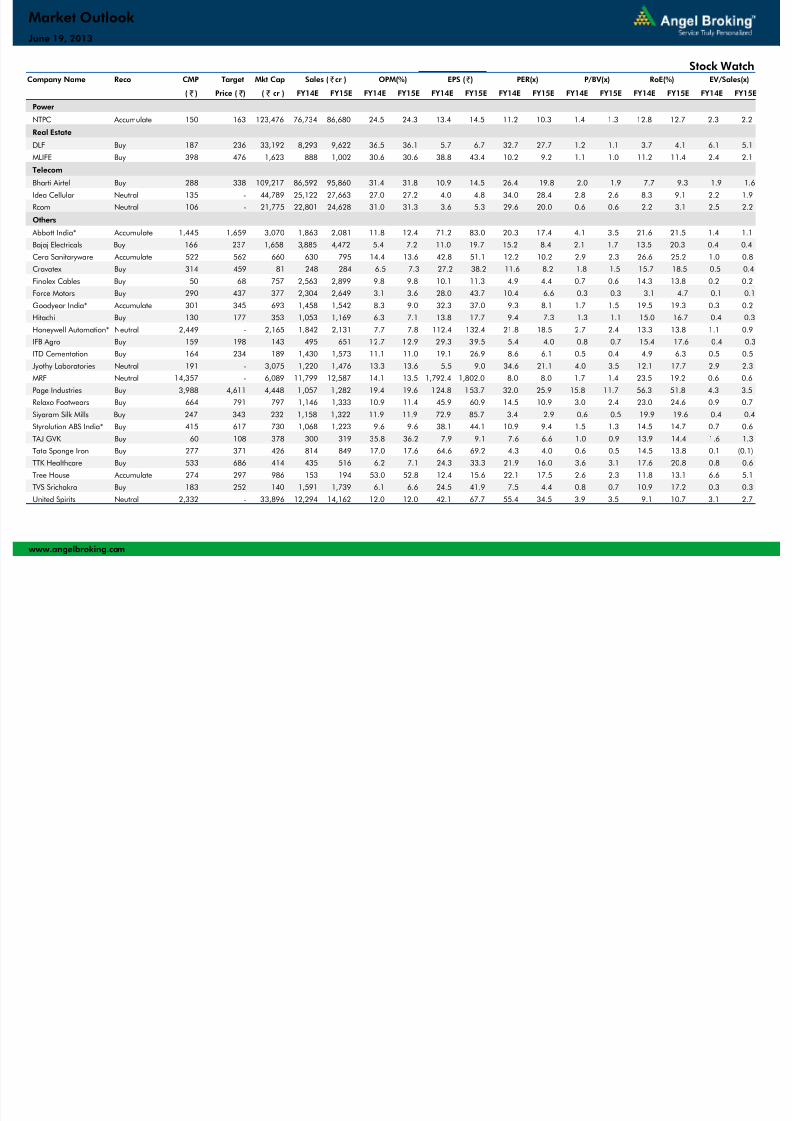
Stock Watch
June 19, 2013
7/28/2019 Market Outlook, 19 June 2013
http://slidepdf.com/reader/full/market-outlook-19-june-2013 11/13
Company Name Reco CMP Target Mkt Cap Sales ( Čcr ) OPM(%) EPS (Č) PER(x) P/BV(x) RoE(%) EV/Sales(x)
( Č ) Price ( Č) ( Č cr ) FY14E FY15E FY14E FY15E FY14E FY15E FY14E FY15E FY14E FY15E FY14E FY15E FY14E FY15E
Power
NTPC Accumulate 150 163 123,476 76,734 86,680 24.5 24.3 13.4 14.5 11.2 10.3 1.4 1.3 12.8 12.7 2.3 2.2
Real Estate
DLF Buy 187 236 33,192 8,293 9,622 36.5 36.1 5.7 6.7 32.7 27.7 1.2 1.1 3.7 4.1 6.1 5.1
MLIFE Buy 398 476 1,623 888 1,002 30.6 30.6 38.8 43.4 10.2 9.2 1.1 1.0 11.2 11.4 2.4 2.1
Telecom
Bharti Airtel Buy 288 338 109,217 86,592 95,860 31.4 31.8 10.9 14.5 26.4 19.8 2.0 1.9 7.7 9.3 1.9 1.6
Idea Cellular Neutral 135 - 44,789 25,122 27,663 27.0 27.2 4.0 4.8 34.0 28.4 2.8 2.6 8.3 9.1 2.2 1.9Rcom Neutral 106 - 21,775 22,801 24,628 31.0 31.3 3.6 5.3 29.6 20.0 0.6 0.6 2.2 3.1 2.5 2.2
Others
Abbott India* Accumulate 1,445 1,659 3,070 1,863 2,081 11.8 12.4 71.2 83.0 20.3 17.4 4.1 3.5 21.6 21.5 1.4 1.1
Bajaj Electricals Buy 166 237 1,658 3,885 4,472 5.4 7.2 11.0 19.7 15.2 8.4 2.1 1.7 13.5 20.3 0.4 0.4
Cera Sanitaryware Accumulate 522 562 660 630 795 14.4 13.6 42.8 51.1 12.2 10.2 2.9 2.3 26.6 25.2 1.0 0.8
Cravatex Buy 314 459 81 248 284 6.5 7.3 27.2 38.2 11.6 8.2 1.8 1.5 15.7 18.5 0.5 0.4
Finolex Cables Buy 50 68 757 2,563 2,899 9.8 9.8 10.1 11.3 4.9 4.4 0.7 0.6 14.3 13.8 0.2 0.2
Force Motors Buy 290 437 377 2,304 2,649 3.1 3.6 28.0 43.7 10.4 6.6 0.3 0.3 3.1 4.7 0.1 0.1
Goodyear India* Accumulate 301 345 693 1,458 1,542 8.3 9.0 32.3 37.0 9.3 8.1 1.7 1.5 19.5 19.3 0.3 0.2
Hitachi Buy 130 177 353 1,053 1,169 6.3 7.1 13.8 17.7 9.4 7.3 1.3 1.1 15.0 16.7 0.4 0.3
Honeywell Automation* Neutral 2,449 - 2,165 1,842 2,131 7.7 7.8 112.4 132.4 21.8 18.5 2.7 2.4 13.3 13.8 1.1 0.9
IFB Agro Buy 159 198 143 495 651 12.7 12.9 29.3 39.5 5.4 4.0 0.8 0.7 15.4 17.6 0.4 0.3
ITD Cementation Buy 164 234 189 1,430 1,573 11.1 11.0 19.1 26.9 8.6 6.1 0.5 0.4 4.9 6.3 0.5 0.5
Jyothy Laboratories Neutral 191 - 3,075 1,220 1,476 13.3 13.6 5.5 9.0 34.6 21.1 4.0 3.5 12.1 17.7 2.9 2.3
MRF Neutral 14,357 - 6,089 11,799 12,587 14.1 13.5 1,792.4 1,802.0 8.0 8.0 1.7 1.4 23.5 19.2 0.6 0.6
Page Industries Buy 3,988 4,611 4,448 1,057 1,282 19.4 19.6 124.8 153.7 32.0 25.9 15.8 11.7 56.3 51.8 4.3 3.5Relaxo Footwears Buy 664 791 797 1,146 1,333 10.9 11.4 45.9 60.9 14.5 10.9 3.0 2.4 23.0 24.6 0.9 0.7
Siyaram Silk Mills Buy 247 343 232 1,158 1,322 11.9 11.9 72.9 85.7 3.4 2.9 0.6 0.5 19.9 19.6 0.4 0.4
Styrolution ABS India* Buy 415 617 730 1,068 1,223 9.6 9.6 38.1 44.1 10.9 9.4 1.5 1.3 14.5 14.7 0.7 0.6
TAJ GVK Buy 60 108 378 300 319 35.8 36.2 7.9 9.1 7.6 6.6 1.0 0.9 13.9 14.4 1.6 1.3
Tata Sponge Iron Buy 277 371 426 814 849 17.0 17.6 64.6 69.2 4.3 4.0 0.6 0.5 14.5 13.8 0.1 (0.1)
TTK Healthcare Buy 533 686 414 435 516 6.2 7.1 24.3 33.3 21.9 16.0 3.6 3.1 17.6 20.8 0.8 0.6
Tree House Accumulate 274 297 986 153 194 53.0 52.8 12.4 15.6 22.1 17.5 2.6 2.3 11.8 13.1 6.6 5.1
TVS Srichakra Buy 183 252 140 1,591 1,739 6.1 6.6 24.5 41.9 7.5 4.4 0.8 0.7 10.9 17.2 0.3 0.3
United Spirits Neutral 2,332 - 33,896 12,294 14,162 12.0 12.0 42.1 67.7 55.4 34.5 3.9 3.5 9.1 10.7 3.1 2.7
www.angelbroking.com
Market Outlook
Stock Watch
June 19, 2013

7/28/2019 Market Outlook, 19 June 2013
http://slidepdf.com/reader/full/market-outlook-19-june-2013 12/13
Company Name Reco CMP Target Mkt Cap Sales ( Čcr ) OPM(%) EPS (Č) PER(x) P/BV(x) RoE(%) EV/Sales(x)
( Č ) Price ( Č) ( Č cr ) FY14E FY15E FY14E FY15E FY14E FY15E FY14E FY15E FY14E FY15E FY14E FY15E FY14E FY15E
Others
Vesuvius India* Buy 365 439 741 600 638 20.1 19.4 35.7 36.6 10.2 10.0 1.8 1.6 19.4 17.1 1.0 0.9
Source: Company, Angel Research; Note: *December year end; #September year end; &October year end; Price as on June 18, 2013
www.angelbroking.com
Market Outlook
Stock Watch
June 19, 2013
7/28/2019 Market Outlook, 19 June 2013
http://slidepdf.com/reader/full/market-outlook-19-june-2013 13/13
Market Outlook June 19, 2013