
Continuing Care Retirement Communities & CARF-CCAC Accreditation.
Upload
truongminhCategory
view
215download
0
Market Needs and Economic Impact of Continuing Care Retirement Communities in North Carolina
Stephen J. Appold, Ph.D. James H. Johnson, Jr., Ph.D. Allan M. Parnell, Ph.D.
November 2015
Frank Hawkins Kenan Institute of Private Enterprise University of North Carolina at Chapel Hill
2 Appold, Johnson, and Parnell
Executive Summary
Over the next two decades, North Caro-lina’s senior population is projected increase by 68 percent – from 1.5 million in 2014 to 2.5 million in 2034. Continuing Care Retirement Communities (CCRCs)—institutional entities that meet the health and lifestyle needs of older adults as they age—con-stitute important residential and care options for our state’s rapidly growing population of seniors. CCRCs typically include independent living units, assisted living units, and skilled nursing care facilities. With this continuum of care, CCRC residents can avoid subsequent residential moves as their health and func-tional abilities decline. CCRCs therefore are a type of serviced real estate – that is, real estate bundled with a set of guaranteed services which are partially prepaid. However, given shifting economic and demographic trends in the marketplace, a number of CCRCs are beginning to expand services beyond their campuses.
Licensed through the North Carolina Depart-ment of Insurance, there are 57 CCRCs in the state of North Carolina. All 57 provide independent living units, 51 offer assisted living units, 53 operate nurs-ing facilities, and 36 have dementia care units. Over-all occupancy rates are in the high 80 percent range with a degree of variation among the 57 communities.
Driven primarily by the distribution of high wealth seniors—presently their main clientele, CCRCs are concentrated in or near major metro-politan areas and in selected resort retirement areas within the state. The annual cost of living/care in a CCRC is determined in part by land costs. As a consequence, CCRCs may increasingly locate near the suburban frontier of the largest, rapidly-grow-ing metropolitan areas over the next few decades.
In 2014, North Carolina’s 57 CCRCs housed 18,961 residents and employed an estimated 14,906 workers across all skill levels. CCRC’s total ongoing pur-chases ($979 million), including payroll ($499 million), generated an estimated total economic impact of $1.7 billion. This included $94 million in direct and indirect state and county taxes and $152 million in federal taxes.
Two decades from now, in 2034, CCRCs are projected to house 35,381 residents and employ 29,752 workers. CCRC’s total ongoing purchases ($1.8 bil-lion), including payroll ($931 million), will generate an estimated total economic impact of $3.2 billion, including $174 million in direct and indirect state and county taxes and $283 million in federal taxes.
Beyond our projection horizon, insufficient wealth accumulation may constrain or prevent subse-quent cohorts of seniors from considering CCRCs as realistic residential and care options in their matur-ing years. Recently, in anticipation of this potential-ity, CCRCs have extended their circles of care beyond their core, well-to-do clientele to include individuals with a net worth below their normal requirements and to seniors in the local community opting to age in place. As they continue to do so, they will increasingly need to deal with the effects of growing income in-equality and with the impacts of rising health threats, such as obesity and its consequences, on aging cohorts.
3
1.0 Introduction and Purpose
North Carolina’s senior population is large and growing. Several forces contribute to this state of affairs: a century-long secular decline in fertility; increased longevity among those reach-ing maturity; the aging of the post WWII baby boom cohort; and the continuing attractiveness of the state as a migration destination for retirees.
Population aging creates a service need and con-stitutes a major opportunity for business development and job growth in North Carolina. But four factors in-troduce uncertainty into business and employment op-portunities for serving the growing senior population.
First, we are in the midst of a major transi-tion where senescence – organ system frailty without any discernible external cause (old age) – may replace chronic illnesses as the primary cause of death.1 Un-fortunately, we are not there yet. The present is still characterized by a significant incidence of chronic dis-eases which decrease the quality of life and increase the burden of care. The pace of this transition from chronic-disease-induced to senescence-induced death will impact the future need for and burden of care.
Second, the growth of income inequality combined with hyper-residential segregation along race and ethnic lines create a situation wherein means and needs do not necessarily coincide. Grow-ing numbers of seniors are aging in place in house-holds with few (if any) financial assets and in com-munities characterized by concentrated poverty.
Third, as a retiree migration destination, uncertainty regarding whether future migra-
tion to North Carolina will continue unabated, accelerate, or plateau raises questions about the future volume of demand for senior services.
Fourth, an array of service delivery alternatives increases the business risks of any individual model.
LeadingAge NC is the professional associa-tion that engages in education, advocacy, and applied research on the behalf of non-profit Continuing Care Retirement Communities (CCRCs) and other resi-dential care services in the state. It provides critical business intelligence that supports the strategic deci-sion making of its members—both in terms of how to operate more efficiently and respond quickly to shifting consumer and labor market contingencies.
CCRCs are residential communities that strive to meet the health and lifestyle needs of older adults as they age. CCRC campuses typically include inde-pendent living units, assisted living units, and skilled nursing care facilities. And some are adding dementia care units to the service mix. This continuum of care means that CCRC residents can avoid further moves as their health and functional abilities decline. CCRCs therefore are a type of serviced real estate – that is, real estate bundled with a set of guaranteed services.2 In addition, in response to market forces, some CCRCs are expanding beyond their campuses to offer services like non-medical home care in their local communities.
LeadingAge NC member communities op-erate in a regulated market. As a consequence, it needs critical and timely information that politi-cians and governmental officials require when considering governance issues affecting CCRCs. LeadingAge NC member communities also operate
1 James F. Fried (2000) “Compression of morbidity in the elderly,” Vaccine 18: 1584-1589; James F. Fried (1980) “Aging, natural death, and the compression of morbid-ity,” New England Journal of Medicine 303: 130-135.2 For additional background, see Patricia E. Sprigg (2010) “Continuing Care Retirement Communities in North Carolina,” North Carolina Medical Journal 71: 170-172.

4 Appold, Johnson, and Parnell
in a labor-intensive economic sector that requires significant capital investment. It therefore also needs information on the likely future demand for member services and future human resource supply.
The purpose of this study is to provide Lead-ingAge NC with the mission critical information re-quired to both serve the strategic planning needs of its members and represent them in the broader elder care marketplace. To set the context for the research, we begin with essential background information on Lead-ingAge NC member communities and the economic and demographic context in which they currently op-erate and will likely operate in the foreseeable future.
2.0 Critical Background and Context
LeadingAge NC’s 63 non-profit member communities statewide employ over 14,000 mission-oriented staff to serve a residential population of over 20,000.3 In the foreseeable future CCRCs may grow in appeal as a popular residential and care choice for retirees as baby boomers move further into re-tirement age. Although national population trends are reasonably well-defined, state and local trends are less predictable, particularly when the target market may be a relatively small proportion of the population. Several factors increase uncertainty.
First, a significant proportion of the North Carolina population has migrated to the state recently. Over the 2000-2010 decade, retirement migration to the state was significant. The degree to which the re-tirement migration trend will continue is unclear as the nature of the housing market, including relative hous-ing prices, continues to evolve. Moreover, the degree to which present residents will remain in the state as they
age and retire is also unknown; they may themselves move to other locations and states. However, results from the Genworth 2015 Cost of Care Survey, seen in Figure 1, reveals that North Carolina continues to be an attractive opportunity compared to New York and Florida, suggesting that North Carolina may remain a popular retirement destination in the foreseeable future as long as costs within the state for seniors do not rise significantly compared to other options.4
Second, LeadingAge NC member communi-ties are primarily oriented towards those with signifi-cant wealth-based income—savings (including from pensions) and investments typically accumulated from well-paying employment and profitable busi-ness ownership. Factors which affect the ability to earn and save will impact the size of the market for LeadingAge NC members’ services. Average return on investments will also impact market size. Addi-tionally, expected longevity will impact market size in two ways: the sufficiency of savings to pay for services is determined in part by the expected duration of need and expected (healthy) life expectancy at age of entry helps determine level and nature of services needed.
Third, a significant proportion of LeadingAge NC residents lived in the communities near the CCRC before entering. The evolving nature of the North Carolina economy – impacted by skill requirement changes, sectoral shifts, corporate restructuring, and modification of facility location preferences – will in-fluence the strength of the various feeder markets. On the one hand, those North Carolina regions heavily dependent upon manufacturing may decline in their ability to generate clientele. On the other, North Caro-lina regions with strong economic growth and related in-migration may continue to grow in relative strength.
3 http://www.leadingagenc.org/4 Genworth 2015Cost of Care Survey, available at https://www.genworth.com/dam/Americas/US/PDFs/Consumer/corporate/130568_040115_gnw.pdf.

5
As such growth moves towards regional peripheries and down the urban hierarchy, the future markets for the services of LeadingAge NC members may spread.
The size and location of the market, com-bined with employment separation patterns, will largely determine workforce needs in CCRCs.
3.0 Objectives, Data Sources, and Organization of the Study
The objectives of this study are twofold: (1) to pro-vide LeadingAge NC with baseline market demand projections–information that can be used by member communities to support short- and long-term stra-tegic planning decisions; and (2) to derive esti-mates of the economic contributions of CCRCs in North Carolina—information that LeadingAge NC can reference in discussions with public officials.
To achieve these objectives, two types of data were required: broad demographic and con-textual data for the nation and the state; and sta-tistical information pertaining specifically to CCRC operations in North Carolina. Most of the requisite data were available via public sources.
The broad contextual data were extracted from multiple sources: counts of individuals and households by age, sex, and income were extracted from the 2010 Census and the American Community Survey; county-level population projections were taken from a source complied by the North Carolina Office of Budget and Management; information about household wealth came from The Survey of Consumer Finances; data pertaining to the spending patterns of older Ameri-cans were drawn from The Current Expenditure Survey; and information about trends in occupational employment demand and supply were taken from the
Figure 1: Annual Cost of Care in Selected States, 2015
Source: Genworth 2015 Cost of Care Survey
6 Appold, Johnson, and Parnell
Bureau of Labor Statistics.5 These sources are dis-cussed in greater detail below as their data are analyzed.
Most of the CCRC-community specific data were supplied directly or indirectly by LeadingAge NC members. The CCRCs provided critical statisti-cal information on their residents, including age, age at time of entry, health status, and financial status, as well as summaries of income and costs; their em-ployees, including skill level, present age, age at time of hire, and separation rates; and their operations, including multi-year data that allowed accurate meas-urement of construction and other capital investments.
To validate the information received from the member CCRCs, we also drew upon data compiled by the North Carolina Department of Insurance, which regulates CCRCs, and the 2014 Continuing Care Retirement Community Operations Bench-marking Survey, which contains valuable baseline information on CCRC communities in Florida, Maryland, Pennsylvania, and Tennessee, as well as North Carolina. Interviews with LeadingAge NC expert informants were helpful in understanding financial trends and the factors which may influ-ence managerial decisions in CCRC communities.
The remainder of this study is organized as fol-lows:
Because emergent shifts in the demography and economy of North Carolina will have a direct impact on CCRC operations, Part 4 provides base-line contextual information on the size, composi-tion, and health status of North Carolina’s total and senior populations. It also highlights the impor-tance of North Carolina CCRCs as residence and
care options given the state’s demographic shifts.
Part 5 provides baseline projec-tions of market demand over the coming 20 years (2014 through 2034), including:
• 20-yearprojectionsforthepopulationage 45 and older by ten-year age groups and likely trends in age-specific mortality, age-specific migration, and disability-free life. • Forecasts of the wealth, income andother economic measures for retirees and near-retirees. • Projectionsof long-termtrendsinthehealth status of retirees, including trends in disability and active-life expectancy.
Based on a synthesis of the foregoing de-mographic, economic, and health forecasts, Part 5 concludes with an empirically–based portrait of the potential CCRC market in the coming decades.
Part 6 assesses future labor force require-ments based on the market projections derived in Part 5. Estimates of the size and mix of pay/skill and experience needed to staff North Caro-lina’s CCRCs as the resident population grows are included. An assessment of the potential impacts of labor supply on labor costs is also included.
Part 7 presents the results of our analysis of the economic impact of LeadingAge NC member CCRCs, collectively, on the North Carolina economy, and, indi-vidually, on the county economies where they are locat-ed. For the purposes of this study, “economic impact” included the spending of CCRC residents, the purchas-es of LeadingAge NC members for operations and in-
5 Other data sources, such as the Health and Retirement Study and the Panel Study of Income Dynamics provide strong estimates of life course trajectories but they are not oriented towards the income segment of most relevant interest.

7
vestment, and the backward linkages of such spending.
In Part 8, we summarize our major findings and present our conclusions. Sup-porting documents appear in the appendices.
4.0 North Carolina Continuing Care Retirement Communities in Context
The demography and economy of North Caro-lina are critical factors affecting the strategic manage-ment of CCRCs. The size and well-being of the senior population are a critical aspect of the state’s demogra-phy. In this section, we provide a brief overview of North Carolina demography as it pertains to the location and depth of the potential demand for CCRC services. We then present a brief summary of the state’s CCRCs.
4.1 Population Change
As of the 2010 Census, North Carolina’s population totaled 9,535,482. The Census Bureau’s 2014 estimate places North Carolina’s population at 9,943,964, an increase of 408,482 over an approxi-mate four-year period and an increase of 1,894,651 over the Census 2000 population count of 8,049,313. North Carolina has now eclipsed Michigan to become the nation’s ninth-largest state. Although the state’s population is growing rapidly, population growth is out-pacing employment growth and the state’s economy as a whole is not faring particularly well. North Carolina has long been a relatively poor state, but, as economic theory would predict, per capita income in North Carolina converged toward the national average for much of the 20th century. That convergence came to a halt in the late 1990s and has reversed course. North Carolina per capita income
has even dropped compared to the Southeast aver-age, leaving pockets of prosperity in a sea of decline.
As Figure 2 shows, population is sprinkled throughout the state, but it is highly concentrated in the central Piedmont stretching in an arch from Raleigh through Durham, Burlington, Greens-boro, Winston-Salem, and High Point to Charlotte. High population concentrations also exist in Fay-etteville with its large military presence, Wilm-ington, and the Asheville-Henderson corridor.
Migration is a central factor in North Caroli-na’s population growth. Net migration accounted for over two thirds (1,004,414) of the population increase (1,486,170) between 2000 and 2010.6 Consequently, as of 2010, 58.4 percent (5,571,420) of North Caro-lina’s population were “born and bred,” 33.8 percent (3,218,940) were “domestic imports” who had mi-grated to the state from elsewhere in the U.S., and 7.8 percent (745,123) were “immigrants.” The long-term impact of migration can be seen in Figure 3. As is the case with the population as a whole, lifetime in-migrants and their families can be found throughout the state but are also more heavily concentrated in the major metropolitan areas, in university centers such as Chapel Hill and Greenville, near the military bases, and in the resort areas of the mountains, Sandhills, and along the coast. The Triangle and Charlotte Metrolina, which spills over into South Carolina, are growth centers of national prominence. These are the prosperous areas of the state and the likely sources of continuing demand for CCRC services.
The state’s population change has been driven largely by external economic forces. North Carolina historically was an agricultural state made up of small
6 Net migration can only be accurately calculated across Census years.

8 Appold, Johnson, and Parnell
Figure 2: North Carolina Population, Census 2010 by tract
Source: Authors’ analysis of ACS and Census 2010 data
Source: Authors’ analysis of ACS and Census 2010 data
Note: One Dot = 500 persons
Figure 3: North Carolina Population – Domestic import (includes children), Census 2010 by tract
Note: One Dot = 250 persons

9
towns and few notable cities. Over several decades, agricultural employment declined, even if the indus-try itself remains important to the state’s economy, especially in rural areas and small and medium-sized towns which served as agricultural service centers.
For over a century, manufacturing has been moving into the state, mainly from the Northeast. Cigarette manufacturing, furniture making, and textiles grew in newly-established railroad towns to make use of North Carolina’s combination of ag-ricultural products and low-cost, mainly low-skill labor. Manufacturing is still attracted to the state and is expected to continue to maintain an important presence in the economy. However, like agriculture, manufacturing has been shedding low-skill employ-ees and concentrating in durable, rather than non-durable, products. These changes have negatively affected the medium-sized towns and rural areas where much of the traditional and post-World War Two waves of industrial growth had located. Recent investment in manufacturing has benefited mainly the Triad and Charlotte, which are the two largest concentrations of manufacturing in North Carolina.
During the last half of the previous century, the largest cities in North Carolina became attractive to the growing producer services sector. Some of the growth was tied to the increasing prosperity of the South; some moved in from out-of-state; and some consolidated from the smaller cities within the state. Charlotte could build on its strengths in banking and as a regional central place just a level below Atlanta. The Triangle could build on the base provided by state government employment and the amenities implied by the presence of three major universities. Accord-ingly, as banking was deregulated, Charlotte became
an attractive, low-cost location for inter-state banking and similar functions which thrived as the South as a whole grew. Similarly, as corporate research grew and housing costs in the Northeast increased, the Triangle became an attractive, low-cost location for such activi-ties. More recently, such growth has been abetted by “build out” in select large northeastern and west coast cities which, by increasing costs in those locations, accelerated job shifts to places like North Carolina. Air transportation has played a critical role in these developments, as railroads and highways earlier did. Charlotte bankers and RTP computer scientists can fly to New York for morning meetings and return to their home office in the afternoon. Some demogra-phers see Charlotte and the Triangle less as inde-pendent cities than as distant exurban employment clusters of New York and Washington DC. Many of the in-migrants occupy highly paid positions and will possibly wish to remain in North Carolina after they retire, although likely with a lower probability than native-born Tar Heels. The distribution of college-educated persons, illustrated in Figure 4, is an indica-tor of the locations of prosperity and of likely future demand for CCRC services. That sub-population is sparser and more heavily concentrated in the major metropolitan regions than the population as a whole.
Several demographic implications under-gird these economic shifts. The resulting imbalance in skill needs and skill supply has resulted in the movement of large numbers of people into North Carolina to fill unmet labor force needs. As if to underline the importance of movement from the Northeast, over ten percent of the lifetime migrants to North Carolina relocated from New York, with other states in the Northeast also heavily repre-sented. As previously noted, the in-migrants have

10 Appold, Johnson, and Parnell
tended to concentrate in specific areas of the state. But they may be spreading out, as evidenced by the data in Figure 5, which depicts rates of net migration to North Carolina counties between 2000 and 2010.
The differences in migration rates bespeak an economy of sun and shadows. Like the rest of the U.S., North Carolina is impacted by growing income inequality which is partially visible in the geographic patterns. Some counties experienced net out-migra-tion during the first decade of the new millennium, helping to produce a heightened North Carolina reliance on government transfer income as a conse-quence. In some counties, over 30 percent of every dollar of income stems from such transfers. Some analysts have concluded that prosperity continues to be secure for those in the upper 20 percent or so of the income distribution.7 Yet many of the highly-paid jobs in the producer service sector are themselves at
risk from the same factors which impacted manufac-turing jobs before them: automation and out-sourcing overseas. As the producer service sector continues to grow, pressure on labor cost will likely continue.
The differences in regional economies and places within those economies imply differences in the nature of aging and the residential choices that individuals will (and will be able to) make over time. One baseline model for evolving prosper-ity would posit that the tides of time raise or lower all ships at the same rate. An alternative would be that counties and populations bifurcate, with some prospering and others languishing. In our projec-tions, we provisionally assume that counties and individuals maintain present-day patterns but iden-tify possible sources of deviation from the trend.
In the dynamic metropolitan areas, growth
Figure 4: North Carolina Population aged 25 or more by education – College degree, Census 2010 by tract
Source: Authors’ analysis of ACS and Census 2010 data
Note: One Dot = 250 persons
7 Blank, Rebecca M. (2011) Changing inequality, Berkeley: University of California Press.

11
rates may be slowing in the core areas but possibly diffusing outward into suburban counties, such as Chatham and Alamance counties near the Trian-gle and to revived medium-sized cities, which have become satellite jurisdictions because land costs are lower. These movements are sometimes still small and may remain so but they are important to understand-ing both the catchment areas for CCRCs and future CCRC location trends. Smaller towns which are not too distant from major metropolitan areas may offer an attractive combination of lifestyle and price.8
4.2 Health and Wellness
Along with longevity, the quality of life has im-portant implications for the management of CCRCs. Health status dictates the amount and type of care
needed. Given that CCRC residents, in effect, pre-pay for a portion of the medical care they will need, accurate prediction of health status is an important strategic management task. As suggested above, there are three broad possibilities concerning the incidence of illness over a lifetime.
The first entails a significant incidence of chronic disease. The second implies that improved medical care will only result in prolonging life at the cost of reducing the quality of life – possibly leading to little or no more quality-adjusted life years – while in-curring growing societal costs for treatment and care.9 A third “compression of morbidity” option suggests that average life span will not increase substantially, but delaying the onset of chronic illness will compress poor health into a few years before death when organ
Figure 5: County Migration Rates - North Carolina, 2000-2010
Source: Based on data from Winkler, Richelle, Kenneth M. Johnson, Cheng Cheng, Jim Beaudoin, Paul R. Voss, and Katherine J. Curtis. Age-Specific Net Migration Estimates for US Counties, 1950-2010. Applied Population Laboratory, University of Wisconsin- Madison, 2013, http://www.netmigration.wisc.edu/, accessed 13 November 2013.
8 Tarboro, for example, is the site of a senior living center, The Fountains at the Albemarle, which is one block away from the town’s walkable main commercial street.9 Olshansky SJ, Rudberg MA, Carnes BA, Cassell CK & Brody JA (1991) Trading off longer life for worsening health: the expansion of morbidity hypothesis. Journal of Aging and Health 3 (2) 194–216.

12 Appold, Johnson, and Parnell
senescence becomes an unavoidable development, in-creasing the quality of life while limiting medical costs.
After a short discussion of trends in risk factors, we survey the geography of selected medical conditions and chart health status over the life course. We were not able to obtain North Carolina-specific information at all levels of detail. However, our analysis suggests that North Carolinians follow patterns similar to the rest of the U.S. even though the composition on North Carolina population differs from the national average. Given the state’s history and pattern of migration, this has an evolving impact on the state’s health experience.
Available information suggests that a small number of malleable behaviors and exposures ul-timately cause approximately half of North Caro-lina deaths – a crude but telling indicator of health status.10 These have implications for CCRC care needs. Smoking and the combination of poor diet and physical inactivity (caloric imbalance) alone account for approximately one-third of all deaths. Compar-ing across decades, although the deaths attributable to smoking are declining slowly, those attributable to poor diet and insufficient physical activity appear to be on the increase. Increases in obesity may not yet be fully reflected in death rates. Tobacco use, poor diets, and sedentary lifestyles are responsi-ble for the largest number of preventable deaths.
We were not able to obtain trend data on each of those risk factors for North Carolina, but were able to review the national trends for selected risk factors in order to gain perspective on the likely impacts on LeadingAge NC’s members. Obesity is a relatively recent phenomenon which has been accel-
erating quite dramatically since the beginning of the last quarter of the last century. The percent of adults who can be classified as obese according to the body mass index has risen from 15 percent in 1975 to ap-proximately 35 percent in the last decade. Although lower, extreme obesity has followed a similar upward trend. Recent measurements hold out the hope that the increases in obesity and extreme obesity may be abating. The measure for obesity may have stabilized over the past years. The measures for smoking are less encouraging. The decrease in the prevalence of adult smoking has been dramatic, falling from over 40 percent in 1960 to approximately 20 percent today. However, there are indications that the decrease has slowed and has possibly approached a plateau.
The incidence of diagnosed diabetes, often linked to obesity, has undergone a rapid rise over the last two decades. The incidence of diabetes has risen from about four percent of the population in the early 1990s to nearly 9 percent by 2010. The trend ap-pears to lag the increase in obesity by several years. Strokes have been linked to obesity and to smok-ing. North Carolina is considered to be part of the “stroke belt.” With 125 deaths per 100,000 for people ages 35 years and older (average annual age-adjusted rate) in 2000-2006, North Carolina and Alabama tie for the fourth-highest death rate due to stroke, fol-lowing Arkansas, South Carolina, and Tennessee.
These trends provide partial insight into the drivers of poor health and of health care costs. Just a few years ago, a health care needs forecaster may very well have missed the possibly stalling decline in smoking, the rapid rise in obesity, and the ascent of diabetes. These have imposed new unexpected
10 Ali H. Mokdad, James S. Marks, Donna F. Stroup, and Julie L. Gerberding (2004) “Actual Causes of Death in the United States, 2000,” Journal of the American Medical Association 291 (10): 1238-1245 plus corrections.
13
sources of costs on the system of health care. Be-cause approximately half of all lifetime health care expenditures accrue to those over 65, these trends have a direct impact on the operation of CCRCs.
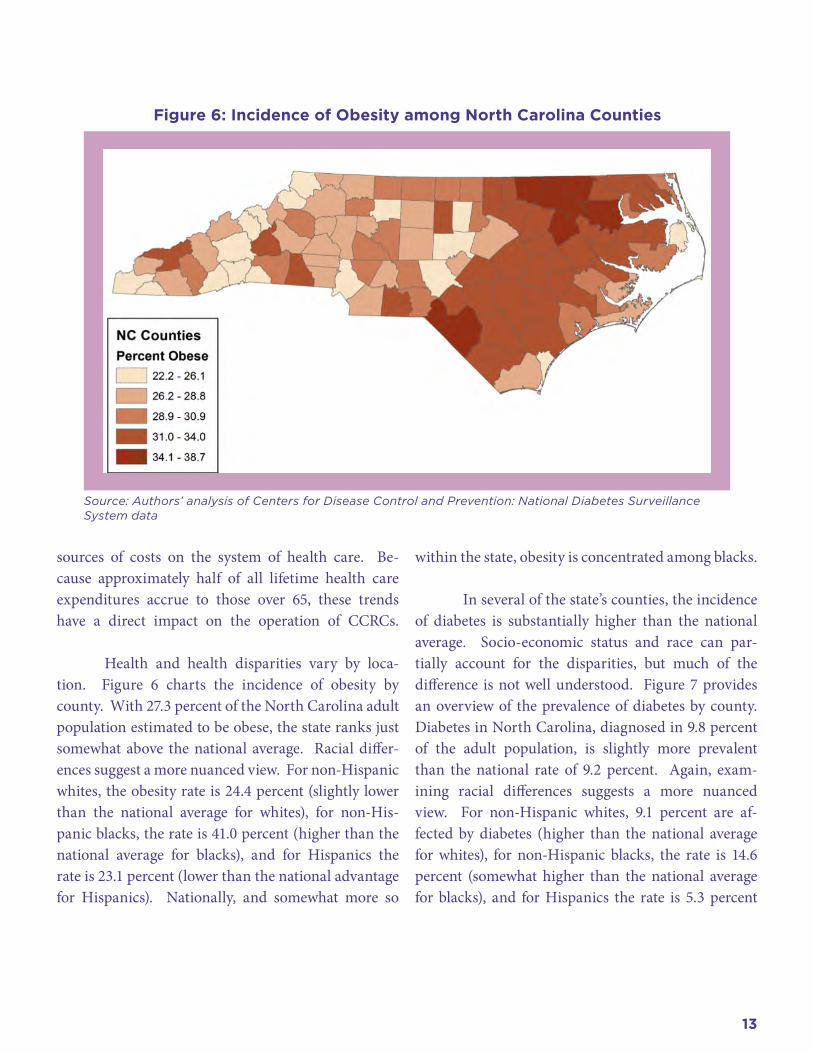
Health and health disparities vary by loca-tion. Figure 6 charts the incidence of obesity by county. With 27.3 percent of the North Carolina adult population estimated to be obese, the state ranks just somewhat above the national average. Racial differ-ences suggest a more nuanced view. For non-Hispanic whites, the obesity rate is 24.4 percent (slightly lower than the national average for whites), for non-His-panic blacks, the rate is 41.0 percent (higher than the national average for blacks), and for Hispanics the rate is 23.1 percent (lower than the national advantage for Hispanics). Nationally, and somewhat more so
within the state, obesity is concentrated among blacks.
In several of the state’s counties, the incidence of diabetes is substantially higher than the national average. Socio-economic status and race can par-tially account for the disparities, but much of the difference is not well understood. Figure 7 provides an overview of the prevalence of diabetes by county. Diabetes in North Carolina, diagnosed in 9.8 percent of the adult population, is slightly more prevalent than the national rate of 9.2 percent. Again, exam-ining racial differences suggests a more nuanced view. For non-Hispanic whites, 9.1 percent are af-fected by diabetes (higher than the national average for whites), for non-Hispanic blacks, the rate is 14.6 percent (somewhat higher than the national average for blacks), and for Hispanics the rate is 5.3 percent
Figure 6: Incidence of Obesity among North Carolina Counties
Source: Authors’ analysis of Centers for Disease Control and Prevention: National Diabetes Surveillance System data

14 Appold, Johnson, and Parnell
(significantly lower than the national advantage for Hispanics). Nationally, and somewhat more so within the state, diabetes is concentrated among blacks.
The incidence of several chronic conditions has been linked to the level of physical activity – or lack of it. Figure 8 depicts the percent of residents who are not physically active by county. Nationally, North Carolina ranks in the middle. Much has been made of the unhealthy effects of diet and fast food but a broader research program has traced obesity to a change in the source of caloric intake to fats and oils which appears to be closely tied to an increase in income and to a change in the nature of work.11 Much of the decline in physical activity over the past sev-eral decades has been tied to our collective movement out of agriculture to manufacturing and to services.
Today, our jobs simply require less physical effort.
We now turn to examining in-state varia-tions in mortality. These provide indicators of health status. Several years of data are used to generate more stable estimates. The rate is age-adjusted so that the age composition of the county population does not influence measure. Figure 9 shows the age-adjusted death rate for North Carolina counties for the 2006-2010 period. The age-adjusted death rate for North Carolina was 8.2 deaths per 1,000 residents, with con-siderable variation among counties around that over-all average. In particular, the counties of the eastern portion of the state often had high death rates as did one in the far western portion of the state. The dif-ferences among county death rates reflect several fac-tors, including the economic well-being of the county
Figure 7: Incidence of Diabetes among North Carolina Counties
Source: Authors’ analysis of Centers for Disease Control and Prevention: National Diabetes Surveillance System data
11 Barry M. Popkin (1999) “Urbanization, lifestyle changes, and the nutrition transition,” World Development 27: 1905-1916.

15
and the common health practices. The age-adjusted county death rate shows a significant correlation with percent of the population which is black (r=.482).
Using national data, we estimated the propor-tion of adults who are healthy by age. Figure 10 charts the proportion of those who reported no physical, social, or cognitive limitations due to health by race using pooled Medical Expenditure Panel survey data. (The variable is based on respondents not reporting poor health, poor mental health, physical limitations, activity limitations, social limitations, or cognitive lim-itations.) Using the same data source, Figure 11 docu-ments differences by race in the proportion of adults not reporting having been diagnosed with a major chronic disease: that is, no cancer, diabetes, hyperten-sion, incidences of stroke, heart disease, or pulmonary
problems. In both cases, there is a continuing decline in health beginning with young adulthood. The limi-tations and chronic diseases do not always generate ongoing costs but they do suggest a need for an early warning system in calculating CCRC residency rates.
Aside from a high incidence of deaths by stroke, North Carolina appears to be somewhat slightly higher on the risk factors and incidences examined than the na-tional average. These comparisons suggest that North Carolina is not now seriously disadvantaged in com-parison with the national average. At the same time, these comparisons also suggest that relatively modest interventions may result in significant improvements.
We have not analyzed the degree to which education and income are correlated with chronic
Figure 8: Incidence of Physical Inactivity among North Carolina Counties
Source: Authors’ analysis of Centers for Disease Control and Prevention: National Diabetes Surveillance System data

16 Appold, Johnson, and Parnell
afflictions over time. It could be that the popula-tion most often served by North Carolina CCRCs is relatively insulated from these conditions. Knowledge of the distribution of affliction will be important as LeadingAge members broaden their circles of care.
4.3 Senior Population
Approximately 12.9 percent (1,234,079) of North Carolina’s 2010 population (9,535,483) were aged 65 and over. Roughly 57 percent of those were female and the remainder male. Figure 12 shows the age-sex distribution of the North Carolina population in 2010. The distribution takes on the traditional pyr-amid shape of a growing population above age 45 but has the more contemporary shape of a cylinder below that. The shape of that pyramid has been determined by the trends in fertility affecting the whole country but also the pattern of migration out of North Caro-
lina for many decades and the inward flow which has become quite large over the past two decades. The im-plication, discussed in detail below, is that the senior population will likely be much larger in the future than it now is, highlighting the need to plan for care. Note that those older than Baby Boomers, who were in their early 60s in 2010, will be driving CCRC demand over the next two decades.
The economic impact of the North Carolina senior population, discussed in more detail below, stems mainly from their consumer spending. The tra-jectory of the learn-earn-burn life cycle pattern where-in individuals gain skills with market value, earn and save, and thus later spend, is central to understanding CCRC demand over time. Because CCRCs have so far specialized in a mainly well-to-do clientele, the pat-tern of earnings and accumulated net worth is a cen-tral concern. Savings behavior and returns on savings
Figure 9: Age-adjusted Death Rate by County, 2006-2010
Source: Authors’ analysis of Centers for Disease Control and Prevention: National Diabetes Surveillance System data

17
Figure 10: Proportion of Adults who are not Suffering from Health-related Limitations of Physical, Social, or Cognitive Limitations
Source: Authors’ analysis of 3-year MEP data
Source: Authors’ analysis of 3-year MEP data
Figure 11: Proportion of Adults who Have Not Been Diagnosed with a Key Chronic Disease

18 Appold, Johnson, and Parnell
Age Number 10th percentile
25th percentile
Median Mean 75th percentile
90th percentile
65 254,924 10,500 20,000 37,900 52,439 65,000 103,500
70 192,590 9,600 16,500 31,000 44,314 54,300 89,700
75 154,766 9,100 14,400 25,900 39,723 47,700 81,300
80 121,231 8,400 12,500 22,500 34,721 41,580 70,900
85 112,430 7,500 11,050 19,000 31,425 36,600 66,100
Total 65 + 835,942 9,100 15,100 29,100 43,275 53,000 88,900
Figure 12: North Carolina Population by Sex and Age, 2010
Table 1: Income distribution of older North Carolinian Households, 2010

19
over time will be critical to assessing CCRC demand.
According to American Community Survey data, North Carolina residents aged 65 and older re-ceived just over an estimated $32 billion in income, nearly 40 percent of which came from Social Security payments. Nearly 19 percent was earned. The propor-tion of income due to earnings declines rapidly in this age group, dropping to below five percent by age 80. The distribution of income is fairly skewed. Half of these households receive less than $28,500 per year. Two-thirds receive less than the mean income for this age group, approximately $42,765, which is the ap-proximate median household income of those enter-ing CCRCs, nationally. Most CCRC residents are aged
75 or older. For North Carolina households in that age bracket, the median household income was $22,800 in 2010 and the mean income was $35,880.
Table 1 details the distribution of household income among North Carolina seniors by age. Com-paratively few senior households have incomes which can be considered high.
Analysis of 2013 Survey of Consumer Finances data suggests that income declines sharply after the late 60s. Earned income begins declining by the late 50s. This information is key because data on the income of middle-aged North Carolinians is critical in projecting those who will be in the CCRC candi-
Figure 13: Mean income by age and type, SCF 2013 data

20 Appold, Johnson, and Parnell
date pool in the future. Figure 13 graphs a simplified income trajectory. 12
Like most seniors, CCRC residents depend upon accumulated assets – wealth – to finance their stays and care. Net worth tends to peak in the late 60s, declining thereafter. Figure 14 charts net worth over the life cycle based on cross-sectional 2013 Survey of Consumer Finances data. By the time household heads near their 80s, at least 20 percent of that wealth has been spent.13 Given that, in the middle of the last decade, nationally, CCRC residents had an average net
worth of $950,000 (median of $464,700) when they en-tered CCRC residence around age 80, their net worth likely peaked at an average of $1,189,000 (median of $581,000) around age 65.14 Based on three separate national surveys, Table 2 provides an overview of CCRC residents and a comparison with seniors who have made other residential choices.15 Because dif-ferent surveys define wealth differently, it is unclear whether the value of all sources of wealth, including defined benefit pensions, was included in these calcu-lations.
Figure 14: : Net Worth by Householder Age, 2013 Survey of Consumer Finance
12 Most modeling of retirement income, including the Social Security Administration’s own models, uses the Survey of Income and Program Participation (SIPP). Some analysts have relied upon the Consumer Expenditure Survey (CES), as we do below. Specialized retirement panel studies do not track wealth as systematically as the larger surveys. The advantage of the SIPP is that it is a true longitudinal dataset and as such measures changes over time for individual households. The ad-vantage of the CES is that new waves are released annually with short waiting periods. We have decided to use the Survey of Consumer Finances (SCF) here because it over-samples the higher end of the income distribution, thereby yielding more reliable information on potential CCRC residents than the other options. See, John L. Czajka, Jonathan E. Jacobson, and Scott Cody, “Survey Estimates of Wealth: A Comparative Analysis and Review of the Survey of Income and Program Participation,” Social Security Bulletin, Vol. 65 No. 1, 2003/2004, http://www.ssa.gov/policy/docs/ssb/v65n1/v65n1p63.html.
SSA uses SIPP data but SCF has a better handle on (retirement) wealth because they ask and because they over-sample the well-to-do (but not anyone on the Forbes 400 list)
13 This very conservative calculation is based on cross-sectional data. Cohort size (and mortality) reduce the number of households at each age level even if dif-ferential mortality may favor the more well-to-do.
14 Data from the Health and Retirement Study suggest a lower average net worth at the time of CCRC entry, approximately $620,000 (at least if this is a mean and not a median).
15 Norma B. Coe and Melissa Boyle (2013) “The Asset and Income Profile of Residents in Seniors Care Communities: What Can Be Learned From Existing Data Sets,” Research on Aging 35:50-77.

21
In North Carolina, the wealth figures tend to be somewhat higher. Data supplied by North Caro-lina CCRCs indicates that the mean value of assets net of debt of new residents averaged $1,461,455, while the mean assets of the second-lowest quartile of new entrants were $1,054,459. Calculations based on the average “high” entrance fee for CCRCs providing ex-tensive care, and thus not likely to require additional payment for health and other care, plus an average of the “high” monthly costs for 7.5 years, the expected duration of stay in the CCRC, suggest that assets of $853,171 may be sufficient for a single person and $1,365,074 for a couple. Weighting the average of the single-person and couple assets based on the house-
hold composition of CCRC residents yields $1,049,920 per household. We use this figure as a point of refer-ence, recognizing that there are several arbitrary steps included in these calculations, including assumptions about the cost of a second household member and the adequacy of payments to cover all needs.
Analysis of Survey of Consumer Finance data suggests that those households with annual incomes above $150,000 when the householder is 65 or older will have, on average, sufficient wealth (median wealth) to meet North Carolina CCRC financial requirements. Approximately 9.5 percent of North Carolina senior households can claim an annual income of $100,000
Figure 15: High Income ($150k +) Senior Households by County, 2010

22 Appold, Johnson, and Parnell
Table 2: Characteristics of CCRC Residents Compared to Those with Other Living Accommodations
Source: Norma B. Coe and Melissa Boyle (2013) “The Asset and Income Profile of Residents in Seniors Care Communities: What Can Be Learned From Existing Data Sets,” Research on Aging 35:50-77.

23
Table 3: Expenditures by Households where the Head is 65 or Older for 2013 by Income before Taxes, 2014 Survey of Consumer Expenditure data

24 Appold, Johnson, and Parnell
or more; 3.6 percent can claim an annual income of $150,000 or more. These are the households which are likely to have accumulated sufficient assets to meet the financial thresholds set by North Carolina CCRCs. These are mapped by county in Figure 15.
The calculations above suggest that CCRC resi-dents spend approximately $4,000 per month ($48,000 annually) on living space, food, and medical care.16 Table 3, based on 2014 Consumer Expenditure Survey (CES) data, summarizes the consumer purchases of households with heads aged 65 or older. For house-holds with heads over 65, these expenses comprised 61
percent of their expenditures on average. For house-holds at the lower end of the income distribution, these expenses averaged 70 percent of their expenditures. The proportion declined gradually as income rose until, once income was at least $70,000 annually, these three cost categories accounted for only 51.4 percent of expenditures, an average of $3,396. This was nearly the same level as the estimated CCRC expenditures.
We use the CES expenditure pattern for high-income seniors as a template for the consumer spend-ing of CCRC residents. The analogy is not perfect. The CES sample includes younger and more active re-
Table 4: Characteristics of Popular Senior Living and Care Options
Source: Guide to Senior Housing and Care, A Place for Mom, http://web28.streamhoster.com/apfmdev/apfm_eb-ook_guide-to-senior-housing_final.pdf
16 This assessment triangulates with independently derived estimates.

25
spondents than are normally present in most CCRCs; many are employed. The CES sample is drawn from a national, rather than North Carolina, base. Most of the survey respondents are living independently in their own homes. Fine tuning the sample may result in more distortions than improvements, however. Much consumption is idiosyncratic. Reducing sample size could lead to unreliable estimates.
4.4 Continuing Care Retirement Communities
CCRCs are one option in an extensive matrix of residential and care options for older adults, includ-ing aging in place either alone or in Naturally Occur-ring Retirement Communities (NORCs), with virtual villages providing an intermediate option to provide living support to those aging in place. In-home care, adult day services, and respite care can offer addi-tional, formal support to those aging in place. Some older adults may opt for purpose-built residential op-tions including senior apartment buildings, independ-ent living communities, assisted living communities, residential care homes, and skilled nursing facilities with some residential options specializing in memory care. Table 4 summarizes several important options and their major characteristics.
The information on the factors determining the choices made by older Americans among these options is incomplete. In some cases, individual and household health conditions have a clear impact. In others, preference may be important. We refer to the available information about resident choice in more
detail below.
Among this array of options, CCRCs differ from other residential and care options in two main respects: 1) they are facilities which offer a number of residential and care options in one location, so seniors can stay in the same community as their housing and support needs evolve over time and 2) the method of payment for care.17 Among their features are:
• Secureprivateaccommodationsandcommonarea amenities in a variety of styles and with a range of pricing options;• A continuumof services at a single location,including dining, housekeeping, social and rec-reational programs, transportation, and health-care services, as needed;• Payment plans thatmay utilize home equityto help keep monthly expenses at a lower level and that may offer repayment of a portion of the entrance fees;• Possible income-tax deductions in the formof a medical expense deduction for certain fees paid to the CCRC; and, most importantly,• Protectionagainstthelossofaccommodationsand services if the resident exhausts his or her funds.18
In that last regard, CCRCs offer a type of residential and care insurance. Accordingly, payments are some-times based on actuarial considerations and CCRCs are regulated by the North Carolina Department of Insurance.19 Therefore, life expectancy and health status are important to CCRC management.
17 Continuing care is defined by the North Carolina General Statute § 58-64-1, “...the furnishing to an individual other than an individual related by blood, marriage, or adoption to the person furnishing the care, of lodging together with nursing services, medical services, or other health related services, under a contract approved by the Department in accordance with this Article effective for the life of the individual or for a period longer than one year. “Continuing care” may also include home care services provided or arranged by a provider of lodging at a facility to an individual who has entered into a continuing care contract with the provider but is not yet receiving lodging...” from Continuing Care Retirement Communities 2014 Reference Guide, North Carolina Department of Insurance.
18 Jane E. Zarem, Today’s Continuing Care Retirement Community (CCRC), Leading Age CCRC Task Force, July, 2010, http://www.northhill.org/sites/TrueNorth/up-loads/PDFs-Financials/Todays_CCRC_LeadingAge.pdf?CFID=8443963&CFTOKEN=86445496
19 United States Government Accountability Office (2010) Older Americans: Continuing Care Retirement Communities Can Provide Benefits, but Not Without Some Risk, Report to the Chairman, Special Committee on Aging, U.S. Senate, GAO-10-611, June.

26 Appold, Johnson, and Parnell
CCRCs typically offer three broad levels of care:1. Independent Living – is for individuals whoare capable of doing the basic chores of every-day life but who may need occasional help from others.2. Assisted Living – provides assistance forresidents with chronic care needs excluding com-plete 24-hour skilled nursing care. Assisted living services include helping a resident with bathing, dressing, taking medications, and other daily ac-tivities.3. Skilled Nursing Care – generally provides24-hour nursing care, rehabilitative services, and assistance with activities of daily living to the chronically ill as well as those who have been hos-pitalized for an illness or operation and require a short period of rehabilitation before returning home.
A few CCRCs occupy a single urban building. More typically, they comprise a collection of apart-ments, town homes, or cottages and include common activity areas such as a library, activity and craft rooms, and a restaurant-like dining room. Many offer other amenities such as banking services, convenience stores, a golf course, walking trails, gardens, swim-ming pool, fitness center, beauty/barber shops, and guest accommodations.
As noted above, CCRCs differ from most other residential options in the nature of the financial ar-rangements and the contract. Continuing care con-tracts provide for lodging, together with nursing ser-vices, medical services, or other health related services. These can be either for the life of an individual or for a period longer than one year. Most CCRCs charge an entrance fee, which varies by the nature of the dwell-
ing unit, resident age at entry, support included, and refund arrangement. Entrance fees in North Carolina can reach over one million dollars but, more typically, they range from $60,000 to $325,000. The fees varied considerably among and within CCRCs. Residents who have paid an entrance fee do not own their units but they have the right to live in the community for the rest of their lives in accordance with the terms of their contract.
In addition to an entrance fee, there are month-ly fees for providing living and medical support. In a few cases, the purchase of a unit may be required and units are sometimes rented. The specific provisions of the arrangements vary but the Department of Insur-ance tracks the following types of contracts:
1. Extensive – Extensive contracts provide hous-ing, residential services, and health-related ser-vices in exchange for a price, usually consisting of an entrance fee and a monthly fee. No additional fees are generally required as one moves from one level of care to another.2. Modified – Modified contracts provide hous-ing, residential services, and a specified amount of health-related services in exchange for an en-trance fee and a monthly fee. Health-related ser-vices are provided at a subsidized rate or are free for a specified number of days.3. Fee-for-Service – Fee-for-Service contractsprovide housing, residential services, and guar-anteed access to health-related services in ex-change for an entrance fee and a monthly fee. Health -related services are provided at the going, full per-diem rate.4. Equity – Equity contracts involve an actualreal estate purchase, with a transfer of ownership of the unit. Health-related service arrangements
27
vary.5. Rental - Rental contracts for terms in excessof one year, provide housing, residential services, and guaranteed access to health-related services in exchange for a monthly rental payment and a monthly fee. Health related services are provided at discounted rates for a specified number of days and then will be at the full per-diem rates.20
Twelve North Carolina CCRCs offer “ex-tensive” contracts, 24 “modified” contracts, and 28 “fee-for-service” contracts. Several CCRCs offer resi-dents multiple types of contracts. One offers all three contract types. Only four CCRCs explicitly mention equity contracts and 13 rental contracts. Although we only have data for a single year for this variable, on the basis of discussions with expert informants, it is our impression that there may be a trend towards more contract flexibility over time.
Housekeeping is partially or fully included in the monthly fees at 50 of the 57 CCRCs and meal service at 53 of them. In North Carolina, all CCRCs provided emergency call facilities and transportation services and all partially or fully included utilities in the monthly fees. Forty one CCRCs were certified Medicare providers while 25 were Medicaid providers. Based on data provided by LeadingAge NC members, the CCRCs reporting certification made available an average of 61 places to those relying on Medicare pay-ments and an overlapping 69 places to those relying on Medicaid. CCRCs reporting accepting Medicare appear to have slightly lower entrance fees but slightly higher monthly fees, while those reporting accept-ing Medicaid report lower entrance and monthly fees. Two CCRC members reported an average of 150 HUD-certified independent living places. 21
4.4.1 Community Counts
The North Carolina Department of Insurance, which licenses and regulates CCRCs, lists 57 com-munities. Based on Department of Insurance infor-mation, as of 1 January 2014, North Carolina CCRCs offered a combined 11,755 independent living units, 2,162 assisted living units, and 4,158 nursing units for a total of 18,075 units. Of these, 10,375, 1,842, and 3,583 were occupied by 13,488, 1,855, and 3,618 resi-dents, respectively, for a total of 15,800 units occupied by 18,961 residents. The mean number of units in North Carolina CCRCs was 317 and the median was 306. The mean number of residents was 332 while the median was 328. The lowest number of residents was 75 but the highest was 708.
All 57 North Carolina CCRCs provided inde-pendent living units, 51 assisted living units, and 53 nursing facilities. Overall occupancy rates were in the high 80 percent range with a degree of variation among communities. Thirty-six of the communities included dementia care units.
CCRCs were in 22 of North Carolina’s 100 counties. Mecklenburg County claimed the most with 9 CCRCs and 3,192 residents, followed by Guilford, Buncombe, Wake, Durham, Chatham, and Alamance counties. Together these seven counties account for more than two-thirds of the state’s CCRC residents. With regard to municipalities, Charlotte claimed the highest number of CCRC residents, 2,271, accounting for 12 percent of the state’s total. Chapel Hill, Ashe-ville, Greensboro, Burlington, Raleigh, and Durham each accounted for more than 1,000 CCRC residents each and, along with Charlotte, claimed half of the state’s CCRC residents. CCRCs were also clustered
20 From Continuing Care Retirement Communities 2014 Reference Guide, North Carolina Department of Insurance.
21 It should be noted here that both the National Church Residences and Volunteers of America mention HUD certification on their websites. Both organizations have multiple member communities in North Carolina, but none of them are CCRCs and therefore do not appear in our database.

28 Appold, Johnson, and Parnell
Figure 16: North Carolina CCRCs and Residents - Department of Insurance data,January 2014
Table 5: North Carolina CCRCs by County, 2014

29
Figure 17: LeadingAge North Carolina Members and Other CCRCs
together in specific zip code areas. Two zip codes held three CCRCs each; nine held two each. Table 5 summarizes the distribution of CCRCs and CCRC residents by county. Figure 16 displays the distribu-tion of CCRC residents by facility superimposed upon information about the number of high income senior households.22
Of the 57 CCRCs listed by the Department of Insurance, 48 are LeadingAge member communities. Nine are non-members, eight of which are for-profit firms and one a non-profit entity. LeadingAge NC lists 63 member communities. Fifteen are not included in the Department of Insurance listing of CCRCs. Seven LeadingAge NC member communities are owned by National Church Residences and four by Volunteers of America. These may be fee-for-service affordable 22 The picture changes somewhat when the non-CCRC LeadingAge NC member communities are included. Buncombe holds the most members but several are small. Unfortunately, we have incomplete information on the number of residents in the non-CCRC member communities.
23 The North Carolina Continuing Care Residents Association lists 34 members, one of which could not be found on either the Department of Insurance list or the LeadingAge NC membership roll.
care institutions.23 There are also other fee-for-service senior communities which are not LeadingAge NC member communities.
Because not all CCRCs are LeadingAge NC member communities and not all LeadingAge NC member communities are CCRCs, we include a second map for completeness. Figure 17 includes information on the location of LeadingAge NC members which are CCRCs, other CCRCs which are not, and LeadingAge NC members which are not CCRCs. Unfortunately, we have little information about residents in the non-CCRCs and therefore could not include information about them in this figure.
There are clear clusters of LeadingAge NC members in Buncombe, Wake, Mecklenburg, Guilford

30 Appold, Johnson, and Parnell
Figure 18: Senior Care Facilities in North Carolina, RefUSA data, 2012
Table 6: Age Distribution of CCRC residents by Sex

31
and Forsyth counties with other members in nearby counties. Pitt County, home of East Carolina Univer-sity and Vidant Health, has a member organization. The retirement destinations of Moore County, Hen-derson, and Buncombe County have multiple member communities.24 There are LeadingAge NC members in counties losing population (Burke, Scotland, Rowan and Polk) and in counties barely growing (Catawba and Stanley). While the general demographic situ-ation may affect the long-term demographic market for CCRCs, other factors—for example, focusing on a specific population like retired military officers—can offset the broader demographic circumstances.
CCRCs are not the only organizations provid-ing residential and non-residential care and support to seniors. Underscoring the number of options and degree of competition in the market for care, Figure 18 charts the senior care organizations using RefUSA data. Taking a somewhat broader definition, this data source lists 284 CCRCs, 653 assisted living facilities, and 924 skilled nursing care providers for a total of 1,861 care providers in the state. These data need to be interpreted with caution for two reasons. First, in a small number of cases, multiple organizations are listed at the same or nearby addresses, suggesting the same organization working as different legal enti-ties. Second, while the organizational titles indicate involvement in senior care, the organizations may be slightly misclassified. Some of the CCRCs in the database do not appear in either the Department of Insurance list or the LeadingAge NC list.
4.4.2 Community Residents
The number of CCRC residents in North Car-olina has been stable over the 2010-2014 period. Ac-
cording to Department of Insurance data, 19 CCRCs reported being in the process of expansion as of Janu-ary 2014. The Benchmark Report confirms that in-formation, reporting a large spike in the initiation of capital investments in 2012 with a substantial number being initiated in 2013 also. In a few cases, such plans are extensive. In some cases, the number of residents has declined, perhaps temporarily in connection with renovations.
The average age of the residents at the time of data collection and at the time of entry varies some-what among CCRCs. In general, CCRC residents average about 80 years old, with average age at entry being somewhat lower. The males tend to be younger than the females on average. Given the relative ages of husbands and wives, males tend to enter CCRCs at a more advanced age than females but, because females tend to live longer, they also remain longer. Table 6 summarizes the age distribution of CCRC residents. Approximately two-thirds of the residents are female with one-third being male. Nearly 40 percent are married; the rest are single, many being surviving spouses.25
The proportion of seniors choosing to enter CCRCs varies by age and sex. Table 7 summarizes the estimated CCRC capture rates – proportion of those in specific demographic categories who live in CCRCs – by age and sex. The proportion living in CCRCsreach the mid-single digits among those age 80 years and older. The comparatively low capture rate implies that changes in residential choice behavior may have a larger impact than changes in demography.26 Thus, the quality of CCRC offerings and their prices could have a large impact on the demand for CCRC services.
24 Henderson and Buncombe also have significant seasonal retirement migration.
25 Based on CCRC-provided data.
26 These are approximations based on limited data. Nevertheless, they illustrate the pattern. Although some people enter CCRCs below this age levels shown, as a proportion of the total in their age-sex categories, the number is negligible.

32 Appold, Johnson, and Parnell
5.0 Projections of Market Demand
The goal of this section of the study is to forecast the size and economic characteristics of the market of potential residents for North Carolina’s CCRCs. We employed a four-fold strategy.
First, we used 2014 estimates and projections prepared by the North Carolina Office of Budget and Management to establish a baseline 20-year projec-tion for the senior population for the state and each county.27 Within the broad senior population, we separated trends and projections for the youngest old (ages 65-74), the middle old (ages 75-84), and the oldest-old (ages 85 and older).
Table 7: Estimated Annual CCRC State-wide Capture Rates
Table 8: Sizes and Growth Rates of Senior Age Groups in North Carolina and the United States
Second, we used county-level information on the income distribution among senior households from the 2006-2010 American Community Survey as a basis to project the number of high-income seniors who can afford the CCRC option.
Third, we used information on the capture rates of CCRCs by age and sex to estimate the number and location of qualified seniors choosing CCRCs as their preferred residential and care option. Because the local number is not always sufficiently high to sup-port a CCRC, these individuals may choose to relo-cate.
Fourth, we determined how trends in migra-
27 These estimates can be found at the office’ website: http://www.osbm.state.nc.us/ncosbm/facts_and_figures/socioeconomic_data/population_estimates/county_projections.shtm. The Office of Budget and Management uses a multi-stage procedure in generating their projections. First, county-specific auto-regressive integrated moving averages are extended in time in order to establish control totals. Second, cohort-component projections using basic assumptions are performed to arrive at closed-population estimates. Next, patterns of net migration are inferred from the differences with recent migration rates serving as a check and the results of the several steps reconciled. Their methodology is described in detail at http://www.osbm.state.nc.us/ncosbm/facts_and_figures/socioeconomic_data/population_estimates/demog/projinet2014.html.

33
tion, health status, and wealth accumulation could affect our baseline projections.
5.1 Baseline Projections of North Carolina’s Senior Population
Our aging society receives considerable atten-tion in the press and from policy makers. While Baby Boomers will gradually come to dominate the senior population over the next three decades, most Ameri-cans age 65 and older were born during or before World
Table 9: 2014 Baseline Population Estimates and Percentages for LeadingAge NC Counties and the State
War II, and are in relatively small cohorts (due to lower fertility during the Depression and the years thereaf-ter). The first baby Boomer reached age 65 in 2011, the year after the 2010 census, and 8,032 Baby Boomers turn 65 daily. While the first of the Baby Boomers are now in the mid- and late-60s, the first boomer won’t turn 75 until 2021, and the first boomer won’t turn 85 until 2031. Given the average age at CCRC entry, Baby Boomers will likely not begin having direct visible im-pacts on CCRCs until around 2026. For the period of concern in this report, the focus is on the pre-boomers

34 Appold, Johnson, and Parnell
Figure 19: North Carolina Population by Sex and Age, 2034
Figure 20: Projected Increase in the Youngest Old (65-74), Middle Old (75-84), Oldest-Old (85+), and CCRC residents in North Carolina, 2014-2034

35
who have been able to benefit from a period of gener-ous career and investment opportunities.
Table 8 shows the 2010 senior population (age 65 and older)--disaggregated into youngest old (ages 65-75), middle old (ages 75-84), and the oldest old (ages 85+)--in North Carolina and the U.S. The table also shows growth within these age groups between 2000 and 2010. In 2010, there were 1,234,079 North Carolinians age 65 and older. The growth rate in North Carolina seniors was significantly higher (27.3 percent) than growth in this age group nationally (15.1 percent). North Carolina’s youngest old population in 2010 (697,567) grew by 30.7 percent over the decade compared with 18.1 percent growth for this group across the country. Similarly, North Carolina’s middle old and oldest old groups grew at significantly higher rates than these age groups did nationally. The higher growth rates of North Carolina’s senior population are due to aging of those who moved to North Carolina during their careers and stayed as well as retirement migration.
Table 9 shows the 2014 baseline population estimates and the percentages of each age group for the state and counties where there are LeadingAge NC members. The table includes projections of the popu-lation of the population age 65 and older and the three subgroups: the youngest old (aged 65-74), the middle old (75-84), and the oldest old (85+). In addition, we show the population ages 45-54 and 55-64—the “pipe-line” for CCRC residents in the extended future. The complete projections for 2014, 2020, 2025, 2030 and 2035 are in Appendix 3.
In 2014, over half of the state’s 1,455,938 re-tirement-age population (65 and older) lived in Lead-
ingAge NC counties. Five urban counties--Wake, Mecklenburg, Guildford, Forsyth and Buncombe (a retirement destination)--have a quarter of the state’s retirement-age population with Wake and Mecklen-burg each having over 61,000 youngest-old residents, over 26,000 middle-old residents, and over 11,000 oldest-old residents. Several of the LeadingAge NC Counties (e.g. Stanly, Scotland, and Polk) have small retirement-age populations.
The percentages of youngest old, middle old, and oldest old in the 2014 baseline estimates show that 14.7 percent of the state’s population is 65 or older and 13.5 percent of the LeadingAge NC counties’ population is 65 or older. Among the counties, there is considerable variation in the percentages in each of the age groups. The rapidly growing urban coun-ties like Wake and Mecklenburg have relatively lower percentages of their populations in the retirement ages because of the larger numbers of young adults and children. Established retirement destinations like Moore County, Henderson County, and Buncombe County have higher percentages in the retirement age groups. Economically challenged counties (e.g. Burke and Polk) have higher percentages in the retirement age groups because many young adults (and their chil-dren) have moved away seeking work. Over 27 percent of Polk County’s 2014 population is age 65 and older.
To examine the likely demographic trends over the next 20 years, we used the 2014 estimates and projections prepared by the North Carolina Office of Budget and Management discussed above. Population projections forecast changes in population size and composition based on assumptions about expected patterns of fertility, mortality and migration. Like all population projections, the further into the future we
36 Appold, Johnson, and Parnell
look, the greater the potential for error. While fertil-ity rates, mortality rates and age structure are well-measured and stable, migration into and out of North Carolina can be interrupted by an economic down-turn, as we saw with the recent recession. Uncertainty regarding the future trajectory of retirement migra-tion is a major concern in attempting to derive reliable projections of the long-term demographic market for North Carolina CCRCs. Some considerations are dis-cussed below. Figure 19 charts the age distribution of projected population for North Carolina in 2034.
Figure 20 summarizes the projected trend at the state level for the youngest old (65-74), middle old (75-84), and oldest-old (85+). As Baby Boomers age, the populations in all three groups will grow signifi-cantly. The youngest old are projected to grow from 862,317 in 2014 to 1.268,718 in 2034. The middle old in North Carolina will double between 2014 and 2034, growing from just over 424,000 to over 854,000. The oldest old will grow from just under 170,000 in 2014 to over 324,500 in 2034.
Table 10 shows the projected populations in 2034 including the projected net change in each age group from 2014 and the projected percentage change. Population projections are shown for all of North Car-olina, for groups of counties where there currently are LeadingAge NC members, and for each of the other counties. The LeadingAge NC counties as a group have significantly higher 30-year projected growth rate among the youngest old (62 percent compared to 47 percent) and middle old relative to the state (119 percent compare to 101 percent). The 30-year project-ed growth among the oldest old is slightly higher than the projected growth for the state. The 24 LeadingAge NC counties have double the projected growth rate for
ages 45-54 and 55-69 as the state.
Figure 21 depicts the projected distribution of the senior population in North Carolina in 2034. The projected growth rates in Wake County and Mecklen-burg County are significantly higher than the com-bined LeadingAge NC counties and the state. This is no surprise since Wake and Mecklenburg are the core counties of two of the fastest growing metropoli-tan areas in the country. In 30 years, Wake County is projected to add over 73,000 youngest old, over 54,000 middle old, and over 20,000 oldest old. Mecklenburg County is projected to add over 64,000 youngest old, over 48,000 middle old, and almost 16,000 oldest old. Guilford County, Durham County, Cabarrus County, Buncombe County, Forsyth County, Iredell County and New Hanover County are projected to have signif-icant populations in all groups ages 65 and older, but the absolute numbers are well below those projected for Wake and Mecklenburg.
By 2034, those aged 65 and older are projected to comprise 20.4 percent of North Carolina’s popula-tion and 19.5 percent of the residents in the current LeadingAge NC counties. Polk County and Chatham County are projected to have more than 30 percent of their residents age 65 and older. Six of the LeadingAge NC counties are projected to have less than 20 percent age 65 and older (Wake, Mecklenburg, Pitt, Orange, Guilford, Durham and Cabarrus). The oldest old are projected to account for 2.7 percent of the state, but the oldest old are projected to account for more than 5 percent in four counties: Henderson (5.2 percent); Moore (5.4 percent); Chatham (5.6 percent) and Polk (6.3 percent).
By 2034, Baby Boomers will all be age 65 and

37
Table 10: 2034 Projected Population With Change Since 2014, LeadingAge NC Counties and the State
Figure 21: Projected Senior (65+) Residents, 2034

38 Appold, Johnson, and Parnell
older. The cohorts following the Baby Boom were sig-nificantly smaller and this is seen in the smaller popu-lations ages 45-54 and 55-64. The net growth in these age ranges in the LeadingAge NC counties is projected to be greater than the projected growth for the state as a whole because of projected declines in most coun-ties and the large increases in Wake and Mecklenburg counties.
CCRCs, as they are now constituted, are ori-ented towards a high-income, high-wealth market. Projections of the total senior population may there-fore yield an inaccurate picture of future baseline demand. Figure 22 shows the 2034 distribution of the high-income senior population in North Carolina (at least $150,000 household income in 2010 dollars). This sub-population is more tightly concentrated in the metropolitan markets, where CCRCs already congre-gate, than the senior population as a whole.
Given that information, we hazarded a tenta-tive projection of CCRC residents in 2034 by county based on the sex-specific capture rates summarized in Table 7. The number of residents is projected to grow from an estimated 18,961 in 2014 to an estimated 35,381 in 2034. The projected distribution of CCRC residents in 2034 appears in Figure 23.
Local population is important in projecting market demands. An analysis of the previous ad-dresses (zip codes) of the residents of five North Caro-lina CCRCs indicates that the home market is critical to CCRCs. Overall, over half of the residents’ previous addresses were within ten miles of the CCRC chosen. Three-fourths of the residents came from within 60 miles. However, the average distance was 95 miles, suggesting that, building on a solid local base, a mi-
nority of residents relocated from quite a distance. The motivation for the local moves seems obvious but the long-distance moves less so. It could be that aging parents re-locate nearer to a child. But it is also pos-sible that some of the CCRCs may draw upon specific populations, such as ministers from their church of affiliation or offer particular attractions.
Given that the cost of CCRC living is closely tied to the price of local residential real estate, such close geographic proximity may need to loosen in the future as the expanding cities of North Carolina build outward. It may be that in the future, prospec-tive residents will choose CCRCs in locations near the metropolitan periphery or make jumps to the smaller cities within the orbits of larger metropolitan areas.
5.2 Factors which Could Affect Baseline Projections
Many events and factors could cause devia-tions from these baseline projections. Among these are trends in migration which could affect the size of the senior population. Health status trends could impact the demand for chronic illness medical care. Trends in wealth accumulation could raise or lower demand for CCRC services among the population in North Carolina.
5.2.1 Trends in Retirement Migration
The size of the senior population in a com-munity results form a combination of aging in place—aging in your home—and migration into and away from a community. Aging in place is preferred by many, but many have to age in place due to economic constraints. Common forms of retirement migration

39
Figure 23: Projected CCRC residents, 2034
Figure 22: Projected Senior Residents with Household Incomes of at least $150k, 2034

40 Appold, Johnson, and Parnell
are home place migrations (returning to family and other connections), migration to be near family no longer living near the old home place, seasonal migra-tion (e.g. seasonal moves between Florida and North Carolina mountains), and migration to retirement destinations. Retirement destinations often have nat-ural or social amenities and high-quality health care.
The current demographic situation in a com-munity is an important indicator of the extent and characteristics of those aging in place as well as an indicator of retirement migration into the commu-nity. North Carolina is divided demographically. The Charlotte and Raleigh-Durham areas are among the fastest growing metropolitan areas in the country, and the Triad and Asheville have had steady growth. However, half of North Carolina’s counties have lost
population since 2010. Areas with strong growth are usually attractive to retirement migrants, whether home place moves, moves to be near family, or as re-tirement destinations. Areas losing population are in economic decline with fewer family farms and the loss of textile, furniture and other manufacturing jobs. These declining areas have higher percentages of the population age 65 and older because of the significant loss of young adults and fewer children. Most seniors are aging in place, and most are economically con-strained to do so.
The population projections assume that mi-gration over the next twenty years will follow the 2000-2010 patterns. There is considerable evidence that this is a reasonable assumption over the long run, but short-term interruption in the migration trend
Figure 24: Net Migration to North Carolina, 2000-2010
Source: Based on data from Winkler, Richelle, Kenneth M. Johnson, Cheng Cheng, Jim Beaudoin, Paul R. Voss, and Katherine J. Curtis. Age-Specific Net Migration Estimates for US Counties, 1950-2010. Applied Population Labora-tory, University of Wisconsin- Madison, 2013.

41
will occur with significant economic down turns. During the recent recession, migration to the state’s major retirement destinations like Brunswick, Moore and Buncombe Counties all declined sharply before recovering as the economy rebounded. Nonetheless, the long-term trends are very likely to continue recent patterns.
The level and geographic distribution of North Carolina migration was discussed above. The age pat-tern of migration is also important to assessing the future size of the senior population. Figure 24 depicts the number of net migrants and net migration rates by five-year age group for North Carolina during the first decade of this century. The two curves are similar, but not identical. People tend to move in their late teens for work or college and in their early 20s for work before settling down for their prime working years. Migra-tion continues with mid-career movements and career changes throughout people’s lives but at a compara-tively lower level than in their 20s. Migration tends to rise again as careers approach their ends, reaching a minor peak in the late 60s. Either semi-retirement jobs are sought to help ease the transition out of the labor force or household members withdraw from the labor force. As they age, seniors tend to remain in place. By about age 70, rates of migration have reached a life-cycle low. The life-stage pattern of migration differs by place but tends to remain fairly stable over time for individual places. In North Carolina’s case, the net migration rates were positive across all age groups but last decade was the first time retirement migration was markedly visible on a state-wide basis.
Table 11 shows the net migration in North Carolina between 2000 and 2010 for ages 60-64, 65-69, 70-74, 75-79, 80-84 and 85 and older. Table 11 also
shows the percentage share of total growth in each age group accounted for by net migration. Migration ac-counted for a large percentage of the change for every age group, with a notable increase after age 65. Migra-tion accounted for over 80 percent of the net growth for ages 70-74 and 75-79. Present indications are that trends will continue but that is not assured and, given the contribution of migration to the growth of the senior population, future market demand will be very sensitive to shifts in migration rates.
Table 12 shows the net migration for ages above 60 in the Leading Age NC member counties. As expected, Wake and Mecklenburg have the larg-est number of retirement migrants, and there are a large number of migrants at the oldest ages, perhaps as the oldest old move to be close to their children. Migration to retirement destination counties (e.g. Moore, New Hanover, Henderson, and Buncombe) is significant and appears to peak by the early 70s. Some counties have surprisingly low numbers of retirement migrants, notably Orange County, suggesting that re-tirement migration is sensitive to housing costs and possibly creating a spillover effect into neighboring Chatham and Alamance Counties. Also, many of these counties have a net loss of the oldest-old.
5.2.2 Trends in Disability-Free Life Expectancy
As life expectancy at older ages has increased, one key issue is whether this increase in life expectancy is an increase in the time living with serious disabil-ity or an increase in healthy life. CCRC contracts are a form of care insurance for which there is a market based on the willingness of both resident and organi-zation. Should disability rates shift or become more

42 Appold, Johnson, and Parnell
predictable, that could affect the willingness of either party to enter a contract and lead to another residential and care option being chosen. Recent analysis calcu-lated that life expectancy without a disability for those who reach age 70 without a disability was on average 11.87 years, an increase of half a year from ten years earlier.28 Those reaching age 70 without a disability showed no increase in the average time they live with either one or more Activities of Daily Living (ADL) limitation or one or more Instrumental Activities of Daily Living (IADL) limitation. Those who reached age 70 with one or more ADL or IALD also had an increase in average disability-free life expectancy; many recover from the condition that resulted in their limitation at age 70.
These average patterns are encouraging, but there are significant differences in life expectancy and healthy life expectancy among groups of Ameri-cans. “Socioeconomic status is related to virtually all health outcomes in most countries. People with more education or income live longer and experience fewer adverse health effects.”29 Years of education have a strong effect on life expectancy and healthy life expec-tancy. For White men and women and African Amer-ican men and women, those with 13 or more years of education have significantly longer life expectancy at age 65 and healthy life expectancy at age 65 than those
with less education. A recent eight-country European study reported similar findings with education having a greater positive effect on healthy life expectancy than income.30
The data are not available for the complex mul-ti-state modeling that would be necessary to estimate disability-free or health life expectancy for the Lead-ingAge NC potential residents. However, the strength and consistency of research results strongly indicate that CCRC populations should on average have longer life expectancy and disability life expectancy because of their higher socioeconomic status. However, as CCRCs seek to extend their circles of care, the geo-graphic variation discussed above and the education-linked variations in health status will be important considerations. Moreover, as indicated above, we have not traced the over-time trends in health status among those with higher incomes or educations.
5.2.3 Trends in Median Wealth
Over the course of the Great Recession, many families lost significant wealth. For many, a signifi-cant portion of their retirement savings eroded. Some types of wealth have since recovered; others continue to lag. In particular, some portions of the housing market and the stock market have been performing
Table 11: Age-Specific Net Migration and Percentage of Net Change, North Carolina, 2000-2010
28 Crimmins, EJ, MD Hayward, A Hagedorn, Y Saito and N Brouard, 2009. “Change in Disability-Free Life Expectancy for Americans 70 Years Old and Older” Demog-raphy 46: 627–646.
29 Crimmins, EJ and Y Saito. 2001, “Trends in healthy life expectancy in the United States 1970-1990: gender, racial and educational differences.” Social Science and Medicine 52: 1629-1641.
30 Maki, N. et al. 2013. “Educational differences in disability-free life expectancy: a comparative study of long-standing activity limitation in eight European countries.” Social Science and Medicine 94.

43
well recently. Given the age-income and age-wealth trajectories over the life cycle discussed above, trends in net wealth by age over time help predict the level of wealth trajectories of those who will be potential residents of CCRCs in the future.
Figure 25 traces changes in the median net worth by age of householder over time. The Great Re-cession has had an obvious impact on all age groups. Net worth in 2013, the latest SCF survey, was lower for all age groups than it was in the middle of last decade.
Those who were aged 65-74 in 2013, and thus at prime age for entering CCRCs in about a decade, have likely reached their peak wealth. Although the future tra-jectory is unknown, this group has approximately the same net worth today as those entering CCRCs today had a decade ago when they were in the same age group. Even if they maintain parity with earlier co-horts, they have likely lost wealth as a cohort, however, and the impact that loss will have on their behavior is unknown.
Table 12: Age-Specific Net Migration in LeadingAge NC Member Counties, 2000-2010

44 Appold, Johnson, and Parnell
Figure 25: Median Net Wealth by Age, SCF data, selected years
Similarly, even the age group which suffered the most dramatic loss in median net worth over the past decade, the 55-64 year-olds who will be entering CCRCs in approximately 20 years, have approximately the same net worth as their counterparts 20 years ago. As a cohort, their net worth has remained essentially flat, however. Those who are aged 45-54 and 35-44 are, in general, doing worse than their counterparts did in earlier times at equivalent stages of life. These figures suggest that there will be a period of ambigu-ity as the economic recovery continues to take shape. They do not suggest large wealth-based changes in behavior for potential CCRC residents over the next several years. Longer term, however, the wealth ac-cumulation picture appears cloudy and may foment a rethinking of CCRC care delivery models.
6.0 Assessments of Labor Supply
The goal of this section is to summarize present and assess future labor force requirements, including the size and mix of pay/skill and experience needed to staff North Carolina’s CCRCs as the resident popula-tion grows. We begin with an examination of the cur-rent employee structures at North Carolina’s CCRCs. With information from the member CCRCs, we cat-egorized current employees by primary job category, certification and educational requirements, and the skills and experience levels needed for each job cat-egory. What follows are baseline projections.
North Carolina Department of Insurance in-formation indicates that, as of 1 January 2014, 18,961

45
people resided in North Carolina CCRCs. Based on an estimated 1.3 residents per staff member (calculated from available data), there were an estimated 14,300 staff members working in North Carolina CCRCs for a total payment of $486,821,227. In addition, another estimated $51,474,032 was paid to contract labor, not counted as employees. Table 13 summarizes the es-timated number of CCRC employees as of 1 January 2014.
The table was constructed by examining data on the personnel of select CCRCs, calculating the av-erage number of employees of each type per resident and multiplying those estimates by the total number of CCRC residents, as estimated by the Department of Insurance. Some 139 specific job titles at North Caro-lina CCRCs were categorized by skill level and func-
tion. The classification of employees was somewhat arbitrary, particularly with respect to level. “Line personnel,” in particular, includes unskilled workers along with those who have accumulated a fair level of skill and possibly certification. Certified nursing assistants and licensed practical nurses were coded as line personnel as were cooks and dining room aides, with mainly the function classification to differentiate among them.
Not surprisingly, the largest number of em-ployees, 85.4 percent, was classified as line personnel and the largest functional domain was medical care, with 53 percent of the personnel. At 46 percent of the total, line personnel in medical care were the most nu-merous type of employee. After medical care, main-tenance of the physical plant accounted for 19 percent
Table 13: Estimated number of North Carolina CCRC employees, 1 January 2014

46 Appold, Johnson, and Parnell
Table 14: Age distribution of North Carolina CCRC personnel
Table 15: Estimated Total salaries and benefits of North Carolina CCRC employees, 1 January 2014

47
of the employees. Food preparation was responsible for another 15 percent of the personnel. CCRCs tend to employ a number of bus drivers, which accounts for the presence of transportation. The number of those involved in social support, whether activity coordi-nation or social work, was slightly greater. Interest-ingly, CCRCs sometimes had chaplains on the payroll. Office functions, including management, accounted for 5 percent of employment.
Table 14 summarizes the available information on the average age of those filling 139 specific job titles at North Carolina CCRCs. The average age of many job holders is somewhat high. For selected jobs for specific CCRCs, the average age is over 60. In some cases, that is an indication that the position may be used as a retirement job. In some cases, there may be sufficient turnover in the labor market so that replace-ment may not be an issue. However, in some cases, advanced age may present CCRCs with a replacement problem. Specifically, the higher management func-tions appear to be filled by more senior persons. The pipeline for filling those positions is unclear and re-cruitment may be an issue for the less metropolitan CCRCs.
Table 15 summarizes the information on CCRC total personnel costs in North Carolina as of 1 January 2014. The information is categorized by function and level. With some adjustment for the positions requiring more education and experience, the distribution of labor costs follows the distribution of personnel discussed above. The payments made to contract labor, assumed for these purposes to be a re-flection of overall personnel patterns, are included in the estimates.
These numbers need to be seen as tentative estimates. They are based on a modest number of select CCRCs. Further, all CCRCs employ contract labor and it is not clear from the financial informa-tion available which specific functions have been con-tracted out. Individual CCRCs engage in unique sets of tasks. Some offer more assisted living or nursing facilities than others. A few offer memory care – a category which is likely to grow rapidly over the next few years, while other members do not yet do so. The size and nature of living quarters varies by member institution, affecting the magnitude of maintenance and landscaping needs. None of these variations have been taken into account in this aggregate summary.
Data from the Bureau of Labor Statistics pro-vides a nation-wide baseline for comparison. Table 16 summarizes the number and salaries of CCRC employees by major occupational title in 2014. The occupational distribution of employees broadly coin-cides with that found in our data. The proportion of employees who are managers and who fill office func-tions is similar in both datasets. In contrast, however, the proportion engaged in food service appears to be slightly lower in North Carolina CCRCs and the proportion directly involved in health care possibly higher. A task for future research, using a broader database, might be to more rigorously measure the differences and explain the deviations.
A baseline projection of aggregate personnel needs in 2034 is shown in Table 17. This projection was formed by maintaining the present-day distribution of employees and calculating how many of each category would be needed given the projected CCRC popula-tion in 2034. This projection assumes no change in

48 Appold, Johnson, and Parnell
Table 16: Number, Distribution, and Salaries of Employees of Continuing Care Retirement Communities and Assisted Living Facilities for the Elderly, Nation-wide
May 2014
Table 17: Estimated number of North Carolina CCRC employees, 1 January 2034
Source: Bureau of Labor Statistics, Occupational Employment Statistics, http://www.bls.gov/oes/current/na-ics4_623300.htm

49
Table 18: Estimated Total salaries and benefits of North Carolina CCRC employees, 1 January 2034
technology or relative wages and no constraints on labor supply.
Table 18 provides projected estimates of salary and benefit needs in 2034. The estimates are in 2014 dollars and do not account for inflation. Future work might assess how wages might evolve in conjunction with labor supply. A wider database and extending the analysis into the period in which the Baby Boom-ers enter CCRCs in appreciable numbers while labor supply is somewhat more restricted would yield inter-esting results.
These are baseline estimates and projections. The reality will be very much affected by unfolding trends in health status. Needs may also possibly be tempered by the willingness and ability to pay. Out-lining key scenarios is a task for future work.
7.0 The Economic Impact of North Carolina CCRCs
We measured the economic impact of North Carolina CCRCs on state and local economies in two ways. First, we estimated the impact of on-going CCRC ex-penditures – that is, excluding large capital projects – on the state economy as a whole and on the localeconomies of the counties in which they are located. Second, we estimated the impact of the consumer ex-penditures of CCRC residents on the state economy as a whole. Because a substantial portion of resident consumer expenditures is devoted to the housing, meals, and other services provided by CCRCs, these impacts overlap to a large degree.
By economic impact, we mean the way in
31 The IMPLAN model is broadly used in economic impact analyses. It uses data provided by the U.S. Bureau of Economic Analysis, the Bureau of Labor Statistics, and various state and federal agencies. The model generates, among other results, the number of jobs, labor income, and taxes created by a specified input. It also gener-ates economic output, roughly equated to business revenue, resulting from a group’s direct, indirect, and induced economic impacts. In the Implan model, CCRCs are treated as being in NAICS code 623.

50 Appold, Johnson, and Parnell
which CCRC and resident expenditures circulate through local economies, generating business revenue and consequently employment and tax payments. For our analysis, we utilized an input-output model known as IMPLAN. This model is based on inter-industry purchasing patterns, consumption patterns, and local production, retail, and service availability.
IMPLAN traces consumer spending through over 500 sectors of North Carolina’s economy to esti-mate a variety of economic impacts at the state, met-ropolitan area, and county levels.31
For both estimates, the inputs into the analy-sis were estimated from data on the total number of CCRC residents provided by the Department of Insur-ance plus supplemental information. CCRC expen-ditures were obtained from the 2014 cash flow state-ments supplied by several LeadingAge NC member communities to support this analysis. These data were converted into average expenditure per resident. This procedure abstracts from individual institution’s differences in service offerings, variations in cost, and the impacts of scale but preserves a degree of confi-dentiality.32 Only on-going expenditures are included in the analysis because, as noted above, major capital projects are episodic and including them in the analy-sis might yield a biased estimate of normal impacts.
As noted above, we have no direct measure-ment of the incomes of CCRC residents. We imputed their income and consumer spending from Depart-ment of Insurance information on CCRC entry fees and monthly expenses. Because the Implan software does not have data on age-specific consumption pat-terns, the household expenditure patterns of those with $75,000-$100,000 income were used as proxies
for resident expenditures. Again, this procedure ab-stracts from the differences in the populations served by CCRCs.33
Our estimates of the state-wide economic im-pacts of CCRC expenditures are summarized in Table 19. The top panel of the table provides information onthe basic economic parameters of the state’s CCRCs. This information is discussed in more detail elsewhere in this report. The second panel summarizes the top-level economic impacts. The direct impact is equiva-lent to the CCRC expenditures. Those expenditures generate indirect impacts as other businesses act as suppliers, employing workers to do so, and induced impacts as the employees make consumer purchases on the basis of their earned labor income.
Given the high service content, CCRC expen-ditures have relatively large local impacts. The esti-mated $979 million in CCRC expenditures generated an estimated total economic impact of $1.7 billion in 2014. An estimated total of 22,355 jobs were created across all skill levels, including the 14,906 generated directly by the CCRCs themselves. This resulted in an estimated total of $744 million in labor income. This economic activity also generated an estimated total of $93 million in state and county tax revenues (mu-nicipal revenues are not included) and $152 million in Federal tax payments. Appendix Table 1 summa-rizes the economic characteristics of North Carolina CCRCs, including the input data for the individual institutions. Appendix Table 2 summarizes the re-sults of the analyses of the economic impacts of the individual CCRCs on their home counties.
A summary of the results of an initial analy-sis of the economic impact of CCRC resident buying
32 We did not incorporate information from the Benchmark Study into the impact analysis but did use the information provided to validate the other data.
33 Subsequent research will develop closer approximations to the specific values for each CCRC and more closely model age-specific consumption patterns.
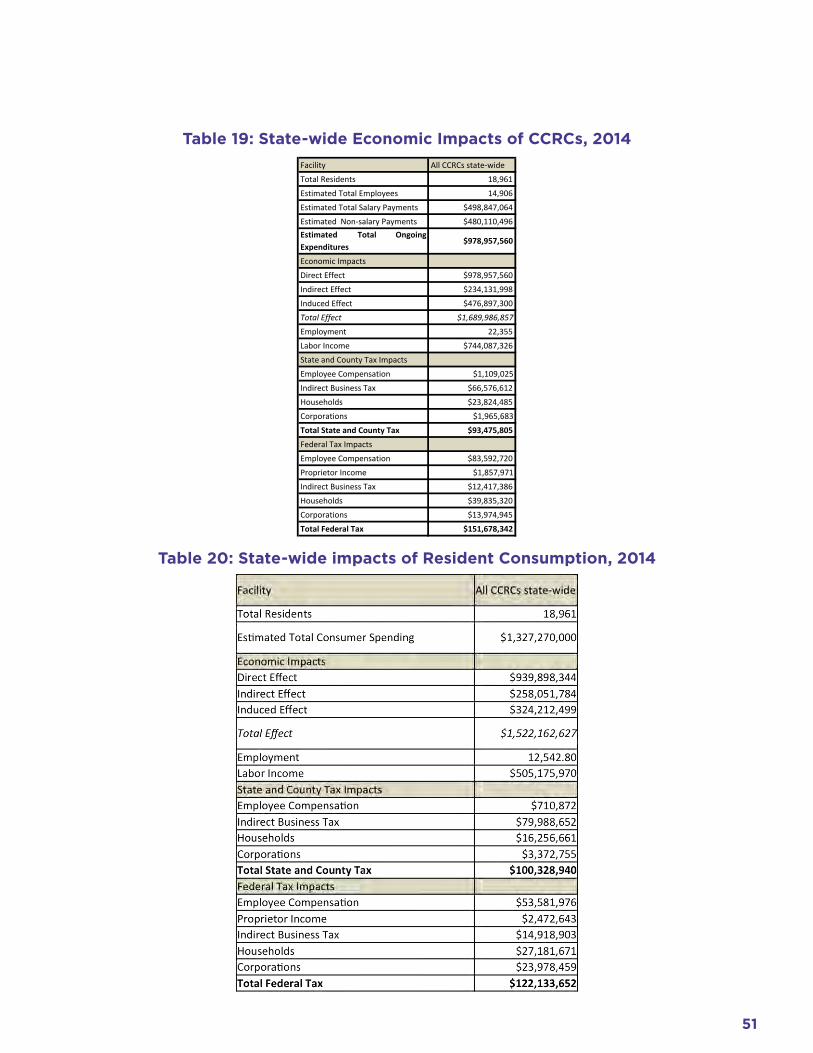
51
Table 19: State-wide Economic Impacts of CCRCs, 2014
Table 20: State-wide impacts of Resident Consumption, 2014
Facility All CCRCs state-‐wideTotal Residents 18,961Estimated Total Employees 14,906Estimated Total Salary Payments $498,847,064 Estimated Non-‐salary Payments $480,110,496 Estimated Total OngoingExpenditures
$978,957,560
Economic ImpactsDirect Effect $978,957,560 Indirect Effect $234,131,998 Induced Effect $476,897,300 Total Effect $1,689,986,857 Employment 22,355Labor Income $744,087,326 State and County Tax ImpactsEmployee Compensation $1,109,025 Indirect Business Tax $66,576,612 Households $23,824,485 Corporations $1,965,683 Total State and County Tax $93,475,805 Federal Tax ImpactsEmployee Compensation $83,592,720 Proprietor Income $1,857,971 Indirect Business Tax $12,417,386 Households $39,835,320 Corporations $13,974,945 Total Federal Tax $151,678,342

52 Appold, Johnson, and Parnell
power is contained in Table 20. As noted, much of this impact is conveyed through resident payments to the CCRCs themselves. However, CCRC residents make other purchases, some of which are within the state but others, such as for travel, have little impact on the state’s economy, even if they are purchased at home. The estimated $1.3 billion in CCRC resident consumer expenditures generated an estimated total economic impact of $1.5 billion in 2014. An estimated total of 12,543 jobs were created across all skill levels. This resulted in an estimated total of $505 million in labor income. This economic activity also generated an estimated total of $100 million in state and county tax revenues (municipal revenues are not included) and $122 million in Federal tax payments. Because these estimates were generated by data and model co-efficients not specific to the CCRC age bracket, these estimates need to be interpreted with caution. Refin-ing estimates of CCRC resident spending and their
Table 21: State-wide Economic Impacts of CCRCs, 2034
impacts is an important task for future research.
Based on the projections of CCRC residents reported above, we estimated what the state-wide eco-nomic impact of CCRCs would be in 2034, the end year of the projections. The results are summarized in Table 21. This is a simple estimate in real (2014) dollars and assumes no large changes in economic structure, an assumption which is likely justified for our purposes on a state-wide level but might be more questionable at a local level . Although clearly specu-lative, we projected an estimated $1.8 billion in CCRC expenditures which will generate an estimated total economic impact of $3.2 billion in 2034. An esti-mated total of 41,714 jobs were projected to be created across all skill levels, including the 29,752 generated directly by the CCRCs themselves. This resulted in a projected total of $1.4 billion million in labor income. This economic activity will also generate an estimated

53
total of $174 million in state and county tax revenues (municipal revenues are not included) and $283 mil-lion in Federal tax payments.
These results generate a useful description of the magnitude of the economic impact of CCRCs. They can be generalized to the consumer spending impact of a largely high-income senior population. Whether CCRC residents or not, the individuals in the relevant age group and income class would likely be spending approximately the same amounts on housing, eating, medical care and the like. Some of that spending would otherwise accrue to independ-ent living communities. Some would otherwise go to assisted living facilities and nursing homes. Some CCRC residents would likely live in their own homes and purchase health and home services much as other seniors. Measuring the efficiencies of residential and health service provision in the CCRC context over al-ternatives would be a critical task for future research.
8.0 Summary and Conclusions
This report summarizes the demographic and economic environments that structure challenges and opportunities to North Carolina’s CCRCs now and into the future. North Carolina’s CCRCs provide homes and a continuum of care to over 20,000 seniors, allowing the residents to remain in their community as their health and functional abilities decline. In 2014, CCRCs had a statewide economic impact of $1.69 billion in 2014, with $979 million in direct expendi-tures. Almost 15,000 North Carolinians are directly employed by CCRCs, with 22,355 jobs in the state linked to CCRCs. North Carolina’s senior population is projected to grow to 2.5 million in twenty years as baby boomers age and North Carolina continues to be a destination for retirees in other states. With this
growing population of seniors, the economic impact of CCRCs in the state is estimated to grow to $3.2 bil-lion and employment will grow to almost 30,000.
Both the demographic and economic environ-ments have been and will be heavily impacted by mi-gration patterns, including retirement migration. Any changes in the attractiveness of North Carolina as a retirement destination can affect the level of migra-tion. Changes in North Carolina state law in 2014 have ended income tax exemptions for health care expenses and retirement income. These changes disproportion-ately affect seniors and thus potentially could impact the state’s economic environment for retirees.34
Although with a lag due to the gap between prime earning years and CCRC residence years, CCRCs may be impacted by setbacks to wealth accu-mulation due to a harsher economic environment and by evolving patterns of inequality. CCRCs may be af-fected by changing patterns of health status, although we suspect that the present target population is to an extent shielded from some of the increase in specific chronic illnesses which require extended care.
This report has presented baseline projections of market demand, human resource needs, and eco-nomic impact. Future work will need to explore varia-tions in CCRCs and contingencies in the environment. Scenarios to aid strategic planning, particularly with respect to potentially extending the circle of care to include CCRC residents and non-residents, those with high wealth and those with less, may be an important next step.
The largest source of uncertainty with respect to strategic planning may be the drivers of the deci-
34 See http://www.newsobserver.com/news/politics-government/state-politics/article13634015.html . See also http://www.newsobserver.com/opinion/letters-to-the-editor/article25513981.html for an example of recent opinion of the possible effects on retirement migration.

54 Appold, Johnson, and Parnell
sion to enter a CCRC. Little is known about the fac-tors affecting the decisions of individuals to choose CCRCs among the several options. Ability to pay is certainly an important consideration. CCRCs now serve those in the top percent or two of the income distribution. CCRCs were founded to care for retired clergy – a group which, while not poor, tends not to be near the top of the income distribution. A challenge for North Carolina CCRCs, in particular, may be to adapt to the needs of those with somewhat less finan-cial means than those now served. Even accounting for income, large unknowns remain. Understanding resident preferences may be another important next step.
Income considerations, along with evolving preferences in living arrangements, may lead to some-what different CCRCs than now exist. Migration data suggest a desire for residential stability which sets in at a somewhat younger age than that of entry to CCRCs. That age gap may be tied to unmeasured sub-group preferences but it may be that CCRCs may consider more open arrangements which also appeal to those a decade or more younger than their present residents in order to capture a larger portion of the senior popu-lation and of the oldest old.
Such arrangements may be adapted to serve the Baby Boom generation. This large cohort will require accommodation but, by the time they need care, the duration of the care needs may be too short to justify the large capital costs entailed in developing the age-graded housing and single-purpose care facili-ties. An alternative may be to build future CCRCs to be “recyclable” – so that younger small households might also find the living situations attractive as the peak needs soften and possibly abate.
Now and continuing on through the foresee-able future, CCRCs are an important option in the set of senior residence and care options. They house a considerable number of seniors and are welcome additions to their communities, often drawing upon community opportunities through organized and informal outings. Residents often contribute to the quality of community life. CCRCs are important em-ployers in their communities generating employment for those across all skill levels and in many special-ties. Moreover, through their purchases and payrolls, CCRCs make significant contributions to local econo-mies and to the tax base.

55

56 Appold, Johnson, and Parnell
Appendix Tables
Appendix Table 1: Summary of Economic Characteristics of North Carolina CCRCs

57
Appendix Table 1: Summary of Economic Characteristics of North Carolina CCRCs

58 Appold, Johnson, and Parnell
Appendix Table 2: Economic Impact of North Carolina CCRCs

59
Appendix Table 2: Economic Impact of North Carolina CCRCs

60 Appold, Johnson, and Parnell
Appendix Table 3: Population Estimates and Projections for Counties Currently With LeadingAge North Carolina Member, 2014-2034
2014 Estimates

61
Appendix Table 3: Population Estimates and Projections for Counties Currently With LeadingAge North Carolina Member, 2014-2034
2020 Estimates

62 Appold, Johnson, and Parnell
Appendix Table 3: Population Estimates and Projections for Counties Currently With LeadingAge North Carolina Member, 2014-2034
2025 Estimates

63
Appendix Table 3: Population Estimates and Projections for Counties Currently With LeadingAge North Carolina Member, 2014-2034
2030 Estimates

64 Appold, Johnson, and Parnell
Appendix Table 3: Population Estimates and Projections for Counties Currently With LeadingAge North Carolina Member, 2014-2034
2034 Estimates

65


