
Market Labor and Youth Capacity Assessment · Labor Market and Youth Capacity Assessment 6...
231
Market Labor and Youth Capacity Assessment April 2016
Transcript of Market Labor and Youth Capacity Assessment · Labor Market and Youth Capacity Assessment 6...

Labor Market and Youth Capacity Assessment 2
Table of Contents Executive Summary ...................................................................................................................................... 6 Introduction.................................................................................................................................................... 8
Objectives ............................................................................................................................................... 9 Overview of the economy ............................................................................................................................ 10
GDP ...................................................................................................................................................... 10 Inflation ................................................................................................................................................. 10 Sectoral assessment ............................................................................................................................ 11 Company number and size ................................................................................................................... 13
Overview of the labor force ......................................................................................................................... 16 Gender and age .................................................................................................................................... 16 Education and skill ................................................................................................................................ 17 Employment status ............................................................................................................................... 19
Wage employment versus self-employment.................................................................................... 19 Formal versus informal employment ............................................................................................... 21
Worker mobility ..................................................................................................................................... 21 Employment trends and wages in public and private sectors ..................................................................... 22
Employment trends ............................................................................................................................... 22 Gender segregation ......................................................................................................................... 22 Private versus public sector employment ........................................................................................ 22
Wages ................................................................................................................................................... 22 Private sector wages ....................................................................................................................... 23 Public sector wages ......................................................................................................................... 24
Recruitment and job search methods ................................................................................................... 26 Recruitment methods ....................................................................................................................... 26 Job search methods ........................................................................................................................ 28
Aspects of youth employment ..................................................................................................................... 29 Youth in wage employment .................................................................................................................. 29 Youth in self-employment ..................................................................................................................... 30
Unemployment ............................................................................................................................................ 31 Unemployment duration ....................................................................................................................... 32
Migration and its effect on the labor market ................................................................................................ 34 Emigration ............................................................................................................................................. 34
Effects of emigration on the labor market ........................................................................................ 34 Steps to be taken ............................................................................................................................. 34
Syrian Crisis .......................................................................................................................................... 35 Effects of the Syrian crisis on employment...................................................................................... 36 Effects of the Syrian crisis on self-employment ............................................................................... 36 Steps to be taken ............................................................................................................................. 37
Vocational and technical education system ................................................................................................ 37 Education system overview .................................................................................................................. 37 Vocational and technical programs ...................................................................................................... 38
General program overview .............................................................................................................. 38 Programs on offer at technical and vocational institutes and learning centers ............................... 41
Vocational and technical students ........................................................................................................ 42 Students by diploma and specialization .......................................................................................... 42 Students by type of school .............................................................................................................. 43

Labor Market and Youth Capacity Assessment 3
Students by Mohafaza ..................................................................................................................... 44 Students by gender .......................................................................................................................... 44
Vocational and technical schools and learning centers ....................................................................... 45 Schools by type ............................................................................................................................... 45 Schools by Mohafaza ...................................................................................................................... 46 Interviewed technical and vocational institutes and learning center ............................................... 46
Vocational and technical teachers ........................................................................................................ 48 Vocational and technical staff numbers ........................................................................................... 48 Full-time versus part-time teaching ................................................................................................. 49 Vocational and technical teacher education .................................................................................... 50 Vocational and technical teacher training ........................................................................................ 51
Issues with the technical and vocational system .................................................................................. 51 Perception of technical and vocational education ........................................................................... 51 Student orientation ........................................................................................................................... 52 Mismatch with labor market requirements ....................................................................................... 52 Curricula........................................................................................................................................... 55 Administration .................................................................................................................................. 56
In-house training by employers ................................................................................................................... 56 Training at interviewed companies ....................................................................................................... 57
Training provider and frequency ...................................................................................................... 57 Type of training ................................................................................................................................ 58 Satisfaction with training .................................................................................................................. 61
Projects and initiatives for youth training and employment ......................................................................... 62 Youth training ........................................................................................................................................ 63
Programs led by the National Employment Office ........................................................................... 64 Initiatives by international and national organizations ..................................................................... 64 Education-business cooperation and partnership projects .............................................................. 64
Youth employment services ................................................................................................................. 65 National Employment Office ............................................................................................................ 65 NGOs ............................................................................................................................................... 65
Self‐employment and micro-entrepreneurship ............................................................................................ 66 Financial support to the self‐employed and micro-entrepreneurs ........................................................ 66
Corporate credit overview ................................................................................................................ 66 Microfinance .................................................................................................................................... 67 Kafalat .............................................................................................................................................. 74
Occupations and skills in demand .............................................................................................................. 76 Occupations in demand ........................................................................................................................ 76 Skills and qualifications in demand....................................................................................................... 78
Language and IT skills ..................................................................................................................... 79 Education ......................................................................................................................................... 79
Experience required ............................................................................................................................. 80 Gender specification ............................................................................................................................. 81
Mapping of subsectors for the private sector survey .................................................................................. 81 Criteria .................................................................................................................................................. 82
Contribution to GDP ......................................................................................................................... 82 Number and share of skilled workers .............................................................................................. 83 Future potential for growth ............................................................................................................... 84 Number and size of companies ....................................................................................................... 86 Labor demand .................................................................................................................................. 87

Labor Market and Youth Capacity Assessment 4
Overall mapping results ........................................................................................................................ 89 Interviewed companies ............................................................................................................................... 90
Company profile.................................................................................................................................... 90 Employee profile ................................................................................................................................... 91 Recruitment .......................................................................................................................................... 93
Number and profile of job openings for skilled workers ................................................................... 94 Recruitment process ........................................................................................................................ 96 Difficulties in recruitment.................................................................................................................. 98 Company coping strategies for recruitment difficulties .................................................................. 100 Employment of foreign labor .......................................................................................................... 101
Wages ................................................................................................................................................. 102 Gap analysis ............................................................................................................................................. 102
Skill and training gaps ........................................................................................................................ 102 English language skills .................................................................................................................. 102 Communication and other soft skills .............................................................................................. 103 Technical and business skills ........................................................................................................ 103 Skill and training gaps by sector .................................................................................................... 104
Challenges for youth employment ...................................................................................................... 105 Lack of experience ......................................................................................................................... 105 Youth perceptions .......................................................................................................................... 106 Employer perceptions and practices ............................................................................................. 107 The national labor market and economy ....................................................................................... 107
Findings and recommendations ................................................................................................................ 109 Training program improvements ......................................................................................................... 109 Improvements in employment services and job search methods ...................................................... 110
Employment services ..................................................................................................................... 110 Job search method ........................................................................................................................ 110
Sectors and job types offering the best youth employment opportunities .......................................... 111 Job positions with the best opportunities for employment ............................................................. 111 Sectors with the best opportunities for employment ...................................................................... 111 Sectors with the best opportunities for microenterprises ............................................................... 113
Youth workforce development training program recommendations ................................................... 113 Conclusion................................................................................................................................................. 115 Appendices ............................................................................................................................................... 116
Study methodology ............................................................................................................................. 116 Segment One - Desk Research ..................................................................................................... 116 Segment Two - Private Sector Interviews ..................................................................................... 117 Segment Three- In-depth Interviews ............................................................................................. 118 Segment Four - Focus groups with Youth ..................................................................................... 120 Segment Five - Final Report and Recommendations ................................................................... 120 Data control ................................................................................................................................... 121 Data entry and processing ............................................................................................................. 121 Standards ...................................................................................................................................... 121 Copyright ....................................................................................................................................... 121
List of Sources .................................................................................................................................... 122 Distribution of Students in Public and Private Vocational Schools ..................................................... 123 Distribution of Staff in Technical and Vocational Schools .................................................................. 124 Degrees and Programs Offered at Technical and Vocational Institutes ............................................ 125 Degrees and Programs Offered at Learning Centers......................................................................... 131

Labor Market and Youth Capacity Assessment 5
Salaries by Type of Open Job Position .............................................................................................. 133 Salaries by Sector............................................................................................................................... 135 Job Openings and Skills Required by Sub-sector .............................................................................. 154
Agro-Alimentary ............................................................................................................................. 154 Hotels ............................................................................................................................................. 160 Restaurants ................................................................................................................................... 172 Building and Construction .............................................................................................................. 178
Recommendations .............................................................................................................................. 182 Profile of Focus Group Participants .................................................................................................... 185 Company Questionnaire ..................................................................................................................... 185
General Company Information: ..................................................................................................... 188 General Overview: ......................................................................................................................... 190 Recruitment: .................................................................................................................................. 192 Employee Training: ........................................................................................................................ 209
Stakeholder Discussion Guides .......................................................................................................... 214 Discussion Guide 1: Technical & Vocational Training Institutes ................................................... 214 Discussion Guide 2: Learning Centers .......................................................................................... 220 Discussion Guide 3: Recruitment Agencies .................................................................................. 223 Discussion Guide 4: Microfinance Institutions (MFIs) ................................................................... 226 Discussion Guide 5: Economic Expert .......................................................................................... 227 Interviewed Companies ................................................................................................................. 228

Labor Market and Youth Capacity Assessment 6
Executive Summary
Worldwide, young people are three times more likely than their parents to be out of work. There are two related issues: high levels of youth unemployment and a shortage of people with critical job skills. Lebanon is experiencing these same issues, in its own particular economic context.
Lebanon’s labor force is young, and the share of youth entering the labor market is expected to continue to increase. This is one reason for their high rate of unemployment. Other factors are a lack of the experience that employers usually require, and an incomplete skill set. A scarcity of internships and other entry-level opportunities are also obstacles to youth employment. Misperceptions of youth about job positions and salaries can also be an issue. In addition, some recruiters find that young people are sometimes not motivated or serious enough in their job search. According to World Bank estimates, even before the Syrian crisis Lebanon’s unemployment rate was 11% with unemployment among women twice as high. In July 2015, the Minister of Labor stated that the youth unemployment rate was a staggering 36% of the country’s total unemployment rate.
The workforce is generally well educated. The number of university graduates among workers is continuing to increase. This is a positive development for the country, as higher education tends to enhance economic growth by increasing productivity. However, the low value placed on technical and vocational education, and employer preference for recruits with university degrees signifies a loss of practical know-how in a wide range of professions.
It also impacts student choices with regards to type of education and specialization. There are still few vocational or technical graduates compared to academic graduates, even though the number of students in technical and vocational education (TVE) is increasing. Within the TVE system, white-collar specializations such accounting are more in demand than blue-collar professions. The result is a lack of qualified plumbers, electricians and technicians in the labor market.
Despite the strong interest in entrepreneurship of the local labor force, including youth, wage employment is slightly more common than self-employment or being an employer. The dream of self-employment is realized more often starting at 35 years of age. It is therefore not surprising that youth are the minority among loan beneficiaries of micro-finance institutions (MFIs) which support small business projects.
Younger people are more likely to be in informal or formal wage employment. At the outset of their career, many young people get indoor sales and hospitality jobs because the hours are more flexible and compatible with their studies. Self-employed youth are found primarily in trade as well as service professions.
Services are the most important economic activity in the country. Together with trade, they employ around three-quarters of the labor force. Worker mobility between different types of occupations and sectors is high. Although this flexibility has the advantage of workers entering sectors where jobs are available, it also results in many people working outside their field of expertise.
National wages are characterized by low wage disparity between different levels of employees in both the private and the public sector. It is closely linked to a low skill premium, which signals that human capital in undervalued in the labor market. One factor is that economic growth has been slow over the last few years and has not created many jobs. The overall result is a high rate of unemployment among skilled workers,

Labor Market and Youth Capacity Assessment 7
which contributes to their emigration. The high level of youth and skilled emigration has resulted in large brain drain losses.
Recruitment and job-search methods are very informal. Word-of-mouth through social or political connections is the most common method, especially for small companies, informal employment, and unskilled jobseekers. The informal recruitment process reflects the relationship-oriented corporate system, characterized by the prevalence of family businesses. Companies usually solicit recruitment agencies to find personnel at the management or professional level, not below, and some sectors such as hospitality do not generally rely on agencies. Recruitment of migrants is not a very popular solution, particularly in the hospitality sector. At companies interviewed skilled workers have generally not been replaced by incoming Syrian refugees. These typically have few skills and are employed at menial tasks. However, Syrian workers compete with Lebanese in the unskilled labor segment, as well as in micro-enterprises and in the informal sector. Taking into consideration the current state of the national labor market and economy, Global Communities working in partnership with InfoPro determined the gaps in skills and lack of employment opportunities of youth. After mapping the main economic sectors according to a number of criteria, three subsectors were chosen for in-depth review, namely agro-alimentary and beverages, hotels and restaurants, and building and construction.
The report bases its analysis on desk research, the consultation of an economic expert, as well as interviews with stakeholders, including companies in the three subsectors, technical and vocational institutes, learning centers, micro-finance institutions (MFI), recruitment agencies, and youth themselves. This analysis allowed InfoPro to make recommendations to CHF Lebanon for the development of specific short-term and medium-term youth workforce training programs.

Labor Market and Youth Capacity Assessment 8
Introduction
Increase youth employability is one of the goals of Global Communities in Lebanon (CHF in-country), an international non-profit development organization, whose mission is to create long-lasting, positive and community-led change that improves the lives and livelihoods of vulnerable people across the globe.
Global Communities is currently implementing a Caterpillar Foundation funded program called MENA Youth Empowerment Strategy (YES) in Lebanon, Jordan and Yemen. The program addresses youth unemployment among 15 to 29 year olds. Global Communities engages employers and vocational training institutions in order to identify available employment opportunities, gaps in the skill level of youths, and potential ways of addressing such gaps.
The program is active in several sectors in Lebanon, in and around the Greater Beirut area, including IT (graphic design, AutoCAD), secretarial, and swimming instruction, with trainings in development in heating/air conditioning and electro-mechanical and hospitality (runners, waiters, cooks). The program has also developed a course in entrepreneurship, employability and soft skills, and conducted access-to-finance workshops for all program participants.
To date, 551 Lebanese youth in the Greater Beirut Area and Zahle have successfully completed our technical and entrepreneurial and soft skills trainings, of which 74% have been placed in internships/apprenticeships, jobs or decided to pursue advanced technical learning.
Currently Global Communities plans to expand the program to throughout Lebanon, including to South, Nabatieh, Mount Lebanon, Bekaa Governorates. To help us plan for the expansion of our youth livelihood activities, we partnered with InfoPro to conduct a workforce gap analysis that includes both an overall assessment of both the labor market and youth capacity, which was supplemented with research looking closely at livelihood opportunities for Syrian refugee youth within the current environment.

Labor Market and Youth Capacity Assessment 9
Objectives
The main objectives of the Workforce Gap Analysis are the following:
• Identify the skills that are most in demand by the private sector • Identify whether these skills are tackled by local training providers • Identify potential solutions to bridging the gap between the skills available and those required by
the labor market • Identify promising job placement opportunities • Identify vocational training providers the trainings they offer • Identify employment challenges faced by youth • Identify skills that youth have
The assessment took into account gender considerations and special issues facing disabled jobseekers. It also considered the effects of the security situation, the influx of informal workers, and the impact of local and regional instability on the training and hiring practices of the private sector.
Through this assessment, Global Communities is interested in gaining a perspective specific to sub-sectors which can provide them with tangible results that they can utilize in their future programs. The selected sub-sectors should be those that employ a large number of skilled workers and have future potential for growth which translates into increased demand for employees. Moreover, the sub-sectors selected will have a priority over the areas that CHF plans to expand into. Accordingly, InfoPro did not select the sub-sectors across the regions CHF is targeting for expansion, but rather assessed sectors with demand, and only then identified their areas of location.
The objective of the survey is therefore to assess the labor market in Lebanon in general and across a select number of sub-sectors. This was carried out by assessing whether there is a mismatch between supply and demand. The survey assessed the supply available and its specifications across various sub-sectors, and compared that to demand, whether in the formal or the informal sector.
The study also assesses what skills youth have, what challenges they are facing in gaining employment and what can be done to better prepare them for the labor market. The role that can be played by technical and vocational training institutes was considered, along with available entrepreneurship opportunities.

Labor Market and Youth Capacity Assessment 10
Overview of the economy
GDP The country's economic growth was an average of eight percent a year from 2007 to 2010 due to strong regional demand for its goods and services and large inflows of transfers and capital. Thereafter, GDP displayed low although positive growth as a result of regional and local events. The International Monetary Fund (IMF) estimates that the economy grew by two percent in 2014 and will expand by four percent annually over the medium term.
Source: Ministry of Economy and Trade
Economic growth has not been employment-intensive. Between 1997 and 2009, the GDP expanded at an average rate of 3.7 percent per year, but employment of local labor grew by only 1.1 percent.
Inflation Due to its high reliance on imports, its dollar-pegged currency and highly dollarized economy, Lebanon is subject to international prices transmission. Imported inflation has a strong impact on the local Consumer Price Index (CPI) and accounts for about 70 percent of inflation in the country.
Over the last few years, the CPI has followed an upward trend due to hikes in the prices of food, beverages, tobacco, housing, health and education services as well as water, electricity, gas and other fuels, impairing household spending power. However, consumer demand has been reduced by the recurrence of internal security incidents and political deadlock since 2011, and this has lessened the upward pressure on prices.
25.0
29.7
34.737.1
39.5
44.1
47.2
8.4% 8.6%9.0%
7.0%
5.2%
2.8% 3.0%
0%
1%
2%
3%
4%
5%
6%
7%
8%
9%
10%
0
5
10
15
20
25
30
35
40
45
50
2007 2008 2009 2010 2011 2012 2013
Evolution of Absolute Nominal GDP and Real GDP Growth
Nominal GDP (USD billion) Real GDP Growth (annual %)

Labor Market and Youth Capacity Assessment 11
Local prices even started to decline in December 2014 on the back of sliding international oil prices. According to the Central Administration of Statistics (CAS) the CPI fell from 100.92 points in January 2014 to 97.13 points by the end of January 2015, one of its lowest levels in the past five years. The yearly evolution is shown below.
Source: CAS
Sectoral assessment The most recent sectorial breakdown of GDP dates from 2011. It shows that services are the most important economic activity, contributing over a third of the GDP, followed by trade and manufacturing. The shares of agriculture and industry in the economy have been in decline for the last 40 years.
Table 1. Sectorial contribution to GDP Sector Share of GDP (%) Commercial Trade 16% Real Estate 14% Education, Health, Personal & Community Services 12% Manufacturing, Mining, Quarrying & Utilities 10% Public Administration 9% Transport, Hotels, Restaurants, Information & Communication 9% Taxes less subsidies 8% Professional & Administrative Services 7% Financial Services 7% Construction 4% Agriculture and Livestock 4% Total 100%
Source: CAS/Lebanese National Accounts 2011
6.05%
2.89%
10.09%
2.04%
-3.75%
-6%
-4%
-2%
0%
2%
4%
6%
8%
10%
12%
2011 2012 2013 2014 2015
Year-on-Year Percent Change in Price in January

Labor Market and Youth Capacity Assessment 12
Service sector companies and trade firms are usually located in Beirut and its suburbs. Manufacturing includes agro-alimentary and drinks companies, but also textile and clothing, furniture, plastics and petrochemicals. Factories and workshops have historically been located in the Mount Lebanon area which surrounds the capital.
The breakdown of employment by economic sector below shows the importance of services and trade, which are both labor-intensive sectors, and together employ around three-quarters of the entire labor force.
Source: CAS 2009
Services37%
Trade27%
Industry12%
Construction9%
Transportation, post and telecommunication
7%
Agriculture6%
Financial intermediation and
insurance2%
Employment by Economic Sector
Labor Market and Youth Capacity Assessment 13
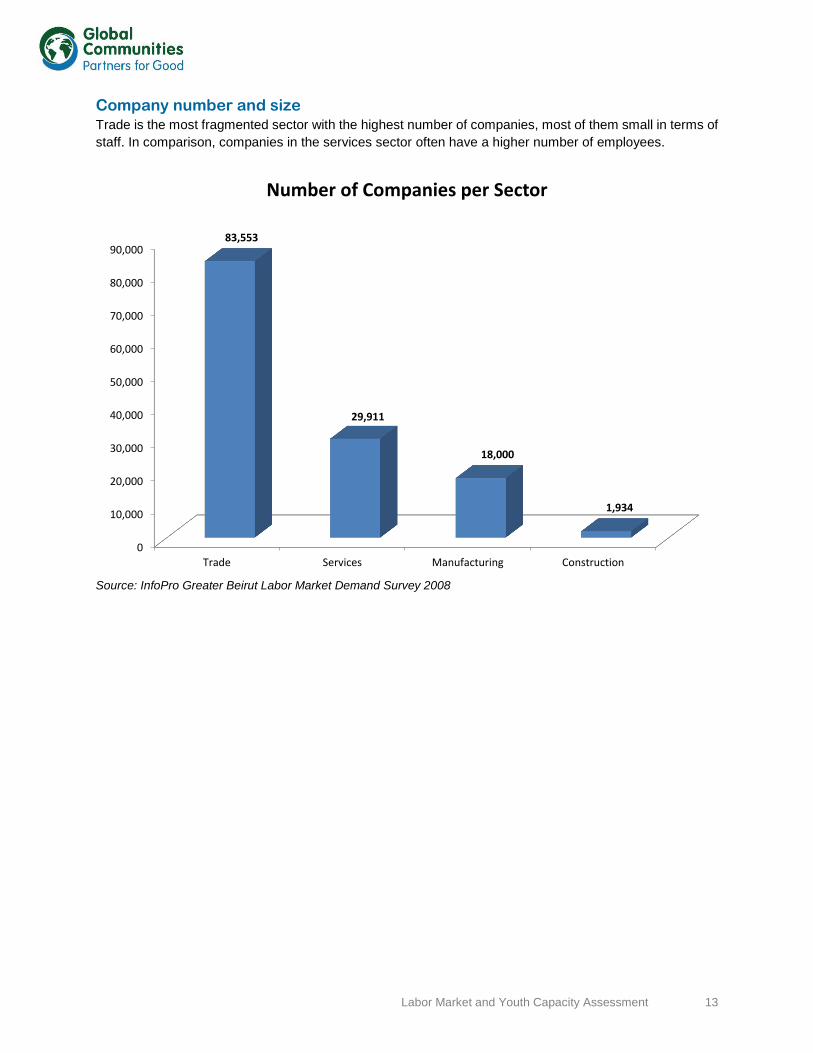
Company number and size Trade is the most fragmented sector with the highest number of companies, most of them small in terms of staff. In comparison, companies in the services sector often have a higher number of employees.
Source: InfoPro Greater Beirut Labor Market Demand Survey 2008
0
10,000
20,000
30,000
40,000
50,000
60,000
70,000
80,000
90,000
Trade Services Manufacturing Construction
83,553
29,911
18,000
1,934
Number of Companies per Sector

Labor Market and Youth Capacity Assessment 14
A few services subsectors, for example telecom and banking, show a high level of concentration, with relatively few companies employing a large number of workers.
Source: InfoPro Greater Beirut Labor Market Demand Survey 2008
0%
10%
20%
30%
40%
50%
60%
70%
1 to 10 employees 11 to 20 employees 21 to 50 employees 51 to 100 employees Above 100employees
4%7%
21% 22%
46%
11% 10%
20%
14%
45%
4% 4%
12% 12%
69%
8%11%
20%
32%29%
Manufacturing and Development Trade and Commerce Services and Maintenance Construction
Sector Distribution by Number of Employees

Labor Market and Youth Capacity Assessment 15
Micro and small enterprises (MSE), defined by CAS as enterprises that employ less than 50 workers, are the driving force in the economy, representing 97 percent of the corporate spectrum. The bulk of workers are active in firms with less than five employees, often family businesses.
Source: CAS Census of Buildings Dwellings and Establishments 2004
Informality is closely linked to company size. The CAS Census of Establishments of 2004 (which is the most recent data) classifies formalization of enterprises according to three criteria: commercial registration, registration with social security (NSSF), and registration with tax authorities. At the time, about half of the MSEs were commercially registered, 44 percent were registered with the taxation department and 20 percent were registered with the NSSF. The likelihood to register in all three systems increases with the size of the enterprise.
The MSE economy is characterized by a focus on final consumers and a lack of business-to-business services. This tends to be a feature of underdeveloped economies, and can be an obstacle to the translation of growth into job creation. In 2006, 98 percent of MSEs identified their customers as households, compared to 94 percent in 2004.
Up to 4 workers91%
5 to 9 workers3.8%
10-19 workers1.5%
20 to 49 workers0.7%
50 to 99 workers0.2% 100 or more workers
0.1%Unspecified
3%
Breakdown of Companies by Number of Workers

Labor Market and Youth Capacity Assessment 16
Overview of the labor force Lebanon has one of the lowest rates of economic activity in the Mediterranean region, estimated at 46 percent in 2010 by the ILO. Several factors have been identified as contributing to this low rate, including the low participation of women in the labor market, the fact that the contribution of women in rural areas is not declared and therefore under-estimated, and the overall importance of the informal economy.
Table 2. Labor Force Statistics as of 2010 Population annual growth rate 0.7% Working age population annual growth rate 1.5% Share of working age population in total population 75% Economic activity rate 46% Economic activity rate of working age men 70% Economic activity rate of working age women 24%
Working age population defined as people aged over 15 Source: International Labor Organization, Economically Active Population, Estimates and Projections, October 2011 According to the World Bank, the Lebanese labor force grew at an average annual rate of 2.2 percent between 2004 and 2010. Half of this growth was explained by the growth in the working age population of 1.7 percent per year (the World Bank figure deviates slightly from the ILO figure of 1.5 percent in the table above).
Lebanon’s labor force is young, with the 25 to 29 age group the most represented among workers, and the share of youth entering the labor market is expected to continue to increase. With increasing participation rates, 23,000 individuals on average would enter the labor market each year over the next ten years.
Gender and age Labor force growth is also explained by increasing female participation rates, which is partly due to a rising level of education among women. As female enrolment ratios have increased and the fertility rate has declined, it has become more culturally and socially acceptable for women to be working in all areas and sectors than was the case for previous generations. The growth of the services sector in particular has opened up employment opportunities for women.
Among young workers in Greater Beirut, females constitute the majority. In Lebanon’s other governorates this number decreases depending on how rural and or conservative the area is. This also changes as women get older and a large number of them exit the labor market because of marriage and childbirth. As a result, men significantly outnumber women in the older age categories. The working life of males is much longer, sometimes starting in the mid-teens and quite often extending well beyond the official retirement age of 64.

Labor Market and Youth Capacity Assessment 17
Source: CAS 2009
Education and skill The workforce is generally well educated, and the number of university graduates among workers is continuing to increase. This is due to the progress in educational standards, which means that more students are continuing their education, and more universities are opening. This is a positive development for the country, as higher education plays an important role in enhancing economic growth by increasing productivity. However, the low value placed on technical and vocational education and the employer preference for recruits with university degrees signifies a loss of practical know-how in a wide range of professions.
In the Greater Beirut area, where the level of education is the highest in the country, close to half of employees have a university degree, while 16 percent have completed vocational or technical studies. At a nationwide level, the educational profile is lower, as the following chart shows.
0%
10%
20%
30%
40%
50%
60%
70%
80%
90%
100%
15 - 19 20 - 24 25 - 29 30 - 34 35 - 39 40 - 44 45 - 49 50 - 54 55 - 59 60 - 64 65 - 69 70 andabove
7%
35%
47%
33%
27%23% 25%
19%15%
9%6%
2%
28%
63%
94% 97% 97% 96% 94% 92% 90%
72%
49%
25%
Economic Activity Rate by Age and Gender
Female Male

Labor Market and Youth Capacity Assessment 18
Source: World Bank, 2010 Employer-Employee Survey
A sufficient level of schooling is a prerequisite for attaining certain job positions. Educational attainment can be used as an indicator of skill, and the level of schooling is reflected quite accurately in the skill level of the workforce. Most companies employ workers across the skill spectrum, from unskilled to professional. Three out of five company employees in the Greater Beirut area are skilled or higher, reflecting a high skill level of the overall workforce.
Among skilled workers in Greater Beirut, including technicians working at a supervisory level and whom management considers able to take more than basic decisions in relation to the process and continuity of assigned tasks, the level of education is varied. Just under a third has a university degree. One-fifth has completed secondary school and another fifth have graduated from an institute. One in ten has finished only the intermediary level. A small minority of three percent only finished the elementary level and the rest are still studying at school or university.
Across the country, a high level of education correlates with being in paid employment rather than working independently. The data for the 15 to 34 age group shown below confirms this. It also illustrates that formal employees are generally more educated than informal ones.
Illiterate4% Pre-school and
read and write2%
Elementary23%
Intermediate26%
Secondary18%
University25%
Inapplicable2%
Distribution of Labor Force by Educational Attainment

Labor Market and Youth Capacity Assessment 19
Source: World Bank, 2010 Employer-Employee Survey
Employment status
Wage employment versus self-employment
Among the local workforce, the interest in entrepreneurship is very high. The World Bank found a large preference for self-employment, especially among men and skilled individuals. The reasons for the preference of self ‐employment to wage employment are greater independence, as well as higher earnings and more flexible working hours.
For those who prefer wage employment to self-employment, it is mainly because of greater job security. As shown below, wage employment is slightly more common than self-employment or being an employer. Over one in three workers is self-employed, most in low-skill activities.
0%
10%
20%
30%
40%
50%
60%
70%
80%
90%
100%
Formal Employees Informal Employees Self-Employed
0.3% 1% 3%13%
28%
47%27%
32%
32%58%
37%
15%
Distribution of the 15 to 34 Age Group by Type of Employment and Level of Education
No FormalEducation
Primary Secondary Tertiary
Labor Market and Youth Capacity Assessment 20
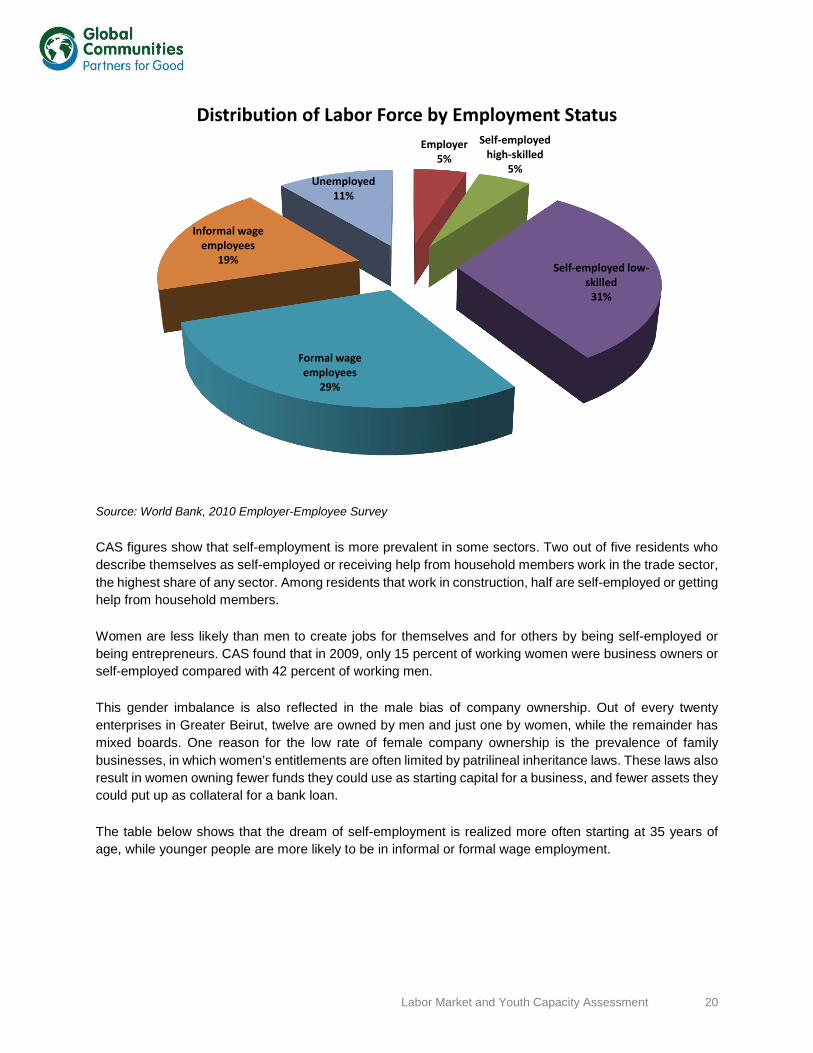
Source: World Bank, 2010 Employer-Employee Survey
CAS figures show that self-employment is more prevalent in some sectors. Two out of five residents who describe themselves as self-employed or receiving help from household members work in the trade sector, the highest share of any sector. Among residents that work in construction, half are self-employed or getting help from household members.
Women are less likely than men to create jobs for themselves and for others by being self-employed or being entrepreneurs. CAS found that in 2009, only 15 percent of working women were business owners or self-employed compared with 42 percent of working men.
This gender imbalance is also reflected in the male bias of company ownership. Out of every twenty enterprises in Greater Beirut, twelve are owned by men and just one by women, while the remainder has mixed boards. One reason for the low rate of female company ownership is the prevalence of family businesses, in which women’s entitlements are often limited by patrilineal inheritance laws. These laws also result in women owning fewer funds they could use as starting capital for a business, and fewer assets they could put up as collateral for a bank loan.
The table below shows that the dream of self-employment is realized more often starting at 35 years of age, while younger people are more likely to be in informal or formal wage employment.
Employer5%
Self-employed high-skilled
5%
Self-employed low-skilled
31%
Formal wage employees
29%
Informal wage employees
19%
Unemployed11%
Distribution of Labor Force by Employment Status

Labor Market and Youth Capacity Assessment 21
Table 3. Employment Status Distribution by Age Group Age Formal employee Informal employee Self-employed
15 to 34 60% 68% 34% 35+ 40% 32% 66%
Total 100% 100% 100% Source: World Bank, 2010 Employer-Employee Survey
Formal versus informal employment
Informality, which can be defined as the collection of firms, workers, and activities that operate outside the legal and regulatory framework, is also an issue. The World Bank found in 2010 that formal wage employment is preferred to informal wage employment, mainly for the higher wage, as well as access to social security and job stability. Still, 19 percent of workers are informal wage employees, compared to 29 percent of formal wage employees. Overall, half of the workers are in the informal sector, either as wage employees or self ‐employed. Informal employment is common not only at the worker level, but also the establishment level. In a survey carried out in 2008, InfoPro found that undeclared enterprises employ one in four workers in Greater Beirut. This results in situations where many workers operate without written contracts or social coverage and in settings that very often do not meet the minimum standards. Such conditions do not attract qualified workers and increase the gap between labor supply and demand.
Worker mobility It is quite difficult to move from one employment status to another. Worker mobility between wage employment and self-employment and between formal and informal activity is low. These dynamics challenge the current social insurance system and labor regulations, which are providing incentives to work outside the formal sector.
However, worker mobility is high between different types of occupations and sectors. A 2008 survey by InfoPro found that three-quarters of workers in the Greater Beirut area have been previously employed in a sector other than the one in which they are currently employed. Judging from the intentions expressed by employees at the time, this trend will continue. Nationwide, a third of employed graduates or those with a vocational degree planned to change their current occupation. Although this flexibility has the advantage of workers entering growing sectors where jobs become available, it also results in many people working outside their field of expertise.
Mobility across occupations is hampered by gender and nationality segregation. Women and men cannot simply move into any occupation available because of gender stereotyping of certain kinds of jobs. Mobility is also limited by the relatively low employee turnover. Workers are generally reluctant to leave their jobs and employers are even more reluctant to fire them. Because of the country’s compact geography, the majority of workers do not change their residence if they change their workplace, except if they leave the country for job opportunities abroad.
Women are less geographically mobile than men. Proximity to the home is a factor that affects the decision to take up work or to stay at the current job more for women than for men. In addition, there are more male

Labor Market and Youth Capacity Assessment 22
than female candidates for emigration. Foreign workers are even less mobile, both within the country and across sectors, because of legal constraints and employer biases.
Employment trends and wages in public and private sectors The private sector is the main employer in the country. Among wage employees, 87 percent work for the private sector, while 12 percent work for the state and one percent are employed by other entities including non-governmental organizations (NGOs), international agencies, and political parties. As of 2013, there were about 230,000 civil servants and public school teachers which represented about 16 percent of the labor force.
Employment trends
Gender segregation
There is strong evidence of gender segregation in labor. The Greater Beirut Labor Market Survey InfoPro carried out in 2008 showed that a third of the companies in Greater Beirut indicate hiring preferences in terms of gender. This is mostly for job specification reasons: Companies requiring manual laborers, technicians, and drivers show a marked preference for male workers, while companies requiring secretaries and nurses favor female workers. The tendency towards company employee selection by gender is reflected in job advertisements in which for certain kinds of jobs, employers often explicitly specify gender. Gender was mentioned in two-third of listings analyzed for this assessment. Signs of gender segregation in the workplace are particularly striking in certain professions. For example, there are relatively few women who work as engineers or press photographers, or in fishing, or the army. On the other hand, women are overrepresented among office employees and in teaching, especially in primary education. Syrian women make up the bulk of unskilled labor in Lebanon’s agriculture sector – up to 75% based on interviews. In the medical field, gender also plays a role in the type of occupation. Four out of five nurses are women, but less than a third of doctors and dentists are female.
Private versus public sector employment
In the youth focus groups, opinions were split over whether jobs in the public sector are better than those in the private sector. Those who prefer the private sector noted that for public sector jobs, connections are even more important than in the private sector, although a certain level of capacity is a prerequisite for passing the government tests. The job application process tends to be more drawn out in the public sector as government agencies often take a long time to get back to applicants.
Public sector salaries are also lower, and the possibilities for promotion are fewer in certain areas such as IT. Private companies can provide more possibilities for personal improvement because they offer training and allow employees to gain more experience. However, some focus group participants prefer the public sector because it is more stable and offers greater job security. In addition, government positions provide social insurance, family allowances, and education subsidies for the employee’s children, and working hours are shorter.
Wages National wages are characterized by low wage disparity among employees in both the private and the public sector. In the private sector, on average, managers earn only about three times more than unskilled workers. In the public sector, the entry-level salary of a first class civil servant is only about four times that of a fifth-class civil servant. The minimum wage and civil servant salary scale are not indexed to inflation,

Labor Market and Youth Capacity Assessment 23
which makes a periodic re-negotiation of these reference values necessary. The renegotiations regularly lead to conflict between labor and business syndicates and the state, marked by costly strikes and sit-ins.
The low wage disparity is closely linked to a low skill premium. The undervaluing of human capital in the labor market reflects low levels of productive investments in sectors that demand skilled labor, especially the service sector. This leads to high rates of unemployment among skilled workers, and contributes to their emigration.
Private sector wages
By a government decision of September 10, 2008, the minimum wage was raised from $200 to $333, plus a further $133 non-taxable supplement on all salaries up to $1,000, to be paid retroactively as of May 2008. Furthermore, it was decided that retirees will receive an additional $100 with their monthly pension checks, while the daily transportation allowance for both private and public sector workers was raised from LL6,000 ($4) to LL8,000 ($5.33). The minimum wage was increased again on 1 February 2012, when the minimum monthly salary was set at LL 675,000 ($450) and the minimum daily wage at LL 30,000 ($20). Since the minimum wage is not indexed to inflation, it does not systematically increase in proportion to changes in the costs of living. In time, the value of the new minimum wage will therefore be eroded by inflation.
The median earnings of the 15 to 34 age group shown below indicate that self-employment can be more lucrative than formal wage employment, except at a high level of education. Informal wage employment has the lowest remuneration. The chart also illustrates the relatively small income differences between the different levels of education.
Source: World Bank, 2010 Employer-Employee Survey
The average salaries in each sector by job position and years of experience are shown in Tables 110 to 120 in the Appendix. Capital-intensive industries tend to have higher salary levels and skill premiums than
$0
$100
$200
$300
$400
$500
$600
$700
$800
$900
$1,000
No FormalEducation
Primary Secondary Tertiary
$700
$600 $633
$733
$350
$467 $433
$533
$1,000
$667
$800
$667
Median Earnings of 15 to 34 Age Group by Level of Education (USD per month)
Formal Employees Informal Employees Self-Employed

Labor Market and Youth Capacity Assessment 24
the labor-intensive industries. More generally, the sectors counting fewer workers, such as construction and manufacturing, have higher average wage levels than the sectors employing large numbers of people, such as trade and above all services.
Salaries tend to be highest in the construction sector, at least at the top of the corporate ladder. Construction professionals and managers have the best salaries of all the sectors. The relatively small number of companies in this sector provides a reason as to why its executives are rewarded the most.
Even though the service sector is the most unionized of all the sectors, its wages are not higher as a result. Within the services segment, salaries in banking and IT tend to be above those in hospitality, travel, and tourism.
In trade, wages are also relatively low compared to manufacturing and construction, but unskilled labor is rewarded more than in the other sectors. Although this sector also has a relatively high proportion of skilled employees, it pays the lowest wages to skilled workers among the various industries. The small company size accounts for the low wage disparity in comparison to the other sectors.
Although training enhances an individual’s skills, this is usually not rewarded with a raise by companies, perhaps because most of the training is done at company instigation and expense. Salaries tend not to be affected by training undertaken by workers.
Experience, however, has a big impact on salary in all sectors. For example, an architect or engineer with 20 years of experience earns four to five times the salary of a fresh graduate. Salary increases are highest when workers have between five and ten years of experience.
Wages and benefits are a thorny issue for employees and employers. Employees are the least content with their salaries and benefits compared to the other criteria of job satisfaction. Salaries are also an issue for the unemployed. In some cases, the salaries offered by prospective employers are so far below the expectations of job seekers that potential employees would rather not work. This is an indication that the reservation wage, or the lowest wage which someone will accept for a job, is above what some employers are offering.
For companies, salaries are also a major consideration after qualifications and skills, with approximately a third factoring them in when recruiting local workers. Companies indicate that it is common for new workers to ask for a higher salary than that being offered, and that this is an obstacle to recruitment, especially of professionals. Given the relatively high level of education expenditures in Lebanon, graduates tend to expect wages higher than those set by the market.
It does not help that many companies are not upfront with potential recruits about the salaries they offer. Salaries are very often not specified in job advertisements and are usually left to the end of employment contract negotiations. This obstacle, in conjunction with the informal matching process with its limited flow of information, can generate wage disparities among similar workers largely because of differences in their negotiating skills.
Public sector wages
Public sector wages are based on a salary scale in which the wage increases with employee tenure through a grade system. The number of grades depends on each position, some examples of which are shown below.

Labor Market and Youth Capacity Assessment 25
Table 4. Examples of Civil Servant Positions by Class
First Class Members of Civil Service or Central Inspection Boards
Second Class Senior Inspectors, Auditors, Engineers, Doctors, Pharmacists, Statisticians
Third Class Mid-level Inspectors, Auditors, Engineers, Doctors, Pharmacists, Statisticians
Fourth Class First or Second Degree Technicians
Fifth Class Administrative and Assistant Positions Source: Draft Law
The minimum and maximum wages by class are shown below. Like in the private system, there is low wage disparity among employees.
Source: Draft Law
Following several strikes and demonstrations in early 2013 by civil servants and teachers in both public and private schools, the Lebanese Government in March 2013 approved a salary scale adjustment for public sector employees. The new public sector wage scale, along with a suggested revenue package to finance its costs, was passed on to Parliament for review, and is still pending.
The Union Coordination Committee, which represents the interests of civil servants, argues that the adjustment is necessary to compensate for the loss in purchasing power of salaries since 1997. The Lebanese Government increased public sector salaries twice since 1997. In 2008 there was a lump-sum adjustment of LL 200,000 ($133), and in 2012 a new wage-hike decree increased salaries between LL 175,000 ($117) and LL 300,000 ($200). These increases were deemed insufficient by civil servants and
LBP 0
LBP 1,000,000
LBP 2,000,000
LBP 3,000,000
LBP 4,000,000
LBP 5,000,000
LBP 6,000,000
First Class Second Class Third Class Fourth Class - FirstDegree
Fourth Class -Second Degree
Fifth Class
LBP 3,000,000
LBP 1,485,000 LBP 1,300,000
LBP 960,000 LBP 845,000 LBP 750,000
LBP 5,205,000
LBP 2,984,000
LBP 2,384,000
LBP 1,744,000 LBP 1,529,000
LBP 1,380,000
Public Sector Wage Scale by Class
Minimum Maximum

Labor Market and Youth Capacity Assessment 26
their representatives, as inflation has exceeded 100 percent since 1997, diminishing the real value of salaries and pensions. In fact, the share of wages in GDP has declined to a mere 22 percent, down from almost 60 percent in the seventies.
Recruitment and job search methods The employer-employee matching process is very informal. Word-of-mouth through social or political connections is the most common method, especially for small companies, informal employment, and unskilled jobseekers.
Recruitment methods
The most common method of recruitment of local workers is through word-of-mouth, followed by CVs received from job applicants and advertisements placed in magazines and newspapers. A small minority of companies hiring locals do so through private institutions, such as recruitment agencies and websites. In its 2008 Greater Beirut Labor Market Demand Survey, InfoPro found that only one in ten companies had heard of public recruitment agencies, namely the National Employment Office (NEO). The informal recruitment process reflects the relationship-oriented corporate system, characterized by the prevalence of family businesses and low corporate ownership dispersion. The sophistication of recruitment policies depends on the types of skills demanded and the profitability of the firm. Small firms, presumably involved in low productivity activities, pay little attention to hiring the right worker. These firms are the most numerous and employ the bulk of workers, so their recruitment methods are representative of the private sector. Medium-sized firms do consider individuals characteristics, including whether the applicant has the right technical skills, and the quality of the diploma. Unfortunately, only a few have a dedicated human resources department or are able to afford the services of private providers. Large firms normally have an in‐house HR and are able to recruit the best candidates on the basis of their education credentials.

Labor Market and Youth Capacity Assessment 27
Source: InfoPro Greater Beirut Labor Market Demand Survey 2008
Recruitment agencies are usually solicited by companies to find personnel at the management or professional level. Companies ask for candidates with university diplomas rather than technical or vocational certificates. Recruitment firms interviewed for this assessment were asked to indicate the sectors that use their services the most. These are shown in the table below. Hospitality, which is a sector with high labor demand and high turnover, is notably absent from the list. The reason is that employers in this sector rely mostly on word of mouth and listings in newspaper, or recruitment websites.
Table 5. Sectors that Use the Services of Recruitment Agencies the Most FMCG and FMCG Distribution
Retail Technology and IT
Insurance Contracting
Services such as Secure Parking Industrial Plants
Construction Telecommunication
Legal Services Architecture Car Industry
Source: InfoPro interviews with four recruitment agencies
0%
5%
10%
15%
20%
25%
30%
35%
40%
45%
50%
Word of Mouth Receiving CVs AdvertisementPlacement
Other Sources Private Institutions
46%
37% 36%
11%8%
Methods Used to Recruit Local Labor

Labor Market and Youth Capacity Assessment 28
Job search methods
For job seekers, personal contacts remain the most prevalent mechanism to find a job. More than three-quarters of workers rely on word-of-mouth when looking for a job. Advertisements and recruitment firms play a minor role, and the National Employment Office is unknown. However, the matching process becomes more formal with increasing skill level.
Source: InfoPro Greater Beirut Labor Market Demand Survey 2008
A 2013 survey by the Lebanese Center for Policy Studies with 300 students from selected private and public universities and vocational training and education institutions revealed that 55 percent of students use social connections to find jobs topping other means such as job advertisements, employment offices, and job fairs. This shows the importance of family and clan ties in the employment search. Those students whose families have a higher income were found to be even more likely to resort to social connections.
In addition, at least a fifth of surveyed students said that they resort to political connections, and 73 percent thought that political connections are important to find jobs. Unlike their counterparts who use social connections, those who resort to political connections are not as well off, but they have larger families and their fathers are more politically active.
Participants in the youth focus groups think that the best means to find a job is through friends and connections, as well as teachers and mentors. Another tool that was mentioned frequently was the Internet, especially credible websites such as Al Waseet and bayt.com. Al Waseet is also being consulted in printed form, as are other newspapers. Sending a CV to companies or passing by personally is another job search method.
0%
10%
20%
30%
40%
50%
60%
70%
80%
90%
Unskilled Semi-Skilled Skilled Managerial Professional
84%80% 78%
74%70%
18% 18%24%
27%
40%
18%24% 22%
17%
27%
1% 3% 4%8%
4%
Job Search Methods Used by Employees - by Skill Level -
Word of mouth Posting CVs in place of interest Recruitment advertisement Private agencies

Labor Market and Youth Capacity Assessment 29
This system creates distortion in the labor market since social, political and sectarian connections trump skills and merit. It prevents companies from finding the best qualified people; it prevents jobseekers from finding the most suitable job; and it reduces employee turnover and worker mobility.
Aspects of youth employment For youth that participated in the focus groups, getting a job is important primarily for financial reasons due to the high cost of living. It allows them to become financially independent from their parents, or at least provides some extra income. Some people in the focus group need to work to finance their studies, which they hope will lead them to a better job later on. Others are looking for employment because one salary is insufficient to support a family, even one with only one child. Youth who do not have their own income because they are not working usually live off their savings, their parents, or their husband.
Non-financial reasons also have a role to play. Getting a job can be important to gain experience, or as an orientation for a higher education. It can be a step on the way to realize personal aspirations such as self-employment, or just a way to get out of the home.
Youth in wage employment Recruiters specified that many young people between 18 and 21 get indoor sales and hospitality jobs because the hours are more flexible and compatible with their studies. This was echoed by some participants of youth focus groups who said they prefer part-time administrative, sales or restaurant service jobs in order to have time for their freelance work, their studies or their family. Others wanted a full-time job, especially men, in the area of IT for example. Recruiters’ assessment of the types of jobs, sectors and salary range which are typical for employed youth are shown in the table below.
Table 6. Profile of Employed Youth Criteria Age: 18 to 21 Age: 21 to 29
Educational level - BT or High School Graduate - BA/BS
- BS / TS / BA / MBA - Masters - Certifications
Types of jobs
- Indoor sales - Telesales - Waiter / Waitress - Assistant Warehouse Manager - Electrical or Mechanical Technician - Cashier - Delivery Boy - Assistant Accountant - Security (including CCTV) - Part time: data entry
- Advanced sales - Team Leader - Head Waiter / Bartender - Storekeeper - Engineer - Executive Secretary - Supervisor - Accountant - Assistant Manager - Manager
Sectors & sub-sectors
-Sales -Retail (fashion, malls, supermarkets) -Telesales / call center -Restaurants and Hotels -Industries -Contracting -Construction -Administration
-Retail -Hospitality -FMCG Distribution -Telecom -Banking
Salary range $500 to $1,000 $700 to $2,000 Source: InfoPro interviews with four recruitment agencies

Labor Market and Youth Capacity Assessment 30
The aspirations of some youth that were expressed in the focus groups are to pursue a career in a company setting. They aim for stable jobs that correspond to their level of education or their field of study. One participant said his plan was to be employed at a company, get promoted, become the company’s manager and maybe acquire an ownership stake later on.
Concerning opportunities for upward mobility, interviewed recruiters specified that young people starting out on their career have little chance to advance on the corporate ladder and increase their salary if they do not continue their education or training. A person who starts as a receptionist for example could make a maximum of USD 1,000 after six to eight years of service. Indoor sales people do have an opportunity to become a store manager, but this would take many years.
For people above 21, recruitment agencies often propose opportunities abroad. For those who stay, good companies tend to promote from within. It is less costly and more efficient, as those employees who are promoted are already familiar with the corporate culture. One recruiter mentioned that more than 70 percent of CVs he sees show that employees have been promoted internally in some way. This was confirmed by company interviews, which showed that internal staff promotion with additional training is the main coping method if no candidates with the right skills are available outside the company.
Youth in self-employment Self-employed youth are found primarily in trade, for example minimarkets, as well as service professions like barber, mechanic, and electronics repairman. Some diversify their scope of work in order to increase their chances of success. An example given by a recruitment agent would be a book shop situated next to a university that also offers photocopying and money transfer services, and rents out bicycles in the summer.
Like the work force in general, youth aspires to self-employment. It is the ambition of many focus group participants to open their own business. The types of businesses mentioned were graphic design, contracting and construction, clothes retailing, beauty salon, and a carwash. One person said he plans to be employed for a few years to gain stability and then open his own business. Another wants to be a public sector employee and open his own company at the same time.
One interviewed MFI executive pointed out that there is a difference between someone who is self-employed and an entrepreneur. A self-employed person succeeds in a project, whereas an entrepreneur enlarges the project, because he is more innovative and has more vision.
Youth entrepreneurs are few, because of the issues facing startups. The risk of startups is very high, and banks and MFI are hesitant to give them loans if the person in charge is not very confident or does not have enough experience in management. In Lebanon, there are not enough angel investors, which help entrepreneurs to take their idea from initiation through incubation to the launching of the company. MFIs noted that there are several organizations that work with youth and startups. Berytech and the Chambers of Commerce, especially in the North, have good projects and initiatives, but more is needed to help stimulate the young people’s capacity for innovation.
There are also activities and competitions at schools and universities, for example in ICT or renewable energy, but these are not given much attention. One MFI interviewee mentioned that at an exhibition and seminar in Saida, he saw some youths who had created phone applications for car rentals and transportation, and were making more money than their fathers. Another example is a youth competition

Labor Market and Youth Capacity Assessment 31
for an online clinic. As these examples show, the entrepreneurial areas were youth are engaged the most are technology, telecommunications and IT. An advantage is that the required capital base is usually small, and ideas are easily sellable.
Unemployment According to World Bank estimates, the unemployment rate in Lebanon increased from of 11 to 20 percent during the course of 2014. While other estimates from the Ministry of Labor put this at closer to 25 percent, with youth unemployment estimated to be at 36 percent. An additional 220,000 to 324,000 Lebanese, primarily women and unskilled youths, will be put out of work due to the impact of the Syrian crisis. Unemployment and competition for jobs is considered among the greatest sources of tension between Lebanese and Syrian youth.
CAS data shows that half of the unemployed are below the age of 24. This was confirmed by recruitment agencies interviewed, which indicated that the unemployed job seekers they receive are mostly 21 to 22 years old. Youth often implies a lack of experience and an incomplete skill set. These are factors that make young people less employable, and, together with a scarcity of traineeships and other entry-level opportunities in the various sectors, explain why they are most affected by unemployment.
Some participants of youth focus groups held were never employed because they are still studying or they are housewives. However, the majority of participants are unemployed because they quit their jobs. In some cases it was to focus more on their studies or to start their own business or freelancing. In others, employees resigned due to disagreements with management. However, the main reason for quitting was that the working conditions were too difficult, the hours too long, and the salary too low. Some people were let go from their jobs because the company closed, or the employer decided to hire a contractor instead of the employee, or because of personal conflicts among employees. One person was fired when he asked to be included in NSSF.
As shown in the chart below, women tend to have high unemployment rates. Many leave employment for childbearing and then start searching for a job again. All four recruitment agencies interviewed confirmed that the majority of unemployed are women, and that many have a family. Moreover, the number of female job seekers is increasing. One agent noted that women might be less employable in that they have different criteria for a job than males. They focus more on the work environment and might not be able to work very late. In addition, males can emigrate more easily, leaving a relatively higher number of females in the pool of the unemployed.

Labor Market and Youth Capacity Assessment 32
Working age population aged between 15 and 64 Source: CAS 2009 According to CAS, 37 percent of the unemployed are university graduates. Recruitments firms attest to this as many of the job seekers they try to place are fresh graduates. Indeed, as educational attainment increases, the entry rate into unemployment goes up, along with the unemployment rate.
Unemployment duration Education, however, shortens the duration of unemployment. Skilled workers seem to be better able to find jobs, because they are better prepared for the search process, or because their skills are in higher demand. They might also be more willing to move jobs and more likely to afford to search for jobs. This can explain why the rate of entry into unemployment is higher, but at the same time this unemployment tends to be only transitional.
Table 7. Average Duration of Unemployment among First-Time Jobseekers (Months)
Gender Male 13.0 Female 10.8
Education
No Formal Education 15.8 Primary 13.2
Secondary 12.9 Tertiary 10.1
Age Bracket 15 to 24 10.2 25 to 34 8.0 35 to 44 19.2
Source: World Bank, 2010 Employer-Employee Survey
0%
5%
10%
15%
20%
25%
30%
35%
15 - 19 20 - 24 25 - 29 30 - 34 35 - 39 40 - 44 45 - 49 50 - 54 55 - 59 60 - 64
30%
21%
13%
7%6%
5% 4%
0% 0%1%
17%
13%
7%
4%2% 1% 2% 2% 2%
4%
Unemployment Rates by Age and Gender
Female Male

Labor Market and Youth Capacity Assessment 33
Among focus group participants, the length of unemployment varied widely. Most have been unemployed for a few months only, but some have been looking for a job for six months to one year, and in one case two years. This more or less corresponds to the ten-month average for first-time jobseekers in the 15 to 24 age bracket in the above table.
The managers at technical and vocational institutes (TVI) and learning centers (LC) interviewed painted a more hopeful picture. Some indicated that their trainees can find jobs immediately after graduation; most others, that it takes about two to three months.
Table 8. Time it Takes Graduates of TVIs and LCs to Find a Job Type Name Time it takes graduates to find a job in their specialization TVI Institut de Tourisme 4 to 5 months TVI CIS College around 3 months TVI TLC 2 months TVI Technical Hotel School immediately TVI CIT 2 to 3 months TVI Institut Technique Kafaat around 6 to 8 months LC Makhzoumi Foundation immediately or up to 2 or 3 months LC New Horizons 1 month
Public institutes are highlighted Source: TVI and LC Interviews Interviewed recruitment agencies revealed that the unemployment of the candidates they are receiving has usually lasted for six months, up to a maximum of one year. This relatively long period is probably due to the fact that recruitment agencies are often not the first contact for jobseekers, and are only used when other methods have failed.

Labor Market and Youth Capacity Assessment 34
Migration and its effect on the labor market Emigration Emigration of Lebanese nationals continues at a pace of about 37,000 people every year as estimated by ESCWA for the 2005 to 2010 period. The Central Administration of Statistics (CAS) reports that in 2009, about six percent of the Lebanese households had a least one person directly linked to the head of the household who had emigrated between 2004 and 2009. Traditionally, the main destination countries of Lebanese emigrants are the United States, Canada, Australia, Germany, Saudi Arabia, France, Sweden, and Brazil. Estimates of the number of Lebanese abroad range from 11 to over 15 million people, which is far more than the internal population of Lebanon itself.
The economic expert interviewed noted that educated youth tend to travel and work abroad due to the economic situation that leaves them with low expectations of their country. The Syrian crisis is also have an impact on emigration as the Lebanese economy has suffered as a result of the conflict, increasing unemployment in general, but especially amongst youth. Lebanese youth feel that they have few options with no end in sight to the conflict, and emigration seems like the best option. According to the World Bank, about 42 percent of youth aged 15 to 24 with secondary or tertiary education have been thinking about emigrating. One MFI manager indicated that both the university and the vocational education systems are export-oriented. The majority of young graduates are going abroad as a first choice instead of starting up a small business in Lebanon.
Finding a job is the main driver of emigration, and it might be gaining in importance. A recruitment agent consulted noted that the scope of his company's work has shifted over the last year. He is currently placing 10 percent of candidates locally and 90 percent abroad, while in 2014 the ratio was 50-50. People planning emigration are among the larger segments of candidates interviewed by recruitment agencies. However, another recruiter remarked that it is a dynamic process: some people leave while others return. Fresh graduates like to emigrate, but older people are coming back, specifically those who recently started a family.
Effects of emigration on the labor market
The high rate of youth and skilled emigration leads to large brain drain losses that are not offset by the benefits, which are mainly remittances. This is affecting the level of local labor skills. A recruitment agent interviewed observed that recruitment agencies will pick the top 20 percent of skilled workers to send abroad. As a result, high performers emigrate and low performers stay in the country, taking the jobs formerly held by the more talented workers. Managers at the Makhzoumi Foundation LC concurred that the people with the best skills are going abroad. Another recruitment agent noted that a positive aspect of emigration is reducing local unemployment. As fewer jobs are available due to economic stagnation, it is an advantage to have access to additional labor markets, for example in other Arab Countries.
Steps to be taken
In order to check the loss of the best and brightest elements of the national workforce, recruiters say that an improvement in the economy and an increase in investment are necessary in order to create new jobs. The labor market has to be organized more rationally in terms of the salary levels (by increasing the minimum wage), the specialization of jobs, and the professional environment. Concerning the latter, the influence of connections and religious affiliations on the workplace has to be curbed. Recruiters believe that

Labor Market and Youth Capacity Assessment 35
in order to stay, job seekers need to feel that the local market offers them a proper career path and possibilities for advancement.
Young people considering leaving also have to have access to complete information about their choice. The majority of jobseekers looking to emigrate need to correct their perception and understand that working abroad is not necessarily better. In Dubai for example, employers no longer cover the rent or offer a full package. Universities and recruitment agencies can play a role in increasing awareness about working conditions in foreign countries.
One recruiter said that his agency brings suitable candidates back to Lebanon, so recruiters have a positive role to play in reversing emigration. One agent suggested that to limit emigration, the government needs to limit immigration, which is discussed below.
Syrian Crisis ESCWA estimates that the growth rate of the population in Lebanon was 1.7 percent over the period of 2005 to 2010. Following that, due to the Syrian refugee crisis, Lebanon saw a population increase of almost 40 percent, bringing the total resident population to about 5.9 million in 2015.
The war and resulting wave of refugees cut Lebanon’s real GDP growth by 2.85 percent a year between 2012 and 2014, and widened the national deficit by USD 2.6 billion, according to World Bank estimates. This is mainly due to the cost of shelter and electricity that is provided to the refugees. According to economic consultant Dr. Marwan Iskandar, the fiscal deficit increased by at least 20 percent and sovereign debt by 10 percent due to the Syrian crisis.
The spillover of the war in Syria has had direct and indirect effects on Lebanon’s economy. The deteriorating security situation has obliged the government to increase the number of security forces by 15,000 agents to maintain national security, at a total cost of at least USD 18 million, excluding their transportation and equipment. The influx of refugees have exacerbated the already difficult living conditions of hosting communities through increasing job competition, reducing wages, inflating prices, and placing additional demands on available infrastructure and services.
The Lebanese government has spent over USD 1.4 billion in response to increasing demand for public services such as water, electricity and healthcare. The presence of refugees has put pressure on these services which were weak even before the crisis, especially in the North, the Bekaa, the South and the Palestinian refugee camps, where many of the Syrian refugees have settled. According Lebanon Crisis Response Plan 2015 – 2016 Year 2 (LCRP) 87 percent of refugees and 67 percent of vulnerable Lebanese are living in 251 poorest communities in Lebanon. Local residents and refugees are competing for dwindling resources, and this is increasing tensions. One local NGO interviewed stated that they could no longer hire Syrians to work in their agro-food production facility because it raised tensions within the community they served, despite hiring them prior to the conflict.
According to the LCRP, the dramatic increase of poor is reshaping Lebanon’s fluid socioeconomic dynamics in significant ways. The overall poverty of Lebanese has increased from 28 percent to 32 percent. Long-standing economic inequalities are becoming deeper and more widespread, affecting the social fabric of the country. In the current environment, economic growth is as important as security and politics to Lebanon’s overall stability. The volume of exports has decreased substantially due to the face that Lebanon’s only land route crosses Syria, and export by sea or air are much more expensive.

Labor Market and Youth Capacity Assessment 36
A joint UN, World Bank and government report of June 2014 said by the end of 2014, the country will lose USD 7.5 billion from the interruption of trade and tourism, a fall in investment, the strain on public services and a decline in government revenues. The negative economic effects are felt in particular in the services sector, which is highly vulnerable to political and security risks.
Effects of the Syrian crisis on employment
The sudden surge in population has increased the demand for jobs. Refugees are increasing the labor supply by between 30 and 50 percent. The World Bank estimates that the unemployment rate has doubled to over 20 percent, and that approximately 170,000 Lebanese have been pushed into poverty since the onset of the crisis.
Syrian workers are mostly unskilled workers with low educational attainment and high willingness to work under difficult conditions. This threatens the Lebanese workers, mainly in the construction and agriculture sectors, but also in the services sector, for example in gas stations, dry cleaning, car repair as well as restaurants. Although historically Syrians have provided the bulk of unskilled labor in both the agriculture and construction sectors, now with such high levels of unemployment (51 percent) among unskilled Lebanese households there is a feeling of competition for jobs, whereas prior to the crisis this sentiment would have been different. According to a recruitment agent, the high demand for local labor in the hospitality sector that prevailed from 2011 to 2013 decreased in 2014 as sales turnover declined and immigrants started taking the jobs of the Lebanese. As a result, the level of service, for example in restaurants, has dropped drastically.
A few participants in the youth focus groups felt that companies prefer hiring Syrians, because they do not have to be registered with the NSSF, and accept lower salaries and longer working hours. Dr. Iskandar confirms this perception, but specifies that this situation affects unskilled or semi-skilled workers more than skilled or university-educated youth. Data gathered from companies in the agro-alimentary and beverages, hospitality, and building and construction sectors also shows that there has been no major switch from Lebanese to foreign workers over the past year. When these companies employ foreigners, it is usually for the accomplishment of menial tasks. This was already the case before the Syrian refugees started arriving.
In the low-skilled segment of the national labor market, the sudden increase in the labor supply and the availability of cheap Syrian labor explains the decline in wages and the strain on jobs, which is translated into more limited job opportunities for Lebanese nationals. According to the Food and Agriculture Organization (FAO), the increase in the number of Syrian workers caused a reduction of 60 percent in daily wages. It also contributed to a higher demand for informal workers. According to the International Labour Organization (ILO), almost all of the Syrian workers are employed in unprotected and potentially exploitative conditions in the informal economy or as informal workers in formal enterprises. Many refugee children are working, typically in hazardous conditions in the agricultural and urban informal sector or in the street, peddling or begging.
Effects of the Syrian crisis on self-employment
Opportunities to find cheap merchandise from Syria and selling it in Lebanon no longer exist. Many industries in Syria closed down and trade routes have been interrupted. The reduction of trade has affected Lebanese micro-enterprises since their access to a nearby and cheap source of goods has been limited.
In addition, a number of local businesses have been priced out of the market by Syrian-owned businesses that sell goods, mostly smuggled from the borders, at lower prices. It is estimated that hundreds of small businesses, including restaurants, retail shops, bakeries, mechanical repairs and others, have been

Labor Market and Youth Capacity Assessment 37
established in the Bekaa and the North by Syrians since the beginning of the crisis. Many Lebanese have concerns regarding competition at the self-employment level, especially in handicraft and semi-skilled jobs such as carpentry, welding, mechanics and repairmen, among whom some Syrians have better skills and provide cheaper services than the Lebanese.
From the point of view of entrepreneurs, the news is not all bad. Although Lebanon’s shrinking economy initially caused around 800 factories and businesses to shut down or leave the country, businesses are now staying because of the availability of cheap Syrian labor, which lowers operating costs. In addition, industrial license data shows that Syrian entrepreneurs have started opening companies and factories in Lebanon, shifting their businesses and assets out of their war-torn country. The competition due to the influx of Syrian entrepreneurs opening their own businesses in Lebanon is not unhealthy, according to an MFI manager interviewed. The new activities can provide an impetus to the local economy. Banks are also seeing more activity as some Syrian businessmen have taken up loans and deposited funds.
Steps to be taken
The government has begun taking measures to curb the entry of Syrian nationals to the country. General Security issued new regulations concerning residency renewal for Syrian nationals that differentiate between UNHCR-registrants and non-registrants. The difference between the two is that registered refugees have to sign a pledge stating that they will not work in Lebanon. Fees for both categories are set at $200.
The government has to improve transparency and strive for a better cooperation with friendly nations and international organizations in order to get more international aid. The European Union is providing aid, but their officials complain that their Lebanese counterparts are not efficient. On the other hand, Lebanon has many national NGOs that carry the humanitarian side and do their best to provide lodging and education to refugees. The government also needs to consider longer term measures. The expert is worried that the crisis, which is now in its fifth year, could last for over ten years, profoundly changing the structure of the Lebanese population. He believes that even if the crisis comes to an end sooner, only about 60 percent of refugees will return to Syria due to its fragmentation along sectarian lines. He pointed out the need to encourage and support the education of Syrians in Lebanon in order to maintain stability.
Vocational and technical education system
Education system overview Lebanon’s technical and vocational education sector has expanded over the years to involve an increasing number of students. The sector is supervised by the Directorate General of Technical and Vocational Education (DGTVE), which reports to the Ministry of Education and Higher Education (MEHE). Vocational and technical education is being offered by both public and private institutions. The sector comprises two separate areas, vocational training and technical education. It is divided into six official programs, including industrial and para-technical specializations, which are derived from the French system. In vocational education, there are three different branches leading to the following three certificates:
• Vocational Training Certificate (Certificat d’Aptitude Professionnel – CAP) • Vocational Certificate (Brevet Professionnel – BP) • Advanced Vocational Training (Formation Professionnelle de Maîtrise - FPM).

Labor Market and Youth Capacity Assessment 38
Vocational training is related to manual trades where technological development does not implicate extensive general knowledge. In technical education, there are three different branches which can lead to the following three certificates:
• Technical Baccalaureate Diploma (Baccalauréat Technique – BT) • Higher Technicians’ Certificate (Diplôme de Technicien Supérieur – TS) • Technical Diploma (Licence Technique – LT).
Technical education is related to trades, which require superior scientific and technological skills, and hence necessitates a broader general education.
Vocational and technical programs
General program overview
Training centers such as CIS offer training for BP certificates, technical schools such as the Institut Technique Kafaat prepare students for FPM and BT certificates, and technical colleges like TLC have programs for the TS and LT certificates. The majority of schools offer the BT or TS program, and few offer the complete range. The official vocational programs are:
1. Vocational Training Certificate (Certificat d’Aptitude Professionnel – CAP): A two-year cycle. Students start at age 12, without necessarily having any official degree. It is a program to train semi-skilled worker. Nine specializations are available:

Labor Market and Youth Capacity Assessment 39
- Plumbing - Office works - Assistant tailor - Carpenter - Electrical worker - Restaurant services - Butcher - Technician - Printing technician
2. Vocational Certificate (Brevet Professionnel – BP): A two-year cycle. Students start at age 12,
having passed at least the elementary level. The program trains skilled workers. At the end of this cycle, students obtain an official certificate, equivalent to the Brevet, which is achieved at the end of ninth grade. A total of 22 specializations are available, assembled into nine categories:
- Social services and education - Office works - Mechanics - Electrical - Carpenter - Tailor - Health and aesthetics - Hospitality and restaurants - Printing
3. Advanced Vocational Training (Formation Professionnelle de Maîtrise - FPM): A dual system
which combines German and Lebanese programs in a three-year cycle. Students start at age 15 and need to be holders of a BP or a general Brevet. The program trains students to be workshop supervisors. They only study applied subjects and not theoretical ones, for which reason they cannot pursue a TS afterwards. At the end of this cycle, students obtain a new official certificate equivalent to the Baccalaureate. Ten specializations are available:
- Car mechanics - Industrial mechanics - Electrical - Informatics and accounting - Plumbing - Heating and air conditioning - Hospitality: Marketing - Hospitality: Management - Hospitality: Production - Interior design
4. Technical Baccalaureate Diploma (Baccalauréat Technique – BT): A three-year cycle.
Students start at age 15 and need to be holders of a BP or general Brevet. At the end of this cycle, students obtain an official BT certificate. The program trains students to hold entry-level executive positions and get enrolled in regular universities. A total of 31 specializations are available, assembled into 19 categories:

Labor Market and Youth Capacity Assessment 40
- Electrical - Mechanics - Electronic - Health services - Hospitality - Heating and air conditioning - Social services - Informatics, technology and accounting - Secretarial management and organizing - Fashion design - Construction and public works - Industrial chemistry - Elementary and preschool education - Aesthetics - Purchasing and trade affairs - Interior design - Music - Food production - Advertising arts
5. Higher Technicians’ Certificate (Diplôme de Technicien Supérieur – TS): A two-year cycle. Students start at age 18 and need to be holders of a BT or general baccalaureate degree. The program trains students to hold mid-level managerial positions in industrial firms. A total of 32 specializations are available, assembled into 17 categories:
- Electrical - Electronic - Health and laboratory services - Hospitality - Accounting - Mechanics - Heating and air conditioning - Optical equipment industry - Banking - Education services - Dental sciences - Interior design and arts - Fashion design - Radiographer - Industrial informatics - Construction and public works - Marketing, management and networking
6. Technical Diploma (Licence Technique – LT): A one-year cycle, considered equivalent to a
university curriculum and degree. Only TS students can pursue a LT degree. LT graduates with an average grade exceeding 12 out of 20 can switch to universities after matching their credits with the chosen faculty or specialization curriculum. Some 22 LT specializations are available, divided into 13 categories:

Labor Market and Youth Capacity Assessment 41
- Electronic - Health and medical lab services - Informatics management - Hospitality - Accounting - Surveyor - Mechanics - Banking - Education services - Interior design - Radiographer - Graphic and advertising arts - Marketing and management
Programs on offer at technical and vocational institutes and learning centers
The degrees offered at the technical and vocational institutes interviewed are more often technical rather than vocational, as can be seen in the table below. The complete list of programs is in the Appendix under Degrees and Programs Offered at Technical and Vocational Institutes (Tables 98 to 105). Most courses in the programs relate directly to the degree and there are few, if any, extracurricular courses. In this regard, the interviewee at CIS College explained that the students at CIS are not very committed, have low attendance and might have more problems than average students. Therefore, the college mainly focuses on preparing them for examinations, excluding most other activities.
Table 9. Types of Training and Degrees Available at Technical and Vocational Institutes
Name Vocational Training Technical Education Extracurricular Training
Institut de Tourisme N / A TS No
CIS College BP
Private Courses (Certificate)
BT TS LT
Sports Teams, Languages, Soft Skills and Workplace
Skills, Projects , Clubs (Art, Photography)
TLC N / A
BT TS LT
CST IATA
Microsoft (MCSE) Cambridge University
Certificates
Lectures on specific subjects (example: auditing)
General knowledge lectures (example: driving rules)
Languages
Technical Hotel School BP
BT TS LT
Lecture on Meat studies
IPNET N/A LT N / A
CIT BP
BT TS LT
Certificate CST
Mechanic Vehicles - Scanners Interior Architecture - Autocad
Electricity - Automation

Labor Market and Youth Capacity Assessment 42
PLC - Programming of Industrial machinery
Security Institut Technique Kafaat
BP FPM BT N / A
Public institutes are highlighted Source: TVI Interviews The three learning centers interviewed offer a large variety of IT, vocational, technical, language and soft skills courses. An overview is provided in Tables 106 to 108 in the Appendix. All three LCs also offer tailor-made courses for companies and organizations.
Table 10. Types of Training and Degrees Available at Learning Centers Name Technical and Vocational Training
Makhzoumi Foundation
• Around 20 majors in the areas of IT, electronics, languages, administration, accounting, banking, beauty and hairstyling
• Private Vocational Certificate accredited by Dekweneh Vocational Training and endorsed by the General Directorate of Technical and Vocational Training at the Ministry of Education
Formatech
• IT division: over 500 technical courses with international certification • Business and Management division: over 80 courses in soft skills
such as HR, leadership, customer engagement, finance, and social media, with Formatech certification
• Project and Processes division: 42 courses in project management, risk management and quality, with Formatech or international certification
New Horizons
• Business Skills and Project Management • Microsoft Office and Desktop Applications with international
certification • Microsoft and other technical training with international certification
Public institutes are highlighted Source: TVI Interviews
Vocational and technical students
Students by diploma and specialization
BT students represent around half of the total number of technical and vocational students, followed by TS with 19 percent and BP with 12 percent. The highest success rates are achieved in the CAP and BP certificates, while more advanced certificates have much lower graduation rates. In addition, students in technical education are underperforming compared to students in vocational education, with around half not passing their final exams. However, the rate of passing has increased in all programs since 2009.
Table 11. Technical and Vocational Students by Type of Program
Program Number of Students 1993-1994
Number of Students 2012-2013
Percent Growth
Percent of Graduates 2012-2013
CAP 773 333 -57% 95%

Labor Market and Youth Capacity Assessment 43
BP 1,737 10,870 526% 83% FPM 4,385 1,922 -56% 62% BT 18,488 44,546 141% 48% TS 5,557 17,171 209% 52% LT 406 2,175 436% 41% Special curricula* 13,305 13,211 -1% N/A Total 44,651 90,228 102%
*Includes 3 month and 1 year Certificates Source: Center for Educational Research and Development The decrease in the enrolment in the CAP validates the policy decision to discontinue this qualification following the broad education reform carried out by the MEHE starting in 1999 under the National Reform Strategy Framework. The number of students choosing the Vocational Certificate (BP) has grown rapidly, an indication that it is increasingly playing a role as a replacement for the CAP.
The BT remains by far the most important qualification at secondary school level. Due to the general inclination towards white-collar occupations, it is preferred to the BP and FPM, which focus on blue-collar manufacturing occupations. The white-collar preference also explains why the auditing and accounting section has the highest percentage of enrolled students in TS.
Table 12. Top 10 Specialties of TS Technical and Vocational Students in 2012-2013 Specialization Number of Students Percent of Total Auditing and Accounting 3,431 20% Nursing 2,689 16% Informatics 2,122 12% Preliminary and Elementary Education 1,486 9% Marketing and Management 1,042 6% Hospitality Management 884 5% Construction and Public Works 840 5% Medical Lab Sciences 609 4% Electronic 501 3% Electricity 418 3% Others 3,149 18% Total 17,171 100%
Source: Center for Educational Research and Development More than 120 specializations are available to technical and vocational students. The options offered to students have been largely enriched in the past two decades, including new programs and certificates.
Students by type of school
The number of vocational students has increased at a fast pace, especially in public schools. The proportion of vocational students among the entire student body is now ten percent, whereas it was five percent in 1993. As of 2012, technical and vocational students made up about a quarter of the total students enrolled in secondary education, according to the UNESCO Institute of Statistics. However, this ratio is still below the average of many emerging and developed countries.

Labor Market and Youth Capacity Assessment 44
Table 13. Distribution of Technical and Vocational Students by Type of School
Type of School 1993-1994 2012-2013
Percent Growth Number of Students
Percent of total
Number of Students
Percent of total
Public 9,350 21% 38,020 42% 306% Private 35,301 79% 52,208 58% 47% Total 44,651 100% 90,228 100% 102%
Includes 3 month and 1 year Certificates Source: Center for Educational Research and Development
Students by Mohafaza
The number of vocational students is growing in peripheral regions, and decreasing in Beirut. The rate of change for students is even stronger than what can be observed with the number of schools, which is detailed in the next section.
Table 14. Distribution of Technical and Vocational Students by Mohafaza
Mohafaza 1993-1994 2012-2013
Percent Growth Number of Students
Percent of total
Number of Students
Percent of total
Beirut 10,032 22% 4,865 5% -51% Mount Lebanon 21,947 49% 36,140 40% 64% North Lebanon 5,272 12% 20,276 22% 284% Bekaa 2,655 6% 10,853 12% 308% South Lebanon 4,745 11% 18,094 20% 281% Total 44,651 100% 90,228 100% 102%
Includes 3 month and 1 year Certificates Source: Center for Educational Research and Development
Students by gender
Because most majors in vocational programs are in traditionally male subjects, the proportion of males exceeds the proportion of females in vocational education. However, the number of female students exceeds that of male students in higher technical degrees such as the TS and LT certificates. The overall ratio has changed little over the last ten years: in the 2012/2013 academic year, females made up 44 percent of the total technical and vocational student body, compared to 41 percent in the 2003/2004 school year. The distribution of students in public and private vocational schools by degree and gender between 2003 and 2013 is Tables 94 and 95 in the Appendix.
Table 15. Distribution of Students in Technical and Vocational Schools by Gender and Degree 2003 to 2013
2003-2004 2012-2013 Male Female Total Male Female Total
CAP 1,231 66 1,297 298 35 333 BP 3,721 1,597 5,318 7,551 3,319 10,870 FPM 903 24 927 1,832 90 1,922 BT 23,076 17,624 40,700 25,135 19,429 44,564

Labor Market and Youth Capacity Assessment 45
TS 10,590 9,066 19,656 7,486 9,685 17,171 LT 1,557 699 2,256 1,037 1,138 2,175 LTE 57 21 78 n/a n/a n/a Total 41,135 29,097 70,232 43,339 33,696 77,035 Total including 3 month and 1 year Certificates 99,878 90,228
Source: Center for Educational Research and Development The above data also shows an increase in the number of students that obtain the various degrees but a decrease in the number of students that are getting shorter three-month and one year Certificates. The gender segregation by profession, which continues in the workplace, is also apparent in the gender profile of the clientele at the learning centers interviewed. Trainees are 70 percent male and 30 percent female at Formatech and New Horizons, which are mostly oriented towards IT and graphics, and 25 percent male and 75 percent female at Makhzoumi Foundation, which also offers courses for beauticians and secretaries.
Vocational and technical schools and learning centers
Schools by type
There has been a clear public policy to focus on vocational learning, and the total number of technical and vocational schools has increased by 61 percent over the last two decades. Between 2000 and 2010, the Council for Development and Reconstruction (CDR) signed contracts to build and equip 27 new technical and vocational public schools. Their construction was funded through loans granted by the AFESD, the IDB, the OPEC Fund and the Kuwaiti Fund. But although the number of public vocational schools has more than quadrupled in 20 years, the private sector is still dominant.
Table 16. Distribution of Technical and Vocational Schools by Type
Type of School
1993-1994 2013-2013 Percent Growth Number of
Schools Percent of
Total Number of Schools
Percent of Total
Public 29 11% 122 29% 93% Private 233 89% 300 71% 29% Total 262 100% 422 100% 61%
Source: Center for Educational Research and Development The largest private sector players in technical and vocational education (TVE) are the charitable and humanitarian NGOs who operate non-profit schools as social development activities. These NGOs are mostly community-based and have strong regional and religious ties. The NGOs have been the developers of this sector since the 1950s, even before the government stepped in with the creation of the Directorate General of Technical and Vocational Education (DGTVE). The most important institutions are the Al-Aamiliyah, the Al-Makassed, the Father Kortbawi Institution, and the Antonine Technical Schools. Several NGOs are working with the DGTVE to establish public-private partnerships to run TVE schools, mostly in the South and Bekaa regions.
The larger private for-profit technical and vocational schools are concentrated around the major cities and population centers and offer highly competitive education. Some belong to European or North American networks and provide internationally recognized degrees and certificates guaranteed by renowned quality control systems and credentials.

Labor Market and Youth Capacity Assessment 46
Schools by Mohafaza
Schools have expanded out from the central areas into other regions, and this trend is reflected in the geographic distribution of students.
Table 17. Distribution of Technical and Vocational Schools by Mohafaza
Mohafaza 1993-1994 2012-2013 Percent
Growth Number of Schools
Percent of Total
Number of Schools
Percent of Total
Beirut 56 21% 35 8% -38% Mount Lebanon 119 45% 171 41% 43% North 37 14% 101 24% 172% Bekaa 16 6% 46 11% 187% South 34 13% 69 16% 102% Total 262 100% 422 100% 61%
Source: Center for Educational Research and Development
Interviewed technical and vocational institutes and learning center
Of the interviewed technical and vocational institutes, three are public (highlighted in the tables below) and four are private, while all three learning centers are private.
Table 18. Technical and Vocational Institutes and Learning Centers by Type Type Name Number of Branches Locations TVI Institut de Tourisme 0 Dekwaneh
TVI CIS College 8 Hamra, Sodeco, Haret Hreik, Tohwit El Ghadir, Ouzai, Khaldeh, Saida, Sour
TVI TLC 0 Jdeidet El Metn TVI Technical Hotel School 0 Dekwaneh TVI IPNET 3 Tripoli, Bir Hassan, Maarakeh (South) TVI CIT 0 Dora TVI Institut Technique Kafaat 0 Ain Saade
LC Makhzoumi Foundation 4 Mazraa , Baalbak, Tripoli, Araamoun, Saida (with LAHA Association)
LC Formatech 2 Sodeco , Antelias
LC New Horizons 4 Downtown, Zalka, Zahle (Representative Office), Saida (Representative Office)
Public institutes are highlighted Source: TVI and LC Interviews Among the interviewed TVI’s, only CIS College, which already has eight branches, said it has expansion plans for the South and the North of the country. The learning centers have varied backgrounds. The Makhzoumi Foundation is a charitable NGO which apart from the learning center also has a microcredit program as well as a healthcare program, in addition to development projects. Formatech is a local company that is also active in Dubai and Iraq and aims to serve the Middle East and GCC countries. New Horizons is part of a U.S.-based network of training centers present in 70 countries.

Labor Market and Youth Capacity Assessment 47
School facilities and equipment at TVIs The interviewed TVIs appear to have the necessary facilities and equipment for effective teaching, although the private schools seem to be better endowed.
Table 19. Facilities and Equipment at Technical and Vocational Institutes Name Educational and/or auxiliary facilities Educational equipment and tools
Institut de Tourisme PC Room Electronic Active Board
CIS College
PC Room Art Theatre
Library Laboratory
Graphic Design Studio Interior Design Studio
LCD Projector Laptop / Desktop
Laboratory Equipment Software specific to each major
TLC
Electronic Laboratory PC Room
IT Laboratory Library
Beauty Salons Theatre Studios
LCD Projector Laptop / Desktop
Laboratory Equipment Tools specific to each major
Technical Hotel School
PC Room Library
Laboratory
LCD Projector Laptop / Desktop
Laboratory Equipment IPNET PC Room LCD Projector
CIT
PC Room Laboratory
Library Meeting Room / Theatre
LCD Projector Laptop / Desktop
Laboratory Equipment Kitchen
Bar
Institut Technique Kafaat
PC Room Theatre Library
Beauty Salon Hairdressing Salon
Electronic Active Board LCD Projector
Laptop/desktop Home Appliances
Public institutes are highlighted Source: TVI Interviews
Tuition fees at TVIs A comparison of TVI tuition fees shows that public institutions offer much cheaper tuition than private institutions. Yet private institutes have more students, a sign of the weakness of the public education system.
Table 20. Tuition Fees at Technical and Vocational Institutes Name Degree Yearly tuition fees Institut de Tourisme TS USD 267
TLC BT USD 2,950 TS USD 3,100 LT USD 5,000

Labor Market and Youth Capacity Assessment 48
Sessions USD 700 to USD 2,000
Technical Hotel School TS USD 267 LT USD 280
IPNET LT USD 300
CIT
BT USD 1,500 on average TS USD 1,500 on average LT USD 1,500 on average
CST USD 500 to USD 1,000
Institut Technique Kafaat BP USD 3,333 BT USD 3,333 FP USD 3,333
Public institutes are highlighted Source: TVI Interviews Tuition fees at learning centers tend to be higher than at TVIs, especially for advanced IT courses with international certification.
Table 21. Tuition Fees at Learning Centers Name Tuition fees Makhzoumi Foundation USD 70 to USD 100 per term for two-month courses
Formatech Starting at USD 100 up to USD 3,000, depending on type of course, duration and provider
New Horizons
Microsoft Certified System: USD 3,680 Graphics bundle: USD 1,500 Web Application: USD 2,785
Certified Business Professional: USD 2,000 Source: InfoPro LC Interviews
Vocational and technical teachers
Vocational and technical staff numbers
Over 20,000 people worked in technical and vocational schools across the country during the 2012/2013 school year. The share of administrative positions in the total staff has increased over the last decade, from two percent in 2003/2004 to eight percent in 2012/2013. The part of administrative positions in the total staff is similar across the various regions.
Table 22. Distribution of Staff in Technical and Vocational Schools by Position and Mohafaza 2012-2013
Mohafaza Private Public Total Administrative Teaching Administrative Teaching Beirut 69 611 0 0 680 Mount Lebanon 325 2,633 247 3,008 6,213 North Lebanon 155 1,485 345 4,206 6,191 Bekaa 49 347 250 3,043 3,689 South 111 1,126 153 2,524 3,914 Total 709 6,202 995 12,781 20,687
Source: Center for Educational Research and Development

Labor Market and Youth Capacity Assessment 49
The teaching profession as a whole has become increasingly feminized over the last 20 years, and this also applies to the technical and vocational sector. In the 2003/2004 academic year, male instructors were still a majority with a 55 share of the staff in technical and vocational schools, compared to 47 percent in 2012/2013. The gender distribution of technical and vocational school staff is now quite equal, although slightly skewed in favor of males in the public sector (except in Mount Lebanon) and in the Bekaa in each type of institution.
Table 23. Distribution of Staff in Technical and Vocational Schools by Gender and Mohafaza 2012-2013
Mohafaza Private Public Total Males Females Males Females Beirut 351 329 0 0 680 Mount Lebanon 1,306 1,652 1,692 1,563 6,213 North Lebanon 671 969 1,937 2,614 6,191 Bekaa 223 173 1,712 1,581 3,689 South 534 703 1,398 1,279 3,914 Total 3,085 3,826 6,739 7,037 20,687
Source: Center for Educational Research and Development Vocational and technical schools are less dominated by females than academic schools, where only 23 percent of teachers are male and 77 percent female. That is undoubtedly due to the nature of the technical and vocational subjects being taught, many of which are in traditionally male domains. The student to teacher ratio, which is the number of students who attend a school divided by the total number of teachers, is extremely low in all public schools, including technical and vocational schools. This is because the great majority teachers working in state schools teach part-time, and many of them do not teach at all but perform administrative tasks, either for the Ministry of Education or for other ministries.
Table 24. Student - Teacher Ratio in Technical and Vocational Schools 2012-2013 Number of Students Number of Teachers Student - Teacher Ratio
Private 52,208 6,202 8.4 Public 38,020 12,781 3.0 Total 90,228 20,687 4.4
Source: Center for Educational Research and Development
Full-time versus part-time teaching
According to the European Training Foundation and the Ministry of Education, full-time teachers and trainers accounted for less than 13 percent of the total teacher and trainer population in the public TVE subsector as of 2011. The rest of the teachers were working on a contract basis; half of these taught less than eight hours a week. The prevalence of part-time teaching in the technical and vocational sector can also be observed at the technical and vocational institutes interviewed, detailed in the table below.
Table 25. Education of Trainers at Technical and Vocational Institutes
Name Percentage of part-time teachers
Percentage of full-time teachers
Institut de Tourisme 81.50% 18.50% TLC 75% 25%

Labor Market and Youth Capacity Assessment 50
Technical Hotel School 65% 35% IPNET 94% 6% CIT 100% 0% Institut Technique Kafaat 80% (for BP and BT) 20% (for FP)
Public institutes are highlighted Source: TVI Interviews
Vocational and technical teacher education
Employment of teachers on temporary contracts is not controlled by any qualifications standards. Most of the contracted teachers and trainers have academic backgrounds, and a large proportion of those contracted on a yearly basis are recent university and TS graduates who lack the minimum required professional background. At TVIs and LCs interviewed, most trainers have university degrees. Graduates of the Lebanese University (LU) are the most common, and for some also the most preferred teachers.
Table 26. Education of Trainers at Technical and Vocational Institutes and Learning Centers
Type Name Number of Trainers Qualification University
TVI Institut de Tourisme 135 100% University Graduates with
Bachelor’s or Master’s Degrees LU
TVI CIS College N/A 35% Bachelor’s, 65% LT All Universities - AUL, LIU, AUB, CIS
TVI TLC 60 100% University Graduates, with Bachelor’s, Master’s or PhD
All Universities – LU, AUB, USJ, LAU
TVI Technical Hotel School 52 30% University Graduates,
70% LET* Mostly LET*
TVI IPNET 85 100% University Graduates All Universities
TVI CIT N/A 97% University Graduates 3% Other LU (preferred)
TVI Institut Technique Kafaat 114 100% University Graduates, mostly
Bachelor’s, some Master’s Mostly LU
LC Makhzoumi Foundation 75
Languages: University students with teaching experience
Vocational: Vocational graduates with University degrees; business
owners with 10 years of experience
LU, LAU, LIU, AUB, Makhzoumi (diploma),
US or French college for beauty
academies
LC Formatech Up to 100 University graduates with hands-on
experience in the courses given, and teaching skills
Various – the name is not a major factor
in recruitment
LC New Horizons 64 Certified in the product taught. IT, BS or Master’s Computer
Science AUB, LAU, LU
*LET = License d’Enseignement Technique, the state vocational teaching diploma Public institutes are highlighted Source: TVI and LC Interviews The level of training for teachers and trainers entering the profession could be considered insufficient for the delivery of modern TVE programs. Teacher training implemented by the national teacher training

Labor Market and Youth Capacity Assessment 51
institution for technical education has not been adapted to the TVE curricula. Furthermore, trainers often lack the necessary experience in industry to enable them to deliver training of the appropriate quality.
Vocational and technical teacher training
The inadequate formation of technical and vocational teachers and trainers is not being improved, because there is very little continued professional development. Less than ten percent of the teaching body per year currently participates in courses to upgrade their skills. This is also reflected in the interviews with TVIs, which show very little training is provided for teachers. This has forcibly led to degradation in teacher competencies.
Table 27. Training of Trainers at Technical and Vocational Institutes
Type Name
Training
offered Type Frequency
TVI Institut de Tourisme No 80% of the teaching staff has other jobs where they follow training courses. N/A
TVI CIS College Yes Teaching skills, Soft skills, IT Twice a year
TVI TLC Yes Language work shop based on new Cambridge system As needed
TVI Technical Hotel School No N/A N/A
TVI IPNET Yes
Collaboration with IECD - Lecturers from abroad give lectures or training on
innovation and technology subjects such as mechatronics, and renewable energy.
quarterly
TVI CIT No N/A N/A
TVI Institut Technique Kafaat Yes Teaching skills, including class animation
and course preparation Once or
twice a year Public institutes are highlighted Source: TVI Interviews With low salaries and a job in a generally unattractive subsector of the education system, the career path of TVE teachers is not seen as sufficiently motivating. This perception, and the extensive use of teachers with short contracts, considerably reduces the involvement of teachers in school projects and internal development.
Issues with the technical and vocational system
Perception of technical and vocational education
Vocational and technical education is perceived as a parallel system to the general education stream which provides education to school dropouts, the socially underprivileged and individuals who wish to acquire a trade to facilitate quick entry into the labor market. According to interviewed TVIs and LCs, society's negative perception of vocational certificates is one of the major challenges that their graduates face in the job market. Employers prefer candidates with Bachelor’s degrees over those with technical or vocational diplomas. This is also evident from job listings and from comments made in youth focus groups.
Due to employer preferences, students generally choose to enter university instead of technical or vocational training. If they have chosen the technical route, they rarely stop after obtaining their Technical

Labor Market and Youth Capacity Assessment 52
Baccalaureate (BT). One TVI director observed that 95 percent of BT graduates continue studying in order to reach the Higher Technicians’ Certificate (TS) and only five percent start working. Particularly in the areas of marketing and accounting, BT graduates often do not find jobs because prospective employers require a higher level diploma.
As a result, technical and vocational education is declining while the number of universities in increasing, according to TVIs. This development is a loss for employers, because certain professionals such as plumbers, electricians and technicians are in short supply. New recruits also often lack the hands-on experience that vocational training is better at providing than the academic route which focuses on theory. Not surprisingly, recruiting agents often find that university graduates do not have enough practical skills.
Vocational and technical education is seen as a last resort for students who, in most cases, are not even in a position to select a training course appropriate to their capacities and potential. For instance, there is very little career guidance for young students to objectively inform them about and guide them towards non-academic types of education and career paths. There is also a lack of orientation for those students still in school who plan to enter technical or vocational education.
This was also the opinion of some youth in focus groups who said that schools should help students more with their educational orientation in order for them to make an informed choice about their field of study. Young people need to know the job market better in order to study the specialties and majors that are in demand.
Student orientation
Orientation of potential trainees only takes place at the technical and vocational institutes and learning centers themselves. All TVIs interviewed provide orientation to potential students. The New Horizons LC offers orientation and guidance services upon registration. The Formatech LC also holds orientations at universities and at career fairs. They offer newcomers a one-on-one session to guide them and answer their question, and to advise them. Some courses have prerequisites, and potential trainees need guidance in order to know what classes to take first.
At the Makhzoumi Foundation learning center, an orientation session is held after the end of each term. The orientation informs students of the recruitment office and its services, which are free of charge. Orientation is focused around the students’ willingness to work. The Foundation does not guide them on the majors, but rather on skills and opportunities.
Mismatch with labor market requirements
The mismatch between the output of the TVE system and the skills needed in the workplace is widely recognized. This has led to a growing imbalance between the overall supply and demand for labor and has contributed to youth unemployment. Specializations in demand The TVIs interviewed were asked to identify the most valuable majors, mainly those with abundant job opportunities on the market. Their answers are detailed below.
Table 28. Most Valuable Majors at Technical and Vocational institutes Name Most Valuable Majors
Institut de Tourisme Tourism science

Labor Market and Youth Capacity Assessment 53
TLC
Business Accounting IT
Secretary Architecture
Interior Design
Technical Hotel School Chef Cook
IPNET Accounting
CIT
Accounting Hospitality Electricity
Car Mechanics Graphic Design
Institut Technique Kafaat
Hospitality (Service) French Pastry Chef
Food Production (Chef and Sous Chef) Beautician and Hair Stylist (on the same level)
Electrical Installation and Graphic Design (on the same level) Public institutes are highlighted Source: TVI Interviews At learning centers, unemployed trainees usually choose courses offering stand-alone qualifications that do not require prior background knowledge. They often also choose training for jobs that are available in the market, as the below comparison shows.
Table 29. Learning Centers Courses Sought by the Unemployed and Jobs Trainees are Able to Find
Name Courses sought by the unemployed Types of jobs trainees are able to find
Makhzoumi Foundation
• Accounting • Secretary • Language • Mobile Technician • IT • Beauty
• Accounting • PR • Marketing • Indoor and Outdoor Sales • Machine Operator or Driver • Electrician/Plumber/Technician • Food/Beverage - Restaurants • FMCG • Medical • Cosmetics
Formatech
• Microsoft Certified Solutions Expert (MCSE)
• Project Management Professional (PMP)
• IT Security: ethical hacking and countermeasures
• Soft skills: Finance for non-finance professionals, leadership, time
• Students are able to find jobs in all specializations

Labor Market and Youth Capacity Assessment 54
management, emotional intelligence.
New Horizons
• Microsoft Certified Solutions Expert (MCSE)
• Compita A+ Certification (hardware and software)
• Graphics
• IT administration or support • Web Developer • Secretary or Administrative
Assistant familiar with Microsoft Office applications, in all sectors
• Graphic Designer Source: TVI Interviews
Youth employment programs and job placement services at TVIs and LCs The TVIs were asked if they are offering any youth employment programs. The interviewees believed these to be identical with the job placement services that they provide. The only youth employment programs that the institutes have been involved in are those of CHF. CIS has collaborated with CHF on a program teaching 65 to 70 students soft skills and workplace skills. In addition, New Horizon trainers have given courses to CHF trainees which were held at the premises of the Makhzoumi Foundation.
The Formatech learning center mentioned that they work with NGOs at special rates as a form of contribution to the community. They worked for ten years with the Saradar Foundation on a project where a caravan equipped with computers would go to remote areas offering training in IT skills, and graphic or web courses.
Table 30. Age and Employment Profile of Learning Center Trainees
Institute 15-21 of which
unemployed
21-29 of which
unemployed
>30 of which
unemployed
Makhzoumi Foundation 70% 70% 18% 70% 12% 90%
New Horizons 70% 20% 20% 10% 10% 5% Formatech 20% 80% 30% 10% 50% 0%
Source: LC Interviews Of the ten TVIs and LCs that were interviewed, only one, IPNET, did not provide some form of job placement service. Nevertheless, IPNET does provide contact information of its graduates to any company that requests it. The contact or request is usually made by the employer. The placement success rate is quite high.
Table 31. Job Placement Services at Technical and Vocational Institutes and Learning Centers
Type Name Method Placement success rate
TVI Institut de Tourisme
Employers contact the institute to inform them of job vacancies and the institute provides them with graduates' contact information. Job Posts
N/A
TVI CIS College CIS introduces graduates to employers through its Career Services. 80%
TVI TLC Employers contact the institute and vice versa 100%

Labor Market and Youth Capacity Assessment 55
TVI Technical Hotel School
Direct contact with employers, mainly hotels, restaurants, and pastry shops, as well as recruitment agencies.
100%
TVI CIT Job Posts. Sending out SMS messages to students. Agencies get in touch with CIT.
N/A
TVI Institut Technique Kafaat
Employers get in touch with the foundation to offer vacancies N/A
LC Makhzoumi Foundation
The foundation has its own recruitment office which is free of charge
38% per month (50% of candidates)
LC Formatech Responds to partner companies looking for candidates.
Majority of trainees are already employed
LC New Horizons Posts on jobs board and in social media 80% Public institutes are highlighted Source: TVI and LC Interviews
Collaboration between TVIs, LCs and employers Almost half (47 percent) of the companies that were interviewed collaborate on a continuous basis with a learning center or institute. This concerns mostly building and construction firms (56 percent), and especially renewable energy companies (four out of five). Collaboration is less frequent for hotels and restaurants (44 percent) and agro-alimentary and beverages businesses (36 percent).
Table 32. Type of Collaboration between Interviewed Companies and Learning Center or Institute – by Sector
Agro-alimentary and
beverages
Hotels and restaurants
Building and construction Total
Number of
Companies
Internship 80% 80% 64% 74% 25 Hiring of Graduates 40% 33% 14% 26% 9 Apprenticeship 0% 33% 29% 26% 9 Hiring of Trainees 40% 20% 14% 21% 7 Other* 0% 26% 0% 12% 4
*Collaboration with English Teacher or Internship in the Health and Sanitation Department Multiple Response Question Source: Interviews with 34 companies that collaborate on a continuous basis with any learning center or institute Companies generally seem to be open to the idea of collaboration with schools or learning centers. Close to two in three companies interviewed, mostly those in the hospitality sector, would partner with education institutions to ensure that new graduates better suit its needs if it cannot find recruits with the appropriate skills profile.
Curricula
Work on upgrading the TVE curricula was undertaken in 1997 along with the academic curricula. The Ministry of Education commissioned academics in each field of specialty with the development of 56 programs for the BT and TS levels. The work was carried out with no reference to occupational competency

Labor Market and Youth Capacity Assessment 56
profiles, and the resulting curricula were too academic. The new curricula did not incorporate educational and quality standards and lacked supporting material, such as learning resources and teacher’s guides.
In public schools, the selection of course content and teaching material was mostly left to teachers, which produced varying results, since many technical and vocational teachers lack the necessary professional experience and training. Although another effort was made to review the TVE curricula in 2001, it has had little effect on the quality of course delivery. Teacher’s guides and student manuals have never been produced, and there are no effective tools to evaluate students’ achievement of learning outcomes.
The fact that the design of the TVE curriculum is led by Directorate General of Technical and Vocational Education (DGTVE) and does not involve the Center for Educational Research and Development (CERD) lessens the sustainability of the curriculum development process. The weak role played by the CERD diminishes the capacity of the MEHE to monitor and evaluate the design and implementation of the curriculum in line with agreed national quality criteria. It also reduces the capacity of the CERD to support general and TVE secondary education curriculum implementation. The private TVE sector operates independently. There are no standardized curricula for the training programs offered by private schools. The DGTVE imposes no quality control procedures on such programs, and there are no uniform requirements for their certification.
Administration
Current legislation governing technical and vocational education restricts the contribution of national bodies and stakeholders to the development of policies and strategies. Stakeholder participation is very limited, and planning is done by the public administration. The highly centralized governance model and the absence of any legal framework that would open the public TVE sector to investment isolate technical and vocational schools from the community where they are located.
The main aspects of improvement of the TVE system concern the mechanisms for evidence-based policies, the management of the transition from school to work and the related active labor market measures. To be sure, one of the factors responsible for the low quality of public TVE is the lack of labor market information, which has led to outdated curricula and an inability to keep pace with technological developments.
In-house training by employers Most Lebanese enterprises have little incentive to invest in human resources for a variety of reasons. They are often family-owned companies focused on fighting for survival rather than investing in the future and developing a long-term vision. The high unemployment rate and abundant migration make cheap labor available, and recruitment decisions are often based on connections rather than on the talent and competence of the employee. All of these factors make companies and their representatives reluctant to invest time and resources in training. Nevertheless, training does occur, especially at large firms. An overview is provided in the table below.

Labor Market and Youth Capacity Assessment 57
Table 33. Formal Training of Workers
Training types Percentage of workers
Average number of
training courses per year
Level of Employee
Satisfaction (Score out of four)*
Percentage of workers
whose position was improved as a result of
the training
Percentage of workers requiring
more training
Soft skills 46% 3.3 3.27 39% 60% New machines / products 26% 1.6 3.28 35% 67% Managerial skills 21% 1.3 3.25 46% 76% Advanced computer skills 19% 1.8 3.39 37% 57% Basic computer skills 16% 1.7 3.13 32% 62% Accounting skills 15% 1.3 3.20 30% 59% Linguistic skills 7% 1.5 2.93 40% 67% Classical educational opportunities 5% 1.9 3.52 39% 74%
* 1 being not satisfied at all and 4 being very satisfied Source: Greater Beirut Labor Market Demand Survey, ILO 2008
Training at interviewed companies
Training provider and frequency
In the past three years, the majority of companies interviewed offered some form of training to their employees. Training is the least common in the building installation sub-sector, except among renewable energy companies, four out of five of whom trained employees in the past three years.
Table 34. Training of Employees – by Sector Agro-alimentary
and beverages Hotels and restaurants
Building and construction
Total
Offered training to employees 94% 97% 65% 86% Number of companies 16 34 26 76
Source: Company interviews In most cases, the training was carried out by internal staff. However, external trainers are used more than internal trainers in two sub-sectors: Building of complete constructions and civil engineering, and manufacture of cocoa, chocolate and sugar confectionery. In the agro-alimentary and beverages sector, learning Centers and e-learning do not appear to be a training option.

Labor Market and Youth Capacity Assessment 58
Table 35. Training Providers at Interviewed Companies - by Sector Agro-alimentary and beverages
Hotels and restaurants
Building and construction Total
Internal staff 80% 94% 67% 83% External trainers 47% 30% 50% 39% External trainers on company premises 27% 45% 39% 39%
Learning center 0% 24% 22% 18% E-Learning 0% 18% 6% 11%
Multiple Response Question Base: 65 companies which offered training to their employees in the past three years Source: Company interviews Skilled employees underwent internal training more frequently than external training. In-house training is especially common in the hospitality sector.
Table 36. Frequency of Training of Skilled Employees – by Sector (Average Number of Trainings per Year)
Type of Training Agro-alimentary and beverages
Hotels and restaurants
Building and construction Total
In-house training 7 12 6 10 External training 4 3 2 3
In-house training base: 55 companies External training base: 46 companies Source: Company interviews
Type of training
In-house training of skilled employees is very much focused on job-specific technical issues. Other subjects that come up frequently are hygiene and health, as well as safety and security, including fire training and first aid.

Labor Market and Youth Capacity Assessment 59
Multiple Response Question Base: 56 companies Source: Company interviews External training, whether held on or off company premises, also often involves technical subjects that are specific to the job. However, management, IT, administration, accounting as well as language courses (mostly English) are more often provided by external trainers, while the topic of hygiene is usually handled internally.

Labor Market and Youth Capacity Assessment 60
Multiple Response Question Base: 47 companies Source: Company interviews The sector segmentation shows that safety and security are important issues in the food and beverage production business and in building and construction, while hygiene is a major topic in both the preparation and serving of food and drink.
Table 37. Most Common Training Topics – by Sector
Type of Training Agro-alimentary and beverages Hotels and restaurants Building and
construction
In-house training
Safety and Security Standards, Hygiene, Technical Training, Customer Service
Customer Service, Hygiene, Communication
Skills, Professional Cooking & Preserving
Methods
Safety and Security Standards, Technical
Training, Communication Skills, ISO
Measurements, Social Interaction Skills
External training Professional Cooking &
Preserving Methods, Communication Skills
Sales / Upselling, Customer Service
Communication Skills, Safety and Security
Standards In-house training base: 56 companies External training base: 47 companies Source: Company interviews External training is mostly provided by freelancers, but also by a large variety of companies, educational institutes or learning centers. These are listed below.
Table 38. External Training Providers Training Provider Sector Percent Number of Companies
Freelancer Hotels and restaurants, Building and construction 20% 9
Formatech All sectors 11% 5 Boecker Hotels and restaurants 11% 5 Starmanship Hotels and restaurants 9% 4 American Language Center
Hotels and restaurants, Building and construction 7% 3
New Horizon Hotels and restaurants 5% 2 Amideast Building and construction 5% 2 Apave Building and construction 5% 2 Bano Agro-alimentary and beverages 5% 2 GWR Hotels and restaurants 5% 2 illy Hotels and restaurants 5% 2 PHI Management Group
Hotels and restaurants 5% 2
Specifico & Co Hotels and restaurants 5% 2 Others All sectors 91% 40
Multiple Response Question Base: 47 companies Source: Company interviews

Labor Market and Youth Capacity Assessment 61
Satisfaction with training
The level of satisfaction with the outcome of the training was generally very high. Only two of the interviewed companies, both hotels, indicated that they were not satisfied. The reasons for their dissatisfaction were a lack of the new topics and ethics training. One hotel manager commented that despite the training they received, employees remained careless and went back to their habitual ways of accomplishing their tasks.
Table 39. Level of Satisfaction with Training Outcomes – by Sector Agro-alimentary
and beverages Hotels and restaurants
Building and construction Total
Number of companie
s Not Satisfied 0% 6% 0% 3% 2 Satisfied 60% 58% 53% 57% 37 Very Satisfied 33% 36% 47% 38% 25 Do not know 7% 0% 0% 2% 1 Total 100% 100% 100% 100% 65
Scale of 1 to 4 (1=Not satisfied at all, 2= Not satisfied, 3= Satisfied, 4= Very Satisfied) Source: Company interviews
The main reason for satisfaction with the training provided was an improvement of employee performance, which also included improvements in employee skills, increased production quality and speed, and good results at employee assessments.
Multiple Response Question Base: 62 companies Source: InfoPro company interviews

Labor Market and Youth Capacity Assessment 62
Another training benefit was an improvement in the motivation of employees. This was apparent in better employee attitudes and behavior, an improved team spirit, and an increased sense of belonging and dedication. These helped to lower the turnover rate. Training led to a better knowledge of tasks, including at the production and IT levels. It also caused greater client satisfaction, which is associated with better customer service and increased sales percentages.
Finding a training provider is not too difficult for most companies. Still, 22 percent of the companies that provide training to their employees had some training requirements for which they did not find a provider. Building and construction businesses encountered the most difficulties (35 percent), especially renewable energy companies, followed by agro-alimentary and beverages (20 percent), and hotels and restaurants (15 percent). The type of training that was found to be unavailable was mostly technical in nature. In soft skills, only a few training areas are not being covered sufficiently. They include Six Sigma, team building, and sales strategies / upselling.
Table 40. Type of Training for which no Provider Could be Found – by Sector Agro-alimentary and beverages Hotels and restaurants Building and construction
Sales Strategies / Upselling, Electrical, Mechanical,
Technical Training
Professional Cooking Methods, Revenue Management
New Trends in Spa Treatments New Trends in Baking and
Pastry Team Building Training, POS Software Training
Solar photovoltaic installation, Solar heater installation,
Operation of renewable energy technologies, Foreman training, Technical Training, Six Sigma
Source: Interviews with 14 companies which did not find a provider for some of their training needs.
Projects and initiatives for youth training and employment A number of programs and initiatives in Lebanon can be considered to be active labor market measures, such as training for job seekers, entrepreneurship skills development, and on-the-job training. Most of these programs and initiatives are organized by NGOs, some with the support of international donors.
The rationale for such programs is that individuals tend to face several constraints when looking for a job or starting a business. These range from not having enough information about where the jobs are and how to search for them, to not being able to demonstrate to employers the skills they have or not having the necessary skills to fill a given vacancy, to lacking access to capital and business contacts.
The key characteristic of the local active labor market measures is their fragmentation in terms of both provision and strategic design and management, including funding. In the absence of clear guidelines and direction from national authorities, public, private and third sector initiatives are limited in their scope and relevance to target groups, as well as businesses and labor market needs.

Labor Market and Youth Capacity Assessment 63
Relations between State Institutions and Providers of Youth Training, Employment Services, and Micro-financing
Source: World Bank, 2012
Youth training The ministries of Education and Higher Education, Social Affairs and Labor finance and certify the provision of vocational training. As discussed in the above chapter on the technical and vocational education system, TVE currently has scant provision for skills upgrading, skills development for the self-employed, active citizenship or personal development. There is a low level of practical training. In public institutes in particular, there is neither a sufficient budget nor a mechanisms to ensure structured workplace training for students. In addition, inadequately equipped school workshops often prevent trainees from acquiring relevant practical skills. Teachers often lack the necessary experience of the productive sector to be able to deliver training of the appropriate quality.
The acquisition of skills in the informal microenterprise sector is constrained by the low skills level of owners and workers. Most skills are obtained via informal apprenticeships and on-the-job training in small workshops. Very few training programs target those working for informal microenterprises. The most prominent are the training activities of the Community Development Centers managed by the Ministry of Social Affairs and certain NGO training schemes. These centers try to teach relevant basic skills to individuals with low educational achievements, especially women.
Many of the larger active NGOs are also involved in skills training. For instance, the Mouvement Social has its own training center and also runs a large number of training courses in its social centers throughout the country. This organization has also started pre-vocational schools for 11- to 14-year-olds to acquaint them with certain occupations and work in the informal microenterprise sector as preparation for future skills training. In South Lebanon, a group of NGOs have joined forces to create the Intensive Vocational Training Project. Training is based on regular courses offered by the seven participating training centers, but is condensed into full-time three-month and part-time six-month courses.

Labor Market and Youth Capacity Assessment 64
Programs led by the National Employment Office
The government has only developed one major program with limited scope, which targets job seekers. This program is managed by the NEO and the training is outsourced to private TVE providers. These programs are confined to short-term training from one to three months in a limited range of occupations and tend to focus on basic and narrowly defined skills. The programs led by the NEO in partnership with the Directorate General of Technical and Vocational Education (DGTVE) are insignificant, considering the size of the potential target group. They are also unattractive to potential students because of the low quality of the training delivered.
Initiatives by international and national organizations
Several initiatives have been undertaken by international organizations and national NGOs, but the impact of these is uncertain due to fragmentation and lack of coordination. One example is an ILO project in South Lebanon in collaboration with INJAZ. The project supports six TVE institutions in implementing the ILO Know About Business module.
Another example is Al Majmoua, which proposes free training schemes on various themes such as accounting, management techniques as well as improving self-esteem and autonomy for women. Other micro-finance institutions also provide entrepreneurship training as part of their nonfinancial services. These are described in the next chapter.
Education-business cooperation and partnership projects
Representatives from the private sector, such as the Chamber of Commerce, Industry and Agriculture and the Association of Lebanese Industrialists, participate in key government meetings on sector-specific issues. Although professional associations have the capacity to influence policy decisions, this capacity is not exercised enough when it comes to education.
The Association of Lebanese Industrialists (ALI) has a committee for technical and vocational education that monitors MEHE policy formulation on skills development. ALI also has several product-specific focus groups, for example those dealing with the chemicals and beverage sectors.
The Syndicate of Lebanese Food Industries has played a prominent role in developing public-private partnerships in the agro-food sector, including school-based initiatives such as the first food technician’s school in the Bekaa Valley. This project, however, has been interrupted due to institutional and political problems at the MEHE.
The project for the Qab Elias agro-food school, supported by the EU, was undertaken to match vocational training and labor market needs and to raise the attractiveness and prestige of TVE. The project envisaged that the school would act as an effective autonomous institution that would benefit, through the EU funds, from high investment in infrastructures and human resources. Low priority has been given to this school despite the commitment of the sectoral federation.
Another initiative for the development of enterprise-based learning and workplace-based qualifications has been supported by the German development organization Deutsche Gesellschaft für Technische Zusammenarbeit (GTZ). This initiative is linked to the objective of developing professional practice in TVE in close cooperation with companies. However, so far few students are enrolled in the dual system, and the qualification developed in this context (the FPM) is still marginal compared to other intermediate qualifications.

Labor Market and Youth Capacity Assessment 65
Youth employment services
National Employment Office
The National Employment Office (NEO), under the tutelage of the Ministry of Labor, is in charge of employment services. The NEO receives announcements for job vacancies from firms, and applications from job seekers. These applications can be sent through fax, phone, emails or personal visits to its walk‐in‐center. Today, NEO lacks a system that would allow employers and employees to post vacancies and send their CVs online, or browse and search the database for job offers and job‐seekers.
NEO is responsible for matching vacancies with job seekers, choosing relevant job seekers and forwarding their CVs to the firms. There is no systematic follow‐up after the match is proposed, except through irregular phone calls to firms to check on the status of recruitment or whether companies intend to continue using the NEO’s services.
A snapshot of the NEO database shows that three quarters of registered jobseekers at NEO are young people between the ages of 20 and 35, 56 percent are males, and 80 percent hold a university degree or higher. Only 15 percent of applications are registered in the local offices, where databases are not linked to the central office in Beirut.
Because of its inefficiency, very few employers and job‐seekers use the NEO as an as an intermediary. According to the World Bank, as little as 0.1 percent of workers report to have found their job through NEO and only 0.7 percent of those unemployed are depending on it for their job search. This is consistent with NEO’s records that show that, in 2010, less than 400 job seekers had submitted their CVs and only 220 announcements of job vacancies had been received. In total, 98 successful placements were registered during that year, though the number of actual placements could be higher because not all placements are necessarily reported.
NGOs
NGOs usually do not have a database of job vacancies, but rather use other databases and personal contacts, post advertisements on their bulletin board and refer beneficiaries on a one‐to‐one basis.
The Rene Mouawad Foundation’s FORAS program aims to link young newly graduated job seekers in the North of Lebanon to available job vacancies and help increase their chances of being placed. Beneficiaries receive support in writing their CV, presenting themselves and conducting a job interview, and undergo a behavioral and basic qualifications test. The NGO then uses its network of contacts and companies to reach out to employers and arrange for their hiring on a three‐month probation period. The services are free of charge for both job seekers and employers. In 2009, FORAS assisted a total of 300 job seekers with a budget of $100,000, and it claims a job placement rate of around 48 percent.
Two other NGOs, Labora and ILDES, also provide job search assistance to their beneficiaries. Labora provides orientation and counseling services to Christian job seekers. ILDES (Lebanese Institute for Integrated Economic and Social Development) also provides employment services, benefiting 157 individuals in 2009 and achieving a job placement rate of 50 percent.

Labor Market and Youth Capacity Assessment 66
Self‐employment and micro-entrepreneurship
Financial support to the self‐employed and micro-entrepreneurs The prevalence and preference for self‐employment, and the fact that microenterprises employ a large proportion of the labor force in Lebanon, make self‐employment and entrepreneurship programs especially relevant. The provision of such programs has mostly attracted NGOs which are involved both in financing and in implementation.
Corporate credit overview
World Bank data suggests that corporate credit in Lebanon is not broad-based and remains concentrated on a relatively small number of firms and investors - those large enough to have the necessary collateral or with connections to the banking sector. The levels of collateral needed in Lebanon, especially by as enterprises that employ less than 50 workers, are substantially above those required in other countries, notably in Europe, but also in Turkey and Malaysia. The value of the collateral needed for a loan has increased over the last four years.
Table 41. Company Size and Bank Financing
Company Size
Percent of firms with a bank loan /
line of credit
Proportion of loans requiring collateral
(%)
Value of collateral
needed for a loan (% of
the loan amount)
Percent of firms using
banks to finance
investments
Percent of firms using
banks to finance working capital
Proportion of working
capital financed by banks (%)
2009 2013 2009 2013 2009 2013 2009 2013 2009 2013 2009 2013 Small (5-19) 67 49 76 73 171 184 16 44 48 30 22 12
Base 185 263 86 107 58 44 185 104 185 256 167 260
Medium (20-99) 71 70 70 61 156 250 28 63 54 53 27 25
Base 140 206 80 126 48 53 140 118 140 203 124 202
Large (100+) 78 78 42 76 146 195 44 59 62 75 33 36
Base 50 88 33 71 12 24 50 61 50 88 48 87
Lebanon 69 57 68 69 161 208 24 53 51 40 25 17 Base 382 557 202 304 120 121 382 283 382 547 346 549
Source: World Enterprise Surveys 2009 and 2013, from www.enterprisesurveys.org/CustomQuery/lebanon
In the national banking system, loans are highly collateralized and typically provided under an individual‘s name rather than to a company. Women are less likely than men to own assets such as land or housing or to have these assets registered in their name, which can inhibit their ability to borrow. As a result, almost two-thirds of male-owned companies have access to a bank loan to finance capital or operations, compared to less than half of female-owned companies.
Lebanese commercial banks have a very limited scope of services reaching the small scale enterprises and almost none serve the microfinance sector. Microfinance and Kafalat together represent only 2.5 percent of private sector lending.

Labor Market and Youth Capacity Assessment 67
Table 42. Lending per Category as of 2013 (USD million) Microfinance loan portfolio 339 Kafalat loan portfolio 893 Total loans to the private sector 47,110
Sources: Mix Market, Kafalat, Ministry of Economy and Trade
Microfinance
State of the micro-entrepreneurship economy Microcredit has been known in Lebanon for the past 20 years, but is has become an active sector over the last 10 to 15 years. It was initially launched by banking sector institutions.
One interviewed MFI stated that there is room for competition, as not all of the 40 percent of the population that do not deal with banks has been reached by MFIs. One reason is that MFIs apply different criteria, so a person might be granted a loan by one but not the other.
Another MFI indicated that the market is approaching saturation, as both granting loans and repayment have become more difficult. Metropolitan areas in particular are well covered and competition is very high. Over-indebtedness is on the rise. It poses a risk to the entire MFI sector and by extension the national economy. Examples such as Bosnia and Morocco prove that such contamination has happened before.
Regional comparison The micro-finance programs in Lebanon are the oldest in the region. Furthermore, the penetration level of the financial institutions is among the highest due to the large number of banks and financial institutions. The percentage of active clients is the highest in the Arab region. However, Lebanon is no longer one of the more advanced countries for micro-loans in terms of outreach, as it has been surpassed by Jordan.
There are four large micro-finance institutions (MFIs) in Jordan with a wide outreach and good performance. The average loan size in Jordan is slightly higher than Lebanon, even though the average per capita income is lower. Jordan is also ahead of Lebanon in terms of sector organization with their micro-loan network active since 2011.
The Syrian MFI market also had the potential to surpass that of Lebanon before the war. Their advantage is that they have a specific law for micro-entrepreneurship in place, which is missing in Lebanon. Some MFIs such as Ibdaa in Syria are already benefiting from this regulation. In terms of gross loan portfolio, Lebanon is currently ahead of Syria.
Microfinance actors The formal microfinance sector has seen strong growth over the last few years and around 20 institutions now offer a wide variety of financial services to low-income clients. The average microfinance loan size is about USD 1,200. The microfinance sector in Lebanon is characterized by a large variety of players. There are independent organizations on the one hand and politically motivated actors on the other, but all have a national outreach.

Labor Market and Youth Capacity Assessment 68
Table 43. Microfinance Actors Institution Portfolio (M USD) Borrowers Al Qard Al Hassan Association 245.0 110,000 Al ‐Majmoua 35.8 44,915 Emkan 22.2 14,006 Vitas 18.9 15,468 Ibdaa 5.3 3,500 ADR (Association for Rural Development) 2.9 1,854 AEP (Association d'Entraide Professionnelle) 1.8 700 UNRWA 1.7 1,290 Caritas 1.6 1,500 Tamkeen 1.3 635 Palestinian Arab Women League (PAWL) 1.1 882 Coopérative Libanaise pour le Développement Social (CDL) 0.9 265 Makhzoumi Foundation 0.8 587 Total 339.3 195,602
Sources: Mix Market, CGAP, Sanabel, institutions (data might be outdated for the small players)
Al Qard Al Hassan, an NGO affiliated with Hezbollah, practices microfinance according to Islamic principles, such as interest-free gold loans. They are estimated to grant around 30,000 to 40,000 loans per year. They are different from the other MFIs in that they are not under any supervision. Al Majmoua, also known as the Lebanese Association for Development, is an NGO that was launched as a microcredit program in 1994 by Save the Children, a UK-based nonprofit organization. As of 2014, Al Majmoua is an independent organization that aims to contribute to the well-being of low-income Lebanese and Palestinians by offering them tools to become financially independent.
Emkan is a non-bank financial institution which provides microfinance services for the economically active poor in Lebanon. It started lending operations in 2009 with the help of its banking partner BankMed. In addition to providing microfinance services, Emkan also engages in community development activities through the implementation of sustainable economic development projects and programs. The Makhzoumi Foundation launched a micro-finance program in 1998. It started by covering only Beirut and then expanded to cover the Greater Beirut area. In 2011 it began covering Tripoli and some surrounding areas in the North, as well as the areas of Baalbek and Zahleh in the Bekaa. Apart from microfinance and vocational training, the Foundation also has a health program and undertakes development projects. Ibdaa is an initiative of the Arab Gulf Fund for Development (AGFUND) launched jointly with Lebanese investors in 2012. Ibdaa operates as a non-banking financial institution whose shareholders do not seek return on their invested capital. The Entrepreneurial Development Foundation (EDF) was registered as a charity. It is a not-for-profit organization that promotes entrepreneurship among the less privileged in Lebanon’s rural areas and needy neighborhoods of big cities through loan and training programs. Its banking partners are Credit Libanais and First National Bank.

Labor Market and Youth Capacity Assessment 69
Regulation of micro-finance institutions Unlike Jordan or Palestine, Lebanon until recently did not have a national microfinance association to coordinate and advocate for the industry, nor an information-sharing system. A few months ago, the Lebanese Micro-Finance Association (LMFA), an MFI network, was formed. It is still at the initial stage of activity. According to one MFI, the association needs to undertake in-depth sector research as more transparency is needed in order to reveal the size of the market and its potential for further growth. Some of the blame for the lack of visibility in the sector can be laid at the doorstep of the government. Small credit systems work well if they are regulated and overseen by the Central Bank. This will provide protection from over-indebtedness, cross-lending and similar issues. One MFI executive mentioned that regulations are crucial as they give microfinance institutions momentum and enable further growth. An MFI law should therefore be envisaged. At present, none of the MFIs offer micro-insurance or micro-savings because this is forbidden by regulations. These are also areas where legislative changes could benefit the sector.
One of the rare measures to stimulate the micro-finance sector was the authorization given by the Central Bank to commercial banks to use five percent of their legal reserves to finance MFIs. This gave the banks the opportunity to use their mandatory provisions for granting microcredit loans in the range of one to million to 20 million Lebanese Lira. However, it has resulted in only a very few loan agreements, despite the Lebanese banks being cash-rich. As a result, local MFIs are more dependent than elsewhere on international donations and funding.
The three formal non-bank financial institutions Emkan, Vitas and Ibdaa fall under the supervision of the Central Bank. The Ministry of Interior registers all MFIs with the status of NGOs but there are no guidelines or infrastructure for supervision. The Ministry of Interior restricts NGO access to private funding, as the collection of savings funds is reserved for financial institutions.
Effect of political and security conditions on the microfinance market According to interviewed MFI managers, there is little correlation between politics and the local microfinance market. A case in point is that Lebanon has been without a president for the past year, which only had a slight negative effect. Economic measures such as a tax increase could have a stronger detrimental effect than political tensions, which do not dent the demand for microcredit.
Deteriorating security conditions can have two opposing effects. One the one hand, a lack of security will discourage micro-entrepreneurs from launching or expanding their business. On the other hand, it can push people to take microcredit in order to protect their household income from collapse.
In situations of armed conflict, the microfinance system tends to break down, with repayment being affected the most. People living in remote areas might not able to reach the MFI while there are security threats. OMTs close to their area might close, and there would be no-one to deliver the money. However, the situation tends to revert to normal as soon as fighting stops.
Makhzoumi and EDF cited the example of Tripoli, where EDF microcredit loans decreased by 60 to 70 percent because the majority of businesses were closed and many were unable to reach their work place. Many offices were destroyed and people had to move to new locations and start over. At the moment, micro-loans are active again since the situation has stabilized.
In nearby Arsal however, fighting is still ongoing, and microloans have decreased by around 50 percent, according to EDF. Other areas that have been affected in the past are Baalbek and the Bekaa in general,

Labor Market and Youth Capacity Assessment 70
as well as Abraa in Saida. In the South, microfinance decreased by around 50 percent during the Israeli attacks in 2006.
MFI products
Nonfinancial services At the time when microfinance was introduced in Lebanon by financial institutions, NGOs started offering mentorship programs involving professional training. However, this activity declined over time except for specific projects sponsored by foreign organizations. Women’s empowerment is an example, in particular project management in agriculture.
At present, mentorship is an expensive process and requires many sponsors. The associations that are involved in mentorship often do not have the means to organize such training programs without the support of loaning agencies. Currently, MFIs are more focused on giving loans, not training, especially the smaller actors. Some of the main microfinance institutions that do offer training are listed below.
Table 44. Nonfinancial Services Offered by Selected Microfinance Actors Institution Type of Service
Al ‐
Majmoua
Free training and social activities for borrowers and non-borrowers in business development services, product quality improvement and marketing, personal development, and provision of toolkit and equipment.
Ibdaa Training and mentoring is carried by Ibdaa’s sister association, the Arab Open University, where Ibdaa established an entrepreneurship center.
Makhzoumi Foundation
Specific business start-up and development training which involves soft skills and the basics of financial accounting and marketing, as well as basic market research.
EDF Basic business training programs in topics such as accounting, finance, marketing and sales techniques, as well as in other fields such as agriculture, tourism and IT.
Sources: MFI interviews and websites
Microcredit products The different types of microcredit business loans are detailed below. The list only includes productive loans. Some of the institutions also offer non-productive loans such as poverty alleviation and personal loans, but these are charity rather than an incentive for self-employment.

Labor Market and Youth Capacity Assessment 71
Table 45. Microcredit Business Loans Offered by Selected Microfinance Actors Institution Type of loan Loan size Use / Conditions
Al ‐
Majmoua
Group loan
Not specified
Offered to groups of three to 10 women entrepreneurs and some workers. No collateral is required.
Micro-Entrepreneur loan
Offered to owners of existing micro-businesses and few cases of starts-ups for financing fixed assets or working capital.
SME Loan Offered to owners of existing or start-up small and medium enterprises.
ICT loan Existing or start-up businesses in the information and communication technology sector located in rural areas.
“Yalla Shabab” youth loan
Young people aged 18 to 30 who are owners of existing micro-businesses, or workers and fresh graduates with start-ups.
Emkan
Microfinance business loan
USD 333 to USD 5,000
Used for business expansion, including equipment, inventory, materials, and working capital. The applicant has to have owned his business for more than one year, be between 18 and 64 years old, and be a Lebanese national or permanent resident.
Small and medium enterprise (SME) loan
USD 5,000 to USD 10,000
Vitas Micro Business Loan USD 300 to
USD 5,000 The types of loans available include fixed asset, working capital, and start-up loans in the sectors of agriculture, industry, or trade. Small Business Loan USD 5,100 to
USD 15,000
Ibdaa
Sayedati USD 500 to USD 3,000
For women who are developing their micro/small business which has to be at least one-year old.
Tahseen USD 5,000 to USD 20,000
Targets SME owners running a registered business for at least two years, employing at least two people.
Tatweer USD 200 to USD 6,667
Targets owners of micro/small businesses in the commercial, industrial or service sector, in order to develop these activities. The business has to be at least one-year old
Aliyati USD 500 to USD 2,000
Targets owners of micro/small enterprises or employees– who are looking to improve their vehicle, buy a motorcycle, pay vehicle registration fees, pay for their driving license, etc.
Makhzoumi Foundation Business loan USD 300 to
USD 7,500
Lebanese entrepreneurs aged over 18. The decision to grant credit is based more on the character of the beneficiary rather than on the project.
EDF Business loan USD 667 to USD 13,333
For starting or developing a business. Requires two guarantors, including one civil servant and one from the private sector.
Sources: MFI interviews and websites

Labor Market and Youth Capacity Assessment 72
Client profile Al-Majmoua is currently the only MFI that offers a specific youth loan; in addition, Ibdaa is in the process of launching a dedicated youth loan program. Youth are the minority among loan beneficiaries. A third of microcredit loans at the Makhzoumi Foundation are granted to youth below 25, compared to 25 percent to 30 percent at Ibdaa, and 12 percent at EDF. In 2014, 33 percent of Al Majmoua’s active clients were young people aged between 18 and 30. While they do not have specific loan products for young people, Vitas and Emkan also provide loans to youth.
As can be seen in the above table, Al ‐Majmoua and Ibdaa have loan products specifically geared to women. As a result, the gender profile of the clientele is also more feminine. At the Makhzoumi Foundation, male borrowers tend to be younger than female borrowers. The main categories of beneficiaries are men between the ages of 30 and 35 and women aged 45 to 55.
Table 46. MFI Client Gender Profile Institution Female Male Ibdaa 71% 29% Al ‐Majmoua 55% 45% Makhzoumi Foundation 50% 50% EDF 32% 68%
Sources: MFI interviews and websites
The overview of microcredit business loans shows that they mostly target existing businesses. In addition, micro-finance loans are only rarely made to unemployed or inexperienced individuals, and start-up clients constitute a very small fraction of the MFI portfolio. All of these elements prevent youth from being the main target clientele of MFIs. This also is because the youth entrepreneur needs to have a very clear idea of his project or some experience in the field to be considered for a loan, and those elements are sometimes missing.
The Makhzoumi loan portfolio includes 50 percent employees and 50 percent people in self-employment, part-time employment, or government jobs. Ibdaa’s clients are self-employed and working from their homes or in small shops. Their individual monthly wages lie between LL 573,750 and LL 1,181,250. EDF beneficiaries mostly work in small shops, and include professions such as barber or florist.
Main challenges to microenterprises Challenges to microenterprise start-ups and operations in Lebanon exist in the terms of business registration, access to finance, and market share and competition.
Business Registration EDF indicates that the majority of its borrowers are not registered officially, and only pay municipality fees. Ibdaa’s clients also tend to operate in the gray market, and are not keen on registering their business. Ibdaa informs them about benefits of registration after the first cycle of investment, but they usually do not follow the MFI’s guidance.
The reason for this is that business registration is a cumbersome and costly process. Lebanon has been falling behind other countries in the ranking of facilitating start-up businesses. This is detrimental to the

Labor Market and Youth Capacity Assessment 73
economy for which start-ups are the building block. In addition, the expansion of the informal economy signifies a loss to government in terms of tax revenue.
According to interviewed MFIs, many of the obstacles encountered in registering a business are due to the corruption at government agencies. There are no transparent guidelines for the state employees to follow. There is also a lack of constant surveillance, in the areas of health and sanitation for example.
Access to finance The interviewed MFIs noted that many of their clients do not have any relation with a bank. Many are afraid of borrowing from banks because of the high collateral required. They prefer to deal with NGOs who are more flexible and offer more guidance. Loan officers of the Makhzoumi Foundation for example offer the client a consultancy and pay them monthly visits throughout the loan period.
In Lebanon as a whole, around 40 percent of the population is considered non-banked. This is the case especially in rural or remote areas. NGOs have an advantage over banks in these areas as they have field officers that can reach these villagers.
About five to seven percent of borrowers are cross-borrowers and are over-indebted. In order to avoid this, the MFIs communicate amongst themselves about borrowers that are taking on more loans than they can handle, or take loans from several different organizations. However, the system of information is not as good as that of the commercial banks, as NGOs do not have the right to ask detailed questions or contact the Central Bank to ask about every individual borrower.
Market share and competition An open environment provides more business opportunities and greater growth potential, regardless of the level of competition. A problem in Lebanon is that the local market is small and access to other countries in the region is limited.
The large informal sector and absence of transparency in the economy, as well as the lack of market statistics means that it is difficult for entrepreneurs to plan and benchmark the costs of a new business, a new branch or a new franchise. An MFI manager indicated that it should be the government’s role to spread awareness and transparency, in other words, to democratize information.
Opportunities for youth in micro-entrepreneurship As all economic sectors are interconnected, all enterprises, whatever their size, thrive when the economy is doing well. MFIs noted that if the economy were better, the number of people initiating projects would increase. Currently, many people are traveling to look for jobs abroad, and those who stay are taking few or no risks.
Contrary to popular belief, micro-entrepreneurship is currently not a strong generator of employment, according to one MFI manager. Five years ago, his institution gave a small fraction of its portfolio of 300 to 400 loans to startups. Each new business created 30 to 50 new jobs. In the current economic situation, these numbers are decreasing, and it is becoming harder to find opportunities. In 2014, the MFI granted only 14 start-up loans which yielded about 15 new jobs, as a part of about 844 loans for 822 people. SMEs are currently better at generating jobs than micro-enterprises. Companies of a certain size are able to hire an accountant, an auditor and marketing staff.

Labor Market and Youth Capacity Assessment 74
Steps to be taken According to interviewed MFIs, several steps need to be taken at both the micro and macro levels to enable young entrepreneurs to succeed. Young entrepreneurs need courses and workshops on how to run businesses, as well as the responsibility and requirements of work. Young people often have the skills needed in their profession, but they do not know to practice it and turn it into a business. Know-how in areas such as bookkeeping is crucial for obtaining microcredit, and to avoid over-indebtedness. MFIs also underlined the importance of soft skills training, especially in the areas of behavior and attitude, management and communication, as well as sales and marketing techniques. Youth can learn these skills from mentors, or at TVIs or LCs. At the macro level, studies and research focusing on the entire ecosystem that will help open new job opportunities are needed. These will be the basis for formulating strategies at the national level. A clear development policy and a suitable legislative environment are required to put together a national framework including funding and training young entrepreneurs. Marketing and labeling is also an important issue in order for businesses to gain access to national, regional and international markets. An example is agriculture where labels such as organic food are a must.
Youth attitude to microfinance One MFI interviewee remarked that the appetite for risk is currently low due to the general state of the economy, and this was corroborated through the youth focus groups. Participants appeared quite risk-averse. Although several of them showed interest in the idea of micro-credit schemes, it was only under certain conditions which could guarantee the repayment of the loan. Being employed at the same time as launching a new business is one way to achieve this. Once the business succeeded, the entrepreneur could quit his job and work in the business full-time. Some participants mentioned that they would consider micro-finance if they had one or several partners, at least initially. A number of participants pointed out that the situation in Lebanon is not really encouraging for new business ventures and the risks of failure are very high. One commented that there are some companies that are opening, but the investors behind these companies are wealthy and would not really be affected if the new business did not succeed. One participant was categorically opposed to the idea because he does not like taking loans. Another commented that he would take a loan only from a family member, who would be more forgiving if anything went wrong, unlike a bank.
Kafalat
Kafalat is a loan guarantee company that was established by the Lebanese government in 1999. It is 25 percent owned by banks and 75 percent owned by the national institute for guarantee of deposit (NIGD), which is itself owned by the government as well as by banks.
Kafalat provides financial guarantees and subsidizes the interest rates for loans granted by commercial banks to SMEs engaged in the following economic sectors: Industry, Agriculture, Tourism, Traditional Crafts, and High Technology. Eligible loan applicants are SMEs with less than 40 employees registered with social security (NSSF).

Labor Market and Youth Capacity Assessment 75
Within the five designated sectors, the activities that are financed are mainly manufacturing or related productive activities, and not service or trade activities. To be eligible for Kafalat funding, the activity should technically involve a transformation model where the raw material input is processed with physical or human capital, or both, to produce an output.
However, Kafalat is quite flexible in the application of this definition. It allows some exceptions for hotels and furnished apartments, which may fall under the category of sectors that can benefit from Kafalat financing if they provide room services and are registered in the Ministry of Tourism. Also, in the IT sector, the input is the human capacity of production and the output is a program or software, so a company that makes websites for example can also qualify.
As shown in the table below, the bulk of Kafalat loans have been granted to companies in the industry and agriculture sectors. However, the average loan size is the biggest in the advanced technologies and tourism sectors, followed by industry.
Table 47. Kafalat Portfolio of Operating Loans as of 31 December 2014 – by Sector
Sector Amount (USD million) Number Share by
amount Share by number
Industry 391 2822 44% 39% Agriculture 270 2910 31% 40% Tourism 179 1171 20% 16% Craft Industries 21 216 2% 3% Advanced Technologies 20 122 2% 2% Total 882 7,241 100% 100%
Source: Kafalat
Most loans have been issued under the Kafalat Basic program which started in 2000, or the Kafalat Plus program, with the other programs making up a small share of the number and value of loans. Kafalat loans vary between the required minimum USD 3,000 and the maximum allowed of USD 400,000. The highest number of credits is granted in the largest loan categories of over USD 100,000 and over L.L. 200 million.
A majority of 89 percent of the outstanding Kafalat loans is denominated in Lebanese Pound, and 11 percent are in U.S. dollars. This is the opposite of the overall private sector loan profile, which is still highly dollarized.
The minimum loan duration is one year, and the maximum duration is seven years, with the exception of loans targeting the energy industry and horticulture projects where the loan duration can go up to 10 years, including the grace period. The grace period usually ranges between six months and one year.
The interest rate on Kafalat loans is 40 percent of the Lebanese one-year Treasury Bill yield plus 3 percent in L.L. and one-year LIBOR plus 5.5 percent in USD. For both L.L. and USD borrowing, a 4.5 percent subsidy is paid at the end of each quarter. So for a USD Kafalat loan for example, the net interest rate to the borrower is 1.55 percent as 4.5 percent are deducted from the overall interest rate of 6.05 percent, which is the sum of the current one-year LIBOR rate of 0.55 percent plus the 5.5 percent margin. This is an attractive proposition, although the commission and other related fees add to the final cost.

Labor Market and Youth Capacity Assessment 76
Although overall, bank lending to the private sector has been growing steadily, the various Kafalat programs have been used less recently. The reason of the lower supply from Kafalat is a shortage in its financial resources.
Table 48. New Guarantees Issued by Kafalat 2012 2013 2014
Value (USD M) 140 119 111 Number 1,162 908 842
Source: Kafalat
Occupations and skills in demand The primary issue plaguing Lebanon’s labor market seems to be more on the labor demand side. Labor demand is derived demand, which means that it depends on both the level and structure of production determined by economic and institutional policies.
To determine which occupations, skills and qualifications are in demand, and what experience and gender are specified, InfoPro researched the classifieds, including sources such as hirelebanese.com, bayt.com, jobs.com.lb, and Al Waseet.
Occupations in demand The ten most common positions available in the classifieds are listed below. They reflect only part of the demand as they do not include word-of-mouth matches. The most frequent listings were for sales positions. This matches the result of the Greater Beirut Labor Market Demand Survey of 2008 where salespeople were also found to be most in demand by companies. In that survey, nearly all companies requiring salespeople indicated that they faced difficulties in recruiting them, citing lack of skills, lack of availability, and lack of experience as the top three reasons.
Table 49. Ten Most Common Positions Available in Job Listings Type of Position Absolute number Percentage of all listed jobs Salesperson 646 19% Administrative position 429 13% Accountant 281 8% IT professional 166 5% Waiter/Waitress, Barista 166 5% Driver or Machine Operator 148 4% Engineer 130 4% Beautician or hairdresser 108 3% Chef 99 3% Marketing officer 96 3% Total top 10 2,269 67% Other 1,095 33% Grand Total 3,367 100% Excludes 49 unspecified multi-position listings Source: Classifieds Research

Labor Market and Youth Capacity Assessment 77
Recruitment agencies provided their top categories of current job vacancies by economic sub-sector. The jobs they mentioned are similar to those in the job listings, with sales personnel topping the list.
The lack of plumbers, electricians, and technicians was also observed by a learning center manager. Vacancies in the hospitality sector are noticeably absent from the recruiters’ lists. This is probably because the companies in this sector are not using the services of recruitment agencies.
Table 50. Top Job Vacancies Listed by Recruitment Agencies Type of Job Position Administration Administrative Assistant HR Accountant Financial Analyst Financial Manager Auditing Sales Salesperson (mostly indoor but also outdoor) Sales Executive Sales Manager Account Executive E-marketer Community Manager (social media) IT and Design IT/Software Development Printing and design Building and Construction Electrical Technicians Plumber Mechanical Technician Mechanical Engineer Civil Engineer Architect
Source: Interviews with four recruitment agencies According to interviewed recruiters, the hardest jobs to fill are administrative and sales positions, as well as drivers, technicians, and quality controllers. One recruiter explained that he found the positions of driver and administrative assistant difficult to fill because there are no fixed criteria for these positions.
It can be difficult for recruiters to fill jobs in sales due to the lack of professionalism of applicants. Technical personnel is lacking at all levels of experience because people with this profile are simply unavailable. In addition, recruitment agents sometimes have difficulty finding suitable candidates for entry level positions in general.

Labor Market and Youth Capacity Assessment 78
Table 51. Hardest Jobs to Fill According to Recruitment Agencies Executive Secretary Personal Assistant
Administrative Assistant Receptionist
Sales, particularly Indoor Sales Woman Driver
Technical: Machine Operator, Technician, Maintenance Quality Controller
Source: Interviews with four recruitment agencies Sales are also mentioned frequently by recruiters as the specialization for which there is a lack of labor. One HR agency indicated that 60 to 70 percent of employer requests are for salespeople, not all of whom can be met. Both salesmen and saleswomen are high in demand, but there is a greater lack of women. In the administrative segment, there are too few secretaries with good language skills.
Community Management and Social Media Management is a new specialization with worldwide demand where there is a lack of candidates. It involves several disciplines including journalism, IT and communication and largely relies on a person's own initiative, engaging people as young as 16. However, it is not being taught formally at any institute because it is still not well defined.
Table 52. Specializations for which there is a Lack of Labor According to Recruitment Agencies Indoor Sales (Woman)
Outdoor Sales Secretary
Community Management / Social Media Management Mason (Foreman)
Beautician Quality Controller
Health, Safety & Environment (HSE) Planner, Planning Engineer
Quantity Surveyor Source: Interviews with four recruitment agencies According to a learning center manager, the specializations for which there are an insufficient number of job vacancies to accommodate all graduates, resulting in a surplus of labor, include nutrition, interior design, and communications engineering. The sectors and positions where labor supply and demand is more or less evenly matched are telecom, web design, administrative assistant, and accountant.
Skills and qualifications in demand In InfoPro’s Greater Beirut Labor Market Survey of 2008, companies identified worker qualifications and skills as the two most important issues when hiring local workers. Two-thirds rely on qualifications, while just under half indicated that they also rely on skills.
The job positions in the classifieds reviewed reflect a higher skill set and level of education than the overall labor market. This is because recruitment in newspapers and online are more formal methods than word

Labor Market and Youth Capacity Assessment 79
of mouth. Research has shown, the matching process becomes more formalized with increasing skill level. A third of job listings do not mention skills at all.
Four recruitment agencies were interviewed to find out about the skills that are demanded the most by employers. As recruitment agencies are also among the formal matching methods, the skill level of the jobs they make available is relatively high, even above that reflected in listings. Recruitment agencies are often contacted by companies looking to fill managerial positions.
The skills that employers require most often are English language skills, followed by French language skills. Recruiters noted that a good level of English in particular is often difficult to find among applicants. Employers value communication skills in general. IT skills are also a must for many companies, especially familiarity with Microsoft Office, as are administrative skills.
In addition, prospective employers look for candidates that are ethical, committed, hard-working, sociable, and ambitious. Some job candidates lack behavioral competencies, especially the ability to work under pressure. Recruiters also observed that the Lebanese youth are disconnected from hands-on and practical work. This is probably due to their mostly receiving candidates with academic diplomas.
Language and IT skills
Language skills were mentioned in 28 percent of job listings reviewed. Where language requirements are stated, multiple languages are usually wanted.
Table 53. Number of Languages Demanded in Listings That Mention Language Skills Number of Languages Absolute Number Percentage One language 277 29% Two languages 282 30% Three languages 396 41% Total 955 100%
Source: Classifieds research In listings that mention language skills, 97 percent demand English skills, 59 percent Arabic and 57 percent French. This confirms the high priority that employers place on English skills that is reported by recruitment firms. In job listings that mention any kind of skills, 29 percent demand computer skills. This reflects what recruitment agencies are saying about employer requirements.
Education
Education is not mentioned in three-quarters of the job listings assessed by InfoPro. In many cases, this is because the position itself is indicative of a university education. As can be seen in the table below, demand is skewed towards university education because the classifieds and job search engines are used mostly by skilled and highly skilled job seekers.
Table 54. Education Most in Demand in Job Listings that Mention Education Degree Absolute Number Percentage Baccalaureate 40 4.5% Technical Education (BT/BP, TS, LT) 63 7.0% University Education (Bachelor’s or Master’s Degree) 570 63.5%

Labor Market and Youth Capacity Assessment 80
Unspecified Baccalaureate, University or Technical Education 2 0.2% Unspecified University or Technical Education 236 26.3% Total 911 101.4% Multiple responses for specified Baccalaureate, Technical, and University Education lead to some duplication in these items Source: Classifies Research The recruitment agencies interviewed provided information about the preferences of companies with regard to the educational level of applicants. They indicated that companies mostly ask for someone with a BS or a BA, especially in the areas of Accounting and Finance, where they are preferred over a BT or TS qualification. Another agency mentioned that employers demand applicants that hold a university degree or a vocational certificate. For industrial specialties, a BT or TS is usually sufficient. However, a diploma is just a starting point. One recruiter noted that it is not the diploma that is getting the candidate the job, it is his personality.
Experience required Half of reviewed job listings do not mention experience. In over a third of listings where experience is mentioned, the exact amount of experience is not specified. As can be seen in the chart below, usually one to two years of experience are needed. This is similar to the indications of interviewed recruitment agencies, who find that employers usually require candidates for junior positions to have two to three years of experience. It is therefore not surprising that youth in focus groups cite the lack of experience as the main obstacle to finding a job.
Source: Classifieds Research
0%
5%
10%
15%
20%
25%
30%
35%
40%
7%
28%
15%
10%
2% 2% 0.1% 1% 0.1% 0.1%
35%
Minimum Experience Demanded in Job Listings

Labor Market and Youth Capacity Assessment 81
The level of experience that is in demand can also be inferred from the age of job applicants that companies prefer. According to recruitment agents interviewed by InfoPro, that age lies between 25 and 33. That is old enough to have some experience, and young enough to be paid less than someone in a senior position.
Gender specification Gender was mentioned in two-third of listings analyzed by InfoPro. Among these listings, close to half specify either a male or female applicant. This is a sign of the high degree of gender segregation in labor.
Table 55. Gender Specification in Job Listings that Mention Gender Gender Absolute Number Percentage Either Gender 1,225 54% Female 657 29% Male 395 17% Grand Total 2,277 100%
Source: InfoPro research of classifieds
The interviews that InfoPro conducted with 73 companies yielded a similar result. When asked whether the company prefers to hire men respectively women for certain occupations, 34 percent confirmed that this applies in most cases, 26 percent sometimes, 10 percent rarely, 27 percent never, and three percent did not know.
Mapping of subsectors for the private sector survey As per the objectives of the study, the mapping of subsectors started with the pre-selection of 15 sub-sectors that employ many skilled workers and that have future potential for growth. The basis of the pre-selection was desk research, with an emphasis on the importance of the sector to the national economy.
Table 56. Pre-selected Sub-sectors Agro-alimentary and beverages
Textiles and leather Paper and paperboard
Printing and editing Non-metal products
Metal products and jewelry Furnishing and carpentry
Renewable energy Oil and gas
Building and construction Sale and maintenance of vehicles
Hotels and restaurants Auxiliary transport activities
Health and social action Hairdressers and beauticians

Labor Market and Youth Capacity Assessment 82
Scores from 1 to 10 were assigned to each subsector for seven criteria, based on indicators specific to each criterion. The results for each criterion are discussed in the following section.
Table 57. Mapping Methodology Criterion Indicator/Source Contribution to GDP VAT returns of 2010 from the Ministry of Finance Number of skilled workers Subsector data of skilled worker percentages or absolute numbers
from the ILO or from worker syndicates Percentage of skilled workers
Future growth potential Privileged sectors resistant to political instability with a high share of job creation, expansion of companies and a large share of exports as
per CAS statistics and InfoPro studies Number of companies Number of companies with five or more employees and number of
companies with more than 100 employees from InfoPro company databases Number of large companies
Labor demand InfoPro research of 3,416 job listings in the classifieds, of which 37%
were outside the covered sub-sectors and 40% were excluded because the sub-sector could not be determined.
Criteria
Contribution to GDP
The contribution to GDP of each sub-sector was determined on the basis of Ministry of Finance VAT statistics of sales turnover. Oil and gas scored the highest due to the high value and turnover of the commodities traded in this sector. The agro-alimentary and beverages sectors are also at the top of the list because they constitute a large part of industrial output.
Table 58. Sub-sector Contribution to GDP
Sub-sector
Sales Turnover (LL BN) in
2010
% of Total Sales in
2010
Contribution to GDP Score
Oil and gas 14,076 17.02% 10 Agro-alimentary and beverages 10,447 12.63% 7 Sales and maintenance of vehicles and motorbikes 4,050 4.90% 3
Non-metal products 3,177 3.84% 2 Building and construction 2,890 3.50% 2 Textile and leather 2,530 3.06% 2 Metal products and jewelry 2,228 2.69% 2 Auxiliary activities with transport 1,861 2.25% 2 Hotels and restaurants 1,770 2.14% 2 Health and social action 1,453 1.76% 1 Printing and editing 715 0.86% 1 Paper and paperboard 489 0.59% 1

Labor Market and Youth Capacity Assessment 83
Furnishing and carpentry 351 0.42% 1 Renewable energy 61 0.07% 1 Hairdressers and beauticians 13 0.02% 1 Grand Total 46,112 55.77%
Source: Ministry of Finance VAT statistics of sales turnover by ISIC activity code digit 4
Number and share of skilled workers
The definition of skilled production workers by Gallup states: “These workers are skilled in that they have some special knowledge or (usually acquired) ability in their work. A skilled worker may have attended a college, university or technical school, where they acquired knowledge directly applied in their work responsibilities. Or, a skilled worker may have learned his skills on the job.” It does not include employees above the working-supervisor level. InfoPro considered both the absolute number and share of skilled workers in the total number of workers for each subsector.
Number of skilled workers The number of skilled workers is high in the agro-alimentary and beverages sectors, hairdressers and beauticians, textile and leather, and hotels and restaurants sectors, mostly because these sectors employ a large number of people.
Table 59. Number of Skilled Workers by Sub-sector
Sub-sector Number of Skilled Workers
Number of Skilled Workers Score
Agro-alimentary and beverages 12,350 10 Hairdressers and beauticians 11,880 10 Textile and leather 6,505 6 Health and social action 6,499 5 Building and construction 5,131 4 Paper and paperboard 3,508 3 Renewable energy 3,483 3 Non-metal products 2,708 3 Furnishing and carpentry 2,618 3 Metal products and jewelry 2,429 2 Oil and gas 1,814 2 Auxiliary activities with transport 1,014 1 Printing and editing 999 1 Sales and maintenance of vehicles and motorbikes 603 1
Agro-alimentary and beverages 12,350 10 Source: ILO, ICA, Syndicates, InfoPro
Share of skilled workers The ranking is different if the share of skilled workers in the total number of workers is considered. These shares are high in the oil and gas and renewable energy sectors, but since these sectors employ relatively few people overall, the absolute numbers of skilled workers are quite low.

Labor Market and Youth Capacity Assessment 84
It should be noted that in the oil and gas sector, gas station attendants who are usually unskilled Egyptian, Syrian, Sudanese or Bangladeshi workers that are often employed without social security registration, are not included in the employee head count.
Table 60. Percentage of Skilled Workers by Sub-sector
Sub-sector Percentage of Skilled Workers
Percentage of Skilled Workers
Score Oil and gas 80% 10 Renewable energy 77% 9 Hairdressers and beauticians 54% 7 Non-metal products 37% 5 Agro-alimentary and beverages 35% 4 Furnishing and carpentry 30% 3 Health and social action 28% 3 Hotels and restaurants 26% 3 Paper and paperboard 25% 3 Textile and leather 20% 2 Auxiliary activities with transport 17% 2 Sales and maintenance of vehicles and motorbikes 16% 2
Building and construction 15% 2 Metal products and jewelry 13% 2 Printing and editing 9% 1
Source: ILO, ICA, Syndicates, InfoPro
Future potential for growth
Our assessment of the future growth potential for each subsector is based on a combination of factors. Sectors resistant to political instability with a high share of job creation, expansion of companies and a large share of exports were favored.
As shown in the table below, private sector labor demand is concentrated in wholesale and retail trade, motor vehicle repair, transportation and storage. This means that the jobs that the economy has created are mostly in low- productivity sectors that employ mainly low-skilled workers. At the same time, labor demand in the higher productivity sectors such as IT, financial and insurance, and scientific jobs are on the decline.
Table 61. Employment Growth by Sector
Sector Number of Jobs in 2009
Net Job Creation 2004 - 2009
Share of Net Job Creation
Agriculture 80,129 -3,216 -2% Industry 153,129 -12,664 -8% Construction 113,579 16,753 10% Trade 343,066 98,645 61% Transport, post & telecommunication 85,955 3,109 2%

Labor Market and Youth Capacity Assessment 85
Services 468,160 53,832 33% Financial intermediation & Insurance 25,362 5,162 3% Other 480 111 0% Total 1,269,860 161,732 100% Source: CAS 2009
Another indicator of which sectors are hiring is the expansion intentions of companies, shown below.
Source: Greater Beirut Labor Market Demand Survey 2008
A high share of exports also contributes to a sector’s expansion and its demand for workers.
Table 62. Value of Industrial Exports by Sector in 2014 Type of Export Value (USD million) Machinery and mechanical appliances 711 Food Products 529 Chemical products 520 Base metals 378 Paper products 211 Pearls and precious metals 162 Plastics 144 Source: Ministry of Industry
50%
52%
54%
56%
58%
60%
62%
64%
66%
68%
Services andMaintenance
Construction Trade andCommerce
Manufacturing andDevelopment
66%65%
63%
56%
Company Expansion Intentions by Sector
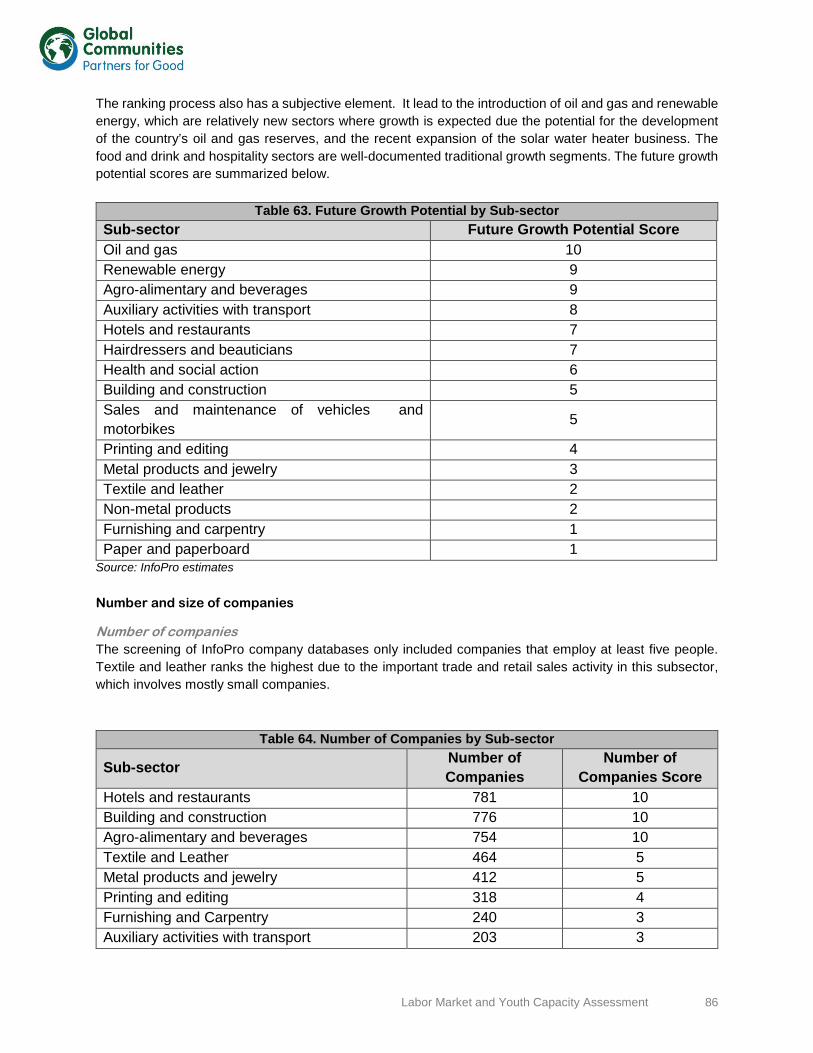
Labor Market and Youth Capacity Assessment 86
The ranking process also has a subjective element. It lead to the introduction of oil and gas and renewable energy, which are relatively new sectors where growth is expected due the potential for the development of the country’s oil and gas reserves, and the recent expansion of the solar water heater business. The food and drink and hospitality sectors are well-documented traditional growth segments. The future growth potential scores are summarized below.
Table 63. Future Growth Potential by Sub-sector Sub-sector Future Growth Potential Score Oil and gas 10 Renewable energy 9 Agro-alimentary and beverages 9 Auxiliary activities with transport 8 Hotels and restaurants 7 Hairdressers and beauticians 7 Health and social action 6 Building and construction 5 Sales and maintenance of vehicles and motorbikes 5
Printing and editing 4 Metal products and jewelry 3 Textile and leather 2 Non-metal products 2 Furnishing and carpentry 1 Paper and paperboard 1
Source: InfoPro estimates
Number and size of companies
Number of companies The screening of InfoPro company databases only included companies that employ at least five people. Textile and leather ranks the highest due to the important trade and retail sales activity in this subsector, which involves mostly small companies.
Table 64. Number of Companies by Sub-sector
Sub-sector Number of Companies
Number of Companies Score
Hotels and restaurants 781 10 Building and construction 776 10 Agro-alimentary and beverages 754 10 Textile and Leather 464 5 Metal products and jewelry 412 5 Printing and editing 318 4 Furnishing and Carpentry 240 3 Auxiliary activities with transport 203 3

Labor Market and Youth Capacity Assessment 87
Non-metal products 173 3 Health and social action 143 2 Sales and maintenance of vehicles and motorbikes 126 2 Paper and paperboard 80 1 Oil and Gas 66 1 Hairdressers and beauticians 44 1 Renewable energy 20 1
Source: InfoPro databases
Number of large companies Large companies are defined as those that employ over 100 people. Most of these are found in the hospitality and food and beverages sectors.
Table 65. Large Companies by Sub-sector
Sub-sector Companies with more than 100
employees
Number of Large Companies Score
Hotels and restaurants 71 10 Agro-alimentary and beverages 66 9 Building and construction 64 9 Health and social action 62 9 Metal products and jewelry 36 5 Textile and leather 34 5 Printing and editing 25 4 Non-metal products 16 3 Furnishing and carpentry 15 3 Paper and paperboard 12 2 Auxiliary activities with transport 11 2 Sales and maintenance of vehicles and motorbikes 6 1
Renewable energy 4 1 Oil and gas 3 1 Hairdressers and beauticians 0 1
Source: InfoPro databases
Labor demand
Labor demand was derived from the InfoPro research of classifieds. These reflect only a part of the overall demand as they do not include word-of-mouth matches.
Table 66. Labor Demand by Sub-sector
Sub-sector Percentage of Job Listings
Labor Demand Score
Hotels and restaurants 32% 10 Building and construction 14% 5

Labor Market and Youth Capacity Assessment 88
Agro-alimentary and beverages 12% 4 Textile and leather 10% 3 Health and Social Action 6% 2 Printing and editing 5% 2 Metal products and jewelry 4% 2 Non-metal products 3% 1 Auxiliary activities with transport 3% 1 Sales and maintenance of vehicles and motorbikes 3% 1 Hairdressers and beauticians 3% 1 Furnishing and carpentry 2% 1 Paper and paperboard 1% 1 Renewable energy 0.4% 1 Oil and gas 0.3% 1
Source: Classifieds Research

Labor Market and Youth Capacity Assessment 89
Overall mapping results
The overall mapping results are shown below. Companies of the top three sectors were targeted for the corporate interviews.
Table 67. Overall Mapping Results
Subsectors Contribution to GDP
Number of skilled
workers
% of skilled workers
Future growth
potential
Number of companies
Number of large
companies
Labor demand Total Score
Agro-alimentary and beverages 7 10 4 9 10 9 4 53
Hotels and restaurants 2 8 3 7 10 10 10 50 Building and construction 2 4 2 5 10 9 5 37 Oil and gas 10 2 10 10 1 1 1 35 Textile and leather 1 6 3 6 2 9 2 29 Health and social action 1 10 7 7 1 1 1 28 Hairdressers and beauticians 2 6 2 2 5 5 3 25 Renewable energy 1 3 9 9 1 1 1 25 Metal products and jewelry 2 2 2 3 5 5 2 21 Printing and editing 2 3 5 2 3 3 1 19 Auxiliary activities with transport 2 1 2 8 3 2 1 19
Non-metal products 1 1 1 4 4 4 2 17 Furnishing and carpentry 1 3 3 1 3 3 1 15 Sales and maintenance of vehicles and motorbikes 3 1 2 5 2 1 1 15
Paper and paperboard 1 3 3 1 1 2 1 12

Labor Market and Youth Capacity Assessment 90
Interviewed companies
Company profile The 76 companies that were interviewed by InfoPro were all in the top three sectors identified in the mapping exercise, namely agro-alimentary and beverages, hotels and restaurants, and building and construction. The sub-sectors in which the companies are active are shown below.
Source: Interviews with 76 companies
A total of 41 percent of interviewed companies had no other corporate facilities (such as branches, factories, or warehouses) other than the head office. Another 21 percent had one other facility. Among those companies that had facilities other than the head office, the average number of those facilities was six. The other corporate facilities are mostly located in the region of Beirut, Metn, or Kesrouan.
Most of the interviewed companies are large in terms of staff. The average number of employees is 258.

Labor Market and Youth Capacity Assessment 91
Source: Interviews with 76 companies
Employee profile Company interviews showed that most employees are male, local, and work full time. This profile is even more prominent among the skilled workers, who make up just over half of employees.
Table 68. Share of Skilled Workers at Interviewed Companies – by Sector Sector Percentage of skilled workers Number of companies
Hotels and restaurants 59% 34 Agro-alimentary and beverages 54% 16 Building and construction 46% 26 Total 54% 76
Source: Company interviews
A total of 18 percent of the interviewed companies employed no skilled women, while only one percent does not employ women at all. Building and construction is the sector that employs the fewest women.
Small ( from 5 to 20 Employees)
1%
Medium ( from 21 to 100 Employees)
37%
Large ( More than 100 Employees)
62%
Size of the Interviewed Company

Labor Market and Youth Capacity Assessment 92
Table 69. Gender Ratio of Workers at Interviewed Companies – by Sector Male Female
Hotels and restaurants Skilled Workers 74% 26% All Employees 71% 29%
Agro-alimentary and beverages Skilled Workers 75% 25% All Employees 73% 27%
Building and construction Skilled Workers 90% 10% All Employees 84% 16%
Total Skilled Workers 80% 20% All Employees 76% 24%
Source: Interviews with 76 companies
A total of 38 percent of companies have no skilled foreigners on their staff, compared to 16 percent that have no foreigners at all. In each of the sectors, the proportion of locals is higher in the skilled workforce than in the overall workforce, which is probably due to the majority of foreign workers being unskilled. The building and construction sector employs the highest share of foreigners.
Table 70. Nationality Ratio of Workers at Interviewed Companies – by Sector Local Foreign
Hotels and restaurants Skilled Workers 91% 9% All Employees 84% 16%
Agro-alimentary and beverages Skilled Workers 81% 19% All Employees 78% 22%
Building and construction Skilled Workers 74% 26% All Employees 68% 32%
Total Skilled Workers 83% 17% All Employees 78% 22%
Source: Interviews with 76 companies
With regards to part-time workers, there are differences between the sectors. In the hospitality sector, there are few part-time employees, but many of these are found among skilled employees. In the food and beverage (F&B) sector, almost none of the skilled employees work part-time.
Table 71. Full-time to Part-time Ratio of Workers at Interviewed Companies – by Sector Full-time Part-time
Hotels and restaurants Skilled Workers 87% 13% All Employees 95% 5%
Agro-alimentary and beverages Skilled Workers 98% 2% All Employees 95% 5%
Building and construction Skilled Workers 91% 9% All Employees 88% 12%
Total Skilled Workers 90% 10% All Employees 89% 11%
Source: Interviews with 76 companies

Labor Market and Youth Capacity Assessment 93
One in five interviewed companies did not find any skill gaps among their skilled employees. Agro-alimentary and beverages businesses had the best opinion of the skill level of their workers, and hotels and restaurants the worst.
The skills that were lacking or could be reinforced are often job-specific technical skills, for example the operation of certain machines, especially in the area of building and construction. Knowledge of safety and security standards is also an issue in this sector.
In the hospitality sector in particular, many companies found that their skilled employees have gaps in language skills, especially English. Their communication, customer service, and other soft skills were also frequently found lacking. The other soft skills category in the table below includes the ability to handle pressure, a sense of responsibility, savoir-vivre, positive body language techniques, learning and listening skills, problem solving skills, team spirit and social interaction skills.
Although not a skill, a positive attitude was identified as lacking among employees, especially in the hospitality sector. Similarly, ambition was also seen as lacking, in particular in F&B.
Table 72. Skill Gaps Among Skilled Workers – by Sector
Agro-alimentary and beverages
Hotels and restaurants
Building and construction Total
None 38% 9% 27% 21% Job-specific technical skills 28% 12% 40% 20% English language skills 12% 24% 15% 18% Other soft skills 7% 33% 12% 18% Communication skills 6% 21% 12% 14% Customer service skills 6% 18% 12% 13% General language skills 12% 18% 0% 9% Computer and technologies skills 6% 12% 8% 9% Analytical skills 0% 12% 4% 7% Knowledge of safety and security standards
6% 0% 15% 7%
Performance skills 12% 3% 4% 5% Hygiene 6% 6% 0% 4%
Multiple Response Question Source: Interviews with 76 companies
Recruitment Recruitment is usually due to an increase or a change in the business of the company, or to replace workers who quit, retire, or are promoted. The sector segmentation of company data shows that an increase in business volume largely determines recruitment in building and construction, while it is at the same level as the replacement of departing staff in hotels and restaurants, and less important in the agro-alimentary and beverages business.

Labor Market and Youth Capacity Assessment 94
Multiple Response Question Source: Interviews with 76 companies
Number and profile of job openings for skilled workers
A quarter of interviewed companies currently do not have any job openings. Those companies that are looking to employ have an average of five vacant positions.
Table 73. Job Openings at Interviewed Companies - by Sector
Agro-alimentary and beverages
Hotels and restaurants
Building and construction Total
No job openings 25% 18% 31% 25% No job openings that require skilled workers 31% 18% 46% 32%
Source: InfoPro interviews with 53 companies recruiting skilled workers
Interviewed companies have more unskilled than skilled jobs available, especially in the building and construction subsector. Close to a third of interviewed companies currently do not have vacancies for skilled workers. The companies that are hiring have an average of four job openings for skilled workers.
Hotels and restaurants have the highest number of job vacancies, chief among them the position of waiter. Most of the positions for which there are many vacancies only require a Technical Baccalaureate and a minimum of experience.

Labor Market and Youth Capacity Assessment 95
Table 74. Top 15 Open Job Positions for Skilled Workers at Interviewed Companies - Ranking by Number of Open Positions
Type of Position Most common minimum education required
Average number of years of experience
required
Total number of open job positions
Waiter Technical Baccalaureate – BT 1 259 Steward Baccalaureate 2 90 F&B Waiter Technical Baccalaureate – BT 0.3 75 Runner Technical Baccalaureate – BT 0.2 65 Assistant Chef Technical Baccalaureate – BT 1 65 Bartender Technical Baccalaureate – BT 2 51 Hostess Technical Baccalaureate – BT 1 44 Commis Chef Technical Baccalaureate – BT 1 39 Chef de Rang No secondary education 3 28 Carpenter Vocational Certificate – BP 4 26 Cashier Technical Baccalaureate – BT 1 26 Headwaiter Baccalaureate 2 25 Painter No secondary education 2 22 Phone Operator Baccalaureate 1 20 Kitchen Chef No secondary education 3 19 Electrical Technician
Technical Baccalaureate – BT 3 17
Source: Interviews with 53 companies recruiting skilled workers
Company data shows that experience is sought especially in the building and construction sector. The jobs that require the most experience are foreman, steel fixer, planner, quality control officer, plumbing technician, carpenter, and accountant, followed by chef.
The types of positions that demand the highest education are spa therapist, salesperson, accountant, and data entry operator which usually require a university degree, followed by foreman, steward, headwaiter, indoor salesperson, cash van, and phone operator, where the Baccalaureate is the most common minimum education requirement.
The skills that the recruiting companies are looking for in skilled job applicants, shown in the chart below, closely resemble the skills that companies identified as missing among their skilled staff. The detailed job openings and skills required by interviewed companies in each sector are detailed in Tables 121 to 124 in the Appendix.

Labor Market and Youth Capacity Assessment 96
Multiple Response Question Source: Interviews with 53 companies recruiting skilled workers
Recruitment process
For most companies, the technical skills of job applicants and the theoretical knowledge acquired in school are sometimes in line with the company’s expectations. Results for both resemble those for the attitudes of job applicants. Candidates most often conform to company expectations in the building and construction sector.
Job applicants tend to be realistic about the working conditions being offered and usually do not have issues with the social image associated with the job. However, they are sometimes deceived about the wage that they could earn in the job to which they are applying. The sector where the gap between applicant expectations and actual working conditions is the widest is in the hospitality sector. It is the sector with the highest share of candidates who have issues with the social image associated with the job. That probably explains why one in five hospitality companies find that their skilled workers are lacking a positive attitude.

Labor Market and Youth Capacity Assessment 97
Table 75. Company and Job Applicant Expectations in the Recruitment Process In most cases
Some-times Rarely Never Do not
know The theoretical knowledge (gained through education) of job applicants is in line with company expectations
28% 46% 21% 4% 0%
The technical skills of job applicants are in line with company expectations 28% 55% 16% 1% 0%
The attitudes of job applicants are in line with company expectations 33% 42% 24% 1% 0%
Wage expectations of job applicants are above the wage offered 37% 34% 22% 7% 0%
Job applicants expect unrealistic working conditions (time at work / leave etc.) 13% 26% 41% 20% 0%
Job applicants have issues with the social image associated with the job 17% 20% 26% 36% 1%
Source: Interviews with 76 companies
Trial periods are very common, and tests are also a normal part of the recruitment process at many recruiting companies, especially in F&B and hospitability. Regardless of the sector, recruitment practices often tend to be gender-specific, and usually discriminate against people with disabilities.
Table 76. Company Recruitment Practices In most cases
Some-times Rarely Never Do not
know The company runs practical/theoretical tests as part of the recruitment process 54% 21% 8% 17% 0%
New recruits have a trial period to confirm they have the right skills for the job 83% 4% 1% 12% 0%
The company prefers to hire men / women for certain occupations 33% 26% 11% 28% 3%
The company hires persons with disabilities 5% 25% 32% 38% 0% Source: Interviews with 76 companies
Like for the labor market overall, personal contact (in particular in FNB and construction) and word of mouth are still among the major recruitment method. However, electronic tools are becoming more important, including social media (especially in the hospitality sector), the company website, and online job search engines. Newspapers are still commonly used for placing job ads for the hospitality sector, but not so much in the other sectors.

Labor Market and Youth Capacity Assessment 98
Multiple Response Question Source: Interviews with 76 companies
Internal and external HR professionals are more often used by companies in the agro-alimentary and beverages sector relative to the other sectors. This corresponds to the information given by private recruitment agencies, which say that they are rarely approached by hotels or restaurants, and often do not provide personnel to the building and construction sector below the level of engineer or architect.
An interviewed recruitment agent confirmed that the role of recruitment agencies is declining as companies increasingly reach out to potential candidates through Facebook, LinkedIn, as well as company or recruitment websites. The agent also remarked that for the employment of skilled workers, companies tend to contact professional schools and rely on word of mouth through their own workforce.
Difficulties in recruitment
Three-quarters of companies face recruitment difficulties. The main issues identified by company management are a mismatch in qualifications and skills required for the job, followed by a lack of basic skills. Since qualifications and skills are the main hiring criteria for companies, the problem is truly fundamental. The main difficulties that companies face in recruiting professionals and skilled workers are related to the lack of experience and certain skills rather than the lack of qualifications. This is followed by job applicants demanding a higher salary than allocated. The lack of the required diplomas can also be an obstacle in recruitment, especially of skilled workers.

Labor Market and Youth Capacity Assessment 99
Source: Greater Beirut Labor Market Demand Survey 2008 About half of the companies interviewed had vacancies that are proving hard to fill, but there are large variations between sectors. The hospitality sector is the most affected with close to two-thirds of companies unable to fill available positions, especially that of waiter, probably because it is the job position that is the most in demand, and turnover is high. Four of the 14 interviewed agro-alimentary and beverages companies and 11 out of the 25 building and construction firms also have positions that are hard to fill.
Table 77. Vacancies that are Difficult to Fill at Interviewed Companies - by Sector
Agro-alimentary and beverages
Hotels and restaurants
Building and construction Total
Types of positions that are hardest to fill (in descending order)
Machine Operator, Driver, Electrical
Technician
Waiter, Receptionist, Assistant Chef Carpenter
Number of companies 6 21 12 39 Source: Company interviews
Three-quarters of companies did not mention any newly emerging tasks or skills for which they did not find the right candidates. The new skills that were stated most frequently referred to green business and technology (including solar PV), IT skills such as the knowledge of specific software, food preparation and technologies, as well as soft skills such as communication and marketing.
Companies differed in their evaluation of the impact of the lack of required skills on their business, but it tends to be the lowest in the F&B sector and the highest in the hospitality sector.
0%
5%
10%
15%
20%
25%
30%
35%
40%
Mismatch betweenqualifications and skills
Lack of basic skills Mismatch betweendemanded and offered
salaries
Aptitude problems Lack of availability
38%
24%
16% 15%
12%
Recruitment Difficulties Faced by Companies

Labor Market and Youth Capacity Assessment 100
Table 78. Rating of the Impact of the Lack of Required Skills on the Company’s Business – by Sector
Agro-alimentary and beverages
Hotels and restaurants
Building and construction Total
Number of
Companies
Very Low 19% 6% 15% 12% 9 Low 19% 29% 31% 28% 21 Medium 50% 24% 38% 34% 26 High 0% 24% 4% 12% 9 Very High 12% 18% 12% 14% 11
Source: InfoPro interviews with 76 companies
Company coping strategies for recruitment difficulties
The main strategies for companies to cope with the lack of applicants with the right skills profile is to upgrade their existing staff through training and promotion, and to redistribute tasks internally. Partnering with education institutions to ensure that new graduates better suit the company’s needs is also a common approach, especially in the hospitality sector, but also for four out of five interviewed renewable energy companies
Another solution is to recruit people at a lower level and train them on the job. Increasing wages or benefits in order to attract the right candidate is also an option, except in the agro-alimentary and beverages sector.
Table 79. Company Coping Strategies if no Recruits with the Appropriate Skills Profile are Found
Yes No Do not know
Not applicabl
e Internal staff promotion with additional training 92% 8% 0% 0% Sharing of tasks among company employees 83% 16% 1% 0% Recruiting at a lower level and training the recruit on the job 76% 23% 1% 0%
Partnering with education institutions to ensure that new graduates better suit the company’s needs 62% 37% 0% 1%
Increasing starting wages in order to attract more applicants
53% 47% 0% 0%
Increasing benefits in order to attract more applicants 53% 47% 0% 0% Redefining competency requirements for the job offer 41% 56% 0% 3% Opening competition to new categories not previously considered (women, persons with disabilities) 43% 47% 0% 10%
Recruiting migrants with lower wage expectations 33% 66% 1% 0% Adopting previously untried recruitment methods 22% 78% 0% 0%
Source: Interviews with 76 companies
Recruitment of migrants is among the least popular solutions, particularly in the hospitality sector. Approaches that involve a change in thinking, such as opening the position to other types of applicants, or trying a different recruitment method, are not among the main coping strategies, especially not in the building and construction sector.

Labor Market and Youth Capacity Assessment 101
The alternative recruitment strategies that are tried usually involve intermediaries such as recruitment agencies, or headhunters who provide ground scanning. Overseas recruitment was also mentioned. Advertising the position in a newspaper or on the company website is another possibility. The methods that were mentioned only by one respondent each included job fair, internal recruitment, in-house HR, online recruitment agency, and collaboration with CHF.
Employment of foreign labor
Despite the availability of large numbers of foreign workers due to the Syrian crisis, there has been no major switch from Lebanese to foreign workers over the past year at the interviewed companies. Although Syrian refugees have lower wage and benefit requirements, they are not perceived as an attractive alternative skilled labor pool by employers, because most of them are considered unskilled. As shown in the table below, most foreigners are employed in menial tasks that can be accomplished by unskilled workers.
Table 80. Positions of Foreign Workers – by Sector Agro-alimentary
and beverages Hotels and restaurants Building and construction
Main positions (in descending order) Unskilled
Laborer, Cleaner
Cleaner, Assistant Chef, Housekeeper,
Driver
Unskilled Laborer, Foreman, Electrical Technician and
Cleaner Number of companies 14 28 23
Source: Interviews with 65 companies that employ foreign workers
Employment trends of foreigners vary widely among the interviewed companies. The overall result is a small net increase in the employment of foreign labor for the F&B and construction sectors, and a larger net decline for the hospitality sector. According to estimates by the Lebanese Contractors Syndicate, the building and construction sector currently employs around 350,000 Syrian workers, who are distributed among 3,400 companies in both the private and public sectors. Unskilled labor in the construction sector consists almost entirely of Syrians. The construction sector has actually seen a spike due to number of projects being implemented by international organizations in response to the Syrian refugee influx, such as the construction or rehabilitation of houses, building of water tanks.
In the agricultural sector, Syrians have historically supplied the bulk of unskilled labor. Farmers and land owners interviewed stated that most of their unskilled labor were still Syrians. One farmer stated that some of the Syrian families were working for him prior to the crisis, but now in larger numbers (i.e. extended family has joined). Everyone interviewed agreed that due to the amount of international aid being provided to Syrians they are less likely to work than before, but at least one farmer has tried to provide additional incentives like on-site housing to encourage them to stay with him. In Bekaa Valley, a trader we interviewed stated he was hiring Bangladeshi unskilled labor instead of Syrians due to the fact they could receive three-year work permits and that they were considered a more stable workforce.
Due to increased poverty amongst Lebanese communities, there is now direct competition for some semi-skilled positions. An agro-food production facility interviewed said that while they used to hire Syrians, they no longer did because of the number of Lebanese and Palestinians that needed jobs, and hiring Syrians would increase already existing tensions. A mayor of a town in the South told interviewers that employers that hire Syrians instead of Lebanese for certain jobs would be negatively viewed by local communities. However, ultimately, as foreign workers are at the bottom of the employee ranking, they are likely to be among the first to be let go in case business declines.

Labor Market and Youth Capacity Assessment 102
Wages Data from company interviews reflects the low skill premium in the local labor market. Excluding the premium put on experience, only about half of skilled employees with a formal education have a better salary compared to those employees without a formal education, mostly at agro-alimentary and beverage businesses. In those companies that do pay a premium for skill, the salaries of skilled, educated workers are only 15 percent higher on average than those of their uneducated colleagues.
Table 82. Salaries of Skilled Workers Compared to Those of Unskilled Workers - by Sector
Agro-alimentary and beverages
Hotels and restaurants
Building and construction Total
Lower 0% 6% 8% 5% Same 56% 38% 40% 43% Higher 44% 47% 44% 45% Refused 0% 3% 0% 1% Do not know 0% 6% 8% 5% Number of Companies
16 34 26 76
Source: InfoPro company interviews
A ranking by salary (detailed in the Table Salaries by Type of Open Job Positions in the Annex) shows that the jobs held by building and construction professionals, as well as the positions of technicians and team leaders, are the best paid. These results conform to the wider sector salary data (refer to Salaries by Sector in the Annex).
In the F&B and hospitality sectors, over 60 percent of interviewed companies reported an increase of the average monthly salary to skilled workers since last year, but the situation was not as good in the building sector.
Table 83. Evolution of Average Monthly Salary of Skilled Workers - by Sector
Agro-alimentary and beverages
Hotels and restaurants
Building and construction Total
Increased 63% 62% 46% 57% Remained the same 37% 38% 50% 42% Do not know 0% 0% 4% 1% Number of Companies
16 34 26 76
Source: Company interviews
Gap analysis
Skill and training gaps
English language skills
Employers in each of the three reviewed sectors, as well as recruiters, technical and vocational institutes (TVIs) and learning centers (LCs) identified English language skills as one of the main skill gaps. It is a skill that is high in demand: nearly all job listings reviewed mention language skills ask for English.

Labor Market and Youth Capacity Assessment 103
Some young people are aware of this problem. One focus group participant mentioned that his insufficient English skills were behind him not being able to find a job. One TVI manager noted a general decline in linguistic skills in the younger generation, which he ascribes in part to the fact that students do not read. According to the Makhzoumi Foundation, most trainees have some English skills, but their level is not sufficient to allow students to express themselves well and communicate effectively.
To remedy this issue, the interviewee recommended that language classes start from a very young age, when a child enters school. Over half of the schools in Lebanon still use French as a language of instruction, especially in the public and subsidized sector. Many of the public school teachers are older and thus French-educated, so the higher demand for English is not being met by state schools.
The level of English being taught is also insufficient. A review of the Lebanese curriculum by the independent by the Lebanese Association for Educational Studies (LAES) found that English as a first foreign language subject fails to impart practical linguistic skills. LAES also found that English textbooks are weak in that they do not effectively convey the skills that should be taught.
In the overall system of education and at all levels, students are heading more towards English as a teaching language, and the rate of enrollment in French language programs has decreased. Language training for youth and adults who want to improve their proficiency is widely available at private and public educational institutions. However, only a few of these institutions are of a caliber to teach effectively, any many do not offer enough practical training.
Communication and other soft skills
The language gap is closely linked to general communication skills, which are another area where all stakeholders recognize that training is needed. Soft skills are crucial in the hospitality sector, and often lacking among employees. MFIs also underlined the importance of other soft skills training for young entrepreneurs, especially in the areas of behavior and attitude, management, as well as sales and marketing techniques.
Soft skills courses are not as readily available as language courses. They are not part of the teaching program at most TVIs, nor are they being offered at all LCs. New Horizons and Formatech provide such courses, but these might be unaffordable for young people, especially if they are unemployed. New Horizons noted that their soft skills trainees are mostly employed and want to get promoted or are looking to change jobs.
Technical and business skills
Technical training was also mentioned by youth as other skills that will help them to get hired after graduation, specifically, IT, AutoCAD, or electronics training. Companies interviewed by InfoPro also mentioned computer and technologies skill gaps among their employees, but these appear less frequently than other shortfalls. Technical and IT courses are widely available at learning centers. Formatech alone offers over 500 technical IT courses. MFI managers suggested that although young people often have the skills needed in their profession, they do not know how to practice it efficiently and turn it into a business. They need instruction on bookkeeping and business regulations and practices. MFI managers believe that such skills can be acquired from mentors or at TVIs or LCs.

Labor Market and Youth Capacity Assessment 104
Skill and training gaps by sector
Agro-alimentary and beverages In the F&B sector, over a third of employers interviewed by InfoPro did not find that their workers had any skill gaps. The technical skills that are sometimes missing specifically relate to the job. These include the operation of manufacturing machines and knowledge of food technologies. Language and soft skills like communication and customer service are also sometimes lacking. The ‘other soft skills’ category in the table below covers aspects like team spirit, professional consciousness, and honesty. Although it is not a skill, ambition was mentioned as lacking by three companies.
Table 84. Skill Gaps Among Skilled Workers in the by Agro-alimentary and Beverages Sector No skill gap among employees 38% Job-specific technical skills 28% Other soft skills 18% English language skills 12% General language skills 12% Performance skills 12% Communication skills 6% Customer service skills 6% Computer and technologies skills 6% Knowledge of safety and security standards 6% Hygiene 6%
Multiple Response Question Source: Interviews with 16 agro-alimentary and beverages companies
Hotels and restaurants In the hospitality sector, effective communication with clients and co-workers and good presentation are crucial. Soft skills are the most important in this sector. They include communication, customer service, and analytical skills listed below. The category of ‘other soft skills’ includes being able to handle pressure, positive body language technique, listening skills, problem solving skills, a sense of responsibility, savoir-vivre and being guest-oriented. In addition, a positive attitude was mentioned by interviewees in a fifth of cases, even though it is not really a skill.
Job-specific technical skills that hotels and restaurants miss among their skilled workers are knowledge of each job specification and of the Standard Service Sequence.
Table 85. Skill Gaps Among Skilled Workers in the Hotels and Restaurants Sector No skill gap among employees 9% Other soft skills 33% English language skills 24% Communication skills 21% Customer service skills 18% General language skills 18% Job-specific technical skills 12% Computer and technologies skills 12%

Labor Market and Youth Capacity Assessment 105
Analytical skills 12% Hygiene 6% Ambition 6% Performance skills 3%
Multiple Response Question Source: InfoPro interviews with 34 hotels and restaurants
Building and construction Job-specific skills are lacking the most among skilled workers in the building and construction sector. Examples are mechanical, electrical and plumbing skills, knowledge of sketches and drawings or of new construction or accounting software, operation of new machines, as well as cleaning and maintenance methods. Some companies also observed that a positive attitude or ambition was missing among their employees.
Table 86. Skill Gaps Among Skilled Workers in the Building and Construction Sector No skill gap among employees 27% Job-specific technical skills 40% English language skills 15% Knowledge of safety and security standards 15% Other soft skills 12% Communication skills 12% Customer service skills 12% Computer and technologies skills 8% Analytical skills 4% Performance skills 4% Ambition 4%
Multiple Response Question Source: Interviews with 26 building and construction companies
Challenges for youth employment Stakeholders were queried about the main obstacles for youth to obtaining jobs in general and employment opportunities which are commensurate with their studies in particular. They identified youth lack of experience, youth and employer perceptions, as well as the situation of the national labor market and the economy in general, among other obstacles.
Lack of experience
The focus group sessions clearly showed that for youth, the main challenge to getting a job is the need for experience. One person said that it is a never-ending circle: young people cannot find work because they do not have experience, and they do not have experience because they are unable to get a job.
Several people in the focus groups mentioned that they are looking for jobs that do not require experience, and that these jobs are in the minority. This is confirmed by the job listing data and by recruiters. Most available jobs require at least one to two years of experience.

Labor Market and Youth Capacity Assessment 106
A TVI manager observed that the lack of experience will prevent the graduate from improving the skills he or she has learned. The solution he proposes is to give every graduate three months of training by a trusted trainer.
Youth perceptions
Approach to job search For most youth focus group participants, looking for a job is far from being a full-time occupation. One person said that he searches a few minutes a day on the internet. Another mentioned one hour per week, others two or four days a week. One said he regularly asks his friends and connections, another said that he follows up every time he hears that someone is asking for an employee.
Recruiters also criticized the lack of motivation, and lack of serious attitude of young jobseekers. One recruitment agent mentioned that technical graduates are not sufficiently committed and not very professional about their search for work. For example, some candidates miss appointments without calling to cancel.
Expectations According to some recruiters and TVI managers, a major obstacle is the misperception of young people about jobs and their role in the labor market. It is not that graduates do not find jobs commensurate with their studies; instead their expectations, which are based on their majors, are false. For example, a student studying business management will expect to become the manager instantly. But since he/she is a generalist, available work might be in areas such as accounting, administration, warehousing, sales or others. Another example is marketing, where jobs are not very numerous, so fresh graduates usually start with a sales job. Students studying banking want to become financial analysts, but as these sorts of jobs are rare, they have to start out as accountants. A TVI manager expressed the same opinion
Another obstacle is that young job seekers tend to over-estimate their own capabilities; that is why they look for jobs they cannot perform. Students also lack orientation and awareness about the required flexibility to enter the market place. An interviewed recruiter advises young people to start in their field by what they find, and not what they want because they will discover themselves while working. They might change jobs at the beginning of their career, but that is not a big issue.
Youth employment prospects could be improved by their looking for jobs in their own area of expertise. This issue was raised by a TVI manager, as well as a focus group participant who said that the majority of the people he knows do not work in their field.
Managers of TVIs and LCs remarked that graduates are not very aware of the salary scale, and often do not like the basic starting salary. Youth focus groups yielded a wide range of acceptable salaries, from the minimum wage of USD 450 to USD 1,000. One TVI manager noted that these misguided expectations about the jobs available and about salaries not only make the job search more difficult, they also result in 60 percent of the TVI’s trainees leaving their jobs within the three-month probation period.
A recruitment agent noted that youth expectations about foreign labor markets are sometimes also too high. Some young jobseekers believe that opportunities in a different country would be better. In reality, the offered salary might be higher, but if accommodation and living expenses are removed, the resulting salary is at par with that in Lebanon.

Labor Market and Youth Capacity Assessment 107
Employer perceptions and practices
Approach to recruitment Several youth focus group participants remarked that in many cases, applicants need to know someone in a company in order to be considered for a job. Some firms as a rule only hire people that are known to the managers, even for modest positions like that of an office boy. Connections play a role that is more important than degrees and skills. In addition, due to the prevailing family business mentality, employers place too much emphasis on loyalty.
Expectations Another obstacle in youth employment is that employers have unrealistic expectations of their employees, regardless of how low the remuneration is that they provide. Young focus group participants said the main reason for them quitting their previous jobs was that they were expected to handle a heavy work load, assume a lot of responsibility, and accept long working hours and overtime, for a very low salary. Moreover, employers are very often reluctant to sign up workers with social security. Recruiters regard this as a form of exploitation and consider it a national obstacle.
As discussed in the section on technical and vocational education, the negative perception of vocational certificates is one of the major challenges that graduates face in the job market. Young jobseekers noted that many jobs require university degrees, although the education acquired at TVIs can be superior to that received at university. A TVI manager noted that there is also competition between TS and BT graduates in which TS students usually beat BT students, although both have the same skills.
Discrimination Sectarianism and regional affiliations also play a role in employer selection of candidates, and this is linked to the connections that are required. Some job seekers also experience discrimination on the basis of their nationality, for example if they are Palestinian.
Young people participating in the InfoPro focus groups also identified gender-based challenges. Several said that some companies do not hire veiled women for image reasons, even if their owners are Muslims. Women sometimes hesitate to apply for a job if they feel that the work environment is not healthy or that they might face harassment, especially in secretarial jobs.
Company interviews showed that regardless of the sector, recruitment practices often tend to be gender-specific. One focus group participant mentioned that some companies prefer hiring women more than men, especially for marketing and sales positions.
Another group of people that have a hard time finding jobs is the disabled. Data from company interviews confirms that they are reluctant to hire people with special needs, even if they have the skills that the company is looking for. One learning center manager remarked that there is no advocacy on this issue.
The national labor market and economy
Another issue for the employment of youth is the mismatch between demand and supply in the national labor market. For example, a high number of students are graduating from Business Administration, but there might not be enough jobs for these graduates to fill. On the other hand, there is a high demand for but low supply of skilled workers such as electricians and technicians. In this area, the Lebanese will continue to face obstacles because they compete with other nationalities that have lower requirements and

Labor Market and Youth Capacity Assessment 108
salaries. However, this situation should improve as recently permit regulations are being enforced for Syrians.
Another issue, especially for young people, part-time workers and women, is that jobs might be far in distance from the employee's area of residence. Job seekers might not have a car, public transportation is not always available, and many employers do not offer or cover the cost of transportation.
A national problem is the low salary level compared to the standard of living and the low return on investment in education. For example, a person might pay thousands of dollars in tuition fees, but the first salary they get is USD 700 to USD 800. This is another source of frustration for young job seekers. To rectify the low skill premium and reestablish a balance in the labor market, one TVI director suggested strict governmental regulations with clear criteria to differentiate between skilled and a non-skilled workers. This could allow skilled employees to take their rightful place in the job force by replacing the non-skilled employees.
Some young people brought up the bad overall job market in the Lebanon, the lack of opportunities and high level of unemployment as barriers for getting a job that corresponds to their profile. Recruiters concurred that the economic crisis and slowdown and the instability in the country mean that there are currently few new investments, resulting in a lack of jobs in the overall market.

Labor Market and Youth Capacity Assessment 109
Findings and recommendations This analysis of the information gathered through desk research and from stakeholders has allowed us to formulate a number of recommendations to CHF Lebanon. These recommendations are discussed below and summarized in Table 125 in the Appendix.
Training program improvements The majority of focus group participants are very receptive of the idea of training as a solution to expanding their capabilities or skills and knowledge and increasing their chances of finding a job. Several mentioned training they had received at previous jobs for basic skills like business etiquette, languages and computer, which they viewed positively. Some participants expressed readiness to pay for their training.
Students are evidently willing to learn. It is up the Ministry of Education and public and private TVE institutions, in cooperation with employers, to improve existing training programs in order to allow TVE students to have a better chance at employment. This is all the more important in view of the rapid growth in TVE in terms of the number of schools and students over the last two decades, especially in the public sector.
One major objective has to be to end the undervaluation of technical and vocational education vis-à-vis academic education. To reach this goal, the interface between technical and vocational education on the one hand and general education on the other hand needs to be improved, especially in terms of examinations, progression and movement between subsectors. Schools have to offer young students more guidance about both academic and non-academic types of education and career paths.
Another measure to re-rate the TVE system is to put the Technical Diploma (LT) on an equal footing with a Bachelor’s Degree (BA). One way to achieve this is to oblige all BA graduates to take the state examination just like LT students, or to exempt LT students from state examinations. The equality of the diplomas will give the students an option to choose either path to reach the same destination.
The quality of teaching in the state system also needs to be improved. Employment of technical and vocational teachers on temporary contracts at public schools should meet some qualifications standards, which should include industry experience. Mandatory testing for all teachers working on a contractual basis is recommended so that the level of vocational and technical education meets the standards of the private sector. In addition, teacher training by the national teacher training institution for technical education should be adapted to the new TVE curricula.
The private sector has a major role to play in re-designing the curriculum. Collaboration between technical and vocational schools, MEHE, and the private sector on curriculum review in general and courses pertaining to hospitality, administration, and accounting in specific is recommended. CHF should coordinate with vocational and technical institutes, MEHE, and the private sector on introducing new certificates or courses pertaining to sales.
To help bridge the gap between supply and demand in the labor market, CHF with the cooperation of MEHE and the National Employment Office (NEO) could carry out sessions at schools to raise awareness on TVE and the current needs of the labor market.
In addition, a workshop should be carried out once every three years between the private sector and technical and vocational schools with the coordination of CHF and under the patronage of MEHE, the NEO,

Labor Market and Youth Capacity Assessment 110
the Ministry of Social Affairs (MOSA) and the International Labour Office (ILO) to discuss jobs and skills in high demand but that are currently unavailable in the labor market.
One of the factors responsible for the low quality of public TVE is the lack of labor market information, which has led to outdated curricula and an inability to keep pace with technological developments. Closer ties between educational institutions and businesses could remedy this situation.
To enhance the image of technical and vocational education, educational institutions could invite speakers from the private sector for some of the classes provided, and make internships a mandatory part of each program.
Companies are receptive to the idea of partnering with education institutions to ensure that new graduates have the skills they require. But they need to increase their involvement by closer collaboration, offering more internship opportunities, and lobbying for TVE reform at the highest levels of government.
Improvements in employment services and job search methods
Employment services
There is a large gap in youth employment assistance due to the lack of government programs for youth employment. The National Employment Office is not fulfilling its function. Private recruitment agencies are available, but are not used by all sectors, and mostly cater to managerial positions or candidates for emigration.
Nine out of ten of the TVIs and LCs that were interviewed provide some form of job placement service to their students, and the placement success rate is relatively high. However, the educational institutes are quite passive in that the contact is usually made by the employer. They should be more proactive and approach companies in the sectors where their graduates work. This can be realized with the help of alumni working in such companies.
Almost half of interviewed companies indicated that they collaborate on a continuous basis with a TVI or LC, usually for internships. This is very positive and should be promoted. There should generally be more opportunities for collaboration between educational institutions and companies.
Most youths in focus groups were amenable to consider the option of applying for unpaid internships in order to get more experience, which they consider the main obstacle to finding a job. Internships also have other advantages. In many cases, companies provide at least some basic form of training to internees. In addition, an internship can be a stepping stone for permanent employment.
Job search method
Youth believe that the best way to get a job is through friends and connections. This is representative of the general approach in the labor market, and often does not result in an optimal match, especially for young people who are not well connected. However, focus group sessions revealed that unlike the majority of job seekers, young people are also using the internet in their search for employment, mostly to access recruitment websites. This is something that should be encouraged and developed. Electronic tools are becoming more important in recruitment, including company websites as well as social media, especially in the hospitality sector.
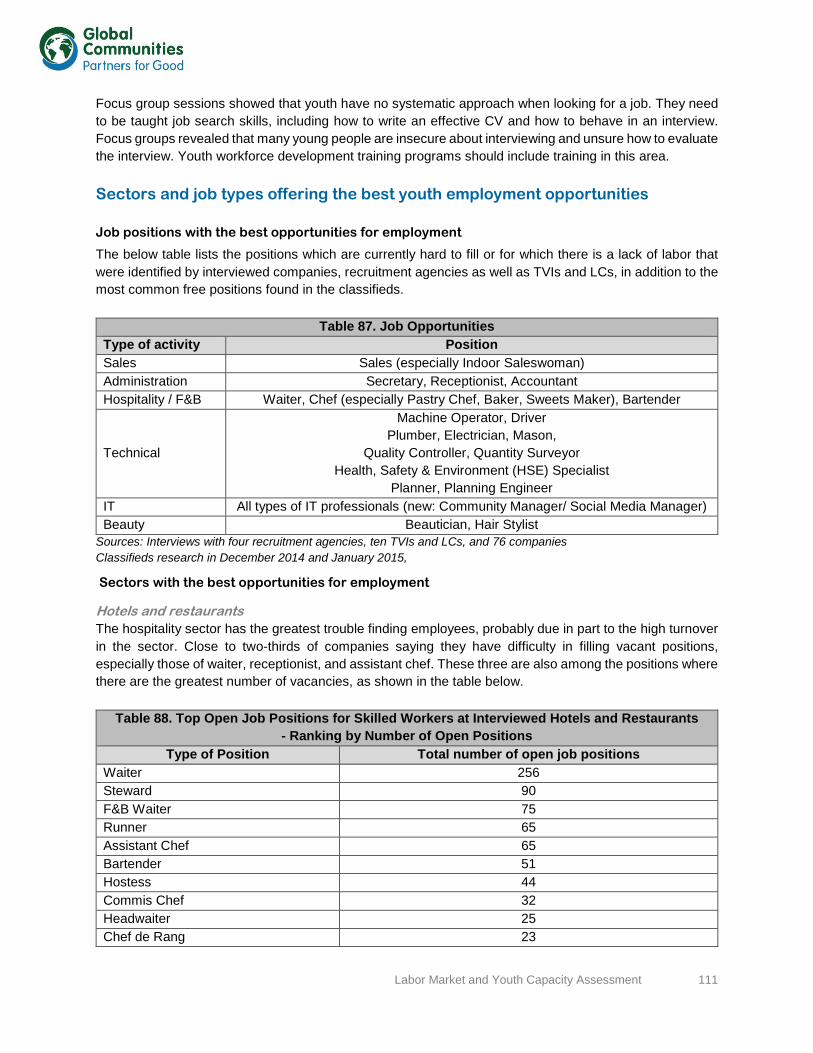
Labor Market and Youth Capacity Assessment 111
Focus group sessions showed that youth have no systematic approach when looking for a job. They need to be taught job search skills, including how to write an effective CV and how to behave in an interview. Focus groups revealed that many young people are insecure about interviewing and unsure how to evaluate the interview. Youth workforce development training programs should include training in this area.
Sectors and job types offering the best youth employment opportunities
Job positions with the best opportunities for employment
The below table lists the positions which are currently hard to fill or for which there is a lack of labor that were identified by interviewed companies, recruitment agencies as well as TVIs and LCs, in addition to the most common free positions found in the classifieds.
Table 87. Job Opportunities Type of activity Position Sales Sales (especially Indoor Saleswoman) Administration Secretary, Receptionist, Accountant Hospitality / F&B Waiter, Chef (especially Pastry Chef, Baker, Sweets Maker), Bartender
Technical
Machine Operator, Driver Plumber, Electrician, Mason,
Quality Controller, Quantity Surveyor Health, Safety & Environment (HSE) Specialist
Planner, Planning Engineer IT All types of IT professionals (new: Community Manager/ Social Media Manager) Beauty Beautician, Hair Stylist
Sources: Interviews with four recruitment agencies, ten TVIs and LCs, and 76 companies Classifieds research in December 2014 and January 2015,
Sectors with the best opportunities for employment
Hotels and restaurants The hospitality sector has the greatest trouble finding employees, probably due in part to the high turnover in the sector. Close to two-thirds of companies saying they have difficulty in filling vacant positions, especially those of waiter, receptionist, and assistant chef. These three are also among the positions where there are the greatest number of vacancies, as shown in the table below.
Table 88. Top Open Job Positions for Skilled Workers at Interviewed Hotels and Restaurants - Ranking by Number of Open Positions
Type of Position Total number of open job positions Waiter 256 Steward 90 F&B Waiter 75 Runner 65 Assistant Chef 65 Bartender 51 Hostess 44 Commis Chef 32 Headwaiter 25 Chef de Rang 23

Labor Market and Youth Capacity Assessment 112
Table 88. Top Open Job Positions for Skilled Workers at Interviewed Hotels and Restaurants - Ranking by Number of Open Positions
Cashier 21 Phone Operator 20 Chef 19 Receptionist 13 Sandwich Maker 10
Source: InfoPro interviews with 34 hotels and restaurants recruiting skilled workers
Building and construction Carpenter is the position that is the most difficult to fill in the building and construction sector, mentioned by two interviewed companies. It is also the top of the ranking of open positions. Other difficult to fill positons with single mentions are mechanical, electrical and plumbing technician, machine operator, HAVC technician, inverter service technician, service technician team leader, heavy vehicle driver, internal auditor, after salesperson, and planner. Overall, 44 percent of companies interviewed in the sector indicated that they had trouble finding personnel for specific tasks. This was also the case for renewable energy companies: two out of five have vacancies that are proving hard to fill.
Table 89. Top Open Job Positions for Skilled Workers at Interviewed Building and Construction Companies- Ranking by Number of Open Positions
Type of Position Total number of open job positions Carpenter 25 Painter 20 Electrical Technician 13 Heat, Air Ventilation, Cooling Technicians and Installers (HAVC)
10
Planner 7 Sales Person 5 Steel Fixer 5 Foreman 5 Safety and Security Officer 4 Concrete Foreman 4 Secretary 4 Shop Drawer 3 Quantity Surveyor 3 Finishing Foreman 3
Source: Interviews with 26 building and construction companies recruiting skilled workers
Agro-alimentary and beverages About 29 percent of companies in the agro-alimentary and beverages sector have vacancies that they find hard to fill. They include positions for machine operator, driver, and electrical technician. Among the most common vacancies are sales and chef positions.
Table 90. Top Open Job Positions for Skilled Workers at Interviewed Agro-alimentary and Beverages Companies
- Ranking by Number of Open Positions Type of Position Total number of open job positions
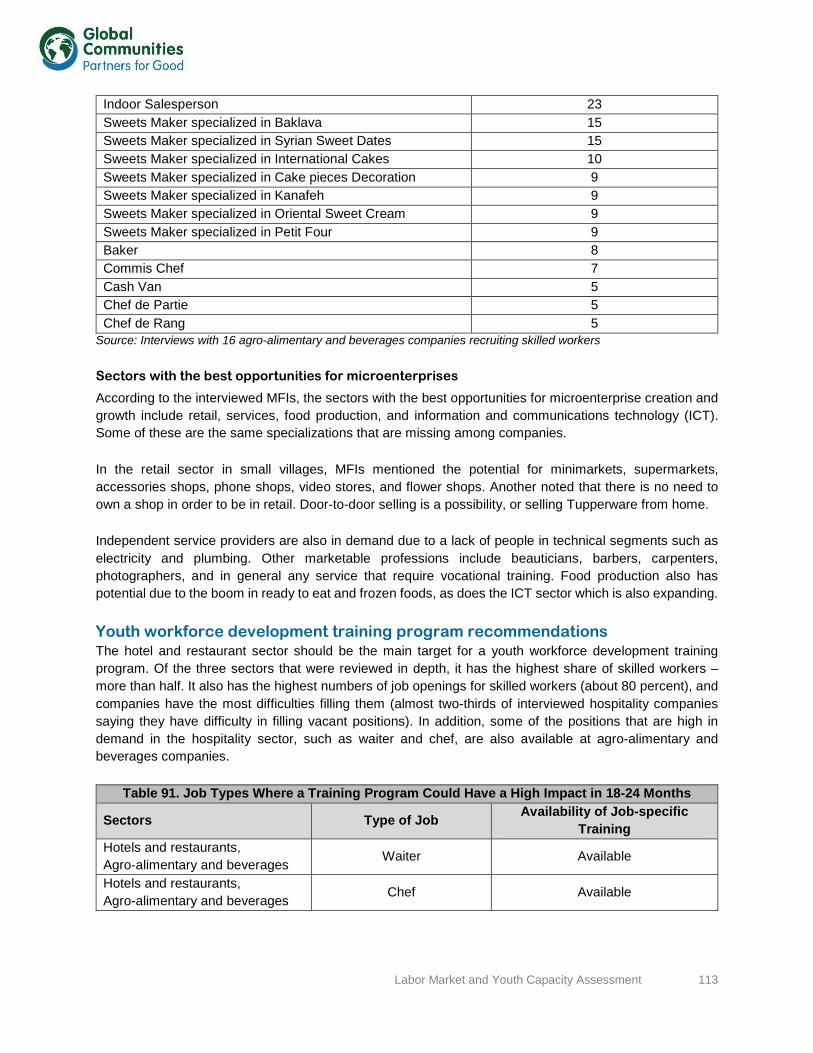
Labor Market and Youth Capacity Assessment 113
Indoor Salesperson 23 Sweets Maker specialized in Baklava 15 Sweets Maker specialized in Syrian Sweet Dates 15 Sweets Maker specialized in International Cakes 10 Sweets Maker specialized in Cake pieces Decoration 9 Sweets Maker specialized in Kanafeh 9 Sweets Maker specialized in Oriental Sweet Cream 9 Sweets Maker specialized in Petit Four 9 Baker 8 Commis Chef 7 Cash Van 5 Chef de Partie 5 Chef de Rang 5
Source: Interviews with 16 agro-alimentary and beverages companies recruiting skilled workers
Sectors with the best opportunities for microenterprises
According to the interviewed MFIs, the sectors with the best opportunities for microenterprise creation and growth include retail, services, food production, and information and communications technology (ICT). Some of these are the same specializations that are missing among companies.
In the retail sector in small villages, MFIs mentioned the potential for minimarkets, supermarkets, accessories shops, phone shops, video stores, and flower shops. Another noted that there is no need to own a shop in order to be in retail. Door-to-door selling is a possibility, or selling Tupperware from home.
Independent service providers are also in demand due to a lack of people in technical segments such as electricity and plumbing. Other marketable professions include beauticians, barbers, carpenters, photographers, and in general any service that require vocational training. Food production also has potential due to the boom in ready to eat and frozen foods, as does the ICT sector which is also expanding.
Youth workforce development training program recommendations The hotel and restaurant sector should be the main target for a youth workforce development training program. Of the three sectors that were reviewed in depth, it has the highest share of skilled workers – more than half. It also has the highest numbers of job openings for skilled workers (about 80 percent), and companies have the most difficulties filling them (almost two-thirds of interviewed hospitality companies saying they have difficulty in filling vacant positions). In addition, some of the positions that are high in demand in the hospitality sector, such as waiter and chef, are also available at agro-alimentary and beverages companies.
Table 91. Job Types Where a Training Program Could Have a High Impact in 18-24 Months
Sectors Type of Job Availability of Job-specific Training
Hotels and restaurants, Agro-alimentary and beverages Waiter Available
Hotels and restaurants, Agro-alimentary and beverages Chef Available

Labor Market and Youth Capacity Assessment 114
Agro-alimentary and beverages, Building and construction, Retail Salesperson (Indoor)
Some companies did not find providers for Sales Strategies /
Upselling or POS Software Training All Secretary Available Building and construction HAVC technician Available
Building and construction Solar PV or solar heater technician
Some companies did not find providers for Solar PV or Solar
heater installation Training Technology Graphic Designer Available
Source: InfoPro
Moreover, the hospitality sector has the highest share of companies that noted some gap in skills among their skilled workers. A training program could therefore achieve a high impact if it can instruct youth in the skills that are currently lacking in this sector.
Although job-specific training is available in most cases, the level might be up to the necessary standard and the curriculum might not contain the elements required by the private sector. This applies especially to public institutions which are the weaker elements of the technical and vocational education system.
In short-term training, the focus should be on building up existing skills or completing the skillset of jobseekers. The most important skills which are not job- specific are listed below.
Table 92. Skills Where a Training Program Could Have a High Impact in 18-24 Months Type of Skill Availability of Training Communication Available courses are expensive
Other soft skills Available courses are expensive
Some companies did not find providers for Team Building or Six Sigma Training
English language Available
Sales and marketing
Available courses are expensive Some companies did not find providers for
Sales Strategies / Upselling or POS Software Training
Business skills (bookkeeping, business regulations) Available courses are expensive
Some companies did not find providers for Revenue Management Training
Job search, CV writing and interview skills Not available Source: InfoPro
In medium-term programs where training takes place over two to four years, the focus should be on professions that are not available because the people currently exercising them are not sufficiently skilled, or because they are new professions for which a curriculum has not yet been developed. The latter are most common in the areas of technology, telecommunications and IT, which are also the entrepreneurial areas were youth are engaged the most.
The hospitality sector should again be a priority, because companies in this sector, especially restaurants, are the most willing to partner with education institutions to ensure that new graduates better suit their needs if they cannot find recruits with the appropriate skills profile. A solid training in technical professions

Labor Market and Youth Capacity Assessment 115
such as plumber and electrician not only provides good chances for employment, it also opens up the possibility for self-employment later on.
Table 93. Job Types Where a Training Program Could Have a High Impact in 24-48 Months
Sector Type of Job Availability of Job-specific Training
Hospitality and agro-alimentary Chef Available
Building and construction
Plumber Available
Electrician Some companies did not find providers
Mechanic Some companies did not find
providers Mason Available
Carpenter Available Painter Available
Building and construction, Technology
Green Technologies Technician
Some companies did not find providers for operation of
renewable energy technologies
Technology Community and Social Media Manager Not available
Source: InfoPro
Conclusion The sector where a youth workforce development training program could have the greatest impact is the hospitality sector, where hotels and restaurants were chosen as sub-sectors. Waiters and chefs are in great demand, as indicated by the high numbers of vacancies.
Although almost all interviewed hotels and restaurants offer training to their employees, nine out of ten indicated that their employees have some skill gaps. These appear particularly in the areas of communication and other soft skills, as well as English language skills. These should be the focus of a youth training program.
The program should also include job search, CV writing and interview skills. Focus groups have shown that young job applicants are not very effective at their job search and insecure about the interview process. Like jobseekers in general, they rely mostly on their family and relations to get employment. This informal matching system creates distortion in the labor market since social and sectarian connections trump skills and merit.
Youth deserve to be beneficiaries of a workforce development training program as they have the highest rates of unemployment, even though many of them emigrate for employment. There is a large gap in youth employment assistance due to the lack of government programs for youth entrepreneurs and job placement.
A training program targeting technical and vocational professions would also help to improve the standing of the TVE sector, which is currently not attractive for companies or individuals. It could foster the communication between technical and vocational education institutions and the companies that employ their graduates.

Labor Market and Youth Capacity Assessment 116
Appendices
Study methodology A multi-faceted methodology including desk research, a survey with a sample of private sector companies, focus groups with youths, and in-depth interviews with recruitment agencies, technical and vocational institutes, and an economic expert was utilized. This report was initially published in September 2015, but has continuously been updated to reflect new data; the latest update to this report was in April 2016.
Segment One - Desk Research
The desk research segment was used to gather all references pertinent to the local labor market and to decide on the sub-sectors that would be covered in the survey. In order to compile the various references, we examined and analyzed all available project documentation. This enabled us to identify gaps that were tackled through the other facets of the methodology.
InfoPro also used The Complete Guide to the Lebanese Labor Market, a book which it has compiled but has not published yet, in order to compile additional references. We also delved into international case studies which might shed led on strategies that could be applied to Lebanon.
We gathered the list of jobs, their description and their skills required from Lebanese recruitment websites, mainly hirelebanese.com and bayt.com. In addition, InfoPro gathered the same type of information from selected printed newspapers (which are principally used by the targeted skilled unemployed youth), mainly the Al-Waseet and Al Hadaf.
This exercise yielded the following information:
• Brief overview of the local economy • Unemployment rates • Public sector employment trends and wages • Number of jobs and average wages in the private sector • Overview of the local labor force (size, age, gender, education etc.) • Emigration and immigration and its effect on the labor force • List of projects and initiatives related to youth training and employment • List of jobs, titles and skills required for skilled workers demanded by Lebanese recruiters
The desk research exercise also assisted InfoPro in compiling a list of technical and vocational training institutes. InfoPro gathered the details requested by Global Communiites by assessing the websites of the various institutes and tackled any apparent gaps through in-depth telephone interviews with the institutes. InfoPro also used the desk research exercise to compile a list of prominent recruitment agencies.
In addition, the desk research segment allowed InfoPro to identify the sub-sectors which have potential to be a part of the survey with the private sector. Preliminary desk research yielded a total of 15 sub-sectors. InfoPro started off with a total of 28 sub-sectors and eliminated 13 due to their lack of having skilled employees or to their being merged with other sub-sectors. Some of the sub-sectors were merged with others due to the fact that they have one ISIC code.

Labor Market and Youth Capacity Assessment 117
Segment Two - Private Sector Interviews
InfoPro and Global Communities then proceeded to carry out 33 in-depth face-to-face interviews with companies across agro-alimentary and beverages, hotels and restaurants, building and construction, and agriculture/agribusiness. Most of the entities interviewed are located in the Greater Beirut area, which is the hub of economic activity, as well as in the South and Bekaa Governorates.
InfoPro and CHF discussed the initial results of these pilot interviews. They agreed to discontinue interviews with facility management companies due to the insufficient number of openings for skilled workers. To complete the data for the building and construction sub-sector, they decided to target companies with the following sub-activities:
1. Heating, ventilation, refrigeration, or air-conditioning equipment and ducts 2. Installation of electrical wiring and fittings 3. Installation of telecommunication wiring 4. Installation of electrical heating systems 5. Installation of fire alarms 6. Installations of lifts and escalators 7. Plumbing and sanitary equipment
Moreover, InfoPro consented to carry out a total of five interviews in the Renewable and Green Energy Sector.
With regards to the agro-alimentary sub-sector, InfoPro and Global Communities agreed to discontinue interviewing bakeries but rather concentrate on large pastry outlets since they have common job openings with restaurants.
As for Hotels, the meeting attendees concurred to interview only large ones. Global Communities and InfoPro also agreed that large restaurant chains and large coffee shops should be covered.
Global Communities interviewed farmers, land owners, and agri-businesses within the overall Agriculture Sector.
InfoPro subsequently continued data collection until a total number of 81 entities was reached.
The interviews were carried out with the Owner, Executive Director, General Manager / Managing Director or the Human Resources Manager. The choice of person to be interviewed depended on the company and its organizational structure. The interviews were qualitative in nature.
This segment of the study provided the below information: • Employment trends • Skills sought by employers but unavailable in the labor force • Job vacancies • Training provided by employers • Perception towards technical and vocational training institutes • Recruitment agencies that they utilize

Labor Market and Youth Capacity Assessment 118
Methodology
Activity 1-Design of the Semi-Structured Interview Guide
InfoPro designed the semi-structured interview guide and sent it to CHF for approval prior to data collection. Each interview took approximately 45 minutes to one hour to complete.
Activity 2-Pilot Test
The questionnaire was pilot-tested on a sample of five businesses. The aim of the pilot test was to assess the interview guide for any problematic issues, and it helped in identifying any possible weaknesses in the interview guide, which was amended accordingly. InfoPro shared with CHF the feedback on any modifications that needed to be carried out.
Activity 3- Interviews
Companies were contacted beforehand for an appointment. The InfoPro call center informed the interviewee of the aim of the study and that any information that they provide is deemed as confidential and will only be utilized in conveying general figures and number and those specific to their organization. InfoPro – from experience - expects a 50 percent rejection rate to ensue across each sub-sector. The interviews were carried out by full-time InfoPro research analysts and/or Global Communities staff. The total number of interviews was 78.
Activity 4- Data Transcribing and Synthesis
The interviews that were carried out were transcribed and the data was synthesized in preparation for the final report.
Segment Three- In-depth Interviews
In-depths interviews were carried out with the following stakeholders: • Technical and vocational institutes and learning centers • Recruitment agencies • Micro-finance institutes • Economic expert
InfoPro carried conducted in-depth interviews with seven technical and vocational institutes, namely: • Institut de Tourisme • CIS College • Technical and Language College (TLC) • Technical Hotel School (الفندقي المعھد) • National Pedagogical Institute of Technical Education (IPNET) • CIT • Institut Technique Kafaat
InfoPro also interviewed three learning centers, which are:
• Makhzoumi Foundation

Labor Market and Youth Capacity Assessment 119
• Formatech • New Horizons
The aim of the interviews with the institutes and learning centers was to assess their organizational structure, programs which they provide, capabilities of their workforce, and whether they provide any programs or initiatives specific to youth. The interviews were carried out by telephone and the screening questionnaire used was given to Global Communities for approval prior to data collection. The screening process determined the number of students across each institute, and the top ten were selected as per the mandate of Global Communities. InfoPro then carried out in-depth interviews with the ten institutes and gathered the specifications highlighted in the tender document. These interviews will allow Global Communities to cross-check the data with the private sector interviews and eventually plan any capacity building initiatives which might need to be undertaken.
InfoPro carried out four in-depth interviews with recruitment agencies, namely: • CINOPS • Zedar Group • Business Lobby • JC Conseil Recruitment Agency
The purpose of these interviews was to gather data on the following: • Job vacancies available across different economic sub-sectors • Fields for which there is a surplus of labor • The effect of migration on local businesses • Employment opportunities available for youths • Youth wages • Challenges that youth face in the labor market • Relevance of a university level education to the local labor market • Recommendations on what would resolve some of the obstacles for youths
The interviews with the recruitment agencies were carried out face-to-face since the level of detail required cannot be captured by telephone.
InfoPro also interviewed a three Micro-Finance Institutes in order to gather data on the opportunities available for unemployed youths in micro-entrepreneurship. InfoPro assessed MFIs that have a strong presence in the regions under study. From previous studies it carried out, InfoPro is aware that approximately four MFIs have over three-quarters of the market. These are Al Qard Al Hassan, Al ‐
Majmoua, Emkan and Vitas. InfoPro attempted to schedule in-depth face-to-face interviews with these four MFIs, however some were not available, and as previously, Al Qard Al Hassan which is prominent in the Beirut Southern suburbs did not accept to take part in the survey. InfoPro interviewed the following MFIs:
• Makhzoumi Foundation • Entrepreneurial Development Foundation (EDF) • Ibdaa
InfoPro also interviewed economic expert Dr. Marwan Iskandar in order to gather data on the impact of migrants and refugees on the labor market.
Labor Market and Youth Capacity Assessment 120
Methodology The project manager carried out the face-to-face interviews utilizing a semi-structured discussion guide. The discussion guide was designed by InfoPro Research and submitted to Global Communities for review and approval before the launching of the fieldwork. The interview length ranged from 30 to 60 minutes depending on the stakeholder. Appointments for the interviews were scheduled by phone beforehand to ensure the time and attention of the interviewees.
Segment Four - Focus groups with Youth
Global Communities, as part of its YES program, addresses youth unemployment among 18 to 29 year-olds, and it is therefore crucial that the perspective of youth with regards to the labor market and the obstacles they face be a part of the study’s mandate. The only way that the youth perspective can be explored is through focus groups.
InfoPro carried out a total of three focus groups with unemployed youth or those that took or are currently taking training courses at vocational or technical institutes or with MENA-YES. Global Communities gave InfoPro a contact list of youths who were enrolled in the Global Communities 2013/2014 program in order to help InfoPro find focus groups participants. InfoPro also used its databases for additional contacts. The profile of focus group participants is shown in Table 126.
A comprehensive interview guide was developed by a specialized focus group moderator and submitted to Global Communities for review and approval prior to conducting the focus group. The focus group sessions included respectively five, nine and 11 participants; each group was moderated separately. The group participants were evaluated individually in order to confirm that they have the appropriate profile. Often, participants do not know what to expect from focus group discussions.
The moderator outlined the purpose and format of the discussion at the beginning of the session, and set the group at ease. The participants were told that:
• The discussion is informal • Everyone is expected to participate • Divergent views are welcome
A moderator’s assistant recorded the discussion in addition to taking written notes. Notes were extensive and reflected the content of the discussion as well as non-verbal behavior (facial expressions, hand movements, etc.). Shortly after each group interview, the recordings were transcribed. InfoPro summarized the information, the team’s impressions, and implications of the information for the discussion topic. Discussions were reported in participants’ language, retaining their phrases and grammatical use.
Segment Five - Final Report and Recommendations
InfoPro synthesized the data gathered through desk research, the corporate interviews, in-depth interviews with various stakeholders, and the focus groups with unemployed youth in order to assess whether there is a mismatch between supply and demand in the three sub-sectors with regards to occupation types, training requirements, and skills. InfoPro also assessed any coordination gaps among various stakeholders, including employers, youths, educational institutes, and local authorities. The analysis also delved into the challenges to youth employment and the factors which might exacerbate or hinder such challenges. InfoPro also examined legal and regulatory challenges which might require changes in policies.
InfoPro wrapped up the study by highlighting opportunities for improvement across employment services, recruitment practices, and training programs. The report also identified job types across sub-sectors in

Labor Market and Youth Capacity Assessment 121
which a youth workforce development training program can achieve results in the short term (18 to 24 months) and the medium term (24 to 48 months). Finally, recommendations and a future strategy were provided to address the challenges of youth unemployment.
Data control
There are three levels of data control:
Level 1: All completed questionnaires are verified on a daily basis by InfoPro Research support staff. The problematic questionnaires are canceled.
Level 2: All questionnaires are back checked by telephone to ensure the content of the questionnaires.
Level 3: All the completed questionnaires are electronically checked for logical errors when entered into the database.
Data entry and processing
All the interview forms were verified and entered into an MS Access database designed according to the questionnaire.
All the data was processed using SPSS, a statistical analysis tool, with frequency tabulations of the total sample provided upon completion. Cross-tabulations will be provided on request. MS Excel charts based on the processed data were also generated.
Standards
InfoPro Research methods and procedures conform to ESOMAR standards; in addition, InfoPro has adopted strict quality measures to ensure the reliability of its findings.
Copyright
The client has the copyright to all the statistics and reports supplied. InfoPro may not sell the data or the reports to any entity or use in any publication without the client’s prior written approval. The client will need to source InfoPro across all material presented or shared.

Labor Market and Youth Capacity Assessment 122
List of Sources
Assessment of the Impact of Syrian Refugees in Lebanon and their Employment Profile, International Labour Organization, Regional Office for Arab States, 2014
Complete Guide to the Lebanese Labor Market, InfoPro, unpublished
Economic and Labor Force Impact of the Proposed Change in the Wage Structure of the Public Sector, Poverty Reduction and Economic Management Department Middle East and North Africa Region, World Bank, June 2013
Education for Employment: Realizing Arab youth potential, e4e, Islamic Development Bank, International Finance Corporation, April 2011
Education to Employment: Designing a System that Works, McKinsey Center for Government, 2012
ILO Response to the Syrian Refugee Crisis in Jordan and Lebanon, International Labor Organization, March 2014
Lebanese National Accounts 2004-2013, Comments and Tables, Central Administration for Statistics, December 2014
Republic of Lebanon - Good Jobs Needed, David Robalino and Haneed Sayed, World Bank, December 2012
Review and Assessment of Labour Market Information, The International Labour Organization, September 2011
Striving for Better Jobs: The Challenge of Informality in the Middle East and North Africa, Roberta Gatti, Diego F. Angel-Urdinola, Joana Silva, and András Bodor, World Bank, 2014
The Labour Market in Lebanon, Najwa Yaacoub, Lara Badre, Central Administration of Statistics, October 2011
Torino Process Lebanon, European Training Foundation and Ministry of Education and Higher Education, 2011
Youth employment in Lebanon: Skilled and jobless, Mary Kawar and Zafiris Tzannatos, The Lebanese Center for Policy Studies, 2013
United Nations and Ministry of Social Affairs, Government of Lebanon, Lebanon Crisis Response Plan 2015 – 2016 Year 2, 2016
Lebanon: Economic and Social Impact of the Syrian Conflict, September 2013, World Bank.
Lebanon: Promoting Poverty Reduction and Shared Prosperity. A Systematic Country Diagnosis, June 2015, World Bank.
Minister Statement Kazzi: The Unemployment Rate in Lebanon Reached 25%, of which 36% are Youth. Mulhak. July 2015.

Labor Market and Youth Capacity Assessment 123
Distribution of Students in Public and Private Vocational Schools
Table 94. Distribution of Students in Public and Private Vocational Schools by Degree and Gender 2012-2013
CAP BP FPM BT TS LT Total Male Female Male Female Male Female Male Female Male Female Male Female Private 239 35 3,668 1,738 345 19 14,384 10,507 3,423 4,309 188 160 39,015 Public 59 0 3,883 1,581 1,487 71 10,751 8,922 4,063 5,376 849 978 38,020 Total 298 35 7,551 3,319 1,832 90 25,135 19,429 7,486 9,685 1,037 1,138 77,035
Source: Center for Educational Research and Development
Table 95. Distribution of Students in Public and Private Vocational Schools by Degree and Gender 2003-2004 CAP BP FPM BT TS LT LTE
Total Male Female Male Femal
e Male Female Male Femal
e Male Female Male Femal
e Male Female
Private 964 31 2,305 1,146 0 0 13,033 9,719 5,567 4,627 116 69 n/a n/a 37,577
Public 267 35 1,416 451 903 24 10,043 7,905 5,023 4,439 1,441 630 57 21 32,655
Total 1,231 66 3,721 1,597 903 24 23,076
17,624
10,590 9,066 1,557 699 57 21 70,232
Source: Center for Educational Research and Development *CAP: Certificat d’Aptitude Professionnel *BP: Brevet Professionnel *FPM: Formation Professionnelle de Maîtrise *BT: Baccalauréat Technique *TS: Technicien Supérieur *LT: Licence Technique *LET: License d’Enseignement Technique

Labor Market and Youth Capacity Assessment 124
Distribution of Staff in Technical and Vocational Schools
Table 96. Distribution of Staff in Technical and Vocational Schools by Gender and Mohafaza 2003-2004
Mohafaza Private Public
Total Males Females Males Females Beirut 693 451 0 0 1,144 Mount- Lebanon 2,021 1,686 1,483 1,277 6,467 North-Lebanon 802 823 1,117 1,249 3,991 Bekaa 235 134 926 584 1,879 South 459 356 1,127 769 2,711 Total 4,210 3,450 4,653 3,879 16,192
Source: Center for Educational Research and Development
Table 97. Distribution of Staff in Technical and Vocational Schools by Position and Mohafaza 2003-2004
Mohafaza Private Public Total Administrative Teaching Administrative Teaching Beirut 33 1046 0 0 1,079 Mount- Lebanon 117 3,380 59 2,600 6,156 North-Lebanon 48 1,490 30 2,277 3,845 Bekaa 13 332 20 1,453 1,818 South 24 733 21 1,813 2,591 Total 235 6,981 130 8,143 15,489
Source: Center for Educational Research and Development
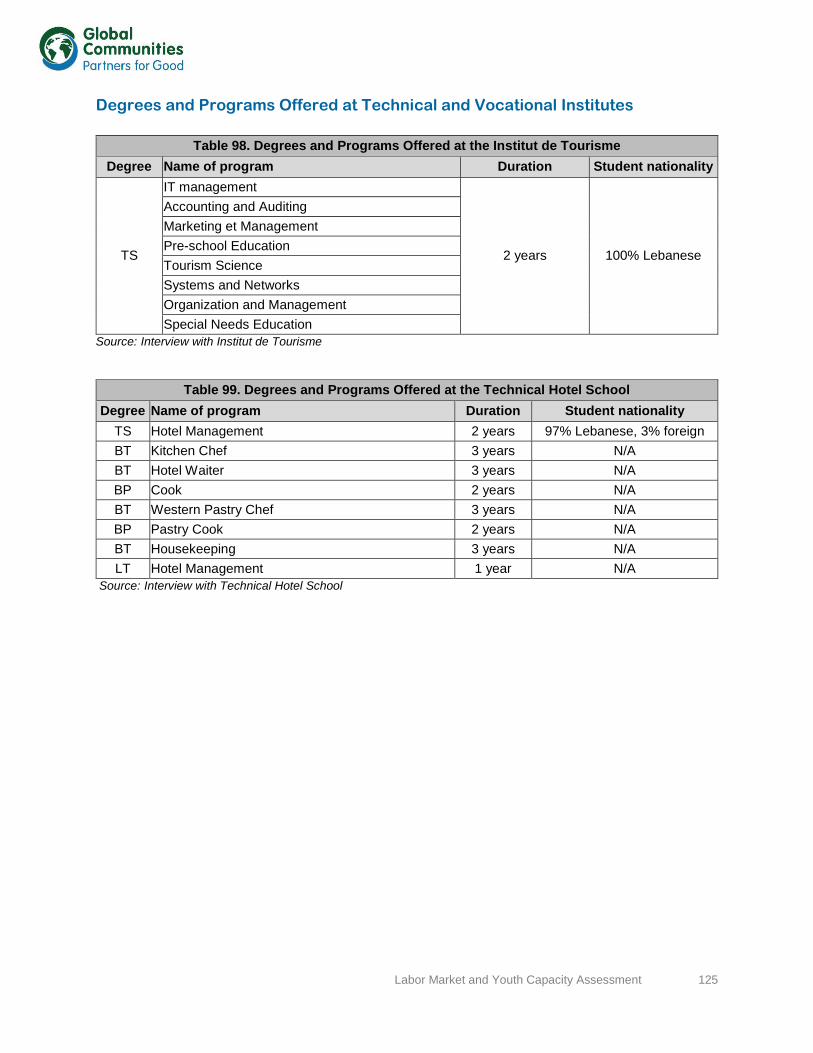
Labor Market and Youth Capacity Assessment 125
Degrees and Programs Offered at Technical and Vocational Institutes
Table 98. Degrees and Programs Offered at the Institut de Tourisme Degree Name of program Duration Student nationality
TS
IT management
2 years 100% Lebanese
Accounting and Auditing Marketing et Management Pre-school Education Tourism Science Systems and Networks Organization and Management Special Needs Education
Source: Interview with Institut de Tourisme
Table 99. Degrees and Programs Offered at the Technical Hotel School Degree Name of program Duration Student nationality
TS Hotel Management 2 years 97% Lebanese, 3% foreign BT Kitchen Chef 3 years N/A BT Hotel Waiter 3 years N/A BP Cook 2 years N/A BT Western Pastry Chef 3 years N/A BP Pastry Cook 2 years N/A BT Housekeeping 3 years N/A LT Hotel Management 1 year N/A
Source: Interview with Technical Hotel School

Labor Market and Youth Capacity Assessment 126
Table 100. Degrees and Programs Offered at CIS College
Degree Name of program Duration Student nationality BP Accounting 2 years
95% Lebanese, 5% foreign
BP Hotel (Sous Chef) 2 years BP Nursery Education 2 years BP Electronics 2 years BT Accounting 3 years BT IT 3 years BT Nursery Education 3 years BT Graphic Design 3 years BT Interior Design 3 years BT Hotel Management 3 years BT Sales & PR 3 years BT Electronics 3 years TS Accounting 2 years TS Business Computer 2 years TS Nursery Education 2 years TS Graphic Design 2 years TS Marketing 2 years TS Hotel Management 2 years
Private Course English Courses 1.5 months
75% Lebanese, 25% foreign
Private Course Business English 2 months Private Course SAT and TOEFL courses 1.5 months Private Course Ticketing 6 months Private Course Computer Accounting (EDM) 6 months Private Course Accounting 3 months Private Course Forex trading 3 months Private Course Executive Secretary 6 or 9 months Private Course Mobile Maintenance 3 months
LT Computer 1 year N/A LT Accounting 1 year N/A
Source: InfoPro interview with CIS College

Labor Market and Youth Capacity Assessment 127
Table 101. Degrees and Programs Offered at TLC Degree Name of program Duration Student nationality
LT Business - Expertise & Auditing 1 year
90% Lebanese, 10% foreign
LT Computer Science 1 year TS Expertise & Auditing 2 years TS Computer Science 2 years TS Interior Architecture 2 years BT Accounting & Computer Science 1, 2 or 3 years BT IT 1, 2 or 3 years BT Architecture & Interior Design 2 or 3 years
IATA Ticketing & Reservation 7 months N/A Bookkeeping 1 year N/A Accountant 1 year N/A Chief Accountant 3 years N/A Accountancy & Administration 6 months N/A Aesthetic - Face & Body Care 1 year N/A Make-Up & Face Care 4 months N/A Manicure, Pedicure, Epilation 4 months N/A Hairdresser 1 year N/A Electronic & Repairing Machine 2 years N/A Repairing radio & TV 2 years N/A Repair & Maintenance of Cellular Phones 2 months N/A Repair & Maintenance of Computers 3 months N/A Photography session N/A Editing Operator (Montage) session N/A Computer (operator) session N/A Computer (programmer) session N/A Graphic Design session N/A Engineering design session N/A Web design session
MCSE Microsoft Certified Engineer 1 year Certificate Cambridge University Language Certificates session
Source: InfoPro interview with TLC

Labor Market and Youth Capacity Assessment 128
Table 102. Degrees and Programs Offered at IPNET Degree Name of program Duration Student nationality
LT
Accounting
1 year 100% Lebanese
Management and Administration Management and Marketing Education Industrial Computing Mechatronics Renewable Energy Tourism
Source: Interview with IPNET
Table 103. Degrees and Programs Offered at the Institut Technique Kafaat Degree Name of program Duration Student nationality
BP Printing 2 years 100% Lebanese BP Assistant Accountant 2 years 100% Lebanese BP Food Production 2 years 92% Lebanese, 8% foreign BP Carpentry 2 years 100% Lebanese BT Hospitality Service, Food Production 3 years 100% Lebanese BT Accounting & Computer 3 years 100% Lebanese BT Marketing 3 years 94% Lebanese, 6% foreign BT Auto-Mechanics 3 years 100% Lebanese BT Printing 3 years 100% Lebanese BT Electronics 3 years 100% Lebanese BT Computer 3 years 100% Lebanese BT Interior Design 3 years 100% Lebanese FP Hospitality Service 1 year 100% Lebanese FP Food Production 1 year 89% Lebanese, 11% foreign FP Oriental Pastry 1 year 100% Lebanese FP French Pastry 1 year 91% Lebanese, 9% foreign FP Bakery 1 year 100% Lebanese FP Beauty Treatment 1 year 86% Lebanese, 14% foreign FP Hair Designer 1 year 100% Lebanese FP Graphic Design 2 years 100% Lebanese FP Auto-Mechanics 2-3 years 100% Lebanese FP Home Appliances Maintenance 1 year 100% Lebanese FP Electrical Installation 1 year 86% Lebanese, 14% foreign FP Heating & Ventilation 1 year 100% Lebanese FP Computer 1 year 100% Lebanese FP Telecom 1 year 100% Lebanese FP Jewelry, Fashion Design 2 years 100% Lebanese
Source: Interview with Institut Technique Kafaat

Labor Market and Youth Capacity Assessment 129
Table 104. Degrees and Programs Offered at CIT - Specialist Diploma C.S.T Name of program Duration Student nationality Specialist in Business Administration 1 year
80% Lebanese, 20% foreign
Public Relations Sessions Commercial Relations Sessions Human Resources Management Sessions Specialist in Business Computing 1 year Resorts Development & Hotel Management 1 year Hotel Management (Reception, hospitality, accounting) 1 year Hospitality (food production, pastry) 1 year Hospitality (Restaurant & Bar Service) 1 year Bar tender sessions Executive Secretary 1 year Medical Secretary 1 year Marketing & Management 1 year E-Marketing sessions Book Keeping/General Accounting sessions Specialist in Accounting 1 year Chief Accountant 2 years Audit 1 year Marketing & Advertising 1 year Tourism 1 year Ticketing & IATA 1 year Specialist in Media & Documentation 1 year Computer data processing & Internet Sessions Foreign Languages sessions Architecture Design & Decoration 1 year Specialist in Interior Design 1 year Advertising Design 1 year Photographing & Video Sessions Computer Architecture Design - Autocad sessions Graphic Design sessions Graphic Animation sessions web design 1 year Application development (Android + iOS) sessions Smart Phones Repair sessions Security Systems 1 year PLC Sessions Computer Technician 1 year Advanced Networking &IT 2 years General Electricity 1 year Electronics Technician 2 years
Degrees and Programs Offered at CIT - Specialist Diploma C.S.T Cont’d Name of program Duration Student nationality

Labor Market and Youth Capacity Assessment 130
Car Electro-mechanics & Electricity 2 years
80% Lebanese, 20% foreign
Car diagnostics - Scanner sessions Air - Conditioning 1 year Hair dressing (women/men) 1 year Cosmetics 1 year Make-Up sessions Tattoo / Aesthetic Treatment / Electrical Hair Removal sessions Manicure Pedicure - Acrylic sessions Source: Interview with CIT
Table 105. Degrees and Programs Offered at CIT – Other Degrees Degree Name of program Duration Student nationality
TS Expertise and Accounts Revision 2 years
80% Lebanese, 20% foreign
TS Marketing and Management 2 years TS Business Computer 2 years TS Banking Sciences 2 years TS Hotel Management 2 years TS Interior Architecture 2 years TS Graphic Design 2 years TS Electronics & Electricity 2 years TS Automobile Mechanics 2 years LT Expertise & Accounts Revision 1 or 3 years LT Hotel Management 1 or 3 years LT Business Computer 1 or 3 years LT Interior Architecture 1 or 3 years BP Assistant Accountant 2 years BP Hospitality (service, kitchen, pastry) 2 years BP Building Electrician 2 years BP Beautician - Cosmetician 2 years BT Accounting & Computer Services 1, 2 or 3 years BT IT 1, 2 or 3 years BT Sales & Commercial Relationships 1, 2 or 3 years BT Administrative & Office services 1, 2 or 3 years BT Hospitality Technics (sales, production) 1, 2 or 3 years BT Architecture & Interior Design 1, 2 or 3 years BT Advertising & Graphic Design 1, 2 or 3 years BT Preschool Education 1, 2 or 3 years BT Electronics - Electricity 1, 2 or 3 years BT Automobile Mechanics and electricity 1, 2 or 3 years BT Air - Conditioning 1, 2 or 3 years
Source: Interview with CIT

Labor Market and Youth Capacity Assessment 131
Degrees and Programs Offered at Learning Centers
Table 106. Degrees and Programs Offered at Makhzoumi Foundation Degree Name of program Duration
Private Vocational Certificate
Digital Literacy and IT Skills 32 hours Languages 32 hours Secretary, Accounting, Banking 32 hours Beauty and Hairstyling 32 hours IT (AutoCAD, Adobe) 32 hours Electronics (Mobile Repair) 32 hours Arts and crafts 6 hours
London Chamber of Commerce & Industry International Qualifications (LCC) Secretary, Accounting, Marketing 12 - 24 months
Source: Interview with Makhzoumi Foundation
Table 107. Programs Offered at New Horizons Name of program Duration Microsoft Technical Training / IT Professional 30 hours Cisco Technical Training 36 hour Oracle 12/18/30 hours Management Courses 6 hours CBP 15 hours
Degrees are New Horizons or Technology Provider Certificates Source: InfoPro interview with New Horizons

Labor Market and Youth Capacity Assessment 132
Table 108. Programs Offered at Formatech
Name of program Duration Leadership Development 12 hours 360 Degree Feedback and Behavioral Competency Development 1 hour Psychometric Tools 1 hour Human Resources Best Practices 12 hours Customer Engagement 6 to 12 hours Hospitality Management 3 to 24 hours Food Safety 6 to 36 hours Occupational Safety and Health 12 to 60 hours Graphics 12 to 42 hours Social Media 6 to 24 hours Mobile 6 to 30 hours IT Service Management 6 to 30 hours IT Project Management 6 to 35 hours Office Applications 6 hours Adobe 6 hours Cisco, Microsoft, Linux, Oracle, EC-Council, Comptia, IT Security 30 hours Web, Vmware 15 to 24 hours ISO Certifications 12 to 40 hours Financial Skills 12 hours
Degrees are Formatech or Technology Provider Certificates Source: Interview with Formatech

Labor Market and Youth Capacity Assessment 133
Salaries by Type of Open Job Position
Table 109. Open Job Positions for Skilled Workers at Interviewed Companies – Ranking by Minimum Salary
Minimum salary in USD (Average)
Maximum salary in USD (Average)
Foreman 1,500 2,000 Finishing Foreman 1,500 2,000 R&D Specialist 1,300 1,700 Electro-Mechanical Technician 1,110 1,300 Stock Keeper 1,085 1,385 Concrete Foreman 1,050 1,375 Executive Assistant 1,000 1,200 Chef de Partie 917 1,333 Mechanical, Electrical and Plumbing Technician 900 1,400 Accountant 900 1,750 Sales Coordinator 900 1,150 Wine Steward 880 980 Sales Person 800 1,125 Spa Therapist 800 900 Quality Control Officer 800 2,000 Plumbing Technician 775 1,400 Laboratory Technician 770 970 Cleaning Team Leader 767 767 Chef 750 1,050 Electrical Technician 745 1,317 Safety and Security Officer 738 1,063 Front Office Clerk 725 775 Heat, Air Ventilation, Cooling Technicians and Installers (HAVC) 700 1,200 Planner 700 1,500 Quantity Surveyor 700 800 Lifeguard 700 1,200 Junior Accountant 700 850 Bellboy - Concierge 667 783 Cashier 657 821 Bartender 647 876 Chef de Rang 643 860 Hostess 632 801 Steward 626 803 Indoor Salesperson 625 725 Secretary 625 675 Sandwich Maker 600 1,000 Open Job Positions for Skilled Workers at Interviewed Companies– Ranking by Minimum Salary
Cont’d

Labor Market and Youth Capacity Assessment 134
Minimum salary
in USD (Average) Maximum salary in USD (Average)
Delivery Operator 600 788 Indoor Sales (Junior) 600 800 Shop Drawer 600 800 Driver 600 800 Baker 600 800 Valet Parking Cashier 600 700 Maintenance Technician 600 1,000 Commis Chef 590 740 Phone Operator 590 710 Assistant Chef 587 730 Mechanical Technician 585 1,000 Quality Control Technician 570 800 Receptionist 558 842 F&B Waiter 550 700 Pressman 550 800 Audio-visual Technician 550 800 Waiter 538 723 Cash Van 525 767 Machine Operator 523 808 Headwaiter 520 700 Delivery Driver 500 661 Industrial Technical Clerk 500 900 Data Entry Operator 500 550 Forklift Driver 500 635 Bus Driver 500 635 Runner 476 598 Housekeeper 475 725 Steel Fixer 440 616 Labor 433 600 Cheesemonger 433 1,000 Cleaning Agent 400 550 Carpenter 390 792 Painter 310 425 Barista 300 420 Source: Interviews with 76 companies

Salaries by Sector
Table 110. Salaries in the Advertising Sector Position Fresh Graduate 1 year 2 years 3 years 5 years 7 years 10 years 15 years 20 years
Account Director
Prior Account Managerial Experience Required
Prior Account Managerial Experience Required
Prior Account Managerial Experience Required
Prior Account Managerial Experience Required
$2,500 - $3,300
$3,300 - $3,900
$3,900 - $4,700
Promoted to General Manager
Promoted to General Manager
Account Executive $800-$950 $950-$1,100 $1,100-$1,450 $1,450 - $1,800 Promoted to Account Manager
Promoted to Account Manager
Promoted to Account Manager
Promoted to Account Manager
Promoted to Account Manager
Account Manager Prior Account Executive Required
Prior Account Executive Required
Prior Account Executive Required
$2,000 - $2,450 $2,450 - $2,600
$2,600 - $3,300
$3,300-$4,000
Promoted to Senior Account Manager or Account Director
Promoted to Senior Account Manager or Account Director
Accountant $750 - $900 $900 - $1,000 $1,000 - $1,250 $1,250 - $1,700 $1,700 - $2,000
Promoted to Chief Accountant
Promoted to Chief Accountant
Promoted to Chief Accountant
Promoted to Chief Accountant
Art Director
Prior Graphic Design/ Copywriting Experience Required
Prior Graphic Design/ Copywriting Experience Required
Prior Graphic Design/ Copywriting Experience Required
$2,000 - $2,300 $2,300 - $2,500
$2,500-$2,750 $2,750 - $3,000
$3,000 - $3,500
$3,500 - $4,500
Copywriter $900 - $1,100 $1,100 - $1,300 $1,300 - $1,500 $1,500 - $2,000 $2,000 - $2,500
Usually Promoted to Creative Director
Usually Promoted to Creative Director
Usually Promoted to Creative Director
Usually Promoted to Creative Director
Creative Director
Prior Graphic Design/ Copywriting Experience Required
Prior Graphic Design/ Copywriting Experience Required
Prior Graphic Design/ Copywriting Experience Required
Prior Graphic Design/ Copywriting Experience Required
$2,500 - $3,500
$4,000 - $6,000
$6,000 - $8,000
$8,000-$10,000
$10,000-$15,000
General Manager Prior Experience Required
Prior Experience Required
Prior Experience Required
Prior Experience Required
Prior Experience Required
Prior Experience Required
$5,750 - $9,500
$9500 - $12,500
$12,500 - $16,000
Media Executive $800 - $1,000 $1,000 - $1,200 $1,200 - $1,500 $1,500 - $2,000 Promoted to Media Manager
Promoted to Media Manager
Promoted to Media Manager
Promoted to Media Manager
Promoted to Media Manager
Media Manager Prior Experience as Media Executive
Prior Experience as Media Executive $1,500 - $2,000 $2,000 - $2,500
$2,500 - $3,000
$3,000 - $3,500
$3,500 - $4,000
$4,000 - $7,000
$5,000 - $8,000
Media Planner $800 - $1,000 $1,000 - $1,200 $1,200 - $1,500 $1,500 - $2,000 $2,000 - $2,500
Maximum $3,000
Maximum $3,000
Maximum $3,000
Maximum $3,000
Source InfoPro Research & Lebanon Opportunities, 2012

Table 111. Salaries in the Banking Sector Position Fresh Graduate 1 year 2 years 3 years 5 years 7 years 10 years 15 years 20 years
Assistant Branch Manager
Prior Banking and Operation Experience Required
Prior Banking and Operation Experience Required
Prior Banking and Operation Experience Required
Prior Banking and Operation Experience Required
$1,100-$2,300 $1,300-$2,500 $1,400-$2,700
$1,650-$3,300
$2,100-$4,000
Bank Branch Manager
Prior Banking Management Experience Required
Prior Banking Management Experience Required
Prior Banking Management Experience Required
Prior Banking Management Experience Required
$2,700-$3,700 $2,700-$3,000 $3,000-$4,400
$3,400-$5,100
$3,900-$5,900
Bank Security Coordinator N/A N/A N/A $1,650-$2,100 $1,900-$2,500 $2,050-$2,700
$2,200-$2,900
$2,500-$3,350
$2,750-$4,000
Business Manager
Prior Banking Management Experience Required
Prior Banking Management Experience Required
Prior Banking Management Experience Required
$2,200-$2,600 $2,300-$2,800 $2,400-$2,950 $2,600-$3,200
$2,900-$3,700
$3,300-$4,200
Chairman & General Manager
Prior Banking Management Experience Required
Prior Banking Management Experience Required
Prior Banking Management Experience Required
Prior Banking Management Experience Required
Prior Banking Management Experience Required
Prior Banking Management Experience Required
$9,500-$10,500
$10,700-$11,900
$12,400-$13,800
Checking/Debit Card Business Manager
Prior Banking and Operation Management Experience Required
Prior Banking and Operation Management Experience Required
Prior Banking and Operation Management Experience Required
Prior Banking and Operation Management Experience Required
$1,900-$2,400 $2,000-$2,500 $2,200-$2,700
$2,500-$3,100
$2,900-$3,800
Chief Financial Officer
Prior Financial Experience Required
Prior Financial Experience Required
Prior Financial Experience Required
Prior Financial Experience Required
$5,200-$6,200 $5,600-$6,650 $6,400-$7,750
$7,200-$8,900
$8,300-$10,400
Collection Specialist
Prior Credit Collection Experience Required
Prior Credit Collection Experience Required
Prior Credit Collection Experience Required
$1,800-$2,100 $2,000-$2,300 $2,100-$2,500 $2,200-$2,700
$2,500-$3,000
$2,900-$3,500
Collector $450-$500 $450-$550 $450-$600 $550-$750 $700-$800 $700-$850 $800-$900
Usually Promoted to Collection Specialist
Usually Promoted to Collection Specialist
Commercial Loan Officer
Prior Credit Assessment Experience Required
Prior Credit Assessment Experience Required
Prior Credit Assessment Experience Required
$1100-$1,250 $1,200-$1,350 $1,300-$1,550 $1,500-$1,650
$1,600-$1,900
$1,800-$2,200
Commercial Relationship Manager
Prior Commercial Credit Management Experience Required
Prior Commercial Credit Management Experience Required
Prior Commercial Credit Management Experience Required
Prior Commercial Credit Management Experience Required
$2,900-$3,300 $3,000-$3,500 $3,300-$3,800
$3,700-$4,300
$4,300-$5,000

Consumer Credit Analyst
Prior Credit Analysis Experience Required
Prior Credit Analysis Experience Required
$1100-$1,300 $1,200-$1,400 $1,250-$1,500 $1,400-$1,600 $1,500-$1,700
$1,700-$1,950
$1,900-$2,200
Table 111. Salaries in the Banking Sector (cont)
Position Fresh Graduate 1 year 2 years 3 years 5 years 7 years 10 years 15 years 20 years
Credit Relations Manager
Prior Credit Management Experience Required
Prior Credit Management Experience Required
Prior Credit Management Experience Required
Prior Credit Management Experience Required
$3,700-$4,400 $3,950-$4,600 $4,300-$5,000
$4,900-$5,800
$5,500-$6,700
Customer Care Representative
Prior Communication Experience Required
Prior Communication Experience Required
$790-$1,100 $950-$1,150 $1,250-$1,350 $1,400-$1,500 $1,500-$1,650
$1,650-$1,900
$1,900-$2,200
Customer Services $440-$500 $500-$750 $650-$1050 $800-$1,200 $750-$1,200 $900-$1,400 $1000-$1,650
Usually Promoted to Customer Services Supervisor
Usually Promoted to Customer Services Supervisor
Finance/ Accounting Manager
Prior Financial Analysis Experience Required
Prior Financial Analysis Experience Required
Prior Financial Analysis Experience Required
Prior Financial Analysis Experience Required
$2,750-$3,300 $3,500-$4,000 $3,900-$4,500
$4,400-$5,200
$5,000-$5,900
Financial Analyst Prior Financial Experience Required
Prior Financial Experience Required
Prior Financial Experience Required
$1,600-$2,000 $1,650-$2,100 $1,750-$2,200 $1,900-$2,400
$2,200-$2,800
$2,950-$3,800
Financial Auditor Prior Financial Experience Required
Prior Financial Experience Required
$2,500-$2,800 $2,600-$2,900 $2,800-$3,200 $3,000-$3,400 $3,300-$3,700
$3,700-$4,300
$4,300-$4,950
Financial System Application Developer
Prior Application Developing Experience Required
Prior Application Developing Experience Required
Prior Application Developing Experience Required
$1,100-$1,400 $1,600-$2,200 $1,900-$2,600 $2,100-$2,900
$2,500-$3,300
$2,900-$3,700
Foreign Exchange Manager
Prior Stock/Financial Funds Management Experience Required
Prior Stock/Financial Funds Management Experience Required
Prior Stock/Financial Funds Management Experience Required
Prior Stock/Financial Funds Management Experience Required
$2,500-$3,150 $2,950-$3,600 $3,200-$4,000
$3,600-$4,600
$4,200-$5,200
Head Teller Prior Teller Experience Required
Prior Teller Experience Required
Prior Teller Experience Required
$770-$1,200 $900-$1,300 $950-$1,400 $1000-$1,500
$1,300-$1,700
$1,450-$1,900
HR Assistant Manager
Prior Human Resources Management Experience Required
Prior Human Resources Management Experience Required
Prior Human Resources Management Experience Required
$1,600-$2,000 $1,700-$2,100 $1,800-$2,200 $2,100-$2,600
Usually Promoted to HR Manager
Usually Promoted to HR Manager

HR Manager
Prior Human Resource Management Experience Required
Prior Human Resource Management Experience Required
Prior Human Resource Management Experience Required
Prior Human Resource Management Experience Required
$4,000-$4,700 $4,400-$5,000 $4,700-$5,500
$5,400-$6,300
$6,300-$7,200
Internal Audit Manager
Prior Auditing Experience Required
Prior Auditing Experience Required
Prior Auditing Experience Required
Prior Auditing Experience Required
$2,900-$3,300 $3,000-$3,500 $3,300-$3,700
$3,750-$4,400
$4,400-$5,300
Table 111. Salaries in the Banking Sector (cont)
Position Fresh Graduate 1 year 2 years 3 years 5 years 7 years 10 years 15 years 20 years IT Application Developer
Prior IT Experience Required
Prior IT Experience Required $1000-$1,500 $1,550-$1,900 $1,700-$2,100 $1,650-$2,100
$1,800-$2,300
$2,000-$2,600
$2,400-$3,000
IT Audit Supervisor Prior IT Auditing Experience Required
Prior IT Auditing Experience Required
Prior IT Auditing Experience Required
Prior IT Auditing Experience Required
Prior IT Auditing Experience Required
$3,200-$3,700 $3,500-$4,000
$4,000-$4,700
$4,600-$5,400
IT Auditor Prior IT Experience Required
Prior IT Experience Required
Prior IT Experience Required $1,600-$2,000 $1,750-$2,100 $2,000-$2,400
$2,100-$2,600
Usually Promoted to IT Audit Supervisor
Usually Promoted to IT Audit Supervisor
Loan Officer
Prior Credit Assesment Experience Required
Prior Credit Assesment Experience Required
Prior Credit Assesment Experience Required
$750-$800 $1000-$1,300 $1000-$1,300 $1,300-$1,600
$1,500-$1,900
N/A
Market Risk Director
Prior Banking Management Experience Required
Prior Banking Management Experience Required
Prior Banking Management Experience Required
Prior Banking Management Experience Required
Prior Banking Management Experience Required
$3,400-$4,200 $3,700-$4,600
$4,300-$5,300
$4,800-$6,000
Marketing Manager Prior Marketing Experience Required
Prior Marketing Experience Required
Prior Marketing Experience Required
Prior Marketing Experience Required
$2,900-$3,350 $3,000-$3,550 $3,600-$4,300
$4,000-$4,900
$4,700-$5,700
Marketing Officer Prior Marketing Experience Required
Prior Marketing Experience Required
$900-$1000 $1000-$1,400 $1,200-$1,500 $1,250-$1,600
Usually Promoted to Marketing Manager
Usually Promoted to Marketing Manager
Usually Promoted to Marketing Manager
Operation Audit Supervisor
Prior Operation Auditing Experience Required
Prior Operation Auditing Experience Required
Prior Operation Auditing Experience Required
Prior Operation Auditing Experience Required
$1,550-$2,000 $2,000-$2,400 $2,200-$2,600
$2,500-$3,000
$3,000-$3,600
Operation Auditor Prior Operation Experience Required
Prior Operation Experience Required
$1,700-$1,900 $1,600-$1,800 $1,800-$2,000 $1,850-$2,200
Usually Promoted to Operation Audit Supervisor
Usually Promoted to Operation Audit Supervisor
Usually Promoted to Operation Audit Supervisor
Operations Manager
Prior Banking Operation Management Experience Required
Prior Banking Operation Management Experience Required
Prior Banking Operation Management Experience Required
Prior Banking Operation Management Experience Required
$2,400-$2,950 $2,500-$3,100 $2,700-$3,500
$3,100-$4,200
$3,600-$4,900

Personal Loan Consultant
Prior Credit Management Experience Required
Prior Credit Management Experience Required
Prior Credit Management Experience Required
Prior Credit Management Experience Required
$1,500-$1,600 $1,550-$1,700 $1,650-$1,900
$1,800-$2,200
$2,200-$2,500
Table 111. Salaries in the Banking Sector (cont)
Position Fresh Graduate 1 year 2 years 3 years 5 years 7 years 10 years 15 years 20 years
Regional Manager
Prior Banking Management and International Relations Experience Required
Prior Banking Management and International Relations Experience Required
Prior Banking Management and International Relations Experience Required
Prior Banking Management and International Relations Experience Required
Prior Banking Management and International Relations Experience Required
Prior Banking Management and International Relations Experience Required
$9,000-$10,500
$10,200-$12,000
$11,700-$13,900
Retail Connections Representative
Management Skills Required
Management Skills Required
Management Skills Required $1000-$1,300 $1,100-$1,350 $1,500-$1,800
$1,500-$2,000
$1,800-$2,200
$2,000-$2,500
Senior Credit Risk Analyst
Prior Senior Credit Management Experience Required
Prior Senior Credit Management Experience Required
Prior Senior Credit Management Experience Required
Prior Senior Credit Management Experience Required
Prior Senior Credit Management Experience Required
$2,700-$3,400 $2,900-$3,700
$3,300-$4,200
$3,900-$4,800
Senior Credit Risk Auditor
Prior Credit Auditing/Analysis Experience Required
Prior Credit Auditing/Analysis Experience Required
Prior Credit Auditing/Analysis Experience Required
Prior Credit Auditing/Analysis Experience Required
$1,600-$2,300 $1,700-$2,400 $1,800-$2,600
$2,100-$3,000
$2,400-$3,500
Senior Operations Manager
Prior Operation Management Experience Required
Prior Operation Management Experience Required
Prior Operation Management Experience Required
Prior Operation Management Experience Required
Prior Operation Management Experience Required
Prior Operation Management Experience Required
$4,400-$5,300
$5,000-$6,000
$5,800-$7,000
Teller $440-$750 $440-$750 $440-$770 $500-$800 $550-$880 Usually Promoted to Head Teller
Usually Promoted to Head Teller
Usually Promoted to Head Teller
Usually Promoted to Head Teller
Training Coordinator Management Skills Required
Management Skills Required
$900-$1,100 $1000-$1,400 $1,150-$1,500 $1,250-$1,600
Usually Promoted to Assistant HR Manager
Usually Promoted to Assistant HR Manager
Usually Promoted to Assistant HR Manager
VP Internal Audit
Prior Auditing and Banking Management Experience Required
Prior Auditing and Banking Management Experience Required
Prior Auditing and Banking Management Experience Required
Prior Auditing and Banking Management Experience Required
Prior Auditing and Banking Management Experience Required
Prior Auditing and Banking Management Experience Required
$4,250-$4,900
$4,700-$5,700
$5,400-$6,600
Source InfoPro Research & Lebanon Opportunities, 2012

Table 112. Salaries in the Engineering and Construction Sector Position Fresh Graduate 1 year 2 years 3 years 5 years 7 years 10 years 15 years 20 years
Architect $1200-$1300 $1300-$1400 $1400-$1700 $1700-$2000 $2000-$2400 $2400-$3200 $3200-$3900
$3900-$4500 $4500-$5300
Construction Manager N/A N/A N/A N/A N/A $2450-$3000 $3000-$4100 $4100-$4800 $4800-$5400
Electrical Engineer $1100-$1200 $1200-$1300 $1300-$1500 $1500-$1900 $1900-$2300 $2300-$2800 $2800-$3700 $3700-$4200 $4200-$5000
Foreman $600-$700 $700-$800 $800-$900 $900-$1000 $1000-$1200 $1200-$1400 $1400-$1600
$1600-$1800 $1800-$2200
Mechanical Engineer $1100-$1200 $1200-$1300 $1300-$1500 $1500-$1800 $1800-$2300 $2300-$3000 $3000-$3600
$3600-$3900 $3900-$4600
Quality Control Surveyor $1200-$1250 $1250-$1300 $1300-$1500 $1500-$2000 $2000-$2200 $2200-$2600
$2600-$3200 $3200-$4200 $4200-$5400
Site Engineer $1200-$1300 $1300-$1500 $1500-$1700 $1700-$2000 $2000-$2200 $2200-$2600 $2600-$3000
$3000-$3500 $3500-$4000
Structural Engineer $1300-$1400 $1400-$1500 $1500-$1800 $1800-$2000 $2000-$2600 $2600-$3000 $3000-$3800
$3800-$4500 $4500-$5200
Surveyor $900-$950 $950-$1000 $1000-$1100 $1100-$1200 $1200-$1500 $1500-$1700 $1700-$1900 $1900-$2200 $2200-$2600
Source InfoPro Research & Lebanon Opportunities, 2012

Table 113. Salaries in the FMCG Sector Position Fresh Graduate 1 year 2 years 3 years 5 years 7 years 10 years 15 years 20 years
Accountant $750-$850 $850-$900 $900-$1,000 $1,000-$1,100
$1,100-$1,300
Promoted to Chief Accountant
Promoted to Chief Accountant
Promoted to Chief Accountant
Promoted to Chief Accountant
Accounting Manager/Chief Accountant
Prior Accounting Experience Required
Prior Accounting Experience Required
Prior Accounting Experience Required
Prior Accounting Experience Required
Prior Accounting Experience Required
$2,100-$2,600
$2,600-$3,000
$3,000-$3,500
$3,500-$4,000
Brand Manager Prior Product Knowledge Experience Required
Prior Product Knowledge Experience Required
Prior Product Knowledge Experience Required
$1,400-$1,900
$1,900-$2,000
$2,000-$2,300
$2,300-$2,500
$2,500-$2,900
$2,900-$3,800
Distribution Manager Prior Distribution Experience Required
Prior Distribution Experience Required
Prior Distribution Experience Required
Prior Distribution Experience Required
$1,500-$1,600
$1,600-$1,700
$1,700-$2,200
$2,200-$2,600
$2,600-$3,100
Executive Secretary Prior Experience Required
Prior Experience Required
Prior Experience Required
Prior Experience Required
$1,200-$1,400
$1,400-$1,500
$1,500-$1,700
$1,700-$2,000
$2,000-$2,400
Finance Manager Prior Financial Experience Required
Prior Financial Experience Required
Prior Financial Experience Required
Prior Financial Experience Required
Prior Financial Experience Required
$4,000-$4,500
$4,500-$5,000
$5,000-$5,600
$5,600-$6,700
General Manager Prior Management Experience Required
Prior Management Experience Required
Prior Management Experience Required
Prior Management Experience Required
Prior Management Experience Required
Prior Management Experience Required
$6,000-$7,000
$7,000-$10,000
$10,000-$12,000
Human Resource Manager
Prior HR Experience Required
Prior HR Experience Required
Prior HR Experience Required
$1,800-$2,100
$2,100-$2,400
$2,400-$3,000
$3,000-$3,700
$3,700-$4,000
$4,000-$5,000
IT Manager Prior Information Technology Experience Required
Prior Information Technology Experience Required
Prior Information Technology Experience Required
Prior Information Technology Experience Required
Prior Information Technology Experience Required
$3,000-$3,500
$3,500-$4,000
$4,000-$5,000
$5,000-$6,000
Marketing Manager Prior Marketing Experience Required
Prior Marketing Experience Required
Prior Marketing Experience Required
$2,200-$2,300
$2,300-$2,500
$2,500-$3,000
$3,000-$3,500
$3,500-$4,200
$4,200-$4,800
Purchasing Manager Prior Experience Required
Prior Experience Required
Prior Experience Required
Prior Experience Required
$2,000-$2,500
$2,500-$2,700
$2,700-$3,000
$3,000-$3,400
$3,400-$4,100
Sales Manager Prior Sales Experience Required
Prior Sales Experience Required
Prior Sales Experience Required
Prior Sales Experience Required
$2,200-$2,800
$2,800-$3,100
$3,100-$3,600
$3,600-$4,400
$4,400-$5,500
Secretary $650-$750 $750-$800 $800-$850 $850-$900 $900-$1,000 $1,000-$1,100
$1,100-$1,300
$1,300-$1,500
$1,500-$1,800
Warehouse Manager Prior Experience Required
Prior Experience Required
Prior Experience Required
Prior Experience Required
$2,100-$2,400
$2,400-$2,600
$2,600-$2,800
$2,800-$3,000
$3,000-$3,600
Source InfoPro Research & Lebanon Opportunities, 2012

Table 114. Salaries in the Hotel Sector Position Fresh Graduate 1 year 2 years 3 years 5 years 7 years 10 years 15 years 20 years
Accountant $800-$1,000 $800-$1,000 $800-$1,000 $1,000-$1,200 $1,200-$1,400 Maximum $1,500
Promoted to Senior Accountant
Promoted to Senior Accountant
Promoted to Senior Accountant
Bellhop/Porter $330-$440 $440-$480 $480-$500 $500-$550 $550-$600 $600-$700 $700-$800 $800-$900 $900-$1000
Cashier $330-$440 $330-$440 $440-$500 $500-$550 $550-$600 Promoted to Junior Accountant
Promoted to Junior Accountant
Promoted to Junior Accountant
Promoted to Junior Accountant
Catering Services Manager
Prior experience required
Prior experience required
Prior experience required
$1,100-$1,300 $1,300-$1,500 $1,500-$1,800
$1,800-$2,200
$2,200-$2,700
$2,700-$3,300
Chef De Partie Prior experience required
Prior experience required
Prior experience required
$800-$1,000 $1,000-$1,100 $1,100-$1,300
$1,300-$1,800
$1,800-$2,000
Promoted to Executive chef
Chief Engineer Prior experience required
Prior experience required
Prior experience required
Prior experience required
Prior experience required
$1,800-$2,000
$2,000-$2,300
$2,300-$2,700 $2,700-$3,500
Concierge $330-$400 $400-$450 $450-$500 $500-$550 $550-$600 $600-$700 $700-$800 $800-$900 $900-$1,000
Executive Chef Prior experience required
Prior experience required
Prior experience required
$1,300-$1,450 $1,450-$1,800 $1,800-$2,100
$2,100-$2,500
Promoted to head chef
Promoted to head chef
Financial Director/Controller
Prior experience in financial management
Prior experience in financial management
Prior experience in financial management
Prior experience in financial management
Prior experience in financial management
$2,600-$3,300
$3,300-$4,100
$4,100-$5,000 $5,000-$6,000
Financial Section Manager
Prior experience in finance
Prior experience in finance
Prior experience in finance $1,100-$1,400 $1,400-$1,500
$1,500-$1,900
Promoted to Finacial Director
Promoted to Finacial Director
Promoted to Finacial Director
Food & Beverages Director
Prior experience in hospitality management
Prior experience in hospitality management
Prior experience in hospitality management
Prior experience in hospitality management
$1,650-$2,000 $2,000-$2,500
$2,500-$3,000
$3,000-$3,750 $3,750-$5,000
Front Desk Attendant $400-$525 $400-$525 $525-$575 $575-$625 $625-$800 $1,250-$1,500
Promoted to Reservation Officer
Promoted to Reservation Officer
Promoted to Reservation Officer
Front Office Executive Prior experience required
Prior experience required
Prior experience required
$700-$800 $800-$900 $900-$1,300 $1,300-$1,500
Promoted to Reservation Manager
Promoted to Reservation Manager
Front Office Manager Prior experience required
Prior experience required
Prior experience required
Prior experience required
$1,000-$1,200 $1,200-$1,350
$1,350-$1,550
$1,550-$2,400 $2,400-$2,650
General Manager Prior experience in senior management
Prior experience in senior management
Prior experience in senior management
Prior experience in senior management
Prior experience in senior management
$2,800-$5,500
$5,500-$7,200
$7,200-$8,800
$8,800-$10,000
Head Chef Prior experience required
Prior experience required
Prior experience required
$1,400-$1,600 $1,600-$1,900 $1,900-$2,500
$2,500-$2,750
$2,750-$3,000
$3,000-$3,000

Table 114. Salaries in the Hotel Sector (cont)
Position Fresh Graduate 1 year 2 years 3 years 5 years 7 years 10 years 15 years 20 years
IT Manager Prior experience in senior management
Prior experience in senior management
Prior experience in senior management
Prior experience in senior management
$1,000-$1,300 $1,300-$1,500
$1,500-$1,900
$1,900-$2,100
$2,100-$2,700
Line Cook $440-$550 $550-$600 $600-$700 $700-$750 $750-$800 $800-$850 $850-$900 $900-$950 $950-$1,000
Maintenance Supervisor
Prior experience required
Prior experience required
$550-$700 $700-$800 $900-$1,000 $1,000-$1,100
$1,100-$1,500
$1,500-$1,800
Promoted to maintenance manager
Maintenance Technician
Prior experience required
Prior experience required
$350-$550 $550-$700 $700-$800 $800-$900 $900-$1,100 Promoted to maintenance supervisor
Promoted to maintenance supervisor
Night Auditor Prior experience required
Prior experience required
Prior experience required
$625-$700 $700-$800 $800-$925 $925-$1,050 $1,050-$1,150
$1,150-$1,500
Purchasing Agent $350-$450 $350-$450 $500-$600 $600-$700 $600-$700 $700-$900 Promoted to purchasing supervisor
Promoted to purchasing supervisor
Promoted to purchasing supervisor
Purchasing Manager Prior experience in purchasing
Prior experience in purchasing
Prior experience in purchasing
Prior experience in purchasing
$1,100-$1,400 $1,400-$1,800
$1,800-$2,000
$2,000-$2,200 $2,200-$2,400
Purchasing Supervisor Prior experience in purchasing
Prior experience in purchasing
Prior experience in purchasing
$700-$800 $800-$900 $900-$1,000 $1,000-$1,100
Promoted to purchasing manager
Promoted to purchasing manager
Reservation Manager/Officer
Prior experience required
Prior experience required
Prior experience required
Prior experience required
$1,100-$1,300 $1,300-$1,800
$1,800-$2,200
$2,200-$2,700
$2,700-$3,300
Restaurant Manager Prior experience required
Prior experience required
Prior experience required
Prior experience required
$1,000-$1,250 $1,250-$1,450
$1,450-$1,650
$1,650-$2,000 $2,000-$2,500
Room Service Staff Prior experience required
Prior experience required
$350-$400 $400-$550 $550-$600 $600-$700 $700-$800 Promoted to Room Service Supervisor
Promoted to Room Service Supervisor
Sales/Marketing Director
Prior experience in senior marketing management
Prior experience in senior marketing management
Prior experience in senior marketing management
Prior experience in senior marketing management
$1,700-$2,200 $2,200-$2,750
$2,750-$3,300
$3,300-$4,300 $4,300-$5,000
Sales/Marketing Manager
Prior experience in marketing management
Prior experience in marketing management
Prior experience in marketing management
Prior experience in marketing management
$1,500-$1,750 $1,750-$2,000
$2,000-$2,350
$2,350-$2,750
$2,750-$3,500
Server, Cocktail, & Banquet Manager
Prior experience in hospitality management
Prior experience in hospitality management
Prior experience in hospitality management
Prior experience in hospitality management
$1,000-$1,300 $1,300-$1,600
$1,600-$2,000
$2,000-$2,400 $2,400-$3,300

Table 114. Salaries in the Hotel Sector (cont)
Position Fresh Graduate 1 year 2 years 3 years 5 years 7 years 10 years 15 years 20 years
Server, Cocktail, & Banquet Supervisor
Prior experience in hospitality management
Prior experience in hospitality management
Prior experience in hospitality management
$700-$800 $800-$900 $900-$1,000 $1,000-$1,100
Promoted to Server, Cocktail, & Banquet Manager
Promoted to Server, Cocktail, & Banquet Manager
Source InfoPro Research & Lebanon Opportunities, 2012

Table 115. Salaries in the Information Technology Sector Position Fresh Graduate 1 year 2 years 3 years 5 years 7 years 10 years 15 years 20 years
Application Programmers $800-$1,200 $1,200-$1,300 $1,300-$1,500 $1,500-$1,800 $1,800-$2,300
$2,300-$2,700
$2,700-$2,900
Promoted to Project Manager
Business Analyst $750-$900 $900-$1,000 $1,000-$1,300 $1,300-$1,700 $1,700-$2,000 $2,000-$2,500
$2,500-$3,200
$3,200 - $4,000
$4,000-$4,600
Network Engineer $900-$1000 $1000-$1,100 $1,100-$1,400 $1,400-$1,700 $1,700-$1,800 $1,800-$2,200
Promoted to Senior Network Engineer
Promoted to Senior Network Engineer
Promoted to Senior Network Engineer
Project Manager
Prior experience required as Application/System Programmer, System Analyst or Technical Support
Prior experience required as Application/System Programmer, System Analyst or Technical Support
Prior experience required as Application/System Programmer, System Analyst or Technical Support
$1,900-$2,300 $2,300-$2,600 $2,600-$3,100
$3,100-$3,200.
$3,100-$3,200.
$3,100-$3,200.
Sales Manager Prior experience required in sales
Prior experience required in sales
Prior experience required in sales $1,800-$2,000 $2,000-$2,600
$2,600-$3,500
$3,500-$4,500
$3,500-$4,500
$3,500-$4,500
Senior Network Engineer
Prior Network Engineering experience required
Prior Network Engineering experience required
Prior Network Engineering experience required
$1,400-$1,700 $1,700-$1,800 $1,800-$2,200
$2,200-$2,500
$2,200-$2,500
$2,200-$2,500
System Analyst Prior System Programmer experience required
Prior System Programmer experience required
Prior System Programmer experience required
Prior System Programmer experience required
$2,100-$3,100 $3,100-$3,500
Promoted to Web Developer/ PM
Promoted to Web Developer/ PM
Promoted to Web Developer/ PM
System Developer $700-$1,000 $1,000-$1,200 $1,200-$1,600 $1,600-$2,000 $2,000-$2,400 $2,400-$2,600
$2,600-$2,800.
$2,600-$2,800.
$2,600-$2,800.
System Programmers $700-$900 $900-$1,150 $1,150-$1,400 $1,400-$1,900 $1,900-$2,300 $2,300-$2,600
Promoted to Project Manager
Promoted to Project Manager
Promoted to Project Manager
Technical Sales $800-$900 $900-$1200 $1,200-$1,400 $1,400-$1,600 $1,600-$1,900 $1,900-$2,100
Promoted to Sales Manager
Promoted to Sales Manager
Promoted to Sales Manager
Technical Support $600-$800 $800-$900 $900-$1,100 $1,100-$1,400 $1,400-$1,700 $1,700-$1,800
Promoted to Project Manager/ Network Engineer
Promoted to Project Manager/ Network Engineer
Promoted to Project Manager/ Network Engineer
Web Developer $700-$900 $900-$1,000 $1,000-$1,400 $1,400-$1,700 $1,700-$1,900 $1,900-$2,000
$2,000-$2,600
$2,600-$3,300
$3,300-$4,600
Source InfoPro Research & Lebanon Opportunities, 2012

Table 116. Salaries in the Insurance Sector Position Fresh Graduate 1 year 2 years 3 years 5 years 7 years 10 years 15 years 20 years
Account Executive Prior Experience Required
Prior Experience Required
$1,000-$1,175 $1,175-$1,400 $1,400-$1,750
Usually promoted to Account Manager
Usually promoted to Account Manager
Usually promoted to Account Manager
Usually promoted to Account Manager
Account Manager Prior Account Executive experience required
Prior Account Executive experience required
Prior Account Executive experience required
$2,050-$2,300 $2,300-$2,550 $2,550-$2,900
$2,900-$3,000
$3,000-$3,550
$3,550-$4,650
Accountant $500-$600 $600-$750 $750-$875 $875-$1,050 $1,050-$1,250 $1,250-$1,500
Usually promoted to Financial Manager
Usually promoted to Financial Manager
Usually promoted to Financial Manager
Call Center Operator $525-$625 $625-$700 $700-$750 $750-$825 $825-$925 $925-$1,050 $1,050-$1,225
$1,225-$1,625
$1,625-$2,175
Claims Manager Prior Claims Management experience required
Prior Claims Management experience required
Prior Claims Management experience required
Prior Claims Management experience required
$1,900-$2,250 $2,150-$2,750
$2,750-$3,250
$3,250-$4,300
$4,300-$5,500
Clerk $500-$550 $550-$600 $600-$650 $650-$725 $725-$875 $875-$1,025 $1,025-$1,350
$1,350-$1,950
$1,950-$2,500
Collector $575-$600 $600-$625 $625-$675 $675-$750 $750-$950 $950-$1,150 $1,150-$1,550
$1,550-$2,200
$2,200-$2,875
Executive Secretary $550-$650 $650-$700 $700-$775 $775-$850 $850-$1,050 $1,050-$1,350
$1,350-$1,750
$1,750-$2,550
$2,550-$3,250
Financial Manager Prior Finance / Accounting experience required
Prior Finance / Accounting experience required
Prior Finance / Accounting experience required
Prior Finance / Accounting experience required
$5,000-$5,250 $5,250-$5,500
$5,500-$5,750
$5,750-$6,750
$6,750-$9,000
General Manager Prior Insurance Management experience required
Prior Insurance Management experience required
Prior Insurance Management experience required
Prior Insurance Management experience required
$5,000-$6,000 $6,000-$6,750
$6,750-$8,500
$8,500-$11,250
$11,250-$14,100
IT Manager Prior IT experience required
Prior IT experience required
Prior IT experience required
Prior IT experience required
$1,700-$2,000 $2,000-$2,500
$2,500-$2,950
$2,950-$3,300
$3,300-$3,750
Junior Actuarial $675-$775 $775-$875 $875-$950 $950-$1,275 $1,275-$1,750
Usually promoted to Senior Actuarial
Usually promoted to Senior Actuarial
Usually promoted to Senior Actuarial
Usually promoted to Senior Actuarial
Risk Manager Prior Insurance Management experience required
Prior Insurance Management experience required
Prior Insurance Management experience required
Prior Insurance Management experience required
Prior Insurance Management experience required
$3,500-$4,000
$4,000-$4,500
$4,500-$6,500
$6,500-$9,200

Table 116. Salaries in the Insurance Sector (cont)
Position Fresh Graduate 1 year 2 years 3 years 5 years 7 years 10 years 15 years 20 years
Sales Agent $425-$500 $500-$550 $550-$600 $600-$750 $750-$875
Usually promoted to Sales / Marketing Assistant or Manager
Usually promoted to Sales / Marketing Assistant or Manager
Usually promoted to Sales / Marketing Assistant or Manager
Usually promoted to Sales / Marketing Assistant or Manager
Secretary $500-$600 $600-$650 $650-$725 $725-$800 $800-$950 $950-$1,125 $1,125-$1,450
$1,450-$2,000
$2,000-$2,450
Senior Actuarial Prior Actuarial experience required
Prior Actuarial experience required
Prior Actuarial experience required
Prior Actuarial experience required
$2,000-$2,675 $2,675-$3,075
$3,075-$4,450
$4,450-$6,500
$6,500-$9,675
Underwriter $550-$750 $750-$925 $925-$1,025 $1,025-$1,475 $1,475-$1,700 $1,700-$1,950
$1,950-$2,250
$2,250-$2,575
$2,575-$3,650
Underwriting Manager Prior Underwriting experience required
Prior Underwriting experience required
Prior Underwriting experience required
Prior Underwriting experience required
Prior Underwriting experience required
$2,500-$3,125
$3,125-$4,375
$4,375-$5,225
$5,225-$6,125
Source InfoPro Research & Lebanon Opportunities, 2012

Table 117. Salaries in the Manufacturing Sector Position Fresh Graduate 1 year 2 years 3 years 5 years 7 years 10 years 15 years 20 years
Accountant $600 - $700 $700 - $800 $800 - $850 $850 - $900 $900 - $1,000 Promoted to Chief Accountant
Promoted to Chief Accountant
Promoted to Chief Accountant
Promoted to Chief Accountant
Chief Accountant Prior Experience as Accountant Required
Prior Experience as Accountant Required
Prior Experience as Accountant Required
Prior Experience as Accountant Required
$1,650 - $1,850
$1,850 - $2,000
$2,000 - $2,200
$2,200 - $3,000
Promoted to Financial Manager
Chief Financial Officer/ Finance Director
Prior Experience as Financial Manager Required
Prior Experience as Financial Manager Required
Prior Experience as Financial Manager Required
Prior Experience as Financial Manager Required
Prior Experience as Financial Manager Required
$4,000 - $4,500
$4,500 - $5,500
$5,500 - $6,500
$6,500 - $8,000
Deputy General Manager
Prior Managerial Experience Required
Prior Managerial Experience Required
Prior Managerial Experience Required
Prior Managerial Experience Required
$3,000 - $3,500
$3,500 - $4,000
$4,000 - $5,000
$5,000 - $6,500
$6,500 - $8,000
Director of Sales & Marketing / Director of Marketing
Prior Experience as Commercial Sales Director Required
Prior Experience as Commercial Sales Director Required
Prior Experience as Commercial Sales Director Required
Prior Experience as Commercial Sales Director Required
Prior Experience as Commercial Sales Director Required
Prior Experience as Commercial Sales Director Required
$4,500 - $5,500
$5,500 - $6,500
Maximum salary $7,500
Executive Secretary Prior Secretarial Experience Required
Prior Secretarial Experience Required
Prior Secretarial Experience Required
Prior Secretarial Experience Required
$1,100 - $1,200
$1.200 - $1,400
$1,400 - $1,600
$1,600 - $1,750
Maximum Salary $2,500
Financial Manager / Controller
Prior Experience as Chief Accountant Required
Prior Experience as Chief Accountant Required
Prior Experience as Chief Accountant Required
Prior Experience as Chief Accountant Required
Prior Experience as Chief Accountant Required
$2,500 - $3,500
$3,500 - $5,500
Promoted to Chief Financial Officer
Promoted to Chief Financial Officer
Formalities Clerk $400 - $500 $500 - $550 $550 - $600 $600 - $650 $650 - $700 $700 - $750 $750 - $800 Maximum salary $800
Maximum salary $800
General Manager Prior Managerial Experience Required
Prior Managerial Experience Required
Prior Managerial Experience Required
Prior Managerial Experience Required
Prior Managerial Experience Required
Prior Managerial Experience Required
$7,000 - $7,500
$7,500 - $9,000
$9,000 - $10,500
Human Resources Manager
Prior experience as Assistant HR Manager required
Prior experience as Assistant HR Manager required
Prior experience as Assistant HR Manager required
Prior experience as Assistant HR Manager required
Prior experience as Assistant HR Manager required
$2,000 - $2,500
$2,500 - $3,000
$3,000 - $3,500
$3,500 - $4,000

Table 117. Salaries in the Manufacturing Sector (cont)
Position Fresh Graduate 1 year 2 years 3 years 5 years 7 years 10 years 15 years 20 years
Purchasing Manager Prior Experience as Purchasing Officer Required
Prior Experience as Purchasing Officer Required
Prior Experience as Purchasing Officer Required
Prior Experience as Purchasing Officer Required
Prior Experience as Purchasing Officer Required
$4,000 - $4,500
$4,500 - $5,000
$5,000 - $6,000
$6,000 - $7,000
Purchasing Officer / Supervisor
Prior Purchasing Experience Required
Prior Purchasing Experience Required
$750 - $800 $800 - $1,000 $1,000 - $1,200
$1,200 - $1,300
$1,300 - $1,500
Promoted to Purchasing Manager
Promoted to Purchasing Manager
Quality Assurance Manager
Prior Experience in Quality Control Required
Prior Experience in Quality Control Required
Prior Experience in Quality Control Required
Prior Experience in Quality Control Required
$1,300 - $1,450
$1,450 - $1,750
$1,750 - $2,000
$2,000 - $2,500
$2,500 - $3,500
Receptionist $550 - $600 $600 - $650 Promoted to Secretary
Promoted to Secretary
Promoted to Secretary
Promoted to Secretary
Promoted to Secretary
Promoted to Secretary
Promoted to Secretary
Sales Manager* Prior Sales Unit Experience Required
Prior Sales Unit Experience Required
Prior Sales Unit Experience Required
Prior Sales Unit Experience Required
$2,000 - $2,300
$2,300 - $ 2,800
$2,800 - $ 2,900
Promoted to Director of Sales & Marketing
Promoted to Director of Sales & Marketing
Sales Supervisor Prior Sales Related Experience Required
Prior Sales Related Experience Required
Prior Sales Related Experience Required
Prior Sales Related Experience Required
$800 - $1,300 $1,300 - $1,600
$1,600 - $1700
Can be promoted to Sales Manager
Sales Unit Manager / Local Market
Prior Sales Supervision Experience Required
Prior Sales Supervision Experience Required
Prior Sales Supervision Experience Required
Prior Sales Supervision Experience Required
Prior Sales Supervision Experience Required
Prior Sales Supervision Experience Required
Prior Sales Supervision Experience Required
Prior Sales Supervision Experience Required
Can Be Promoted to Area Manager or Sales Manager
Salesman* $700 - $800 $800 - $900 $900 - $1,000 $1,000 - $1,100
$1,100 - $1,200
Maximum Basic $1,300
Maximum Basic $1,300
Maximum Basic $1,300
Maximum Basic $1,300
Secretary Prior Experience as Receptionist Required
$650 - $750 $750 - $950 Promoted to Executive Secretary
Promoted to Executive Secretary
Promoted to Executive Secretary
Promoted to Executive Secretary
Promoted to Executive Secretary
Skilled Workers $400 - $450 $450 - $500 $500 - $550 $550 - $600 $600 - $650 $650 - $750 Maximum salary $750
Maximum salary $750
Maximum salary $750
Store Keeper $500 - $600 $600 - $650 $650 - $700 $700 - $750 $750 - $850 $850 - $950 $950 - $1000
Promoted to Warehouse Manager
Promoted to Warehouse Manager
Van Driver $500 - $570 $570 - $620 $620 - $700 $700 - $780 $780 - $850 $850 - $950 $930 - $1,000
Maximun salary $1,000
Maximun salary $1,000
Warehouse Inventory Manager
Prior experience required
Prior experience required
Prior experience required
Prior experience required
$1,000 - $1,200
$1,200 - $1,350
$1,350 - $1,450
$1,450 - $1,850
$1850 - $2,000

Table 117. Salaries in the Manufacturing Sector (cont)
Position Fresh Graduate 1 year 2 years 3 years 5 years 7 years 10 years 15 years 20 years
Warehouse Manager Prior experience required
Prior experience required
Prior experience required
Prior experience required
$1,200 - $1,400
$1,400 - $1,600
$1,600 - $1,900
$1,900 - $2,200
$2,200 - $2,500
Source InfoPro Research & Lebanon Opportunities, 2012

Table 118. Salaries in the Restaurant Sector Position Fresh Graduate 1 year 2 years 3 years 5 years 7 years 10 years 15 years 20 years
Accountant $500-$600 $600-$700 $700-$800 $800-$900 $900-$950 $950-$1000 $1,100 - $1,400
$1,400 - $1,750
$1,750 - $2,250
Captain $650-$750 $650-$750 $650-$750 $750-$850 $850-$950 Promoted to Chef de Partie
Promoted to Chef de Partie
Promoted to Chef de Partie
Promoted to Chef de Partie
Catering Services Manager
Prior experience in Catering
Prior experience in Catering
Prior experience in Catering
Prior experience in Catering
$1,100-$1,300 $1,300-$1,500
$1,500-$1,600
$1,600-$1,800
$1,800 - $2,000
Chef de Partie Prior experience as Captain
Prior experience as Captain
Prior experience as Captain $650-$700 $700-$900 $900-$1000
$1000-$1250 $1250-$1500 $1500-$1700
Executive Chef Prior experience as Head Chef
Prior experience as Head Chef
Prior experience as Head Chef
Prior experience as Head Chef
$1600-$2000 $2000-$2800 $2800-$3600
$3600-$4500 $3600-$4500
Financial Director/Controller
Prior experience in Accounting and Finance
Prior experience in Accounting and Finance
Prior experience in Accounting and Finance
Prior experience in Accounting and Finance
Prior experience in Accounting and Finance
$2,750-$3,250
$3,250-$4,000
$4,000 - $6,000
$4,000 - $6,000
General Manager Prior managerial experience required
Prior managerial experience required
Prior managerial experience required
Prior managerial experience required
Prior managerial experience required
Prior managerial experience required
$4,000-$5,000
$5,000-$6,000
$6,000-$7,000
Head Chef Prior experience as Chef de Partie
Prior experience as Chef de Partie
Prior experience as Chef de Partie
Prior experience as Chef de Partie
$900-$1,200 $1,200-$1,300
$1,300-$1,400
Promoted to Catering Services Manager
Promoted to Catering Services Manager
HR Manager Prior experience in Human Resources
Prior experience in Human Resources
Prior experience in Human Resources
Prior experience in Human Resources
$2,500-$3,000 $3,000-$3,500
$3,500-$4,500
$4,500 - $5,500
$4,500 - $5,500
IT Manager Prior experience in IT Prior experience in IT Prior experience in IT Prior experience in IT
Prior experience in IT
$2,000-$2,500
$2,500-$3,000
$3,000 - $4,500
$3,000 - $4,500
Purchasing Manager Prior experience required
Prior experience required
Prior experience required
Prior experience required
$1,250-$1,500 $1,500-$1,750
$1,750-$2,000
$2,000-$2,500
$2,000-$2,500
Restaurant Manager Prior experience in Hospitality
Prior experience in Hospitality
Prior experience in Hospitality
Prior experience in Hospitality
$950-$1,100 $1,100-$1,300
$1,300-$1,400
$1,400-$1,450
$1,450-$1,500
Waiter $500-$560 $500-$560 $600-$700 $700-$800 Promoted to Captain
Promoted to Captain
Promoted to Captain
Promoted to Captain
Promoted to Captain
Source InfoPro Research & Lebanon Opportunities, 2012

Table 119. Salaries in the Retail Sector Position Fresh Graduate 1 year 2 years 3 years 5 years 7 years 10 years 15 years 20 years
Cashier $500 - $600 $600 -$650 $600 -$650 $650 - $750 $750 - $850 $850 - $950 $950 - $1,100
$1,100 - $1,250
$1,250 - $1,500
Finance/Accounting Manager
Prior Experience Required
Prior Experience Required
Prior Experience Required
Prior Experience Required
Prior Experience Required
$1,900 - $2,800
$2,800 - $3,800
$3,800 - $4,400
$4,400 - $5,200
General Manager Prior Experience Required
Prior Experience Required
Prior Experience Required
Prior Experience Required
Prior Experience Required
$4,300 - $5,700
$5,700 - $7,200
$7,200 - $8,300
$8,300 - $9,400
Invoicing Officer $550 - $600 $600 - $650 $650 - $700 $700 - $800 $800 - $850 $850 - $900 $900 - $1,100
$1,100 - $1,250
$1,250 - $1,400
Operations Manager Prior Experience Required
Prior Experience Required
Prior Experience Required
Prior Experience Required
$1,800 - $2,300
$2,300 - $2,400
$2,400 - $2,800
$2,800 - $3,300
$3,300 - $3,800
POS Manager Prior Experience Required
Prior Experience Required
Prior Experience Required
Prior Experience Required
$1,200 - $1,400
$1,400 - $1,500
$1,500 - $1,600
$1,600 - $2,200
$2,200 - $3,000
Purchasing Manager Prior Experience Required
Prior Experience Required
Prior Experience Required
Prior Experience Required
$1,900 - $2,100
$2,100 - $2,300
$2,300 - $2,700
$2,700 - $3,000
$3,000 - $3,600
Visual Merchandiser Prior Experience Required
Prior Experience Required
Prior Experience Required
$1,000 - $1,100
$1,100 - $1,400
$1,400 - $1,500 Promoted Promoted Promoted
Source InfoPro Research & Lebanon Opportunities, 2012

Table 120. Salaries in the Travel and Tourism Sector Position Fresh Graduate 1 year 2 years 3 years 5 years 7 years 10 years 15 years 20 years
Chief Accountant Prior Accounting Experience Required
Prior Accounting Experience Required
Prior Accounting Experience Required
Prior Accounting Experience Required
$1,800-$2,000 $2,000-$2,250
$2,250-$3,000
$3,000-$4,000
$4,000-$5,000
Drivers $500-$575 $575-$625 Maximun Salary $700
Maximun Salary $700
Maximun Salary $700
Maximun Salary $700
Maximun Salary $700
Maximun Salary $700
Maximun Salary $700
Executive Secretary Prior Secreterial Experience Required
Prior Secreterial Experience Required
Prior Secreterial Experience Required $1,000-$1,200 $1,200-$1,350
Maximun Salary $1,500
Maximun Salary $1,500
Maximun Salary $1,500
Maximun Salary $1,500
Flight Reservation Officer $600-$850 $850-$1,000 $1,000-$1,200 $1,200-$1,300 $1,300-$1,350 $1,350-
$1,450
Maximum Salary $1,800
Maximum Salary $1,800
Maximum Salary $1,800
Hotel Reservation Manager
Prior Experience Required
Prior Experience Required
Prior Experience Required
Prior Experience Required
$1,250-$1,500 $1,500-$1,900
$1,900-$2,500
$1,900-$2,500
$1,900-$2,500
Hotel Reservation Officer/Assistant $500-$675 $675-$800 $800-$900 $900-$1,100 $1,100-$1,500
Promoted to Hotel Reservation Manager
Promoted to Hotel Reservation Manager
Promoted to Hotel Reservation Manager
Promoted to Hotel Reservation Manager
Incoming/Outgoing Ticketing Manager
Prior Experience Required in Ticketing
Prior Experience Required in Ticketing
Prior Experience Required in Ticketing
$800-$1,350 $1,350-$1,800 $1,800-$2,750
$2,750-$3,625
$3,625-$4,500
Maximum Salary $5,000
Junior Accountant $600-$700 $700-$800 $800-$850 $850-$1,100 Promoted to Senior Accountant
Promoted to Senior Accountant
Promoted to Senior Accountant
Promoted to Senior Accountant
Promoted to Senior Accountant
Office Representative in the Airport $500-$575 $500-$575 $500-$575 $500-$575 $500-$575 $500-$575 $500-$575 $500-$575 $500-$575
Postman-Office Boy $450-$525 $525-$575 $525-$575 $575-$700 $700-$750 $700-$750 $750-$825 Maximum Salary $900
Maximum Salary $900
Secretary $850-$900 $900-$950 $950-$1,000 Promoted to Executive Secretary
Promoted to Executive Secretary
Promoted to Executive Secretary
Promoted to Executive Secretary
Promoted to Executive Secretary
Promoted to Executive Secretary
Senior Accountant Prior Accounting Experience Required
Prior Accounting Experience Required
Prior Accounting Experience Required $1,200-$1,300 $1,300-$1,400
$1,400-$1,500
$1,500-$1,600
Promoted to Chief Accountant
Promoted to Chief Accountant
Ticketing Officer $600-$700 $700-$750 $750-$800 $800-$1,100 $1,100-$1,300 $1,300-$1,450
Promoted to Ticketing Manager
Promoted to Ticketing Manager
Promoted to Ticketing Manager
Tour Coordinator $600-$800 $600-$800 $600-$800 $600-$800 $600-$800 $600-$800 $600-$800 $600-$800 $600-$800
Source InfoPro Research & Lebanon Opportunities, 2012

Job Openings and Skills Required by Sub-sector
Agro-Alimentary
Table 121. Job Openings and Skills Required in the Agro-Alimentary Sector
Job openings Skills required Number of each job position
Baker
*Knowledge of Bread Recipes *English Language *Hygiene *Writing Skills *Arabic Language *Learning Skills *Responsive *Analytical Skills *Positive Attitude
8
Cash Van
*Experience in Cash *Age 25-45 *Communication skills *Computer skills
5
Cashier
*Communication Skills *Languages *Trustworthy *Computer and Technologies Skills *Customer Service Skills *Positive Attitude
2
Cheesemonger
*Knowledge of Dairy Products Items *Methods of Cutting Dairy Products Items *Customer Service Skills *Languages (English, French)
1

Table 121. Job Openings and Skills Required in the Agro-Alimentary Sector
Job openings Skills required Number of each job position
Chef de Partie *Leadership Skills *Communication Skills *Time Management Skills
5
Chef de Rang *Languages (English, French) 5 Commis Chef *Positive Attitude 7
Counter sales
*Communication Skills *Languages (English, French) *Presentable *Physical Fitness
5
Drivers
*Knowledge of All Lebanese Regions *Handle Pressure *Positive Attitude *Knowledge of All Lebanese Regions *Supervisory Skills
5
Electrical Technician
*Knowledge of Electro-Mechanical Tools and equipment *Maintenance Skills *Communication Skills *Knowledge of safety and security standards *Analytical Skills *Team Work Spirit
Don’t know
Executive Assistant
*Languages (English, French) *Communication Skills *Knowledge of Cleaning Methods *Time Management Skills *Flexibility
1
Forklift Driver *Works on Lifting Machines *Driving Skills *Communication Skills
Don’t know

Table 121. Job Openings and Skills Required in the Agro-Alimentary Sector
Job openings Skills required Number of each job position
Indoor Salesperson
*Communication Skills *Languages (English, French) *Good Personal Appearance *Listening Skills *Problem Solving *Customer Service Skills *English Language *Report Writing Skills *Detail Oriented
23
Industrial Technical Clerk *Knowledge of Silver Work *Manual Skills 5
Laborer *Energetic *Responsive *Fast Learning Skills
2
Laboratory Technician *Knowledge of Food Processing *Computer and Technologies Skills *Analytical Skills
1
Machine Operator
*Analytical Skills *Works on Extruder Machines *Time Management Skills *Communication Skills *Mechanical Skills *English Language *Computer and Technologies Skills *Writing Skills *Reading Skills
5

Table 121. Job Openings and Skills Required in the Agro-Alimentary Sector
Job openings Skills required Number of each job position
Maintenance Technician *English Language *Computer and Technologies Skills 2
Mechanical Technician
*Communication Skills *Analytical Skills *Team Work Spirit *Knowledge of safety and security standards *Knowledge of Electro-Mechanical Tools and equipment *Maintenance Skills
2
Mechanical, Electrical and Plumbing Technician
*Operating Manufacturing Machines *English Language
2
Quality Control Technician
*Communication Skills *Analytical Skills *Team Work Spirit *Knowledge of safety and security standards *Knowledge of Electro-Mechanical Tools and equipment *Maintenance Skills
Don’t know
R&D Specialist
*Computer and Technologies Skills *Communication Skills *Customer Service Skills *Organizational and Planning Skills *Flexibility *Time Management Skills
1
Sales Coordinator
*Languages (English, French) *Communication Skills *Knowledge of Cleaning Methods *Time Management Skills *Flexibility
1

Table 121. Job Openings and Skills Required in the Agro-Alimentary Sector (cont)
Job openings Skills required Number of each job position
Sweets Maker specialized in Baklava
*Arabic Language *Learning Skills *Responsive *Analytical Skills *Hygiene *Positive Attitude
15
Sweets Maker specialized in Cake pieces Decoration
*Arabic Language *Learning Skills *Responsive *Analytical Skills *Hygiene *Positive Attitude
9
Sweets Maker specialized in Cakes Decoration
*Arabic Language *Learning Skills *Responsive *Analytical Skills *Hygiene *Positive Attitude
9
Sweets Maker specialized in International Cakes
*Arabic Language *Positive Attitude *Learning Skills *Hygiene *Responsive *Analytical Skills *Knowledge of Cake Decoration *Baking Methods
10

Table 121. Job Openings and Skills Required in the Agro-Alimentary Sector
Job openings Skills required Number of each job position
Sweets Maker specialized in Kanafeh
*Arabic Language *Learning Skills *Responsive *Analytical Skills *Hygiene *Positive Attitude
9
Sweets Maker specialized in Oriental Sweet Cream
*Arabic Language *Learning Skills *Responsive *Analytical Skills *Hygiene *Positive Attitude
9
Sweets Maker specialized in Petit Four
*Arabic Language *Learning Skills *Responsive *Analytical Skills *Hygiene *Positive Attitude
9
Sweets Maker specialized in Syrian Sweet Dates
*Arabic Language *Learning Skills *Responsive *Analytical Skills *Hygiene *Positive Attitude
15
Waiter *Communication Skills *Languages (English, French) *Good Personal Appearance
3
Source: InfoPro interviews with 16 agro-alimentary and beverages companies

Hotels
Table 122. Job Openings and Skills Required in the Hotel Sector
Job openings Skills required Number required for each job position
Assistant Chef
* Knowledge of HACCP Standards * English Language * Arabic Language * Positive Attitude * Performance Skills * Innovative * Professional Cooking & Preserving Methods
8
Audio visual Technician
* Communication Skills * Customer Service Skills * Languages (English, French) * Good Personal Appearance * Positive Attitude * Team Work Spirit
1
Bartender
* English Language * Positive Attitude * Communication Skills * Report Writing Skills * Computer and Technologies Skills * Customer Service Skills * Guest Oriented * Knowledge of Standard Service Sequence * Knowledge of wine types and tasting * Knowledge of F&B Software * Mixology Skills * Knowledge of Beverages * Arabic Language * General Knowledge
25
Bell Boy * Communication Skills 7

* Languages (English, French) * Knowledge of all Lebanese Restaurants and Bars * Customer Service Skills * Communication Skills * Knowledge of Local Area * Computer and Technologies Skills * Good Personal Appearance * Positive Attitude * Team Work Spirit * Handle Pressure * Flexibility

Table 122. Job Openings and Skills Required in the Hotel Sector Job openings Skills required Number required for each job position
Carpenter
* Communication Skills * Customer Service Skills * Languages (English, French) * Good Personal Appearance * Positive Attitude * Team Work Spirit
1
Cashier
* Customer Service Skills * English Language 1
Chef de Partie
* Knowledge of HACCP Standards * English Language * Innovative * Computer and Technologies Skills
1
Chef de Rang
* Communication Skills * Customer Service Skills * Languages (English, French) * Good Personal Appearance * Positive Attitude * Team Work Spirit
8
Cleaning Agent
* Arabic Language * English Language * Handle Pressure * Customer Service Skills * Positive Attitude
9

Table 122. Job Openings and Skills Required in the Hotel Sector
Job openings Skills required Number required for each job position
Cleaning Team Leader
* English Language * Arabic Language * Guest Oriented * Computer and Technologies Skills * Positive Attitude
1
Commis Chef
* Professional Cooking & Preserving Methods * English Language * Hygiene * Positive Attitude * Handle Pressure
21
Electrical Technician * Electrical Skills 2
Electrician
* Communication Skills * Customer Service Skills * Languages (English, French) * Good Personal Appearance * Positive Attitude * Team Work Spirit
2
Electro-Mechanical Technician
* Mechanical Skills * Electrical Skills
2
F&B Waiter
* Communication Skills * Customer Service Skills * Languages (English, French) * Good Personal Appearance * Positive Attitude * Team Work Spirit * English Language * Knowledge of Standard Service Sequence
75

Table 122. Job Openings and Skills Required in the Hotel Sector
Job openings Skills required Number required for each job position
Front Office Clerk
* Languages (English, French) * Communication Skills * Guest Oriented * Computer and Technologies Skills * Knowledge of Remote Access Client Software (CMS) * English Language * Arabic Language * Customer Service Skills * Social Interaction Skills
6
Hostess
* Good Personal Appearance * Positive Attitude * Knowledge of Standard Service Sequence * Communication Skills * Guest Oriented * English Language * Computer and Technologies Skills * Problem Solving * Languages (English, French) * Customer Service Skills * Detail Oriented
7
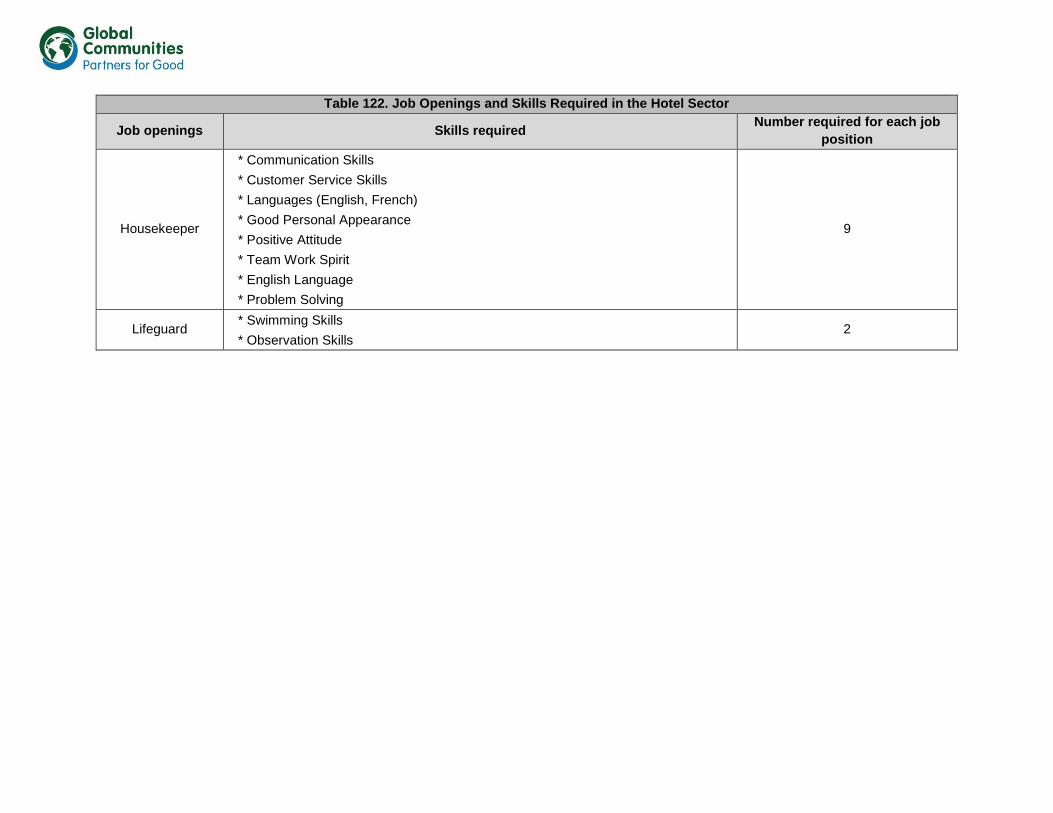
Table 122. Job Openings and Skills Required in the Hotel Sector
Job openings Skills required Number required for each job position
Housekeeper
* Communication Skills * Customer Service Skills * Languages (English, French) * Good Personal Appearance * Positive Attitude * Team Work Spirit * English Language * Problem Solving
9
Lifeguard * Swimming Skills * Observation Skills
2

Table 122. Job Openings and Skills Required in the Hotel Sector
Job openings Skills required Number required for each job position
Mechanical, Electrical and Plumbing Technician
* English Language * Positive Attitude * Computer and Technologies Skills
1
Painter * Knowledge of Painting * Knowledge of safety and security standards
2
Phone Operator
* English Language * Handle Pressure * Communication Skills * Customer Service Skills * Languages (English, French) * Computer and Technologies Skills * Problem Solving
2
Plumber
* Communication Skills * Customer Service Skills * Languages (English, French) * Good Personal Appearance * Positive Attitude * Team Work Spirit
1
Pressman
* Communication Skills * Customer Service Skills * Languages (English, French) * Good Personal Appearance * Positive Attitude * Team Work Spirit
2

Table 122. Job Openings and Skills Required in the Hotel Sector
Job openings Skills required Number required for each job position
Receptionist
* Communication Skills * English Language * Computer and Technologies Skills * Good Personal Appearance * Languages (English, French) * Customer Service Skills * Positive Attitude * French Language * Basic Accounting Knowledge * Guest Oriented * Report Writing Skills * Problem Solving * Team Work Spirit * Knowledge of Remote Access Client Software (CMS) * Listening Skills
13

Table 122. Job Openings and Skills Required in the Hotel Sector
Job openings Skills required Number required for each job position
Runner
* Communication Skills * Customer Service Skills * Languages (English, French) * Good Personal Appearance * Positive Attitude * Team Work Spirit * Observation Skills * Computer and Technologies Skills * Hygiene * English Language * Handle Pressure * Knowledge of the Food Menu List Components * Arabic Language
28
Safety Officer
* Detail Oriented * English Language * Positive Attitude * Good Personal Appearance * Arabic Language * Computer and Technologies Skills * Observation Skills * Customer Service Skills
6

Table 122. Job Openings and Skills Required in the Hotel Sector
Job openings Skills required Number required for each job position
Sales Coordinator
* English Language * Communication Skills * Customer Service Skills * Public Relations * Computer and Technologies Skills
1
Sales Person
* English Language * Communication Skills * Customer Service Skills * Public Relations * Computer and Technologies Skills * Languages (English, French) * Good Personal Appearance * Strong Interpersonal Skills
4
SPA Therapist * English Language * Customer Service Skills
3

Table 122. Job Openings and Skills Required in the Hotel Sector
Job openings Skills required Number required for each job position
Steward
* English Language * Report Writing Skills * Communication Skills * Time Management Skills * Quality Management Skills * Positive Attitude * Handle Pressure
3
Valet Parking Cashier
* Guest Oriented * English Language * Computer and Technologies Skills * Basic Accounting Knowledge
2

Table 122. Job Openings and Skills Required in the Hotel Sector
Job openings Skills required Number required for each job position
Waiter
* Languages (English, French) * Positive Attitude * Customer Service Skills * English Language * Communication Skills * Knowledge of the Food Menu List Components * Knowledge of Standard Service Sequence * Guest Oriented * Computer and Technologies Skills * Knowledge of wine types and tasting * Knowledge of F&B Software * Good Personal Appearance
11
Wine Steward
* Knowledge of wine types and tasting * Knowledge of the Food Menu List Components * Communication Skills * Computer and Technologies Skills * Positive Attitude * English Language
1
Source: InfoPro interviews with 18 hotels

Restaurants
Table 123. Job Openings and Skills Required in the Restaurant Sector Job openings Skills required Number required for each job position
Accountant * Knowledge of Invoice Reconciliation * Typing Skills * Basic Accounting Knowledge
2
Assistant Chef
* English Language * Hygiene * Professional Cooking & Preserving Methods * Computer and Technologies Skills * Customer Service Skills * Communication Skills
57
Barista
* Customer Service Skills * Handle Pressure * Communication Skills * Hygiene * Manual Skills * English Language
3

Table 123. Job Openings and Skills Required in the Restaurant Sector Job openings Skills required Number required for each job position
Bartender
* Good Personal Appearance * Strong Interpersonal Skills * Communication Skills * Languages (English, French) * Ambition * Savoir-Vivre * Organizational and Planning Skills * Customer Service Skills * Positive Attitude * Hygiene * English Language
26
Cashier
* Positive Body Language Techniques * Customer Service Skills * Communication Skills * Handle Pressure * Languages (English, French) * Computer and Technologies Skills * Knowledge of Accounting Software * English Language * Good Personal Appearance * Positive Attitude * Hygiene
20
Table 123. Job Openings and Skills Required in the Restaurant Sector Job
openings Skills required Number required for each job position
Chef * Hygiene * Professional Cooking & Preserving Methods
19

* Knowledge of International Cooking Recipes * Customer Service Skills
Chef de Partie
* Fast Learning Skills * Arabic Language * Communication Skills * Knowledge of safety and security standards
3
Chef de Rang
* Time Management Skills * Leadership Skills * Quality Management Skills * Communication Skills * Supervisory Skills
15
Commis Chef
* Knowledge of Lebanese Cooking Recipes * Knowledge of HACCP Standards * Knowledge of ISO 22000 Standards * Knowledge of International Cooking Recipes * Knowledge of Middle East Cooking Recipes * Professional Cooking & Preserving Methods * Knowledge of safety and security standards
11
Delivery Driver
* Hygiene * Communication Skills * Driving Skills * Analytical Skills * Customer Service Skills * Knowledge of Local Area * Handle Pressure
7
Table 123. Job Openings and Skills Required in the Restaurant Sector Job openings Skills required Number required for each job position
Delivery Operator
* Responsive * Communication Skills * Languages (English, French) * Leadership Skills
8

* Time Management Skills * Quality Management Skills * Supervisory Skills
Headwaiter
* Communication Skills * Customer Service Skills * Time Management Skills * Flexibility * Supervisory Skills
25
Hostess
* Good Personal Appearance * Communication Skills * English Language * Languages (English, French) * Arabic Language * Positive Attitude * Customer Service Skills * Organizational and Planning Skills * Good Personal Appearance
37
Table 123. Job Openings and Skills Required in the Restaurant Sector Job openings Skills required Number required for each job position
Phone Operator
* Communication Skills * Customer Service Skills * Handle Pressure * Languages (English, French) * English Language * Problem Solving * Computer and Technologies Skills
18
Runner * Energetic * Strong Interpersonal Skills * Communication Skills
37

* Customer Service Skills * Good Personal Appearance * Ambition * Hygiene * Analytical Skills * English Language * Positive Attitude * Savoir-Vivre * Arabic Language
Table 123. Job Openings and Skills Required in the Restaurant Sector Job openings Skills required Number required for each job position
Sandwich Maker * Communication Skills * Customer Service Skills
10
Steward
* Time Management Skills * Quality Management Skills * Detail Oriented * Communication Skills * Supervisory Skills
87
Waiter
* Languages (English, French) * Good Personal Appearance * Communication Skills * Customer Service Skills * English Language * Positive Attitude * Computer and Technologies Skills * Professional Cooking & Preserving Methods * Hygiene * Flexibility * Savoir-Vivre
245

* Time Management Skills * Arabic Language * Ambition * Fast Learning Skills * Knowledge of the Food Menu List Components
Source: InfoPro interviews with 16 restaurants

Building and Construction
Table 124. Job Openings and Skills Required in the Building and Construction Sector Job openings Skills required Number of each job position
Accountant *Knowledge of Lebanese Law 1
Carpenter
*Knowledge of wood work and types *Knowledge of Doka Woodwork *English Language *Report Writing Skills *Team Work Spirit *Social Interaction Skills
25
Cash Van
*English Language *Communication Skills *Customer Service Skills *Computer and Technologies Skills
1
Concrete Foreman
*Knowledge of Concrete Work *Map Reading *Leadership Skills *Communication Skills *Strong Interpersonal Skills
4
Data Entry Operator
*Computer and Technologies Skills *English Language *Typing Skills *Team Work Spirit *Organizational and Planning Skills
2
Electrical Technician
*English Language *Computer and Technologies Skills *General Knowledge *Knowledge of Low Voltage Equipment
12

Table 124. Job Openings and Skills Required in the Building and Construction Sector Job openings Skills required Number of each job position
Electrician *Positive Attitude *English Language *Knowledge of Solar Photovoltaic
1
Finishing Foreman
*Knowledge of Painting *Knowledge of Gypsum Board Work *Knowledge of Tiling Work *Map Reading *Leadership Skills *Communication Skills *Strong Interpersonal Skills
3
Foreman *Leadership Skills *Quality Management Skills 5
Heat, Air Ventilation, Cooling Technicians and Installers
(HAVC)
*French Language *English Language *Electrical Skills *Knowledge of Welding Work
2
Junior Accountant
*English Language *Typing Skills *Knowledge of Accounting Software *Handle Pressure *Computer and Technologies Skills
1
Machine Operator * Knowledge of Woodwork and Types * Works on Lifting Machines 2
Mechanical Technician *English Language *Computer and Technologies Skills *Analytical Skills
Painter * Knowledge of Woodwork and Types *Knowledge of Painting 20
Planner *Software (certain primavera) 7

Table 124. Job Openings and Skills Required in the Building and Construction Sector Job openings Skills required Number of each job position
Plumber *Positive Attitude *English Language 1
Quality Control Officer *Language (English) *Experience *Drawing knowledge
1
Quantity Surveyor
* Knowledge of AutoCAD *Knowledge of MS Office *Knowledge of Topography *Knowledge of Concrete Work
3
Safety Officer
* Knowledge of safety and security standards *Works on Tower Cranes *Works on Lifting Machines *Strong Interpersonal Skills *Communication Skills *English Language *Computer and Technologies Skills
4
Sales Executive
*Communication Skills *Goal Oriented *English Language *Computer and Technologies Skills *Positive Attitude *Selling Skills *Negotiation *Observation Skills *Detail Oriented *Mechanical Skills
5

Table 124. Job Openings and Skills Required in the Building and Construction Sector Job openings Skills required Number of each job position
Secretary *Knowledge of MS Office *Languages (English, French) 4
Shop Drawers * Knowledge of AutoCAD *Knowledge of Robotics 3
Steel Fixer *Knowledge of Steelwork *Map Reading 5
Technician specialized in AC maintenance
*Report Writing Skills *Positive Attitude *Ambition
10
Source: InfoPro interviews with 26 building and construction companies

© InfoPro Research 2015 182
Recommendations Table 125. Recommendations
Area Aspect Measures Stakeholders
Training program
improvements
Enhance value of
vocational and technical studies
Short term: Schools, with the support of the Ministry of Education Improve school guidance of students about studies
Educational institutions to invite speakers from the private sector for some of the classes provided
Technical and vocational institutes, private sector
Awareness-raising sessions on TVE at schools CHF in collaboration with Ministry of Education and schools
Medium Term: MEHE, public and private schools and TVE
institutions Improve interface between TVE and general education in terms of examinations, progression and movement between subsectors
Make internships a mandatory part of each TVE program Technical and vocational institutes, private sector
Long Term: Ministry of Education Make the Technical Diploma (LT) equivalent to a Bachelor’s
Degree (BA) Source: InfoPro

© InfoPro Research 2015 183
Table 125. Recommendations cont’d Area Aspect Measures Stakeholders
Training program
improvements
Improve quality of
teaching in the public TVE
system
Medium Term: Ministry of Education, public TVE schools
in collaboration with the private sector Introduce qualification standards, which should include industry experience, for the employment of technical and vocational teachers on temporary contracts at public schools
Introduce new certificates or courses pertaining to sales in the TVE system.
CHF to coordinate with technical and vocational institutes, Ministry of Education, and the private
sector Long Term:
Ministry of Education, public TVE schools Mandatory testing for all teachers working on a contractual basis.
Teacher training at the national teacher training institution for technical education should be adapted to the new TVE curricula.
Ministry of Education, national teacher training institution for technical education
TVE curriculum review, especially in the areas of hospitality, administration, and accounting.
Collaboration between technical and vocational schools, Ministry of Education, and the private
sector Source: InfoPro

© InfoPro Research 2015 184
Table 125. Recommendations cont’d Area Aspect Measures Stakeholders
Bridge labor
demand-supply gap
Exchange of information
between TVE and the private sector
Short term: CHF in collaboration with Ministry of Education, National Employment Office and schools Sessions on the current needs of the labor market at schools
Medium Term: Coordination by CHF and under the patronage of Ministry of Education, the National Employment
Office, Ministry of Social Affairs, and the International Labour Office; in collaboration with technical and vocational schools and the private
sector
Workshop to be carried out once every three years between the private sector and technical and vocational schools to discuss jobs and skills in high demand but that are currently unavailable in the labor market
Youth Employment assistance
Short term: Technical and vocational institutes and their
alumni, private sector Technical and vocational institutes to be more proactive and approach companies in the sectors where their graduates work (with the help of their alumni)
More companies to offer more internships to TVE students Technical and vocational institutes, private sector
More companies to adopt electronic tools (social media, company website, job search engines) for youth recruitment Private sector
Medium Term: CHF, technical and vocational institutes and
learning centers The teaching of job search and interview skills to be included in technical and vocational programs
Source: InfoPro

© InfoPro Research 2015 185
Profile of Focus Group Participants Table 126. Profile of Focus Group Participants
Focus Group Name Age Education Employment situation
1 Jacques 25 Contractor/freelancer Looking for a full time job 1 Rami al-Sayyed 25 Accounting graduate BT-TS Looking for a job 1 Naaima 24 Graphic design graduate Looking for a job 1 Ali 26 BT3 electronics, CHF graduate in sales and marketing and AutoCad Working in the internet field as a freelancer
1 Nissrine N/A Started studying philosophy but did not graduate, studied esthetics at Makhzoumi
Unemployed housewife considering opening her own business
2 Sami Al Masri 22 N/A Helps his brother at the gym as a trainer 2 Samer Al Chami 21 N/A Works at a pharmaceutical company 2 (name not clear) 28 N/A Housewife 2 Rasha Khalil 23 N/A Unemployed but is taking tests at a new employer 2 Marwa Khaled 20 N/A Unemployed 2 Hiyam 29 N/A Unemployed housewife 2 Hanadi Wehbi 32 Taking make-up classes Housewife 2 Tarek N/A Studied MIS but did not graduate Working as a gym coach 2 Rabab N/A Fresh graphic design graduate Has never worked before 3 Israa 19 First-year management student at University N/A 3 Malak 20 Second-year Business information systems student at University N/A 3 Iman 19 Third-year accountant student at an institute N/A 3 Ahmad N/A Second-year student at CIS N/A 3 Mohammad N/A Second-year IT student at CIS N/A 3 Khaled 18 Still at school, wants to study engineering N/A 3 Khodor 18 Industrial mechanics N/A 3 Hassan 19 Had training courses at Makhzoumi Unemployed 3 Yehya 18 Third-year heating and cooling systems student at Debes institute N/A 3 Hassan 19 Heating and cooling systems student at an institute N/A 3 Mohammad N/A Studied electrical engineering for 2 years Unemployed
Company Questionnaire
Workforce Gap Analysis Survey

© InfoPro Research 2015 186
QID: قسم مخصص لإلدارة
Interviewer Name: Interview date:
اسم الباحث
Person in charge: No Yes قسم مخصص لإلدارة 02 01 Edited 02 01 Coded 02 01 Quota Checked 02 01 Back-checked
02 01 Accepted 02 01 Imputed
Day Month Year
2015

© InfoPro Research 2015 187
Back-Check Comments: Editing Comments:
Interviewee’s Information معلومات عن المجیب
Company name إسم الشركة
Name of interviewee إسم المجیب
Job Title المركز/المنصب
Telephone number رقم الھاتف
Personal E-mail Address للمجیب البرید األلكتروني
Company Address عنوان الشركة

© InfoPro Research 2015 188
General Company Information:
1a - Where is the company’s head office located?
a 1- ؟الرئیسي للشركة ركزأین یقع الم
1b- What is the number of corporate facilities other than the head office (Branches, Factories, Warehouses, etc.…)
)... خالالمستودعات، المصانع ،،الفروع ( المكتب الرئیسي منشآت أو مرافق الشركة عدا ھو عددما - 1b
1c- Where are the other corporate facilities located?
األخرى للشركة؟ منشآتال تقع أین - 1c 1a- Company’s head office location
الرئیسي للشركة ركزالم
1b- Number of corporate facilities
منشآت او مرافق الشركة عدد
1c-other corporate facilities location
األخرى للشركة منشآتال مواقع

© InfoPro Research 2015 189
2a- What is the primary function or business of the company?
Interviewer: The description should be written down exactly as provided by the respondent and it should be as accurate as possible to facilitate classification. Consequently, the description must specify the activity of the establishment (manufacturing or service) and the product produced or offered.
؟للشركة أو العمل التجاري الرئیسي ما ھو النشاط - 2a التصنیع أو المنشأة ( نشاطل یحدد الوصف ، یجب أن وبالتالي التصنیف. لتسھیل قدر اإلمكان كون دقیقاغي أن ی، وینبالمجیب اه أعط كما حرفیا وصفال كتابة: یجب الباحث
م.المقدّ أو عالمصنّ المنتج الخدمات) و
2b- Company’s Main activity? (Unaided – single response)
2 b - ) إجابة واحدة -االتال تقرأ األحتمما ھو العمل الرئیسي للشركة؟( 01 Agro-alimentary and beverages والمشروبات و الغذائیة – المنتجات الزراعیة
02 Hotels and restaurants الفنادق والمطاعم
03 Building and construction البناء والتشیید

© InfoPro Research 2015 190
95 Refused رفض اإلجابة
97 Do Not Know ال اعلم
General Overview:
G1 – Company size: : ةحجم الشرك – G1b
01 Small ( from 5 to 20 Employees) موظف 20إلى 5من (صغیر(
02 Medium ( from 21 to 100 Employees) موظف 100إلى 21متوسط (من (
03 Large ( More than 100 Employees) موظف 100أكثر من (كبیر(
G2a- How many of your employees are skilled*?
G2b- Please state the distribution of skilled workers* and the total between females and males
G2c- Please state the distribution of skilled workers* and the total between local and foreign
G2d- Please state the distribution of skilled workers* and the total between full-time and part time
؟مھرة عمال ھم موظفیك من كم - G2a G2b- یرجى تحدید توزیع العمال المھرة * ومجموع الموظفین بین إناث وذكور
G2c- یرجى تحدید توزیع العمال المھرة * ومجموع الموظفین بین لبناني وأجنبي G2d- یرجى تحدید توزیع العمال المھرة * ومجموع الموظفین بین عمال دوام كامل ودوام جزئي
Interviewer: Please refer to the below definition:

© InfoPro Research 2015 191
*A skilled worker is any worker who has special skill, training, knowledge, and (usually acquired) ability in their work. A skilled worker may have attended a college, university or technical school. Or, a skilled worker may have learned their skills on the job. Skilled worker do not include employees above the working-supervisor level
:تعریف أدناهال: یرجى الرجوع إلى الباحث یكون حائزاً على شھادة من كلیة أو قد (مكتسبة في العادة). ھذا الموظف من ناحیة التدریب والمعرفة، و القدرة في عملھ ھو أي موظف لدیھ مھارة خاصة، المھرة الموظفون
فالمشر في العمل. وھذا ال یشمل الموظفین فوق مستوى العامل الخبرةمن جامعة أو معھد تقني. أو من الممكن أن یكون قد إكتسب مھاراتھ
G2a G2b G2c G2d Total المجموع Female Male إناث Local ذكور Foreign لبناني
أجنبيFull –time بدوام كامل
Part-time بدوام جزئي
Skilled Workers
عمال مھرة
Total Number of employees
مجموع عدد الموظفین

© InfoPro Research 2015 192
Recruitment:
R1 -How many job openings do you currently have?
R1-لدیك حالیاً؟ كم من الوظائف الشاغرة Number of job openings: :عدد الوظائف الشاغرة
R2 -How many job openings require skilled workers? (Interviewer: Please refer to the below definition)
ه)تعریف أدناال: یرجى الرجوع إلى الباحث؟( ةالوظائف الشاغرة تتطلب موظفون مھر ھذه من كم - R2
A skilled worker is any worker who has special skill, training, knowledge, and (usually acquired) ability in their work. A skilled worker may have attended a college, university or technical school. Or, a skilled worker may have learned their skills on the job. Skilled worker do not include employees above the working-supervisor level
یكون حائزاً على شھادة من كلیة أو قد (مكتسبة في العادة). ھذا الموظف من ناحیة التدریب والمعرفة، و القدرة في عملھ ھو أي موظف لدیھ مھارة خاصة، المھرة وظفونالمفالمشر فوق مستوى العاملفي العمل. وھذا ال یشمل الموظفین من الخبرة جامعة أو معھد تقني. أو من الممكن أن یكون قد إكتسب مھاراتھ
Number of job openings: عدد الوظائف الشاغرة:
Intreviewer: R2 should be less or equal to R1

© InfoPro Research 2015 193
R3a- Specify the job openings that require skilled workers?
R3b- What are the skills (e.g. language, computer, leadership, technical skills…) required for each of these positions? Please Probe
R3c- What is the minimum education required for each of these positions?
R3d- What are the years of experience required for each of these positions?
R3e- What is the minimum salary for each of these positions in USD?
R3f- What is the maximum salary for each of these positions in USD?
R3g- What is the number required for each job position?
؟موظفون مھرة التي تتطلبو فرص العمل الحالیة تحدیدالرجاء - R3a R3b- ما ھي المھارات (مثل اللغات، الكمبیوتر، القیادة، والمھارات التقنیة ...) المطلوبة لكل من ھذه الوظائف ؟ استفسر بالكامل
؟ من ھذه الوظائف للمستوى العلمي المطلوب لكل الحد األدنى ما ھو - R3c ؟ من ھذه الوظائف المطلوبة لكل سنوات الخبرة ما ھي - R3d
R3e- ما ھو الحد األدنى للراتب لكل من ھذه الوظائف بالدوالر األمریكي ؟ R3f- ما ھو الحد األقصى للراتب لكل من ھذه الوظائف بالدوالر األمریكي ؟
من ھذه الوظائف؟ لكلالمطلوب العدد ما ھو - R3g

© InfoPro Research 2015 194
R3a- Job openings that require skilled workers
التي فرص العملموظفون تتطلب
مھرة
R3b- Skills required for each position
المطلوبة لكل المھارات وظیفة
R3c- Minimum Educational level required for each position
للمستوى العلمي المطلوب الحد األدنى لكل وظیفة
R3d- Minimum Years of experience required for each position
سنوات الخبرةل الحد األدنى المطلوبة لكل وظیفة
R3e-Minimum salary for each of these positions in USD
من لكلللراتب الحد األدنى بالدوالر ھذه الوظائف
األمریكي
R3f-Maximum salary for each of these positions in USD
الحد األقصىمن ھذه لكل للراتب
بالدوالر الوظائف األمریكي
R3g-Number of each job position
لكلالمطلوب العدد وظیفة
1- 01 No post-secondary Education
02 Brevet Professionnel – BP
03 Baccalauréat Technique – BT
04 Diplôme de Technicien Supérieur – TS
05 Licence Technique – LT
06 Baccalaureate 07 University
Degree 98 Other Degrees
شھادات أخرى

© InfoPro Research 2015 195
R3a- Job openings that require skilled workers
التي فرص العملموظفون تتطلب
مھرة
R3b- Skills required for each position
المطلوبة لكل تالمھارا وظیفة
R3c- Minimum Educational level required for each position
للمستوى العلمي المطلوب لكل الحد األدنى وظیفة
R3d- Minimum Years of experience required for each position
سنوات الخبرةل الحد األدنى المطلوبة لكل وظیفة
R3e-Minimum salary for each of these positions in USD
من لكلللراتب الحد األدنى بالدوالر ھذه الوظائف
األمریكي
R3f-Maximum salary for each of these positions in USD
الحد األقصىمن ھذه لكلللراتب
بالدوالر الوظائف األمریكي
R3g-Number of each job position
المطلوب العدد وظیفة لكل
2- 01 No post-secondary Education
02 Brevet Professionnel – BP
03 Baccalauréat Technique - BT
04 Diplôme de Technicien Supérieur - TS
05 Licence Technique - LT
06 Baccalaureate
07 University Degree
98 Other Degrees شھادات أخرى
3- 01 No post-secondary Education
02 Brevet Professionnel – BP
03 Baccalauréat Technique - BT

© InfoPro Research 2015 196
04 Diplôme de Technicien Supérieur - TS
05 Licence Technique - LT
06 Baccalaureate
07 University Degree
98 Other Degrees شھادات أخرى
4- 01 No post-secondary Education
02 Brevet Professionnel – BP
03 Baccalauréat Technique - BT
04 Diplôme de Technicien Supérieur - TS
05 Licence Technique - LT
06 Baccalaureate
07 University Degree
98 Other Degrees شھادات أخرى
5- 01 No post-secondary Education
02 Brevet Professionnel – BP
03 Baccalauréat Technique - BT

© InfoPro Research 2015 197
04 Diplôme de Technicien Supérieur - TS
05 Licence Technique - LT
06 Baccalaureate
07 University Degree
98 Other Degrees شھادات أخرى
R3a- Job openings that require skilled workers
التي فرص العملموظفون تتطلب
مھرة
R3b- Skills required for each position
المطلوبة لكل وظیفة المھارات
R3c- Minimum Educational level required for each position
للمستوى العلمي المطلوب لكل الحد األدنىفةوظی
R3d- Minimum Years of experience required for each position
سنوات ل الحد األدنىالمطلوبة لكل الخبرة
وظیفة
R3e-Minimum salary for each of these positions in USD
للراتب الحد األدنى من ھذه الوظائف لكل
بالدوالر األمریكي
R3f-Maximum salary for each of thaese positions in USD
للراتب الحد األقصى من ھذه الوظائف لكل
بالدوالر األمریكي
R3g-Number of each job position
المطلوب العدد وظیفة لكل
6- 01 No post-secondary Education 02 Brevet Professionnel – BP 03 Baccalauréat Technique - BT 04 Diplôme de Technicien Supérieur -
TS 05 Licence Technique - LT 06 Baccalaureate 07 University Degree 98 Other Degrees شھادات أخرى
7- 01 No post-secondary Education 02 Brevet Professionnel – BP 03 Baccalauréat Technique - BT

© InfoPro Research 2015 198
04 Diplôme de Technicien Supérieur - TS
05 Licence Technique - LT 06 Baccalaureate 07 University Degree 98 Other Degrees رىشھادات أخ
8- 01 No post-secondary Education 02 Brevet Professionnel – BP 03 Baccalauréat Technique - BT 04 Diplôme de Technicien Supérieur -
TS 05 Licence Technique - LT 06 Baccalaureate 07 University Degree 98 Other Degrees شھادات أخرى

© InfoPro Research 2015 199
R4- Since this time last year, has this average monthly salary amount or payments to skilled workers increased, decreased, or remained the same?
الماضي،ھل زاد متوسط الراتب الشھري للموظفین المھرة ، انخفض، أو بقي على حالھ؟ منذ ھذا الوقت من العام - R4
1الباحث: اعرض البطاقة رقم01 Increased زاد 02 Decreased انخفض03 Remained the same حالھ على بقي95 Refused رفض اإلجابة 97 Do Not Know ال أعلم
R5a- Are salaries of the skilled workers with formal education (have a certificate from a technical school, institute,…) … than those without formal education? (excluding experience)
R5a - من رواتب العمال )...(اقرأ االحتماالت...) ھي معھد،، مدرسة فنیةشھادة من لدیھ( العمال المھرة الذین یحملون شھادة رسمیة واتبر ھل الخبرة) (باستثناء؟ رسمیة المھرة الذین ال یحملون شھادة
2الباحث: اعرض البطاقة رقم01 Lower أقل
Continue أكمل 02 Higher أعلى
03 Same نفسھا
Go to R6 R6 إنتقل الى 95 Refused رفض اإلجابة
97 Do Not Know ال یعلم
R5b –By how much? (in percent)
R5b- بكم؟ (في المئة)

© InfoPro Research 2015 200
R6- When you reflect on recruitment processes in your company in the past year, please rate the below statements from 1 to 4 (1= in most cases; 2= sometimes; 3= rarely; 4= never)
)أبدا =4؛ نادرا = 3، أحیانا = 2 الحاالت؛ في معظم = 1( 4إلى 1 من على سلم التالیة البیانات یرجى تقییم، الماضي العام في شركتكم لدى عملیات التوظیف الى بالعودة - R6
3الباحث: اعرض البطاقة رقم In most cases
تفي أغلب الحاال
Sometimes
أحیانا
Rarely
نادرا
Never
أبدا
Refused
رفض اإلجابة
Do Not Know
ال یعلم 01 The theoretical knowledge (gained through education) of the job
applicants you receive is in line with your expectations
97 95 4 3 2 1 توقعاتك مع ماشىتتطالبي العمل ل (التي تعلمھا) المعرفة النظریة02 The technical skills of the job applicants you receive are in line
with your expectations
97 95 4 3 2 1 توقعاتك مع تتماشىطالبي العمل ل التقنیة ھاراتالم03 The attitudes of the job applicants for your company are in line
with your expectations
97 95 4 3 2 1 توقعاتك مع تتماشى طالبي العملسلوك 04 The wage expectations of the job applicants higher than the jobs
offered
أكثر من الرواتب العمل طالبي من متوقعةمستوى الرواتب ال 97 95 4 3 2 1 المعطاة
05 Job applicants expect unrealistic working conditions (time at work / leave etc.)
97 95 4 3 2 1 یتوقع طالبي العمل شروط غیر واقعیة للعمل (الدوام/ الفرص...)06 The applicants have issues with the social image associated with
the jobs you are offering 1 2 3 4 95 97

© InfoPro Research 2015 201
لصورة اإلجتماعیة للوظائف مشاكل متعلقة باطالبي العمل لدى المعروضة من قبلكم
07 You run practical/theoretical tests as part of recruitment processes
یخضع طالبي العمل إلمتحان عملي/ نظري كجزء من عملیة 97 95 4 3 2 1 التوظیف
In most cases
في أغلب الحاالت
Sometimes
أحیانا
Rarely
نادرا
Never
أبدا
Refused
رفض اإلجابة
Do Not Know
ال یعلم
08 You have newly recruits on trial periods to confirm they have the right skills for the job
وظفت مؤخرا ولفترات تجریبیة طالبي عمل للتأكد من أن لدیھم 97 95 4 3 2 1 المھارات المطلوبة
09
You prefer to hire men / women for certain occupations
97 95 4 3 2 1 تفضل توظیف ذكور/ إناث لبعض الوظائف
10
You hire persons with disabilities
97 95 4 3 2 1 توظف أشخاص ذوي إحتیاجات خاصة

202
R7 – What is the main justification for recruitment? (choose a maximum of three) (Unaided – Multiple responses) Please Probe…
R7- اجابات متعددة) استفسر بالكامل.. -) ( ال تقرأ األحتماالت األكثر على إجابات ثالث؟ (اختر وظیفماذا كان السبب (المبرر) الرئیسي للت
01 Increased business volume
األعمالحجم زیادة
02 Replacement of staff now pensioned
استبدال الموظفین المتقاعدین
03 Replacement of staff who left for other reasons
أخرى ألسباب العمل غادروا الذین الموظفین استبدال
04 New skills requirements to comply with quality standards / access new markets
تتوافق مع معاییر الجودة / فتح أسواق جدیدة الحصول على مھارات جدیدة
05 Greening of the business processes
جعل العملیات التجاریة تتماشى مع توجھات المحافظة على بیئة أفضل
06 New goods or services produced by the company
الشركة تنتجھا جدیدة على سلع أو خدمات لعملا
07 New technology for already existing products and services
العمل على تقنیة جدیدة في عملیة انتاج السلع والخدمات المتوفرة
08 New forms of work organization
العمل تنظیمجدیدة في أسالیب
09 New sales and marketing methods
أسالیب جدیدة في المبیعات والتسویق
99 None
شيء ال
95 Refused
رفض اإلجابة
97 Do Not Know
ال أعلم
98 Other, Specify __________________

203
أخرى ، حدد
R8 – What are the recruitment methods you mainly use for skilled workers? (Unaided – Multiple responses) Please Probe…
R8- استفسر بالكامل... جابات متعددة)ا -ال تقرأ األحتماالت المھرة؟ ( لموظفینأساسا ل ھاستخدمت التي ما ھي أسالیب التوظیف
01 Private recruitment agency وكالة توظیف خاصة
02 Public recruitment agency وكالة توظیف عامة
03 Social Media (Facebook, twitter, LinkedIn, Google+…) وسائل التواصل اإلجتماعي
04 Company Website موقع الشركة األلكتروني
05 In-house HR قسم الموارد البشریة في الشركة
06 Newspaper الصحف
07 Word of Mouth تداول األحادیث عن طریق
08 Personal Contact األتصال الشخصي
08 Online job search engines (such as hirelebanese.com, bayt.com…) محركات البحث على االنترنت
95 Refused رفض اإلجابة
97 Do Not Know ال أعلم
98 Other, Specify __________________ أخرى , حدد

204
R9d- What are the newly emerging (new) tasks / skills for which you do not find the right candidates? Please Probe…
استفسر بالكامل... ) التي لم تجد المرشحین المناسبین لھا؟ةما ھي المھام / المھارات الناشئة حدیثا (جدید - R9d
R9a- What skills do you think that your skilled workers are lacking or could be stronger in? Please Probe…
R9a - استفسر بالكامل... ؟ھاأقوى فی واأو یمكن أن یكون لدیكغیر متوفرة في العمال المھرة ھاما ھي المھارات التي تعتقد أن
R9b-Do you have vacancies that are proving hard to fill? (Skilled Worker)
R9b- ؟ألھاصعوبة في م تجد عمل فرصھل لدیك شواغر و 01 Yes نعم Continue تابع 02 No ال
Go to R9d R9d انتقل الى 95 Refused رفض اإلجابة 97 Do Not Know ال أعلم
R9c- What is the one job most difficult to fill? (Single response)
R9c - ما ھي الوظیفة التي تجد صعوبة أكثر في مألھا؟ (جواب واحد)

205
R10-How would you rate the impact of the lack of required skills on your business?
(1=Very Low, 2= Low, 3= Medium, 4= High,5=Very High)
عملك؟ علىكیف تقیم تأثیر نقص المھارات المطلوبة - R10 دا)= عال ج 5، عال= 4= متوسط، 3= منخفض، 2= منخفض جدا، 1(
4الباحث: اعرض البطاقة رقمVery Low
منخفض جدا
Low
منخفض
Medium
متوسط
High
عال
Very High
عال جدا
Refused
رفض اإلجابة
Do Not Know
ال أعلم
1 2 3 4 5 95 97

206
R11 – If you do not manage to find the skills profile you want, are the following actions part of your coping (or managing) strategies?
؟تعتمدھا التي إلداریةجراءات التالیة جزء من االستراتیجیات ااإل تكون ھلمكنون من العثور على المھارات المطلوبة،تال ت مإذا كنت - R11
5الباحث: اعرض البطاقة رقم
Yes
نعم
No
ال
Refused
رفض اإلجابة
Do Not Know
ال اعلم
Not Applicable
ال ینطبق
01
Redefining competency requirements for the job offer
إعادة تعریف ( تفصیل) متطلبات عرض العمل أو الوظیفة المطلوبة
1 2 95 97 99
02
Recruiting at lower level and training the recruit on the job
توظیف عمال أقل مھارة من المستوى ب والعمل على تدریبھم على المطلو
الوظیفة
1 2 95 97 99
03
Opening competition to new categories not previously considered (women, persons with disabilities)
لم العمال منفئات جدیدة أمامفتح المسابقة (النساء السابق فيللوظیفة تطلب
)الخاصة اإلحتیاجات واألشخاص ذوي
1 2 95 97 99
04
Increasing starting wages in order to attract more applicants
من أجل جذب المزید المقدمةزیادة األجور الوظائف طالبيمن
1 2 95 97 99
05
Increasing benefits in order to attract more applicants
زیادة المنافع او المحفذات من أجل جذب الوظائف بيطالالمزید من
1 2 95 97 99

207
06
Adopting previously untried recruitment practices (which one?
ماتوظیف لم تجرب سابقا ( أسالیباعتماد )؟ھي
______________________________________________________________________________________________________)
1 2 95 97 99
07
Promoting internally some staffs with additional training
بعض الموظفین الحالیین مع ترقیةتدریب إضافيلإخضاعھم
1 2 95 97 99
08
Sharing the tasks between various staffs of the company
مشاركة المھام الوظیفیة بین مختلف موظفي الشركة
1 2 95 97 99
09
Recruiting migrants or Palestinians with lower wage expectations
توظیف مقیمین أو فلسطینیین برواتب أقل
1 2 95 97 99
10
Partnering with education institutions to ensure next batches better suit the company’s needs
نوعیةالشراكة مع مؤسسات تعلیم لضمان أفضل تناسب احتیاجات لعم طالبي
الشركة
1 2 95 97 99

208
R12a- In the past year has the employment in your company of non-Lebanese labor increased, decreased or remained the same?
R12a - ؟بقیت على حالھا أو، انخفضت زادت في شركتك ین (االجانب)غیراللبنانیال العمال توظیف نسبة ھل العام الماضي, في
6ماعرض البطاقة رق الباحث: 01 Increased زادت Continue تابع
02 Decreased انخفضت 03 Remained the same بقیت على حالھا
92 Not Applicable (No Non- Lebanese labor) ال تنطبق ( ال یوجد عمال أجانب)
Go to T1 T1 انتقل إلى 95 Refused رفض اإلجابة 97 Do Not Know ال اعلم
R12b- What are the positions of the non-Lebanese worker? Please Probe…
استفسر بالكامل... ما ھي وظائف العمال األجانب؟ - R12b

209
Employee Training:
T1 – In the past three years, did you offer any form of training to your employees?
؟خالل السنوات الثالث الماضیة، ھل اجریتم أي شكل من أشكال التدریب لموظفیك - T1 01 Yes نعم Continue تابع 02 No ال
Go to T6 T6 إنتقل إلى 95 Refused رفض اإلجابة
97 Do Not Know ال اعلم
T2 - Please indicate by whom was this training carried-out? (Unided – Multiple response)
T2- إجابات متعددة -ال تقرأ األحتماالت (؟ التدریب ھذا اجرت الجھة التي یرجى اإلشارة إلى( 01 Internal Staff موظفي الشركة Continue تابع 02 External Trainers مدربین من خارج الشركة
Go to T2c T2c إلىانتقل 03
External Trainers on Company premises مدربین من الخارج في مقر الشركة
04 Learning Center مركز تعلیم
98 Other, Specify _________________ _ أخرى, حدد

210
T2a- What type of in-house training did your skilled employees undergo in the past three years (specify the topics covered, and for which Skills)?
T2a - ما ھو نوع التدریب الداخلي الذي خضع لھ العمال المھرة في السنوات الثالث الماضیة (حدد مواضیع التدریب وألي مھارات)؟
T2b- How many times a year do your skilled employees undergo internal training?
T2b - كم عدد المرات الذي خضع لھ العمال المھرة للتدریب الداخلي؟
Number of times per year: عدد المرات في السنة

211
ASK T2c, T2d and T3 for external (or external on Company premises)ONLY
T2c- What type of external (or external on Company premises) training did your skilled employees undergo in the past three years (specify the topic covered, and for which Skills)?
T2c - ما ھو نوع التدریب الخارجي الذي خضع لھ العمال المھرة في السنوات الثالث الماضیة (حدد موضوع التدریب وألي مھارات)؟
T2d- How many times a year do your skilled employees undergo external training?
T2d - كم عدد المرات الذي خضع لھ العمال المھرة للتدریب الخارجي؟
Number of times per year: عدد المرات في السنة
T3- Please indicate the name of the companies, educational institutes or learning centers that carried out the external training
T3- متعددة) إجابات -ال تقرأ األحتماالت ( الرجاء حدد أسماء الشركات, المؤسسات التعلیمیة أو المراكز التعلیمیة التي أجرت التدریب الخارجي 01 Formatech
02 New Horizon
03 Makhzoumi Foundation
04 American Language Center
05 Morgan International Lebanon
06 Pigier
95 Refused رفض اإلجابة
97 Do Not Know ال أعلم 98 Other, Specify أخرى, حدد

212
ASK TO ALL T4-On a scale from 1 to 4, how are you satisfied with the outcome of the training?(Aided – Single response)
T4- واحدة إجابة -أقرأ األحتماالت ( التدریب؟ نتیجة على راض أنت كم، 4 إلى 1 من سلم على(
7مرق البطاقة اعرض: الباحث
01 Not Satisfied at all يغیر راض على اإلطالق
Continue تابع
02 Not Satisfied يغیر راض 03 Satisfied Go to T4b ي راض T4b إلى نتقلإ 04 Very Satisfied جدا يراض 95 Refused رفض اإلجابة Go to T5a T5a إلى نتقلإ 97 Do Not Know ال أعلم
T5a- Were there any training requirements for which you did not find a provider?
T5a - ؟ھل كان ھناك متطلبات أو حاجات تدریبیة لم تجد لھا أي مزود أو جھة تدریبیة لتقدیمھا 01 Yes نعم Continue تابع 02 No ال
Go to T6 T6 إنتقل إلى 95 Refused رفض اإلجابة 97 Do Not Know ال أعلم
T4a- What are the reasons for dissatisfaction?Please Probe… T4a استفسر بالكامل... ما ھي أسباب عدم الرضى ؟ -
T4b- What are the reasons for satisfaction?Please Probe… استفسر بالكامل... ما ھي أسباب الرضى ؟ T4b

213
T5b- For what type of training exactly?Please Probe…
T5b استفسر بالكامل... نوع من التدریبات تحدیدا؟ ألي-
T6- Does your company collaborate on a continuous basis with any learning center or institute?
T6 ھل تتعامل شركتك على نحو مستمر مع أي مركز تعلیمي أو معھد؟-01 Yes نعم Continue تابع 02 No ال Thank the interviewee and end the interview قابلة أشكر المجیب وأنھي الم
95 Refused رفض اإلجابة 97 Do Not Know ال أعلم
T7- What type of collaboration (including hiring of graduates/trainees, or apprenticeship or internship programs are offered by or supported by your company)? Please Probe…
T7- ؟) من قبل الشركة دعمت أو التي قدمت أو التدریب برامج التدریب المھني أو المتدربین،/ الخرجین تعیین فیھ(بما التعامل من نوع أي …استفسر بالكامل
Thank the interviewee and end the interview
أشكر المجیب وأنھي المقابلة

214
Stakeholder Discussion Guides
Discussion Guide 1: Technical & Vocational Training Institutes
Name and position of interviewee: __________
Name and location of visited institute: __________
A. Institute Overview
1. It is a ____________ institute? � Public � Private � Private for free
2. The institute has _____ other branches in Lebanon (excluding the one visited). *If applicable, use the table below to specify the location of each branch.
Number of branches City / Area
3. Do you have any expansion plan - means are you planning to open new branches in other regions in the future? � Yes – Please specify regions: _________________ � No

215
B. Education on Offer
4. What are the degrees available / offered at your institute? (Multiple answers)
Vocational Training Technical Education
� Professional Training Certificate (BP) � Certificat d'aptitude professionelle (CAP) � Secondaire Professionnel (SP) � Other 1 (Please specify): ________ � Other 2 (Please specify): ________ � Other 3 (Please specify): ________
� Technical Baccalaureate (BT) � Superior Technician (TS) � Licence Technique (LT) � Other 1 (Please specify): ________ � Other 2 (Please specify): ________ � Other 3 (Please specify): ________
5. For each of the degrees mentioned in Q4, answer the following questions: 5.1. What are the programs / specializations available? 5.2. What is the study duration of each program (in years)? 5.3. What is the number of students / trainees currently enrolled in each program/degree? 5.4. What is the percentage of Lebanese students vs. students of other nationalities enrolled in each
program/degree? 5.5. What is the percentage of students (who graduated) getting employed in their field of study?
6. What is the number of teachers whether on a part-time or full-time basis currently available for each of the above mentioned degrees?
% of teachers
(Part-time)
% of teachers
(Full-time) Total
CAP
100%
BP SP BT TS LT Other 1: Other 2:
7. Please specify the yearly tuition fees (including registration cost) for each of the above mentioned degrees (in $ or LL)?
Yearly tuition fees Explanation (if needed): CAP BP SP BT TS LT Other 1: Other 2:

216
5.Degree 5.1.Name of program 5.2.Study duration
5.3.Count students
5.4.% of Lebanese students vs. Other
5.5. Percent of students getting employed in their
field of study

217
8. Do you offer extracurricular training / education (elective courses) to your students? (E.g. life skills, entrepreneurships, languages, computer literacy, etc.). *If yes, please specify the names of these courses.
9. Are you offering any youth employment programs or initiatives with the primary aim to boost the capabilities of (unemployed) youth and reduce unemployment among them? *If so, please specify:
The names of the programs / initiatives If applicable, any partner organizations for the programs (including NGOs, government authorities) Total number of students enrolled in each program Main skills taught / learned in each program
10. Are there any of the educational and/or auxiliary facilities listed below at your institute? � PC room � Theater � Library � Laboratories � Other (Please specify): ___________
11. Are any of the educational equipment/tools listed below available / used at your institute? � Electronic Active Board � LCD Projector � Laptop / Desktop � Laboratory equipment � Other (Please specify): _________

218
C. Staff
12. What is the number of trainers (teaching staff) currently working at your institute?
13. What is the average qualification of your teaching staff? (E.g. educational level and the names of the most common colleges / universities from which they earned their degrees).
Staff Educational level / Diplomas University Teaching
14. As for teaching staff in particular, what is the percentage of trainers who have a university degree versus the percentage of those who have other degrees / diplomas – to be specified?
Trainers (in %) University degree Other diplomas / certificates Specify
Percentage
15. Do you offer any training and/or development sessions / programs (i.e. continuing education programs) that match the career development objectives and job needs of your teaching staff? � Yes � No
15.1. If yes, kindly specify the names of sessions / programs and the frequency at which they are organized? What are the subjects / skills taught during those sessions?
Name of training and/or development session: ____________
Frequency: ____________
Subjects taught: ____________

219
D. Job Placement
16. Do you provide any job placement services for students at your institute, mainly those who graduated (including students in youth employment programs)?
16.1. If yes, how those services are done (i.e. via recruitment agencies, direct contact with potential employers, coordination with the private sector, etc.)? Please explain. What is the placement success rate?
16.2. How much time does it take in general for students who graduated to find a job within their specialization? What are the main reasons behind some students not being able to find a job after graduation?
16.3. What, in your opinion, are the most valuable majors today, mainly those with abundant job opportunities on the market (please, list up to 5 majors)?
16.4. Do you offer orientation and/or guidance services to current and potential students?
17. What are the most common challenges / difficulties that students at your institution face when seeking a job on the market? Please explain.
17.1. What, in your opinion, might be the solution to those challenges / difficulties?

220
Discussion Guide 2: Learning Centers
Name and position of interviewee: __________
Name and location of the visited learning center: __________
The learning center has _____ branches in Lebanon (excluding the one visited) and _____ other branches abroad (specify country).
Number of branches City / Area Country ________________ ________________ ________________ ________________ ________________ ________________ ________________ ________________ ________________ ________________ ________________ ________________
*Use the table above to specify branches’ locations (if applicable).
1. What types of diplomas / certifications / courses does your institution offer and in which fields / specializations? Ask about the names of the courses offered (if many, ask for catalogue).
2. What is the study duration of each course / program? (If many, ask for catalogue).
3. What is the total number of trainees currently registered at the center?

221
4. What is the profile of your clientele? (Including age range, profession, gender, nationality, etc.) General Employed Unemployed Total
Gender Male 100% Female 100% Total 100%
Age range 18-21 100% 21-29 100% >30 100% Total 100%
Professions (sub-sectors or sectors) N/A
N/A
Salary range 0-$1,000
N/A
N/A $1,000 - $2,000 >$2,000 Total 100%
Nationality Lebanese
N/A Other (Please specify): Total 100% 100% 100%
5. What are the most common courses sought by individuals (mainly, those who are unemployed)? 6. How much is the registration fee for each of those courses/programs or in general (in $ or LL)?
7. What is the total number of trainers (teaching staff) currently working at the learning center?
8. What is the average qualification of your teaching staff (educational level and the names of the most common colleges / universities from which they earned their degrees)?
Staff Educational level / Diplomas / Certificates University / College Teaching

222
9. Do you provide any job placement services for students who got certified and are currently unemployed? � Yes � No
9.1. If yes, how those services are done (i.e. via recruitment agencies, direct contact with potential employers, etc.)? Please explain. What is the placement success rate?
9.2. Do you offer orientation and/or guidance services to current and potential trainees (mainly unemployed individuals whether they are fresh grads or unemployed)?
9.3. How much time does it take in general for graduates to find a job (within their specializations)? What is the percentage of trainees who succeed to find a job within their specialization in Lebanon vs. abroad?
9.4. What are the types of jobs that students who got certified are able to find and in which economic sectors (sub-sectors)?
10. If applicable, what are the most common challenges / difficulties that graduates face (mainly those who are unemployed) on the labor market? Please explain.
10.1. What, in your opinion, might be the solution to those challenges / difficulties?

223
Discussion Guide 3: Recruitment Agencies
Name and position of interviewee: ___________
Name and location of recruitment agency: ___________
Date of establishment (your agency is active since): (Month/Year) _______________
1. What are the main obstacles for youth to obtaining jobs in general and employment opportunities which are commensurate with their studies in particular?
2. What are the fields / specializations for which there is a surplus of labor vis-à-vis those for which there is a lack of labor? Within these fields / specializations, which skill or qualification level and which age / experience level are the most in demand?
Fields / specializations Surplus of labor Lack of labor Comments
3. Based on your experience and knowledge, what is the profile of employed youth - including the types of jobs they have, the wages they earn and the opportunities they have for upward mobility?
Criteria Age: 18-21 Age: 21-29
Educational level
Types of jobs
Sectors & sub-sectors
Salary range
Opportunities for upward mobility

224
4. What are the top ten categories of current job vacancies by economic sub-sector on the labor market?
Top 10 Job vacancies Sub-sectors
1
2
3
4
5
6
7
8
9
10
5. What sectors/industries use your services the most (list up to five sectors/industries)?
6. What are the most common skills / competences that companies (employers) are currently requesting and you, as a recruitment agency, are finding difficulties filling?
7. What are the preferences of companies with regard to the educational level of applicants? Do employers have concerns about the age of candidates?
8. Based on your experience, what are the hardest vacancies to fill (breakdown by sector)?
9. What is profile and background of applicants? Are you seeing an increase in the number of applicants or a shift in the applicant profile? (Fresh grads vs. unemployed, experience, level of training, educational level, etc.) - For unemployed, specify: gender, age and unemployment duration.
10. What level of training does your average job seeker have?
11. What has been the impact of (skilled) youth emigration on Lebanon’s economy in general and the labor market in particular?
12. What, in your opinion, must be done to alleviate labor market imbalances in Lebanon and consequently limit youth emigration?

225
Annex – List of economic sub-sectors
a. Sales & maintenance of vehicles, machines & motor bicycles b. Oil & Gas c. Agro-alimentary & Beverages d. Textile & Leather e. Furnishing & Carpentry f. Paper & paperboard g. Printing & editing h. Non-metal products i. Metal products & jewelry j. Renewable energy k. Building & construction l. Hotels & restaurants m. Auxiliary activities related to transportation n. Health & social action o. Hairdressers & beauticians p. Other economic sub-sectors including those requiring high level technical skills: Electrical / Electronics
/ Mechanical / Plumber / IT / Graphic design / Banking services / etc.

226
Discussion Guide 4: Microfinance Institutions (MFIs)
Name and position of interviewee: ______________
Name and location of visited MFI: ______________
1. What is the current state of the micro-entrepreneurship economy in Lebanon? How does it compare to the ones in neighboring countries (e.g. in terms of outreach, number of active clients, gross loan portfolio, etc.)?
2. How have prevailing political and security conditions in Lebanon affected the local microfinance market (e.g. demand for microfinance products & services, penetration rate, etc.)?
3. Are you offering any of the microfinance products and/or services listed below to young entrepreneurs, employees, start-ups and ongoing microenterprises? If so, kindly provide a brief explanation of each of those products and/or services. � Microcredit (loans) � Remittances � Non-financial services (Business Development Services – BDS) � Other (Please specify): ________________
4. What are the main challenges / obstacles to microenterprise start-ups and operations in Lebanon? In terms of government policies; In terms of business registration (i.e. incorporation -opening an establishment for e.g. - formal vs.
informal work); In terms of access to finance (self-funding vs. access to bank or MFI loans) and the risk of
indebtedness; In terms of market share and competition.
5. Do you have any information regarding ongoing youth entrepreneurial activities on the market today in Lebanon? If so, kindly provide some details about those activities / projects (e.g. sectors of activity, etc.).
6. What is the profile of your clientele (applicants)? Age, gender, employed vs. unemployed If employed, specify the types of jobs they have and the wages they earn?
7. Are there any available opportunities for (unemployed) youth in general in micro-entrepreneurship today? If so, which, do you think, are the economic sectors with best opportunities for microenterprise creation and growth?
8. Lastly, what is really needed today on both micro and macro levels to enable young entrepreneurs to succeed their projects? (E.g. further cooperation with the public and private sectors, organize business and training sessions to young entrepreneurs, improve access to finance, etc.). Please explain.

227
Discussion Guide 5: Economic Expert
Name of Interviewee:
The impact of the Syrian crisis on the Lebanese economy: 1- What is the impact of the Syrian crisis (and the massive inflow of Syrian refugees since 2011) on
Lebanon’s economy as well as on its economic growth? [GDP, GDP growth, sovereign debt, fiscal deficit (public services such as education and health), etc.]
Labor market: 2- How has the labor market been affected by the Syrian crisis? What is the effect on the national
unemployment level – if possible broken down by sector, age and skill level? 3- In which economic (sub-) sectors is there currently competition for jobs between Syrians and Lebanese? 4- What is the economic (monetary) cost of a Syrian refugee getting hired instead of a Lebanese? 5- Is there currently competition on businesses between Lebanese and Syrians? If yes, what sectors self-
employment competition happens in? Prospects: 6- What will happen when the Syrian crisis comes to an end? In other words, do you think that the Syrian
workforce currently present in Lebanon is here temporarily or to stay for good - whether it is at the request of the labor demand (employers) or supply side (employees)?
Recommendations: 7- What, in your opinion, are the steps that public authorities have to take to limit and/or contain the negative
consequences of the Syrian refugee crisis on Lebanon’s economy? [Financial mechanisms, further cooperation with multinational organizations, legal regulation of Syrian workers and businesses, etc.]

228
Interviewed Companies
Agro-Alimentary
Company Name Al Baba Sweets Sal Al Gondoline Sweets Co Al Moukhtar Modern Bakery Al Wadi Al Akhdar Sal Bach Snacks Sal Balkis Sal Boulangerie Yammine Sarl Conserves Moderenes Chtaura Sal Cortas Canning & Refrigerating Co. Sal Daher International Food Sal La Mie Dorée Sal Malco Holding Sal Patchi Sal Rafaat Hallab & Sons Sal Sea Sweet Sonaco Sarl
Building and Construction
Company Name Abniah Engineering & Contracting Sarl
Arabian Civil Works Sarl
Arabian Construction Co. Sal
Assiyana Sarl
Aziz Moussawer & Sons Sarl
Batco Sarl
Beam International Sal
Butec Sal
Contra Contracting and Trading Co. Sarl
Danash Contracting and trading Co. Sarl
Earth Technologies Sal
Eldaco Sarl
Fujilift Sal
General Engineering Co. of Lebanon Ltd

229
Itani Trading and Industrial Co. Sal
Jacteco Mechanical Sarl
Kypros Solar Water Heating System
La Constructa Sal
M.T.O. Sal Maintenance Technique Optimisee
Maintenance Management Group Sal
Makram Barakat Est.
Matta et Associés Sal
Sabeco and Partners for Trading and Contracting Sal
Societe Nagi Abi-Aad Sarl
Solidere Sal
The Green Pact Sal
Hotels and Restaurants
Company Name ANT Ventures Sal – Casper & Gambini’s
Beirut Homes Ventures Sal
Bliss House Sarl
Boutique Hotel
Breakfast & Co. Sal
Cafe Younes Sal
Capital Hospitality - Monroe
Catertainment Sal
Four Seasons Sal
Ghia Holding - Ahwak
Ghia Holding - Caribou Lounge Sal
Hooka Lounge Sal
King Food
Le Commodore Hotel
Lebanese Catering & Restaurant Sal
Legend Hotel
Malak Al-Taouk Sarl
Manara Real Estate Development Co Sal
Miknass Food Sal
Phoenicia Hotel
Plaza Lahoya Verdun

230
Premier Leisure Sal
Printania Palace Hotel
Promotel Sal
Radisson Blu Martinez Hotel
Regency Palace Hotel
Riviera Hotel Beirut
Roadster Diner Sarl

231
Hotels and Restaurants (Cont.)
Company Name Serene Real Estate Sal- Le Gray Hotel
Sky Management Sal
Societe Des Hotels et des Restaurants du Liban Sal
Taiga Beirut Restaurant Club Sal
Verdun Hotelière 5000 Sal
Waterlemon Sal
Agriculture/Agribusiness
Company Name Hariri Foundation
Ahlouna
Association for the Development of Rural Capacities
Adel Tini
Mohammad Faran