Market Haven Monthly Newsletter - March 2011
14
MARKET HAVEN MONTHLY PAGE 1 W e wanted to let our readers know that we are making some changes to the strategy this month. We will be replacing our old Timing Model with a new Timing Model. The old Timing Model essentially used three variables in allocating between stocks and cash. We have known of the deficiencies of the model for some time and have been researching enhancements to the strategy for a number of months now. Let us give you some examples of its shortcomings. Over the last decade, the Timing Model handled the 2000-2002 downturn very well by pulling out of stocks at the end of 1999 just before they went on their three year losing streak. Great, right? Unfortunately, because p/e’s were still very high, the model missed the rally in stocks from 2003 to 2007. When stocks capitulated from their overvalued levels in 2008, then the strategy worked fabulously. It also picked stocks as a buy at the beginning of 2009. Nice job. Again, unfortunately, due to the secular environment, the model was only invested for part of the rally, getting out in the third quarter of 2009. It was then out of the market for much of 2010. Ouch. In longer term measurements, the strategy has been satisfactory in delivering returns. Over the last four years, returns totaled +80% versus the market’s -13%. However, we believe that a portfolio manager utilizing the old Timing Model would be too susceptible to job risk based on some of the model’s decisions. For example, who can afford to wait for five years on the side lines as the market advances +80% before being justified? Most people stop believing you after a year of being wrong and the rest quit on you after three years. The model just couldn’t address the market during some of these key moments. Happily, we have a replacement model, which we will still refer to as our Timing Model. We’ve backtested it to 1926 and are pleased with its performance all along the way. No model is perfect and our new model is no exception to that. However, we believe this model will be a dramatic improvement over our last model. Market Haven Monthly 2011 MARCH
-
Upload
markethaven -
Category
Documents
-
view
218 -
download
0
Transcript of Market Haven Monthly Newsletter - March 2011

8/7/2019 Market Haven Monthly Newsletter - March 2011
http://slidepdf.com/reader/full/market-haven-monthly-newsletter-march-2011 1/14
MARKET HAVEN MONTHLYPAGE 1
W
e wanted to let our readers know that we
are making some changes to the strategy this
month. We will be replacing our old Timing
Model with a new Timing Model.
The old Timing Model essentially used three
variables in allocating between stocks and cash.
We have known of the deficiencies of the model
for some time and have been researching
enhancements to the strategy for a number of
months now.
Let us give you some examples of its
shortcomings. Over the last decade, the Timing
Model handled the 2000-2002 downturn very
well by pulling out of stocks at the end of 1999
just before they went on their three year losing
streak. Great, right? Unfortunately, because
p/e’s were still very high, the model missed the
rally in stocks from 2003 to 2007. When stocks
capitulated from their overvalued levels in
2008, then the strategy worked fabulously. It
also picked stocks as a buy at the beginning of
2009. Nice job. Again, unfortunately, due to the
secular environment, the model was only
invested for part of the rally, getting out in the
third quarter of 2009. It was then out of the
market for much of 2010. Ouch.
In longer term measurements, the strategy has
been satisfactory in delivering returns. Over the
last four years, returns totaled +80% versus the
market’s -13%. However, we believe that a
portfolio manager utilizing the old Timing
Model would be too susceptible to job risk based
on some of the model’s decisions. For example,
who can afford to wait for five years on the side
lines as the market advances +80% before being
justified? Most people stop believing you after a
year of being wrong and the rest quit on you
after three years. The model just couldn’t
address the market during some of these key
moments.
Happily, we have a replacement model, which
we will still refer to as our Timing Model. We’ve
backtested it to 1926 and are pleased with its
performance all along the way. No model is
perfect and our new model is no exception to
that. However, we believe this model will be a
dramatic improvement over our last model.
Market Haven Monthly
2011
MARCH

8/7/2019 Market Haven Monthly Newsletter - March 2011
http://slidepdf.com/reader/full/market-haven-monthly-newsletter-march-2011 2/14
MARKET HAVEN MONTHLYPAGE 2
We’ve kept the three factors used previously and
added four more. These factors encompass such
things as market valuation, earnings
expectations, secular investor sentiment, the
monetary landscape, and the interest rate
environment.
We understand that
it is fundamentally
undesirable to
makes change in
mid-stream. At thesame time, we want
to set the
expectation that we
are constantly
striving to grow and
learn. That doesn’t
mean we take model
changes lightly. We
don’t. Rigorous
testing has been
conducted over an
extended time frame
and we believe this
strategy will yield
better results goingforward.
Let us share with you some of our conclusions.
Hopefully you’ll find confidence in these results.
Nearby are two tables which show the results of
a long-only portfolio that is simply either 100%
invested in the stock market or completely out
of the market based on the application of our
seven factor model. Rebalancing was conducted
quarterly. No leverage was applied and no
shorting was used. We just wanted to assess the
ability of the model to
pick good times to be in
the market and out of
the market.
The top table comparesfive year period gross
returns of the market to
the model. The model
shows well. It
outperformed the
market in all but one
five year period. The
average
outperformance for the
five year increments is
+31%, which works out
to +4.8% annualized.
The bottom table shows
annual numbers since
2000. This has been a
volatile decade in particular. In our view, if a
model can navigate both the long-term and the
more recent environment well, then it shows
some promise. You can see that the comparative

8/7/2019 Market Haven Monthly Newsletter - March 2011
http://slidepdf.com/reader/full/market-haven-monthly-newsletter-march-2011 3/14

8/7/2019 Market Haven Monthly Newsletter - March 2011
http://slidepdf.com/reader/full/market-haven-monthly-newsletter-march-2011 4/14
MARKET HAVEN MONTHLYPAGE 4
You need to know that the decision to switch to
the new model was not based on these recent
return results in an effort to cherry pick the best
returns. Yes, we want to do our best to improve
returns going forward. The last thing we want is
to delude ourselves into thinking we’re better
than we are by revising history. That’s a course
destined for future doom. We are hoping that by
spending several pages outlining our thought
process that our sincerity will come through.
At the same time, it is very easy for investors tofall in love with their own ideas and processes to
the point that they never evolve. We must stay
humble because the markets will continue to
humble us.
Where’s the Va lue?
Stocks
Our Static Model is an easy way to hedge out
much of the market risk in an unemotional way.
Through regular rebalancing and a fairly
conservative asset allocation, the portfolio has
done a good job of dampening volatility risk.
Additionally, the beta of our long portfolio has
historically been about 1.3 allowing investors to
get full market exposure while leaving some
cash on the sidelines. Net long exposure for the
Static Model is +50%. Our Timing Model, on the
other hand, factors in market valuations. Net
long exposure is -30%.
Strategy StaticModel
TimingModel
Long Exposure +80% 0%
Short Exposure -30% -30%
Net Exposure +50% -30%
P/E’s are at 17.5x which means limited upside
and lots of downside potential. Earningsinformation, the rising yield environment, and
even price momentum all point to a weakening
rally. The only pause at this point is the Fed’s
loose monetary policy which still has the
potential to provide some more strength to
equities. Nevertheless, we wouldn’t advise
investors to be greedy and try to time the tops.
When conditions are iffy, move some money to
the sidelines while you know you have it.
Sectors
Relative to the market as a whole, our screens
are showing that the best places to find value are
in consumer discretionary, materials, and
financials.
8/7/2019 Market Haven Monthly Newsletter - March 2011
http://slidepdf.com/reader/full/market-haven-monthly-newsletter-march-2011 5/14
MARKET HAVEN MONTHLYPAGE 5
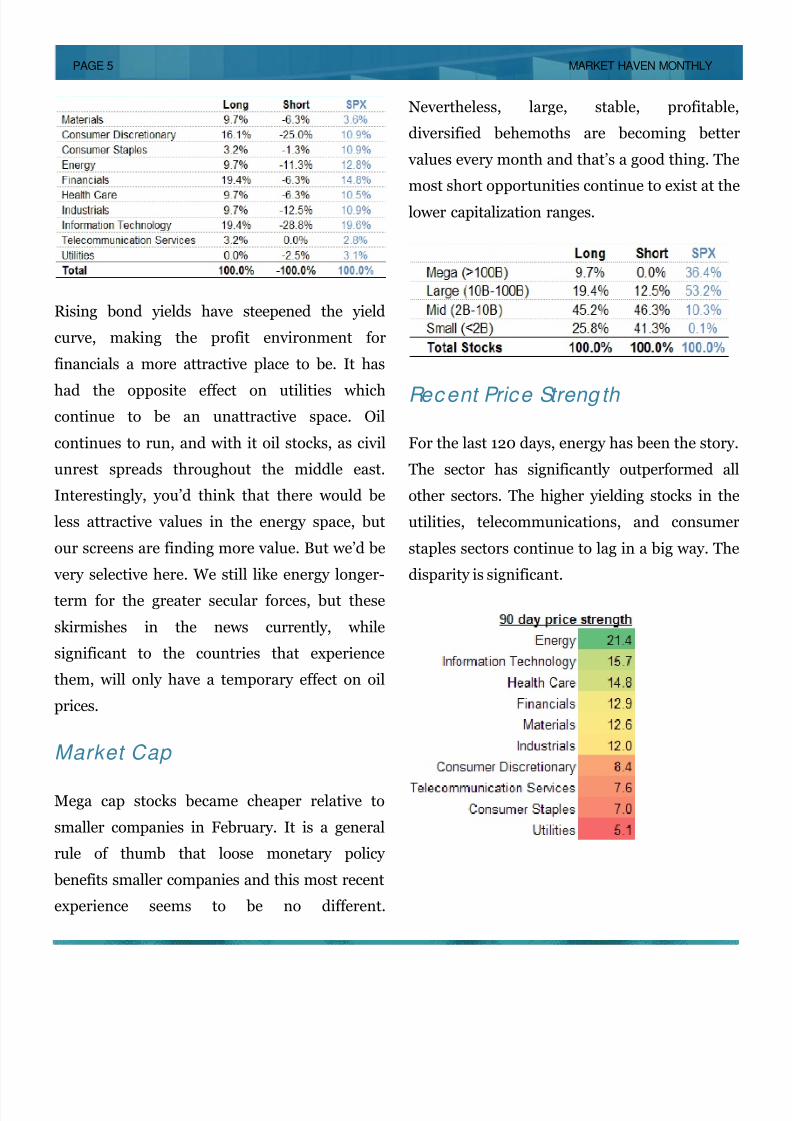
Rising bond yields have steepened the yield
curve, making the profit environment for
financials a more attractive place to be. It has
had the opposite effect on utilities whichcontinue to be an unattractive space. Oil
continues to run, and with it oil stocks, as civil
unrest spreads throughout the middle east.
Interestingly, you’d think that there would be
less attractive values in the energy space, but
our screens are finding more value. But we’d be
very selective here. We still like energy longer-
term for the greater secular forces, but these
skirmishes in the news currently, while
significant to the countries that experience
them, will only have a temporary effect on oil
prices.
Market Cap
Mega cap stocks became cheaper relative to
smaller companies in February. It is a general
rule of thumb that loose monetary policy
benefits smaller companies and this most recent
experience seems to be no different.
Nevertheless, large, stable, profitable,
diversified behemoths are becoming better
values every month and that’s a good thing. The
most short opportunities continue to exist at the
lower capitalization ranges.
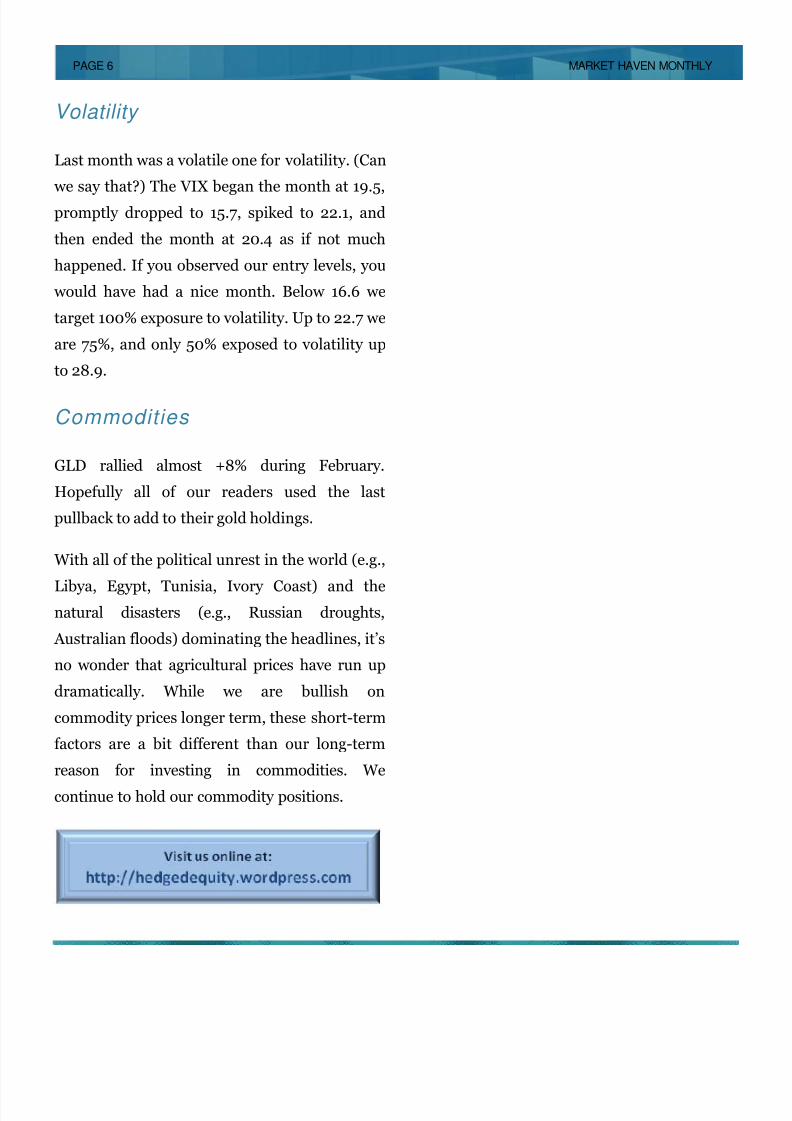
Recent Price Streng th
For the last 120 days, energy has been the story.
The sector has significantly outperformed all
other sectors. The higher yielding stocks in the
utilities, telecommunications, and consumer
staples sectors continue to lag in a big way. The
disparity is significant.
8/7/2019 Market Haven Monthly Newsletter - March 2011
http://slidepdf.com/reader/full/market-haven-monthly-newsletter-march-2011 6/14
MARKET HAVEN MONTHLYPAGE 6
Volatility
Last month was a volatile one for volatility. (Can
we say that?) The VIX began the month at 19.5,
promptly dropped to 15.7, spiked to 22.1, and
then ended the month at 20.4 as if not much
happened. If you observed our entry levels, you
would have had a nice month. Below 16.6 we
target 100% exposure to volatility. Up to 22.7 we
are 75%, and only 50% exposed to volatility up
to 28.9.
Commodities
GLD rallied almost +8% during February.
Hopefully all of our readers used the last
pullback to add to their gold holdings.
With all of the political unrest in the world (e.g.,
Libya, Egypt, Tunisia, Ivory Coast) and thenatural disasters (e.g., Russian droughts,
Australian floods) dominating the headlines, it’s
no wonder that agricultural prices have run up
dramatically. While we are bullish on
commodity prices longer term, these short-term
factors are a bit different than our long-term
reason for investing in commodities. We
continue to hold our commodity positions.
8/7/2019 Market Haven Monthly Newsletter - March 2011
http://slidepdf.com/reader/full/market-haven-monthly-newsletter-march-2011 7/14
MARKET HAVEN MONTHLYPAGE 7
Some Investment Ideas
Here are a few names that have shown up
recently as potential investment ideas on our
screens. Some of these may appear in the
portfolios. Some may not simply because the
names currently in the portfolio haven’t worked
their way yet.
Diversification is an important part of our
investment process. We like to have between 30
and 40 names in the long portfolio and morethan that in our short portfolio. We let the ideas
that are working continue to run. Conversely,
the ideas that are not working become a smaller
proportion of the portfolio simply by the
diminishing market cap they exhibit. This also
lends to the comfort we have taking chances on
stocks that may have headline or operational
risk from time to time.
Don’t forget to do your own homework. We’re
not your financial advisor so we do not know
your specific financial situation and what makes
sense for you individually.
CNOOC Limited (CEO) - long
CEO is China’s largest offshore producer of
crude oil and natural gas. Based in Hong Kong,
it is also one of the largest offshore producers in
Indonesia. Its market cap is $102 billion. The
company is conservatively capitalized,
immensely profitable, and focused on the
biggest growth area of the world. Based on last
year’s cash payouts, the dividend yield is around
2.3%, which is better than the S&P 500. ROE
has hovered between 25% and 35% for much of
the last 10 years, yet the price-to-earnings ratio
is only 10.4x. There doesn’t seem to be a lot of
risk with the stock in our opinion.
Credicorp Limited (BAP) - long
BAP is the largest financial services company in
Peru and also one of the oldest. With a market
cap of $8 billion, BAP provides commercial
banking, investment banking, and insurance
services internationally. It has a yield of 2%. It’s
ROE has expanded from single digits to over
20% over the last decade while its tangible book
value has doubled. We admit that at 3x p/b, the
stock isn’t crazy cheap, but it seems cheap for
what you are buying and makes sense as part of
a diversified portfolio focusing on emerging
growth. Earnings are expected to grow at a
+25% clip over the next few years and the p/e of
the stock is only 11.6x.
Ab bott Laboratories (ABT) - long
ABT is a $74 billion drug company with a
diversified revenue stream that covers areas
relating to diabetes, diagnostics, molecular

8/7/2019 Market Haven Monthly Newsletter - March 2011
http://slidepdf.com/reader/full/market-haven-monthly-newsletter-march-2011 8/14
MARKET HAVEN MONTHLYPAGE 8
analysis, nutrition, animal health, and vascular.
The stock has suffered from much of the same
overhang that the rest of the healthcare sector
has experienced. We believe long-term
demographics will eventually become the
overwhelming tailwind. ABT’s yield has steadily
risen year after year and is better than 10-year
Treasuries at 4%. Earnings are expected to grow
around 9% per year and with ROE’s in excess of
25%, investors at these levels will be well-served
longer-term.
Newmont Mining Co rp (NEM) - long
NEM is one of the world’s largest gold producers
and also mines copper. They cover the world
from the U.S. to Australia, Peru, Indonesia,
Ghana, Canada, Bolivia, New Zealand, and
Mexico. We believe that strong gold and copper
prices will continue to contribute to solid growth
in NEM’s bottom line. The $27 billion company
is trading at 10.5x earnings and is expected to
grow at 14% per year for the near future. The
dividend isn’t great, but better than nothing at
1%. To boot, the company raised its dividend
50% in 2010 from 10 cents/qtr to 15 cents/qtr.
NEM has low debt and should be able to
withstand some volatility in the metals markets.
Harris Corp (HRS) - long
One of the hardest things to do sometimes is
recommend a stock after you’ve owned it and
watch is appreciate +45%. Nevertheless, that’s
what we’re doing with the $6 billion
manufacturer of communications equipment for
the commercial and governmental markets. New
products have bolstered recent sales at the
company. The company’s primary business has
been tied to military operations which could
experience some volatility as government
officials try to reduce spending. At the same
time, the global trend is toward greater
integration which means more exposure to other
economies and political regimes. HRS provides
products that are sure to stay at the center of
that global progress. The stock is attractively
priced even after its recent run. It sports an
earnings yield of 9%. The dividend yield is 2.1%.
The dividend has grown 80% since 2007. The
stock is a buy in our opinion.

8/7/2019 Market Haven Monthly Newsletter - March 2011
http://slidepdf.com/reader/full/market-haven-monthly-newsletter-march-2011 9/14

8/7/2019 Market Haven Monthly Newsletter - March 2011
http://slidepdf.com/reader/full/market-haven-monthly-newsletter-march-2011 10/14
MARKET HAVEN MONTHLYPAGE 10
Newsletter Portfolio Performanc e

8/7/2019 Market Haven Monthly Newsletter - March 2011
http://slidepdf.com/reader/full/market-haven-monthly-newsletter-march-2011 11/14
MARKET HAVEN MONTHLYPAGE 11
Newsletter Portfolio Performanc e
8/7/2019 Market Haven Monthly Newsletter - March 2011
http://slidepdf.com/reader/full/market-haven-monthly-newsletter-march-2011 12/14
MARKET HAVEN MONTHL
Symbol Name Price
Portion Of
Fund Shares Held Value
Current
Rating
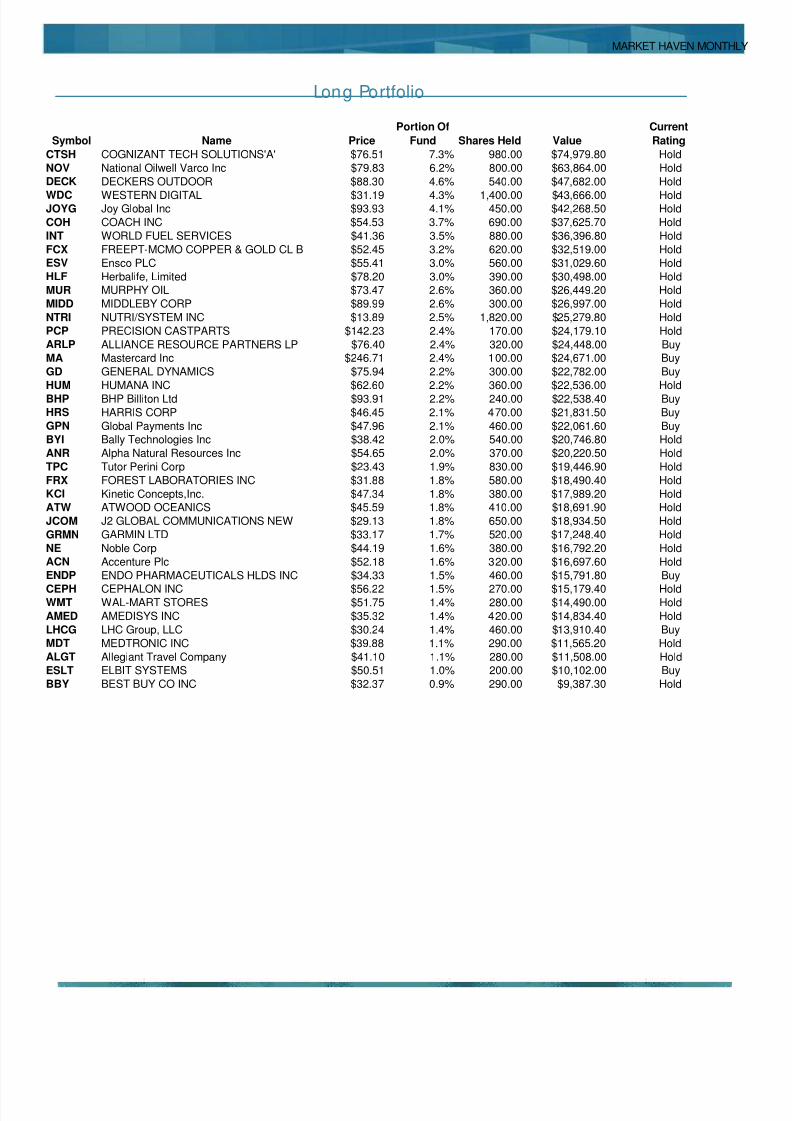
CTSH COGNIZANT TECH SOLUTIONS'A' $76.51 7.3% 980.00 $74,979.80 HoldNOV National Oilwell Varco Inc $79.83 6.2% 800.00 $63,864.00 HoldDECK DECKERS OUTDOOR $88.30 4.6% 540.00 $47,682.00 Hold
WDC WESTERN DIGITAL $31.19 4.3% 1,400.00 $43,666.00 HoldJOYG Joy Global Inc $93.93 4.1% 450.00 $42,268.50 HoldCOH COACH INC $54.53 3.7% 690.00 $37,625.70 HoldINT WORLD FUEL SERVICES $41.36 3.5% 880.00 $36,396.80 HoldFCX FREEPT-MCMO COPPER & GOLD CL B $52.45 3.2% 620.00 $32,519.00 HoldESV Ensco PLC $55.41 3.0% 560.00 $31,029.60 HoldHLF Herbalife, Limited $78.20 3.0% 390.00 $30,498.00 HoldMUR MURPHY OIL $73.47 2.6% 360.00 $26,449.20 HoldMIDD MIDDLEBY CORP $89.99 2.6% 300.00 $26,997.00 HoldNTRI NUTRI/SYSTEM INC $13.89 2.5% 1,820.00 $25,279.80 HoldPCP PRECISION CASTPARTS $142.23 2.4% 170.00 $24,179.10 HoldARLP ALLIANCE RESOURCE PARTNERS LP $76.40 2.4% 320.00 $24,448.00 BuyMA Mastercard Inc $246.71 2.4% 100.00 $24,671.00 BuyGD GENERAL DYNAMICS $75.94 2.2% 300.00 $22,782.00 BuyHUM HUMANA INC $62.60 2.2% 360.00 $22,536.00 HoldBHP BHP Billiton Ltd $93.91 2.2% 240.00 $22,538.40 BuyHRS HARRIS CORP $46.45 2.1% 470.00 $21,831.50 BuyGPN Global Payments Inc $47.96 2.1% 460.00 $22,061.60 BuyBYI Bally Technologies Inc $38.42 2.0% 540.00 $20,746.80 HoldANR Alpha Natural Resources Inc $54.65 2.0% 370.00 $20,220.50 HoldTPC Tutor Perini Corp $23.43 1.9% 830.00 $19,446.90 HoldFRX FOREST LABORATORIES INC $31.88 1.8% 580.00 $18,490.40 HoldKCI Kinetic Concepts,Inc. $47.34 1.8% 380.00 $17,989.20 HoldATW ATWOOD OCEANICS $45.59 1.8% 410.00 $18,691.90 HoldJCOM J2 GLOBAL COMMUNICATIONS NEW $29.13 1.8% 650.00 $18,934.50 HoldGRMN GARMIN LTD $33.17 1.7% 520.00 $17,248.40 HoldNE Noble Corp $44.19 1.6% 380.00 $16,792.20 HoldACN Accenture Plc $52.18 1.6% 320.00 $16,697.60 HoldENDP ENDO PHARMACEUTICALS HLDS INC $34.33 1.5% 460.00 $15,791.80 Buy
CEPH CEPHALON INC $56.22 1.5% 270.00 $15,179.40 HoldWMT WAL-MART STORES $51.75 1.4% 280.00 $14,490.00 HoldAMED AMEDISYS INC $35.32 1.4% 420.00 $14,834.40 HoldLHCG LHC Group, LLC $30.24 1.4% 460.00 $13,910.40 BuyMDT MEDTRONIC INC $39.88 1.1% 290.00 $11,565.20 HoldALGT Allegiant Travel Company $41.10 1.1% 280.00 $11,508.00 HoldESLT ELBIT SYSTEMS $50.51 1.0% 200.00 $10,102.00 BuyBBY BEST BUY CO INC $32.37 0.9% 290.00 $9,387.30 Hold
Long Portfolio

8/7/2019 Market Haven Monthly Newsletter - March 2011
http://slidepdf.com/reader/full/market-haven-monthly-newsletter-march-2011 13/14
MARKET HAVEN MONTHL
Symbol Name Price
Portion Of
Fund Shares Held Value
Current
Rating
WY WEYERHAEUSER CO $24.20 3.8% -3,541.00 ($85,692.20) ShortARMH ARM HOLDINGS ADS $30.11 3.2% -2,410.00 ($72,565.10) ShortN NetSuite Inc $30.69 2.4% -1,760.00 ($54,014.40) Hold
FXEN FX ENERGY INC $11.73 2.1% -4,010.00 ($47,037.30) ShortPEGA PEGASYSTEMS INC $40.31 1.8% -1,030.00 ($41,519.30) HoldVRX Valeant Pharmaceuticals Intern $40.11 1.8% -1,033.00 ($41,433.63) ShortEBS Emergent BioSolutions, Incorporated $21.24 1.8% -1,920.00 ($40,780.61) HoldHUSA Houston American Energy Corporation $16.27 1.8% -2,490.00 ($40,512.30) ShortSFE SAFEGUARD SCIENTIFICS $21.08 1.8% -1,900.00 ($40,051.81) ShortMAKO MAKO Surgical Corporation $20.78 1.7% -1,890.00 ($39,274.20) ShortNATI NATL INSTRUMENTS $31.24 1.7% -1,215.00 ($37,956.60) ShortPXD PIONEER NATURAL RES $102.86 1.6% -350.00 ($36,001.00) ShortHNR Harvest Natural Resources Inc $13.88 1.5% -2,510.00 ($34,838.80) ShortCRR CARBO CERAMICS INC $119.57 1.5% -290.00 ($34,675.30) ShortBAGL Einstein Noah Restaurant Group $16.12 1.4% -1,990.00 ($32,078.80) ShortHOT STARWOOD HOTELS&RESWORLDWIDE $61.55 1.4% -520.00 ($32,006.00) ShortAH Accretive Health Inc $20.50 1.4% -1,560.00 ($31,980.00) ShortIGTE iGate Corporation $18.47 1.3% -1,660.00 ($30,660.20) HoldTLM TALISMAN ENERGY $24.52 1.3% -1,210.00 ($29,669.20) ShortFL Foot Locker Inc $19.29 1.3% -1,530.00 ($29,513.70) HoldMCHP MICROCHIP TECHNOLOGY $37.33 1.3% -790.00 ($29,490.70) HoldBCO Brink's Co/The $30.90 1.3% -950.00 ($29,355.00) ShortACXM ACXIOM CORP $17.12 1.3% -1,710.00 ($29,275.20) HoldSWK Stanley Black & Decker Inc $75.11 1.3% -383.00 ($28,767.13) HoldCMO CAPSTEAD MORTGAGE(NEW) $13.06 1.3% -2,190.00 ($28,601.40) HoldNOG Northern Oil & Gas, Incorporated $31.70 1.3% -900.00 ($28,530.00) ShortBG Bunge Ltd $71.49 1.2% -380.00 ($27,166.20) ShortCOG CABOT OIL & GAS 'A' $45.79 1.2% -590.00 ($27,016.10) HoldPTIE PAIN THERAPEUTICS $6.71 1.2% -4,020.00 ($26,974.20) HoldDUF Duff & Phelps Corporation $16.44 1.2% -1,640.00 ($26,961.60) HoldEXP Eagle Materials Inc $31.85 1.2% -830.00 ($26,435.50) ShortMCCC MEDIACOM COMMUNIC'A' $8.81 1.1% -2,950.00 ($25,989.50) Short
FICO Fair Isaac Inc $28.40 1.1% -910.00 ($25,844.00) HoldMNTA Momenta Pharmaceuticals Inc $13.81 1.1% -1,850.00 ($25,548.50) HoldGEO Geo Group Inc/The $25.03 1.1% -1,010.00 ($25,280.30) HoldFO FORTUNE BRANDS $61.57 1.1% -410.00 ($25,243.70) ShortMF MF Global Holdings Ltd $8.49 1.1% -2,960.00 ($25,130.40) ShortTIF TIFFANY & CO $61.15 1.1% -410.00 ($25,071.50) HoldSTMP STAMPS.COM INC $13.39 1.1% -1,870.00 ($25,039.30) ShortNOVL NOVELL INC $5.91 1.1% -4,220.00 ($24,919.10) ShortLTD Limited Brands $32.32 1.1% -770.00 ($24,886.40) HoldMAN MANPOWER INC $64.51 1.1% -380.00 ($24,513.80) ShortMSCC MICROSEMI CORP $22.35 1.1% -1,080.00 ($24,138.00) ShortLUX LUXOTTICA GROUP ADS $30.78 1.1% -780.00 ($24,008.40) HoldKW Kennedy-Wilson Holdings Inc $11.00 1.1% -2,180.00 ($23,980.00) HoldALX ALEXANDER'S, INC $393.55 1.0% -60.00 ($23,613.00) ShortBMS BEMIS CO $32.65 1.0% -720.00 ($23,508.00) HoldSTEI STEWART ENTERPRISES INC CL A $7.63 1.0% -3,080.00 ($23,500.40) ShortEQT EQT Corp $48.72 1.0% -480.00 ($23,385.60) ShortFDX FEDEX CORP $89.88 1.0% -260.00 ($23,368.80) HoldGKSR G & K SERVICES CL'A' $32.74 1.0% -710.00 ($23,245.40) ShortLGF LIONS GATE ENTERTAINMENT $5.96 1.0% -3,860.00 ($23,005.60) ShortBMRN BIOMARIN PHARMACEUTICAL INC $24.58 1.0% -920.00 ($22,613.51) ShortPFS Provident Financial $14.78 1.0% -1,510.00 ($22,317.80) HoldCRTX Cornerstone Therapeutics Inc $5.49 1.0% -4,030.00 ($22,124.70) ShortALE Allete Inc $37.56 1.0% -580.00 ($21,784.80) HoldVVUS VIVUS INC $7.64 0.9% -2,820.00 ($21,544.80) HoldCFR CULLEN/FROST BANKERS $59.39 0.9% -360.00 ($21,380.40) HoldPC Panasonic Corp $13.42 0.9% -1,590.00 ($21,337.80) HoldWTR Aqua America Inc $22.32 0.9% -930.00 ($20,757.60) HoldNVEC NVE Corporation $59.15 0.9% -350.00 ($20,702.50) Hold
Short Portfolio

8/7/2019 Market Haven Monthly Newsletter - March 2011
http://slidepdf.com/reader/full/market-haven-monthly-newsletter-march-2011 14/14
MARKET HAVEN MONTHL
BTX BIOTIME INC $7.01 0.9% -2,940.00 ($20,609.40) ShortRIGL RIGEL PHARMACEUTICALS $7.30 0.9% -2,800.00 ($20,440.00) HoldHTLD HEARTLAND EXPRESS $16.63 0.9% -1,200.00 ($19,956.00) HoldCBSH COMMERCE BANCSHARES $40.00 0.9% -497.00 ($19,880.00) HoldXXIA IXIA $17.71 0.8% -1,090.00 ($19,303.90) ShortTXI TEXAS INDUS $40.13 0.8% -480.00 ($19,262.40) HoldCADX Cadence Pharmaceuticals, Incorporated $7.61 0.8% -2,510.00 ($19,101.10) ShortCYN CITY NATIONAL $59.49 0.8% -320.00 ($19,036.80) HoldCMA COMERICA INC $38.83 0.8% -470.00 ($18,250.10) Hold
CVC CABLEVISION SYS'A' $36.98 0.8% -480.00 ($17,750.35) HoldAA ALCOA INC $16.68 0.8% -1,060.00 ($17,680.80) HoldMYGN MYRIAD GENETICS $18.47 0.7% -920.00 ($16,992.40) HoldOMER Omeros Corp $6.56 0.7% -2,580.00 ($16,924.80) HoldLM LEGG MASON INC $36.12 0.7% -460.00 ($16,615.20) HoldOMX OfficeMax Inc $13.77 0.7% -1,150.00 ($15,835.50) HoldXNPT XenoPort, Incorporated $7.18 0.7% -2,110.00 ($15,149.80) HoldONB OLD NATL BANCORP(IND) $11.17 0.6% -1,130.00 ($12,622.10) HoldMLM MARTIN MARIETTA MATERIALS $88.08 0.5% -140.00 ($12,331.20) ShortCWT CALIF WATER SVC GRP DELAWARE $35.13 0.5% -350.00 ($12,295.50) HoldCGA China Green Agriculture Inc $8.00 0.5% -1,510.00 ($12,080.00) ShortOREX Orexigen Therapeutics, Incorporated $3.30 0.5% -3,620.00 ($11,946.00) HoldIDRA Idera Pharmaceuticals Inc $2.70 0.5% -4,000.00 ($10,800.00) ShortCNW Con-way Inc $32.19 0.5% -330.00 ($10,622.70) HoldJNY The Jones Group Inc $13.50 0.5% -770.00 ($10,395.00) HoldBXS BANCORPSOUTH $15.78 0.4% -640.00 ($10,099.20) HoldHQS HQ Sustainable Maritime Indust $4.17 0.4% -2,290.00 ($9,549.30) HoldFTR Frontier Communications Corp $8.42 0.4% -1,040.00 ($8,756.80) HoldPBCT PEOPLE'S BANK $13.11 0.4% -660.00 ($8,652.60) HoldBKS BARNES & NOBLE $13.71 0.4% -600.00 ($8,226.00) Hold