Workforce Optimization Strategies for Recruiters Max Simkoff CEO, Evolv On-Demand.
Upload
hoangquynhCategory
view
214download
1
Market Forces and CEO Pay: Shocks to CEO Demand Induced by IPO Waves
Jordan Nickerson
The University of Texas at Austin
November 5, 2013
ABSTRACT
I develop a simple model of wages set in competitive equilibrium and derive predictions regarding the response of wages when an inelastic supply of CEO labor cannot match an increase in demand. The model predicts that the CEO pay-size elasticity increases when more firms compete for a fixed supply of managers, a prediction robust to a broad class of distributions commonly used. I then empirically test this prediction using industry-level IPO waves. Consistent with the model’s prediction, I find that pay-size elasticity increases by 5.9% following a one standard deviation increase in an industry’s IPO activity after controlling for firm performance, which equates to an average increase in compensation of $412,100. This effect is stronger in industries which require more specialized skills and prior industry experience, which have less sales overlap from other industries, and have less correlated returns with other industries. Furthermore, I find that increased IPO activity leads to a greater likelihood of executive transitions between firms. Finally, I find support for IPO activity drawing down the talent pool of an industry, leading to a 49.5% increase in the likelihood of a firm hiring a successor from outside the industry relative to an industry insider. Overall, these findings point to the substantial role market forces play in the determination of CEO pay.

1
There has been much debate regarding whether CEO compensation is the equilibrium outcome of a
competitive market for managers or if the level of wages is being driven by agency problems. Under
the former view, CEO compensation is a reflection of the marginal value each manager contributes
to their firm. An implication of this theory is that CEOs are heterogeneous in their managerial ability
and possess superior managerial ability relative to non-CEOs. Thus, CEOs are able to provide a
scarce service whose efficient allocation has massive implications on overall social welfare.
In this paper, I test a direct prediction stemming from the theory of competitively set wages
by focusing on industry level changes in the demand for CEOs. If executives provide a service in
scarce supply, a shift in demand should induce the market value of CEO labor to respond
accordingly. I exploit the increased demand for CEOs prompted by the entrance of new firms
during industry IPO waves to examine how wage dynamics respond. The slow accumulation of
industry specific human capital required to manage large firms prevents the efficient and timely
redeployment of managers from other industries, leading to a shortfall of talented managers relative
to firms. This imbalance in the supply and demand of CEO labor drives up the competitive wages
earned by CEOs in equilibrium.
I begin by presenting a frictionless, one-industry model of CEO wages used by Gabaix and
Landier (2008) and Tervio (2008). From this framework, I derive a set of comparative statics
regarding the effect that increased competition has on wages. An increase in the measure of firms
participating in the labor market is associated with an increase in the elasticity of CEO pay with
respect to productive assets. I then test this prediction and find empirical support using industry
level IPO waves as a measure of increased demand.
Consistent with the model’s predictions, I find that the elasticity of pay with respect to firm
value is positively correlated with the industry’s IPO activity over the preceding three year period.
Additionally, I find that this effect is stronger in industries that require more industry-specific

2
knowledge, in industries which are more unique in their operations, and in well-governed firms.
Furthermore, I find evidence that executives are more likely to transition between firms in times of
increased IPO activity. Finally, consistent with the depletion of an industry’s managerial talent, it is
49.5% more likely for a firm to seek a replacement from outside the industry following a one
standard deviation increase in IPO activity.
The predictions tested in this paper rest on a foundation provided by the model set forth in
Gabaix and Landier (2008) in which managerial effort has a multiplicative effect on productive
assets. This modeling assumption dovetails nicely with the superstar effect described in Rosen
(1982), wherein a talented manager has the ability to make every dollar under her control more
productive, thereby justifying the high level of compensation that she receives.
The innovation to Gabaix and Landier (2008) that I study stems from a change in the
competition for managers. After constructing the equilibrium wages for a one-industry economy, I
generate comparative statics by perturbing the economy with the introduction of an additional
measure of firms, while holding the measure of managers fixed. By changing the measure of firms, I
am able to parsimoniously increase the amount of competition for CEOs. This allows me to
examine how wages respond when a relatively inelastic supply of talented managers cannot keep
pace with a sudden increase in the demand for CEOs, brought on by a surge of new firms entering
into the market. The slow moving labor considered here is motivated by the necessity of CEOs to
accumulate working capital which takes time to build up.
The introduction of more firms into the industry leads to a reformation of the CEO-firm
matches. Prior to this influx of new firms, smaller, less productive firms may have enjoyed a talented
manager. However, following the entrance of new firms seeking a CEO, smaller firms are no longer
able to retain such talented managers, who depart for more productive firms where they receive
higher wages. Instead, low productivity firms are each matched with a CEO of a lower quality than

3
under the previous regime. Nonetheless, equilibrium wage offers increase for these firms, a result
robust to a large class of commonly used distributions of managerial talent. In the model, wages are
set in a recursive fashion from the smallest firm upwards in a way that preserves positive assortative
matching. Therefore, while the entry of more productive firms leaves an incumbent firm with a less
talented manager, the entry of some less productive firms drives the wages that the incumbent firm
offers upwards.
Empirically, I use industry level IPO waves to symbolize the addition of new firms into a
pre-existing equilibrium. This allows me to study the entrance of pre-existing firms with operations
in place into the public equity market. However, the skill set necessary to efficiently manage a large
corporation changes following the transition from being privately held to publically traded,
increasing the demand for CEOs with such abilities. Furthermore, large private companies going
public have a greater ability to compete with incumbent firms for highly talented CEOs relative to
newly formed firms which tend to be smaller in size. In addition, while outside the model presented
in this paper, IPO waves could potentially provide a positive shock to the upper tail of productive
firms providing an interesting setting in which to study the wage response of very large firms.
Confirming the model’s prediction, I find that the elasticity of pay with respect to firm value
increases by 5.8% of the unconditional pay-size elasticity with a one-standard deviation increase in
industry IPO activity over the preceding three year period. Economically, this equates to an average
increase in pay of 6.3%, or $412,100 in my sample. This result is robust to the measure of CEO pay,
with consistent results for both total compensation and base salary plus bonus.
Within the context of the model, the increase in wages is driven by more competition for
CEOs. This competition also results in a reallocation of managers across firms, a prediction unique
to this model relative to hypotheses based on rent extraction or efficiency wages. Therefore, I next
seek empirical evidence regarding executive transitions to distinguish between the competing

4
theories. Using a competing-risks framework, I find the odds of an executive transitioning to a new
firm where they receive a higher level of compensation increases by 18% with a one standard
deviation increase in the industry’s IPO activity.
I then test the cross-sectional magnitude of demand on pay-size elasticity. If wages are being
influenced by the competition for managers then there should be a stronger effect when more
industry-specific knowledge is needed, resulting in a more inelastic supply of CEOs. I find a larger
effect in industries that hire fewer CEOs from outside the industry, with less overlap in sales from
firms outside the industry, and in industries whose returns are less correlated with other industries. I
posit that these industries are harder to learn, require more industry-specific knowledge, or are more
unique in their operations. To test the alternative hypothesis that this effect is being driven by
agency problems, I interact the effect of demand on pay-size elasticity with firm governance
measures. Contrary to this principle-agent hypothesis, I find the effect to be more pronounced in
well-governed firms.
Finally, in light of these previous findings, I test if IPO activity does in fact reduce the
managerial pool available within an industry, thereby affecting a firm’s choice of successor following
CEO turnover. A one standard deviation increase in IPO activity is associated with a 49.5% increase
in the odds of selecting a successor from outside the industry relative to an industry insider,
conditional on selecting a successor from outside the firm. This result is fully consistent with IPO
waves leading to more competition for top CEOs within an industry, thus bidding up wages.
Both Hubbard and Palia (1995) and Crawford et al (1995) examine deregulation in the
banking sector, finding that it led to an increase in CEO compensation. This analysis is extended by
Cuñat and Guadalupe (2009b) and expanded to the manufacturing sector by Cuñat and Guadalupe
(2009a), which both find an increase in the pay-performance sensitivity of CEOs. However, these
works focus on changes to the competitive space that firms operate in and their influence on the

5
optimal compensation scheme needed to incentivize managers. In contrast, I attempt to disentangle
this hypothesis of efficiency wages from a theory of competitively set wages by focusing on the
effects that increased demand for managers has on both pay-size elasticity and the reallocation of
managerial talent across firms.
There is an extent of literature on the impact of CEOs and the compensation they receive.
This is illustrated by the numerous surveys regarding CEO compensation, including earlier works by
Rosen (1992), Murphy (1999), Abowd and Kaplan (1999), Core, Guay and Larker(2003), and more
recent work by Aggarwal (2008), Bertrand (2009), Edmans and Gabaix (2009) and Frydman and
Jenter (2010), among others. A long-standing debate in the literature is the source driving the level
of CEO compensation to greater and greater heights; either strong CEOs are extracting rents from
boards of directors and the shareholders they represent, or CEO pay is contracted on in an efficient
manner and the result of a competitive market for CEO talent. Jensen, Murphy and Wruck (2004)
and Bebchuck and Fried (2003, 2004) argue that a CEO plays a considerable role in the board's
decision of compensation levels and structuring and the level of pay observed is the result of rent
extraction.2 Standing in opposition to this group are those who posit CEO pay as the efficient
outcome of an optimal contracting environment. Expanding on the early work of Rosen (1982),
Gabaix and Landier (2008) and Tervio (2008) each calibrate models where heterogeneous firms and
managers are optimally matched and wage contracts are set in competitive equilibrium. I extend this
second view by deriving a prediction from a model of efficiently contracted wages which I then test
and find empirical support for.
2 This view is taken to the extreme in Kuhnen and Zwiebel (2008), where executive pay is modeled as being directly set by the CEO, whose only deterrent to extracting more value from the firm is the risk of being fired. Support has also been argued by a CEO being compensated for luck (Bertrand and Mullainathan (2001)), the asymmetric response of compensation to such luck (Garvey and Milbourn (2006)), a breakdown of relative performance evaluation (Gibons and Murphy (1990)), and CEO compensation being higher when the CEO also sits on the nominating committee (Core et al (1999)).

6
This paper also contributes to a second strand of literature which focuses on the importance
of CEOs and the value they add to firms they direct. Bertrand and Schoar (2003) and Graham, Li,
and Qiu (2012) examine the CEO’s effect on firm performance by focusing on CEOs which
transition across multiple firms.3 Bennedsen, Perez-Gonzales and Wolfenzon (2012) measure a
CEO's impact by using the number of days the manager is hospitalized. My paper extends this
literature by studying how the value a firm places on their CEO is influenced by changes to the
competition for managers.
Finally, this paper adds to the literature regarding a firm’s choice of succession type. Among
early work, Parrino (1997) observes that a firm’s successor choice is closely tied to the performance
of the firm. Cremers and Grinstein (2013) use the percentage of these successors hired from outside
the firm as a measure of firm-specific knowledge, which they find is positively related to the
prevalence of pay benchmarking and pay-for-luck within the industry.4 I extend these studies by
explaining the time-series variation of a firm’s successor choice. I find evidence relating a firm’s
decision of successor type to changes in the firm’s respective options within and outside the
industry. Effectively, IPO activity draws down on the pool of managers within an industry leading to
an increased likelihood of choosing a successor from outside the industry.
The rest of the paper is structured as follows. Section II lays out the motivating model. In
section III I outline the data used. Section IV presents my empirical findings on the effects of IPO
waves on pay-size elasticity within an industry across time. Section V turns to the the cross-sectional
3 Kaplan, Klebanov, and Sorensen (2012) map this effect on performance to observable characteristics using evaluations of potential CEOs, identifying particular CEO traits that are positively related to future performance. Additionally, Adams, Alemida and Ferreira (2005) find that more powerful CEOs have a stronger impact, measured by the volatility of stock returns, and Carter, Franco, and Tuna (2010) and Falito, Li, and Milbourn (2013) find that executive compensation is related to observable CEO characteristics. 4 The decision of hiring a replacement from inside or outside the firm is modeled in Murphy and Zabojnik (2004). In an accompanying work, Murphy and Zabojnik (2007) model a shift from specific to general skills which is linked to trends in outside hires and pay. Additionally, Lasear and Oyer (2004) find that external markets and opportunities affect wage levels at all levels of the firm they study, up to but not including the CEO.
7
magnitude of this response across industries. Section VI is reserved for the effects of IPO activity
on both CEO turnover as well as the successor decision, while section VII concludes.
II. The Model
I begin by presenting the CEO labor matching model of both Gabaix and Landier (2008) and Tervio
(2008) for a single industry economy, in which I will derive wages under two industry conditions. In
the first scenario CEOs and firms are efficiently matched and wages are determined in competitive
equilibrium under normal times. In the second scenario I will introduce an additional measure of
firms while holding the measure of managers constant and again determine wages in equilibrium to
characterize the effect a positive shock to labor demand has on wage dynamics.
II.I Model Setup and Equilibrium
The economy consists of a continuum of individuals with fully observable, heterogeneous
talent levels, , each of whom has the ability to manage a firm. All individuals share a
common reservation wage, . The talent distribution of these individuals follows .
Additionally, the economy is populated by a continuum of firms, who differ in their level of
productive assets, , governed by .
Profits are a function of a firm’s productive assets, the CEO’s talent level and wages paid:
(1)
The influence a CEO has on a firm’s gross profits is modeled as a multiplicative effect. The
interpretation is that a superior CEO can make every dollar under her control more productive,
relative to a less talented manager, in the spirit of Rosen (1982). This assumption will be important
later when deriving the equilibrium wages paid to CEOs.

8
In this frictionless labor market, there is a perfect rank order correlation between a firm’s
productive assets and the CEO’s talent for each matched pair.5 Therefore, wages are governed by
the assignment equation of Sattinger (1979), where each manager earns the wages of a manager
marginally less talented then themselves plus their marginal talent increased by factor of the firm’s
productive assets. Define , which represents the talent level of the individual in the
pth percentile of the talent distribution. Similarly, define , mapping a firm’s relative
ranking in the economy to the size of their productive assets. Then, wages have the following
property in equilibrium:
(2)
Thus, the marginal change in wages for a given firm increases in both the local talent differential of
managers and the size of the firm.
Up to this point I have said nothing regarding the measure of firms or managers. Let and
denote the measure of managers and firms, respectively. I now make the mild assumption that
Simply put, there is a surplus of potential managers in the economy. Let be such that
the measure of CEOs over the interval equals the measure of firms in the market. Each firm
employs exactly one manager, therefore every individual within this interval will be matched with a
firm in the labor market. Thus, the talent distribution of employed managers is
, and zero otherwise. Define
, the quantile function of the new
distribution.
Positive assortative matching implies a firm with assets will employ an individual of talent
level . A lack of competition among firms for this manager leads to compensation being set at her
5 This assignment outcome is referred to as positive assortative matching. Nickerson (2013) examines the importance of this assumption by quantifying the distortionary effect that a matching friction has on overall social welfare.

9
reservation wage, . From this fixed point and equation 2, competitive wages follow from the
following equation:
(3)
The motivation behind this model is to demonstrate how wages react in abnormal times.
Therefore, I apply a perturbation to the industry by introducing an additional measure of new firms,
while keeping the distribution of firms fixed. An increase in the measure from to
parsimoniously represents an increase in the competition for managers among firms.
Under this second scenario the measure of managers employed also increases from to
. Because the measure of firms increases while the distribution remains the same, the
talent distribution effectively compresses from a firm’s standpoint, causing every firm but the largest
to be paired with a less talented manager. Therefore, there is a decrease in the level of the least
talented CEO matched with a firm. Let be such that the measure of CEOs over the new interval
equals the increased measure of firms in the market, . The increase in the
measure of firms also requires us to redefine the talent distribution of those managers being
employed. The talent distribution of employed managers is now
, and zero otherwise. Finally, I define
, the talent level of an individual in
the pth percentile of the new distribution.
Note that while the firm at the upper support continues to employ a manager of talent level
, any other firm in the economy residing in the pth percentile is matched with a manager of lesser
ability relative to the first scenario: . Furthermore, because the distribution of firm
sizes was not altered, remains unchanged, giving way to the new wage function:
(4)

10
II.II Model Predictions
Given the characterization of equilibrium wages under normal demand in (3) and times of
increased demand in (4), the following relationships can be divined.
[Proposition 1]
Following an increase in the number of firms active in the CEO labor market, the disparity
between the wages paid by the largest firm and a firm of any other size also increases. Intuitively, as
a new measure of firms is introduced into the economy, every individual in the labor market is
matched to a firm with a larger amount of productive assets. Following from (2), this leads to an
increase in the wage differential between adjacent managers.6 It is relatively straightforward to arrive
at the effect an increase in competition has on wages paid by the largest firm.
[Proposition 2]
By assumption, all individuals in the economy share a common reservation wage. This
reservation wage provides a fixed point, which when substituted into Proposition 1, yields a model
prediction regarding wages paid by the largest firm in the economy.
While the previous propositions place no restrictions on the functional forms on the
distributions of either firm size or managerial talent, they fail to illustrate how wages respond locally
for firms in the interior of the size distribution. I now refer to the application of the extreme value
theorem by Gabaix and Landier (2008), who derive an approximation of for a broad class of
distributions. Given a tail index of for the talent distribution , they show
(5)
6 The technical condition that the distributions of firm sizes and managerial talent each have a finite upper support is necessary to ensure that all wages are finite.

11
Following the substitution of (5) into wage equations (3) and (4), I get the following model
prediction regarding the local change in wages with respect to firm size following an increase in the
demand for CEOs.
[Proposition 3]
Thus, if the tail index of the talent distribution is non-negative, as is the case in the Gaussian,
logit, exponential, log-normal, uniform, bounded power law, and Weibull distributions7, an increase
in the number of firms vying for CEOs leads to an increase in wages with respect to firm size
regardless of at which point the derivative is evaluated.8 Alternatively, following a discretization of
both firm size and managerial talent distributions, all of the previous propositions follow through.
II.III Simulation Results
While the previous propositions give an indication of how wages will respond to an increase
in the demand for CEO labor, the litmus test by which I will evaluate the model’s predictions is an
empirical one of how pay-size elasticity changes with competition for managers. The propositions
set forth thus far do not provide much insight into the magnitude of this response. To provide some
intuition, Figure 1 graphs how pays-size elasticity changes following a shock to demand under some
common distributions. Panel A reports the equilibrium wages under two scenarios, Normal Demand
and Increased Demand, when the distribution of talent follows either a normal distribution (left plot) or
a beta distribution (right plot). Under the Normal Demand scenario, I begin by drawing the top 500
firms of an economy from a Zipf distribution and a population of managers from their respective
distributions.9 Next, I assign the top 500 managers to firms in a positive assortative fashion and fix
the wages of the smallest firm-CEO pair. Finally, I set wages according to equation (3). For the
7 See Gabaix, Laibson, and Li (2005) for a list of common distributions and their tail indices 8 Note that for distributions with a tail index of zero, I must impose an upper bound on the talent level of potential CEOs to ensure that all wages are well defined. 9 Firm sizes are set to mimic the market capitalization of the largest 500 firms in the compustat universe. See Gabaix (1999) and Luttmer (2007) for a justification of approximating the size distribution of firms using a Zipf distribution.

12
Increased Demand scenario, I introduce 20% more firms into the economy spaced evenly throughout
the entire distribution, rematch managers to firms, and again calculate the equilibrium wages.
Following the entrance of additional firms, wages respond by increasing along the entire distribution
of firm sizes, irrespective of which distribution is considered.
However, it is possible that this result is sensitive to the distribution of talent assumed. To
alleviate this concern, Panel B reports pay-size elasticity under eight common distributions for the
Normal Demand and Increased Demand scenarios. Pay-size elasticity is calculated by regressing the
natural log of CEO compensation on the natural log of firm value and a constant. The parameters
of each distribution were chosen in such a way that the pay-size elasticity for the Normal Demand
scenario was between .40 and .41. After introducing an additional measure of firms into the
economy, pays-size elasticity increases for all distributions considered. In addition, with the
exception of uniformly distributed talent, the increase in elasticity is similar across all the
distributions. I now turn my attention to the empirical evaluation of this model prediction.
III. Data Description and Variable Construction
To empirically test the model’s prediction regarding wage elasticity, I use data from Compustat
fundamentals, Execucomp, Compustat’s Historical Segments, BoardEx, IPO dates from Jay Ritter’s
website, industry portfolio performance and composition data from Kenneth French’s website, and
CEO turnover data from Andrea Eisfeldt’s website.
III.I Datasets Used
I begin by merging yearly company fundamentals from Compustat with executive
compensation data from Execucomp. I exclude any observations with missing values of either total
assets (AT), book value of common equity or market value of common equity. Any missing values
of deferred taxes are set to zero. The intersection yields 32,466 firm-year observations from 6,358

13
unique individuals and 3,316 companies over the period of 1993-2011. For each firm, I define the
year-end firm value as total assets minus book value of common equity plus year-end market value
of common equity minus deferred taxes. My interest is on the largest firms in the economy, where
the competition for CEO talent should be the most pronounced. Therefore, I restrict the sample to
the largest 2000 firms within each year according to lagged total firm value.10 Following this
restriction 20,355 observations remain. All firms are classified into one of the 48 industries set forth
in the scheme by Fama and French (1997).
Table IIII.II Measure of IPO Activity
While the data sources outlined thus far have been quite standard, I also need an empirical
measure that captures increases in the demand for CEO labor within an industry. I rely on the
within industry clustering of IPOs to proxy for times of increased labor demand. For newly public
firms to increase the competition for managers, it must be plausible that they could hire away an
executive from a firm in the sample. Therefore, I only consider the IPOs of firms whose market
value within two fiscal years is within the top 2000 firms.11 I am left with ### IPOs over the period
from 1988 – 2011. However, the use of industry level IPO activity does have its disadvantages. If
IPO waves correspond to an increase in the productivity of firms in an industry, a moral hazard
view would predict an increase in wages to induce a higher level of effort. However, as I will discuss
in more detail later, market value is used to proxy for a firm’s asset productivity. If a positive shock
to asset productivity is also reflected in market values, it is not clear why the elasticity of wages to
firm value would change.
10 Additionally, for robustness I also consider the full tenure of any CEO whose firm was ranked in the top 2000 in the year prior to her appointment. This prevents firms from dropping out of the sample after experiencing bad performance, which would possibly bias my results. This also gives the added benefit of having a consistent sample when performing tests related to CEO turnover, while avoiding a possible backfilling bias in the Execucomp sample, documented in Gillan, Hartzell, Koch and Starks (2013), which can bias results related to the structuring of CEO compensation. Results are robust to this alternate restriction on firm size. 11 To do this, I match IPO dates to the Compustat universe of firms by first using a name matching algorithm, and then verifying by hand.

14
As previously mentioned, the driving force behind my test is that human capital must be
accumulated over time, creating a slow moving supply of talented executives relative to the increased
demand caused by an IPO wave. However, larger industries naturally provide more employment
prospects, thereby attracting a greater number of managers. Thus, the supply of potential CEOs in a
larger industry is more able to absorb the increased demand induced by a given level of IPO activity.
For this reason, the percentage of IPO activity relative to the industry size should be more
informative regarding the change in demand for CEO labor. Therefore, each industry’s yearly
number of IPOs is scaled by the average number of firms within that industry in the prior three year
period.
I exclude any industry that averages fewer than 5 firms over the entire sample period to
avoid large variations in induced by changes in a small denominator.
Figure 2 plots the time-series for nine industries within my sample chosen at random.
Overall, there is considerable variation in industry-level IPO activity across time, with the exception
of industry number 31 (Utilities). One possible concern is that an unobservable economy-wide state
variable is influencing both wages and IPO activity across the entire economy, leading to correlated
IPO activity across industries. While this does not appear to be the case in the figure, this concern
will be addressed when presenting the empirical results in the next section.
The theory presented here is that human capital accumulates at a slow pace and managers
cannot quickly reallocate themselves to meet the increased demand within an industry. An increase
in IPO activity will likely have an effect on wages for multiple years given slow moving human
capital. Therefore, to reduce the noise in my measure of CEO demand, I instead sum over the
values of for the trailing three year period:

15
IV. Increased CEO Labor Demand from IPO Waves
IV.I Pay-Size Elasticity and IPO Waves
Empirically, I will be concentrating on pay-size elasticity to test the model predictions
presented above. To this end, the reduced-form framework used is as follows:
For the majority of my tests, I define a CEO’s Pay as the natural log of total compensation
(TDC1)12, although I consider other measures of CEO compensation for robustness. is
set to the natural log of lagged market value. If a CEO has the ability to affect future cash flows, I
believe that market value is a good proxy for productive assets. In addition, if IPO activity is
correlated with asset productivity, this shock to productivity should be incorporated in a firm’s
market value. By taking the natural log of both CEO compensation and market value, represents
the elasticity of CEO pay to firm value, or the percentage effect on pay associated with a one
percent increase in firm value. The interaction of logged market value with IPO Activity represents
how pay-size elasticity changes with the level of IPO activity within an industry.
Table I presents the results of OLS regressions of CEO compensation and the effects of an
increased demand for managers. The primary variable of interest is the coefficient on the interaction
between the natural log of market value and IPO Activity. The model presented in the previous
section predicts that the pay-size elasticity will increase following the entrance of additional firms
competing for CEOs. If this increased competition is correlated with IPO activity within an
12 TDC1 is the sum of all cash compensation, the total value of restricted stock grants, the Black-Scholes value of option grants, long term incentive payouts and all other compensation.
16
industry, the model predicts a positive coefficient on the interaction of IPO Activity and logged
market value. All variables have been standardized by industry, with the exception of the natural log
of firm market value, Ln(Market Value). Thus, the coefficient of Ln(Market Value) represents the
elasticity of CEO compensation to firm value.
The first specification only controls for differences in average compensation across
industries and years with fixed effects. Across the entire sample, the elasticity of pay with respect to
firm market value is 0.429, indicating that a ten percent increase in firm value is associated with a
4.29 percent increase in CEO pay. Additionally, the coefficient of 0.0271 (t-stat=3.98) on the
interaction term indicates that a one standard deviation increase in the trailing three year IPO
activity within an industry leads to a 6.32% increase in pay-size elasticity.13 Given the non-zero
market values for all firms within the sample, if only market value and its interaction with IPO
Activity were included in a regression, a positive coefficient would imply that the pay to all CEOs
increased following an above average amount of IPOs within an industry. Therefore, IPO Activity is
also included without an interaction. This inclusion allows pay-size elasticity to increase without
simultaneously requiring the level of pay to also increase, decoupling the two effects. I will examine
the effect of IPO activity on the level of CEO pay and discuss one possible interpretation of the
negative point estimate on this coefficient shortly. To gauge the economic significance of this effect,
the compensation is re-estimated using the point estimates following a one standard deviation
increase in IPO Activity, and the average change across all observations is reported in Average Pay
Change. With no performance controls, the average level of pay increases by over $400,000 following
a one-standard deviation increase in IPO Activity. Additionally, the effect of IPO Activity evaluated at
13 Given the variable of interest is invariant within industry-year, error terms are potentially correlated within each industry-year. Thus, all reported standard errors are clustered at the industry-year level. Nonetheless, results are robust to clustering at the firm, industry, year, or CEO spell level, as well as White (1980) heteroskedasticity-adjusted standard errors.

17
the mean market value in the sample is statistically significant at the 0.1% level, as reported in the
last row.
A broad array of controls for firm performance, including operating return on sales and
market returns, and CEO tenure are added in Column 2.14 Following their addition, there is a
decrease in both the overall elasticity of pay to firm size (decreasing to 0.427) and its response to an
increase in industry IPO activity (to 0.0232, t-stat=3.43). However, Average Pay Change remains
relatively unchanged, decreasing by $2,700 to $404,600 after including performance controls.
While industry fixed effects are included in the first two specifications to account of
differences in the average level of CEO compensation between industries, I restrict the pay-size
elasticity to be equal across industries. Gabaix and Landier (2008) show that within a competitive
wage framework, pay-size elasticity is directly related to the rate of decrease in managerial ability,
which may differ across industries. Thus, I relax this constraint in the third specification by
interacting a complete set of industry dummy variables with the log of market value. The change has
little effect on the interaction between log market value and IPO Activity, decreasing it slightly to
0.0212 while increasing its statistically significant (t-stat=3.98).
Under a framework of competitively set wages, the theory predicts that there should be a
response to an increase in CEO demand within an industry. However, it is possible that my industry
level measure of labor demand is correlated with overall market conditions which are also driving
changes in the pay-size elasticity, biasing my estimates. Therefore, log market value is interacted with
a full set of year dummies in Column 4, allowing for the average pay-size elasticity across all firms to
vary by year. This inclusion leads to an increase in the sensitivity of pay-size elasticity to IPO activity,
14 See Appendix II for a detailed description of the construction of these controls.

18
with a coefficient on the interaction term of 0.0251 (t-stat=3.18).15 This represents an increase in
pay-size elasticity of 5.88% relative to the average pay-size elasticity across the entire sample.16
Additionally, the average change in compensation associated with a one standard deviation increase
in IPO Activity increases to $412,100, which represents 6.3% of the average compensation in the
sample.
All of the specifications considered to this point measure the effect of IPO Activity on a
CEO’s total compensation. One possibility is that times of increased IPO activity are positively
correlated with industry volatility, increasing the value of option grants. To address this concern,
Column 5 instead considers the effect on the natural log of cash compensation, defined as yearly
salary plus bonus. The magnitude of the effect regarding IPO Activity on pay-size elasticity does
decrease with a coefficient of 0.0129 (t-stat=2.03) relative to the analogous specification for total
compensation (Column 4). However, the pay-size elasticity across the entire sample also decreases to
0.264. Thus, the effect of one standard deviation increase in IPO Activity now represents an increase
in elasticity of 4.89% relative to its baseline value.
When constructing IPO Activity, each year’s total number of IPOs is scaled by the trailing
three year average number of firms in the industry within the top 2000 firms. Therefore, the effects
of IPO Activity on pay-size elasticity could be driven by changes in the denominator and not the
number of firms going public. Therefore, Panel A of Table IA I reports the results after scaling the
number of IPOs by the full sample average industry size. Additionally, the results in Table I use the
market value of a firm is used to account for possible changes to firm productivity which would lead
to higher levels of CEO compensation under a theory of efficiency wages. However, for robustness
15 To alleviate any concern that the effect of IPO Activity on the change in elasticity is being driven by changes in average compensation levels not adequately controlled for, industry-year fixed effects are included in untabulated results. The coefficient on the interaction term of IPO Activity and the log of market value is 0.0166 (t-stat=2.21). 16 The interaction of logged market value with industry dummies (Specification 3) and year dummies (Specification 4) allows pay-size elasticity to vary across groups, but also eliminates the unconditional pay-size elasticity. To aid in relative comparisons, the coefficient from Column 2 is reported for both regressions.

19
both the book value of assets (Panel B) and sales (Panel C) are considered as alternative measures of
a firm’s size. The results remain relatively unchanged.17
While these results suggest that pay-size elasticity increases following the entrance of new
firms into the public equities market, they need not be the result of wages increasing more-so than
market values. Alternatively, if pre-existing firms lose market share to firms going public resulting in
lower market values, but the wages of managers remain relatively static, such a pattern could be
generated.18 To examine this possible explanation, I now consider a non-parametric approach based
on a firm’s industry ranking. By focusing on a firm’s industry ranking rather than the firm’s market
value, I remove any effects that a monotonic transformation of market values has on their relation
to wages.
Figure 3 presents the average amount of log wages within industry deciles for low and high
levels of IPO activity, after controlling for firm performance, year and industry effects. Within each
industry, High IPO and Low IPO contain all observations in the top and bottom terciles of IPO
Activity, respectively, as previously defined. The shaded bars represent 95% confidence intervals,
testing for a difference between each decile’s High IPO and Low IPO averages. While wages are
systematically larger in times following above average levels of IPO activity, those firms falling into
the smallest three deciles have statistically insignificant differences in wages between the High IPO
and Low IPO groups. Beginning in the fourth decile, the difference in wages is statistically significant
at the 5% confidence level for all remaining deciles. Furthermore, the magnitude of the difference is
at its greatest for the top three deciles.
This figure also gives some insight into the negative coefficient of IPO Activity in Table
IITable I. While there is still a positive difference in pay for the smallest size deciles, the pay
17 The interaction of IPO Activity and the natural log of sales becomes statistically insignificant when considering the effect on cash compensation in Column 5 of Panel C. 18 An increase in size-wage elasticity would also require that firms drop in market value in a disproportionate but systematic manner, with the smaller firms losing a smaller percentage of their market values.

20
differential widens as the size decile increases. However, all firms in our sample have large market
values. If both series were extrapolated to a firm with a log market value of zero, compensation in
the Low IPO group would be larger than that of High IPO. This is consistent with the negative
coefficient of the uninteracted IPO Activity variable in Table.
IV.II Size Varying Effects of IPO Waves on Pay-Size Elasticity
The comparative statics for the model presented in Section II are generated by increasing an
additional measure of firms with the same distribution of firm sizes as the incumbent firms. While
this is done for parsimony, the empirical tests of this prediction are based on the number of firms
becoming publicly traded. Unlike the motivating example, it is unlikely that these firms are equally
distributed throughout the size distribution. It is more likely that these firms tend to be smaller in
their market value. Furthermore, larger firms going public are more likely to already have a CEO in
place capable of running a large company, private or public. Rather, if firms are only introduced in
the lower half of the size distribution, the equilibrium response of wages will vary conditional on
firm value. For firms below the median market value, where an additional measure of firms is
introduced, the change in pay-size elasticity will be similar to the results of Section II. However, the
wage response will differ for all firms above the median value, a region in which no new firms are
introduced. While wages paid by these firms will increase in their level, the pay-size elasticity in this
region will remain unchanged.
If IPOs are concentrated among the smaller firms in the sample and wages are responding to
an increase in the competition for managers, the inclusion of larger firms in the sample will attenuate
the coefficient on the interaction between log market value and IPO Activity and decrease its
statistical significance. Alternatively, CEO compensation could instead represent an efficiency wage
required to induce the optimal level of effort. If the number of firms going public is correlated with
the productivity of firms within an industry, wages will also increase. To the extent that this increase

21
in productivity is not captured in market values, the interaction of IPO Activity with log market value
may capture the effect.19 However, if IPOs are correlated with the productivity of firms in an
industry, the effect should affect all firms and not be absent in the largest firms.
Therefore, Table III presents identical model specifications as Columns 4 and 5 of Table II,
while excluding sample observations with the largest market values. For ease of comparability, the
first column redundantly reports Column 4 of Table II. In the second specification, the top 100
ranked firms according to lagged market value for each year are excluded from the sample.
Following their expulsion, the effect of a one standard deviation increase in IPO Activity on pay-size
elasticity increases both in magnitude, with a coefficient of 0.0357 (compared to 0.0251 in the full
sample) and also becomes more statistically significant (t-stat=4.47). Additionally, the average
change in compensation also increases to $515,100 following the elimination of the top 100 firms.
When the exclusion criteria is extended to remove the largest 250 firms in the third column, the
effect again increases to 0.0439 (t-stat=4.85). Therefore, a one standard deviation increase in IPO
Activity now increases pay-size elasticity by 9.3% of its full sample average. These results are
confirmed in Columns 4 through 6, when examining the effect on only cash compensation.
Figure 4 illustrates this effect by contrasting a piece-wise form of the regression in Column 1
of Table II and the percentage of IPOs within industry rank deciles. The solid squares represent the
coefficient of IPO Activity x Logged Market Value, segmented by industry size deciles. Hollow
diamonds illustrate the percentage of firms going public which fall into each decile based on market
value two years following the IPO. Both the effect of IPO Activity on pay-size elasticity and the
percentage of IPOs in the sample are disproportionally concentrated among the smaller size deciles.
19 However, if this leads to an increase in wages by a common factor across all firms, because the log of total compensation is being considered the effect would be captured in the coefficient of IPO Activity and not its interaction with Ln(Market Value).

22
Both Table III and Figure 4 suggest that the effect that IPO activity has on pay-elasticity is
concentrated more-so in smaller firms in the sample, where the majority of firms going public also
enter the economy. If CEO compensation is set to induce the optimal level of effort, and IPO
activity is correlated with firm productivity, wages would also increase during periods of above
average IPO activity. However, it is not immediately clear why the effect would be greater for
smaller firms. In contrast, this pattern is consistent with a response of wages to competitive
pressures. To further disentangle these two theories, I now turn to the reallocation of managerial
talent within industries.
IV.III Increased Competition and Executive Transitions
The previous section presents evidence consistent with an increase in the competition for
CEO labor following the entrance of new firms, leading to an increase in pay-size elasticity.
However, under certain conditions this outcome could also be consistent with a moral hazard
setting, where periods of above average IPO activity are associated with an increase in the
productivity of assets. While both theories could potentially explain such a relation, within a
competitive framework the change in wages is an equilibrium condition associated with the efficient
allocation of managers across firms. Therefore, an increase in the competition for managerial effort
brought about by the entrance of more firms into the labor market would be accompanied by a
greater degree of talent reallocation. Such a prediction is not shared by a moral hazard explanation.
I now seek to test this prediction empirically by examining the transition of executives across
firms under a competing-risks survival framework.20 The use of a competing-risks regression allows
me to disentangle executive transitions within industries from transitions to other industries or other
events that prevent an executive transition from occurring, thus right-censoring spells. I begin by
constructing spells for each of the top 5 executives as reported by Execucomp for every firm within
20 Specifically, I use the proportional sub-hazards model of Fine and Gray (1999).

23
my sample. For each spell, a transition event is classified as taking place if the individual is reported
in the top five executives of a second firm within three years following the departure from their
previous firm. Additionally, I require that both firms reside in the same industry to ensure that the
event captures the reallocation of talent within an industry. I define a competing event as the
transition to another industry, or where the individual’s spell ends and they do not appear at another
firm within three years. Additionally, all spells whereby the individual’s previous firm drops out of
the sample are also classified as competing events, as these instances are not consistent with an
executive being hired away. When an individual is reported as being within the top five managers of
two firms in the same fiscal year, I first rank each observation based on the annual CEO distinction
and then by total compensation received, retaining the first observation for each individual-year.
Table III presents the results of the competing-risks regression for the top five executives of
all firms within the sample. I consider the spells of all five executives as opposed to the CEO alone
for two reasons. A transition of a non-CEO between firms is motivated by the additional value the
individual adds to the firm they join, consistent with a reallocation of talent in the spirit of the
model. In addition, by considering the spells of all five individuals the frequency of transitions is
increased, adding power to the test.
The first specification reports the results with only the inclusion of IPO Activity, the
standardized trailing three year IPO activity within an industry. Reported are the sub-hazard ratios,
similar to the hazard ratio of a Cox proportional-hazard model. Without controlling for any other
determinants, IPO Activity is a statistically significant predictor of executive transitions between
firms. A one-standard deviation increase in IPO Activity is associated with an increase in the odds of
transitioning by 17.9% (z-stat=4.12). The inclusion of controls for firm performance and differences
in firm characteristics in Column 2 marginally reduces the coefficient of IPO Activity to 1.169 (z-
stat=3.15), indicating a one-standard deviation increase in IPO Activity within an industry is

24
associated with a 16.9% increase in the odds of an executive transitioning to another firm. However,
larger firms are more likely to have talented non-CEO executives who are valuable to other firms,
making them more likely to be tapped by newly public firms. Therefore, the lagged market value of
the firm is also included as a control in Colum 3. Both the coefficient and statistical significance of
IPO Activity remain relatively stable. Additionally, this specification confirms that larger firms are
more likely to have their top executives transition to other firms.
While the previous specifications indicate that above average IPO activity within an industry
is associated with a higher likelihood of executives transitioning between firms, such events may
represent individuals being demoted rather than being hired away. Thus, I define an Upward
Transition in a similar manner to the previously defined transition event with the additional
requirement that the total compensation of the executive increases in the first year following their
transition. All transitions not meeting this additional requirement are reclassified as an additional
competing event. While this reclassification reduces the statistical significance of each specification,
the point estimates remain relatively unchanged with sub-hazard ratios ranging from 1.155 (z-
stat=3.05) without any controls to 1.180 (z-stat=2.74) when a complete set of controls are included.
Overall, the findings presented in Table III indicate that times of increased IPO activity
within an industry are associated with greater mobility of executives across firms, consistent with the
reallocation of talent following an increase in the competition for managerial labor. These results
present the first evidence supporting the direct prediction of competitively set wages that when the
number of firms competing for an inelastic supply of able CEOs increases, the pay-size elasticity
also increases. I now turn to the cross-sectional properties of this effect across industries where
CEO labor elasticity differs.
V. Cross-Sectional Effects of IPO Waves on Pay-Size Elasticity Across Industries and Firms

25
The previous sections provide evidence consistent with market forces substantially affecting
CEO compensation and the reallocation of talent across firms which cannot be completely
explained by theories of rent extraction or efficiency wages. However, while the comparative statics
generated from the model are applicable to all industries, if wages are influenced by competitive
pressures the magnitude of the effect is likely to differ across firms and across industries. Therefore,
to further contrast a theory of competitively set wages from alternative hypotheses, I seek additional
evidence in the cross section of industries and firms.
V.I Cross-Sectional Effects across Industries
While the motivating model presented here is of a single industry, it need not be the case
that CEOs appointed to very large firms have prior experience within that industry. Additionally, the
skills necessary to manage a firm and the necessary amount of human capital a CEO must
accumulate likely vary across industries. If the increase in the pay-size elasticity is in response to an
increase in CEO demand, this response should be greater in industries that are harder for outsiders
to learn, and are more specialized. CEO labor in these industries should be more inelastic, leading to
a larger sensitivity of pay-size elasticity to an increase in the competition among firms. Therefore, I
construct empirical measures along three dimensions to capture industry uniqueness and skill
specialization on the CEO’s part.
The first measure I consider is the percentage of an industry’s CEOs hired from outside the
industry. Industries which require more industry-specific knowledge are likely to have a smaller
percentage of CEOs hired with no prior industry experience. I begin by extending the data from
Eisfeldt and Kuhnen (2013), classifying each hire in the sample as having prior industry experience
by using their employment histories, as reported by BoardEx. I define % Outside Hires as the number
of CEO successions within an industry with no prior industry experience divided by the total
number of CEO successions in that industry.

26
While % Outside Hires will correctly classify a CEO as having prior industry experience if all
industries are completely segmented, it is not uncommon for two firms to differ in their primary
operations but share other lines of business. An example of this is the classification of one company
into the ‘Food Products’ industry while another is placed in the ‘Candy & Soda’ industry, or
alternatively the overlap between the ‘Computers’ and ‘Electronic Equipment’ industries. Therefore,
to capture the overlap between industries, using data from the previous year I define % Overlapping
Segments for industry i at time t as follows:
where is the percent of sales by firm f in industry i for year t-1, and equals the number
of firms belonging to industry j in year t-1, as reported in Compustat’s Historical Segments database.
Therefore, a larger value of % Overlapping Segments indicates an industry in which there is more
overlap from firms in other industries. Therefore, % Overlapping Segments will capture the exposure of
CEOs from other industries with industry i.
Finally, I construct a measure of industry isolation, Industry Return Comovement, for industry i
at time t as the following:
where is the correlation between the value-weighted monthly portfolio returns of
industries i and j over the interval t-11 to t-1.21 Industries whose returns are less correlated with other
industries are also more likely to be unique, requiring specialized managerial skills.
While both % Overlapping Segments and Industry Return Comovement are constructed using a
rolling window of past information, % Outside Hires uses the full sample period when estimating the
21 I also consider portfolio returns of equal-weighted industry portfolios in untabulated results, which remain unchanged.

27
variable. The full sample period is used to reduce the measurement error in the variable, as the
number of CEO successions is quite low in some industries.
Table IV reports the results of OLS regressions of log CEO compensation on the log of
firm market value, the interaction of log market value and IPO Activity, and the three-way interaction
between log market value, IPO Activity, and standardized forms of each measure of industry
uniqueness/CEO importance. This three-way interaction will be used to test for variation in the
effect of competition on pay-size elasticity across industries. While the interaction of IPO Activity
and log market value represents the effect that an increase in CEO demand has on the pay-size
elasticity, this value interacted with industry-level uniqueness measures indicates how the effect of
increased demand on pay-size elasticity varies with a one standard-deviation increase in industry
uniqueness or CEO importance.
Columns 1 and 2 report the results when considering the interaction with % Outside Hires.
The coefficient of -0.004 (t-stat=-3.97) in Column 1 indicates that a one-standard deviation increase
in the percentage of CEOs hired from outside the industry reduces the effect of IPO Activity on pay-
size elasticity by 29.9% of its baseline effect.22 This is supportive of the prediction that the effect of a
shock to the competition for CEOs should be greater when an industry is harder to learn and
successors cannot be readily drawn from outside the industry. Column 2 includes the full set of
performance and firm characteristic controls, with the coefficient on the three-way interaction
decreasing slightly to -0.0036 (t-stat=-3.56). However, while the full sample average is used, as I will
show later, the increase in demand for CEO talent within an industry may be related to the
percentage of CEOs hired from other industries.
Therefore, I now turn to % Segment Overlap, which is estimated on a rolling basis using prior
information. Columns 3 and 4 focus on the percentage of sales overlap firms from all other
22 -0.004 / 0.0134 = -29.9%

28
industries have with the industry experiencing a shock to the demand for CEO labor. The
coefficient of -0.0034 (t-stat=-2.27) on the interaction term indicates that a one-standard deviation
increase in the percentage of overlapping sales reduces the effect of demand on pay-size elasticity by
21.4%. Again, after controlling for firm performance in the fourth specification, the results remain
quantitatively similar. While the coefficient increases to -0.0044, its effect relative to the baseline
value only rises to 23.9%.
While the previous measure captures the overlap that other industries have with the industry
experiencing the IPO wave, firms need not have sales in the same industry to be related. Thus, I
turn to my third measure based on return correlations across industry portfolios, Industry Return
Comovement, in columns 5 and 6. When firm performance is not controlled for in the fifth
specification, the negative coefficient of -0.0066 (t-stat=-3.25) indicates that a one-standard
deviation increase in the average correlation between an industry’s returns and each of the other
industries reduces the effect of an IPO wave on pay-size elasticity by 40.5%. After controlling for
firm performance in column 6, the coefficient decreases slightly to -0.0057 with a t-statistic of -3.09.
Thus, as an industry’s returns become less correlated with other industries the effect of an IPO wave
on pay-size elasticity becomes larger.
Finally, because these measures are likely correlated across industries, Columns 7 and 8
include all three measures to assess their joint significance. Without the inclusion of any
performance controls, the point estimates for the interactions of both % Outside Hires and Industry
Return Comovement remain stable and statistically significant. A Wald test of joint significance among
all three variables rejects the null of no effect for any of the three variables with a p-value less than
0.0001. When performance controls are included in Column 8, % Segment Overlap becomes
statistically significant at the 5% level while the statistical significance of Industry Return Comovement

29
decreases with a t-statistic of -1.96. The Wald test of joint significance also rejects the null with a p-
value less than 0.0001.
Overall, the results in Table IV indicate that the effect of an industry level shock to the
demand for CEO labor has a larger effect on pay-size elasticity in industries where firms are less
likely to hire from outside the industry, in industries where there is fewer overlap in sales from firms
in other industries, and in industries whose stock returns are less correlated with other industries.
However, while this analysis suggests that IPO activity influences pay-size elasticity differently across
industries in a way consistent with market pressures influencing CEO pay, there may be other
unobservable firm characteristics that differ across industries which could potentially explain these
results. Therefore, I now turn to cross-sectional variation at the firm level for additional evidence
validating the effect of market pressures on CEO pay.
V.II Cross-Sectional Effects across Firms
Within the context of this paper’s model, the increase in both wages and pay-size elasticity is
caused by an increase in the competition for managerial labor. Contrary to this view of competitively
set wages, both Jensen et al (2004) and Bebchuck and Fried (2003, 2004), among others, argue that
the high levels of compensation observed can be explained by rent extraction. Thus, if managers can
extract more rents during IPO waves and can do so to a greater extent in larger firms, then pay-size
elasticity would be positively related to IPO activity within an industry. Under this hypothesis, the
effect of IPO activity on pay-size elasticity should be greater in more poorly governed firms.
Alternatively, wages may be determined by a combination of competitive market forces and rent
extraction. Under this hypothesis, wages paid by well governed firms should respond more to
market pressures, leading to a larger effect of IPO activity on pay-size elasticity in well governed
firms. Using firm level governance data, I now seek empirical support regarding these two
hypotheses.

30
To examine the effects of governance, I use two measures of corporate governance. I begin
with the G Index of Gompers, Ishii, and Metrick (2003) which proxies for the level of shareholder
rights along 24 dimensions. In addition, I also consider the E Index set forth in Bebchuk, Cohen,
and Ferrell (2009), which consists of the six categories of the G Index found to be related to a
reduction in firm value.23
Table VITable V presents the results of OLS regressions when interacting the G Index and
E Index with the previously defined measure of the sensitivity of pay-size elasticity to IPO activity.
The inclusion of governance measures reduces the sample size for two reasons, both reduced
coverage in the number of firms relative to Execucomp and governance data that only runs through
2006. The first two specifications present results after standardizing G Index across all observations.
Lower values for the G Index indicate highly governed firms. In the first column, after controlling
for year and industry fixed effects, a one standard deviation increase in G Index decreases the effect
of IPO Activity on pay-size elasticity by 0.0030 (t-stat=-3.84), or 16.6% of its baseline value.
Furthermore, a one standard deviation increase in G Index is also associated with an increase in the
average level of logged CEO compensation of 0.046 (t-stat=5.98). After controlling for firm
performance in the second column, the interaction becomes stronger economically with a coefficient
of -0.0035 (t-stat=-3.99).
While industry fixed effects are included, these only control for differences in the level of
CEO compensation across industries, while I am interested in how the interaction of IPO Activity
and pay-size elasticity changes with firm governance. To the extent that governance is correlated
within industries, this clustering would not be controlled for with industry fixed effects. Therefore,
Columns 3 and 4 present the results after standardizing G Index within each industry. Thus, G Index
now represents the governance of a firm relative to its industry average. After controlling for
23 Specifically, the six categories are: staggered boards, limits to shareholder bylaw amendments, poison pills, golden parachutes, and supermajority requirements for mergers and charter amendments.

31
industry level governance, the results remain virtually unchanged with only fixed effect controls
(coefficient of -0.0034, t-stat=-4.17) and with firm performance controls (coefficient of -0.0036, t-
stat=-4.05). Additionally, when using E Index as a proxy for firm governance in the last four
specifications, the results are qualitatively and quantitatively similar both across all firms and within
industries and both with and without performance controls.
Table VITable V indicates that the effect an increase in the demand for CEO labor has on
pay-size elasticity is stronger in more strongly governed firms. This result is consistent with market
forces playing a role in the determination of CEO compensation, and inconsistent with
compensation being driven solely by the ability of a CEO to extract rents from shareholders. I now
seek additional validation that IPO activity within an industry is capturing the depletion of the
industry’s talent pool thereby raising the outside options of CEOs and increasing their market.
VI. Validation of IPO Waves as Increases in Demand for CEOs
The empirical analysis performed in the previous section rests on the effectiveness of IPO
waves as a proxy for times of increased demand for CEO labor relative to supply. If IPO activity
within an industry does represent a shock to the demand for CEO labor, this shock should affect
other decisions of a firm beyond CEO compensation. To this end, I turn my attention to a firm’s
choice of successor following the departure of its incumbent CEO.
While not explicitly modeled here, the intuition behind the effect of an IPO wave falls along
the same lines as the “talent pools” described in Cremers and Grinstein (2013). When a firm
experiences managerial turnover, it must select a new manager from one of three sources. The firm
can choose the successor from within the firm, from another firm within the industry, or they can
choose a manager with no prior industry experience. If the talent pool within an industry is

32
effectively drawn down during times of above average IPO activity, the likelihood of choosing an
incoming CEO from outside the industry should increase.
Each possible successor type has a potential benefit or drawback. For instance, a firm insider
may possess firm-specific knowledge that will improve their performance. Additionally, a firm may
have asymmetric information regarding the talent level of a potential inside successor relative to
other firms in the industry. Alternatively, potential mangers from inside the industry may have also
accumulated industry-specific human capital relative to industry outsiders. Furthermore, the number
of potential candidates within the industry is likely much larger than the pool of talent within the
firm. Finally, the number of potential candidates outside the industry is larger still, but may not
contain the necessary industry or firm-specific knowledge needed to be an effective CEO.
When evaluating the choice between choosing a firm insider and an industry insider, the firm
likely has superior knowledge regarding the firm insider while sharing a common knowledge of
industry insiders with all other firms, including those going public. This latter group can be viewed
as those individuals who have previously demonstrated their abilities. Therefore, newly public firms
are likely to be biased towards this pool of individuals in the industry with a prior track record,
thereby drawing down on this talent pool. This would lead to an increased probability of a firm
choosing its successor from inside the firm. Additionally, when considering the decision between a
firm insider and an industry outsider, while IPO activity within an industry would increase the
likelihood of a firm’s first choice within the company being poached by a firm that recently went
public, it should have a smaller effect on the pool of CEO talent from outside the industry. Thus,
the effect of IPO activity on talent pools should be largest for industry insiders and smallest for
industry outsiders, leading to a decreased likelihood of choosing an industry insider and an increased
likelihood of choosing a successor from outside the industry.

33
Panel A of Table VTable VI presents the results of a multinomial logit regression framework
used to test this hypothesis. Columns 1 and 2 report the relative risk ratios of a successor being an
industry insider or an industry outsider relative to the base case of being chosen from within the
firm. The ratio of 0.850 (z-stat=-2.14) in the first column indicates that a one-standard deviation
increase in IPO Activity is associated with a 15.0% decrease in the odds of choosing a successor from
within the industry over a firm insider. This likelihood also decreases with an increase in the former
CEO’s tenure, Ln(Tenure). The second column indicates that the likelihood of a firm choosing its
next CEO from outside the industry relative to a firm insider increases by 13.4% with a one
standard devation increase in IPO Activity, although the effect is only marginally statistically
significant with a z-statistic of 1.89. These results remain virtually unchanged after controlling for
firm performance (specification 2). To control for the possibility of market conditions driving the
results, I take two approaches. As a first step, I construct a measure of market IPO activity for an
industry in a similar fashion to IPO Activity. Specifically, Market IPO Activity equals the number of
IPOs in all other industries over the same period, scaled by the number of firms in all other
industries. The inclusion of this measure of overall IPO activity has no material effect on IPO
Activity. Alternatively, year fixed effects are included in Specification 4, leading to a loss of statistical
significance regarding IPO Activity. However, given the small number of successions chosen from
outside the industry, the inclusion of year fixed effects will reduce the power of the test if there is
any clustering of these choices by year.
However, while the previous analysis considers a menu of three possible, the choice of a
firm insider may also be influenced by other unobservable firm-specific factors. For example, the
commitment of some firms to a tournament structure similar to that of Lazear and Rosen (1981)
would lead to the hiring of an insider over either alternative source of CEO talent, increasing the
variance of the error term and reducing the power of the test. Therefore, Panel B of Table VTable

34
VI examines the choice of picking a successor from either inside the industry or outside the
industry, conditional on not being a firm insider. Column 1 reports odds ratios of a plain logit
regression where the base case is the successor coming from within the industry. The coefficient of
1.373 (z-stat=3.13) indicates that a one-standard deviation increase in IPO Activity increases the odds
of choosing the successor from outside the industry by 37.3%. This effect increases to 49.5% (z-
stat=3.02) after controlling for firm performance in Column 2. Following the addition of Market
IPO Activity in Column 3, the coefficient on IPO Activity both increases to 1.566 and becomes more
statistically significant with a z-statistic of 3.32. Similar to Panel A, IPO Activity becomes insignificant
following the inclusion of year fixed effects.
Overall, an increase in the number of firms going public leads to an increase in the likelihood
of an established firm choosing a new CEO from outside the industry relative to an industry insider,
consistent with increased IPO activity drawing down the industry’s talent pool of potential CEOs.
VII. Conclusion
There exists a long-standing debate over the source driving the level of CEO compensation
to new heights. There are those that argue that pay is driven by poor governance and rent extraction
of managers. A second view is that the pay is the equilibrium outcome of firms competing for scarce
managerial talent. This paper presents a motivating model based on this latter view to empirically
test a simple prediction that stems from such competition for able CEOs.
I examine the response of wages following an increase in the demand for managers who
possess the skills necessary to run a public company coupled with a relatively inelastic supply of such
individuals. I use the sudden influx of additional firms associated with industry-level IPO activity to
represent these times of increased CEO labor demand. Consistent with the predictions of simple
competitive equilibrium models of CEO compensation, I find that the elasticity of pay with respect

35
to firm value increases by 5.8% following a one-standard deviation increase in industry IPO activity
over the preceding three year period. Economically, this represents an average increase in pay of
6.3%, or $41,100 for the observations within my sample. This result is robust to my measure of
CEO pay, including total compensation, base salary plus bonus, or the CEO’s pay relative to the
other top executives within the firm.
In addition, I find that the effect of demand on pay elasticity is stronger in industries that are
harder to learn or require more industry-specific knowledge and industries which are more unique in
their operations. Specifically, I find the effect to be larger in industries that hire fewer CEOs from
outside the industry, industries with less overlap in sales from firms in other industries, and
industries whose returns are less correlated with other industries. Furthermore, I find the effect to
also be stronger in well-governed firms, suggesting that poorly-governed firms are more susceptible
to rent extraction while market forces are a stronger determinant of pay in firms with stronger
governance.
To disentangle the competitive equilibrium from competing hypotheses of efficiency wages
or rent extraction, I also examine the effects of IPO activity on executive transitions within an
industry, a prediction unique to the model presented in this paper. Using a competing-risks hazard
model, I find that executives are 19% more likely to transition between firms and 18% more likely to
take a position for higher pay with a one standard deviation increase in IPO activity.
Finally, I find empirical support for IPO activity within an industry representing times of a
reduced supply of talented managers available. Using logistic regressions, I find that a one-standard
deviation increase in IPO activity leads to a 34.9% increase in the odds of a firm choosing a
replacement CEO from outside the industry relative to choosing an individual from inside the
industry but outside the firm. This reduction in talent available within the industry is fully consistent
36
with IPO waves leading to more competition for top CEOs, thus bidding up wages in competitive
equilibrium.
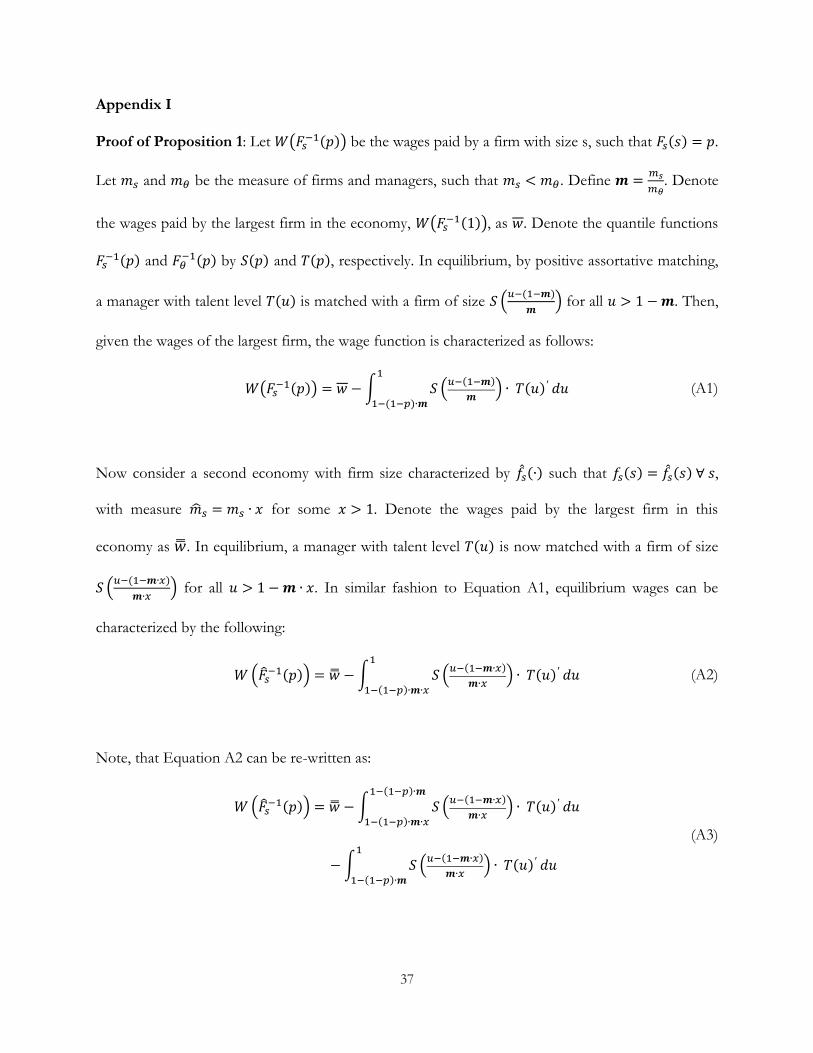
37
Appendix I
Proof of Proposition 1: Let be the wages paid by a firm with size s, such that .
Let and be the measure of firms and managers, such that . Define
. Denote
the wages paid by the largest firm in the economy, , as . Denote the quantile functions
and
by and , respectively. In equilibrium, by positive assortative matching,
a manager with talent level is matched with a firm of size
for all . Then,
given the wages of the largest firm, the wage function is characterized as follows:
(A1)
Now consider a second economy with firm size characterized by such that ,
with measure for some . Denote the wages paid by the largest firm in this
economy as . In equilibrium, a manager with talent level is now matched with a firm of size
for all . In similar fashion to Equation A1, equilibrium wages can be
characterized by the following:
(A2)
Note, that Equation A2 can be re-written as:
(A3)

38
Thus, by (A1) and (A3), the difference in equilibrium wages for a firm of in the pth percentile can be
written as follows:
(A4)
By rearranging terms:
(A4)
Note that for all the first integral is strictly positive, given . In addition, it
follows that:
Therefore,
for all
Thus,
Implying that the second integral is also strictly positive for all . Then for all
with finite upper support such that , if , then:

39
(A5)
Therefore:
Proof of Proposition 2: By assumption, the manager of the smallest firm earns their reservation
wage, . Therefore,
. By Proposition 1, equation (A5), we have that
for all with finite upper support such that and :
. Consider the case when
:
Thus, for all with finite upper support such that : If then
. Therefore:
Proof of Proposition 3: Denote the counter cumulative distributions of firm size and manager
talent as and , respectively. Define the quantile functions and
by and
, respectively. Thus, , . In order to ensure that talent is bounded, suppose that
there exists an such that , and . Let and be the measure of firms and
managers, such that . Define
. Then, by positive assortative matching, a firm of size

40
will now be matched with a manager of talent . By positive assortative matching, a
firm of size will be matched with a manager of talent . Following Gabaix and Landier
(2008), we have the following:
(A6)
Consider a second economy with firm sizes drawn from the distribution , such that
, with measure for some . Note that the counter cumulative distribution
and quantile functions are identical to . In equilibrium, a firm of size is now matched to a
manager with talent level . Furthermore, the derivative of wages is as follows:
(A7)
The elasticity of wages to firm size at the pth percentile is greater in the economy with a greater
measure of firms when the derivative in (A7) is larger than that of (A6). Rearranging terms yields:
(A8)
I now refer to the application of the extreme value theorem by Gabaix and Landier (2008), who
derive an approximation of , which holds exactly under certain assumptions. Given a tail index
of for the talent distribution :
(A9)
Substituting (A9) into (A8) and simplifying yields:
Equivalently,
(A10)
Given and , (A10) holds for all , for any region of the talent distribution where the
tail index is an exact characterization of the distribution: If and then

41

42
Appendix II
Prior performance and differences in firm characteristics are controlled for using standard
accounting information obtained from Compustat. Both the firm value in excess of the industry
median (Fama French 48) and median industry value are included.
Variable Description
OROA Ratio of net income (NI) to the book value of assets (AT).
OROS Ratio of net income (NI) to sales (SALE).
ROE Ratio of net income (NI) to the book value of common equity (CEQ).
Capex Ratio of capital expenditures (CAPX) to the book value of assets (AT).
Leverage Ratio of long term debt (DLTT) plus debt in current liabilities (LCT) to the book value of assets (AT).
Cash Ratio of cash holdings (CH) to the book value of assets (AT).
Dividend Ratio of dividends paid out (DVT) to the book value of assets (AT).
R&D Ratio of research and development expenditures (XRD) to the book value of assets (AT).
Cash Flow Ratio of earnings before extraordinary items (IB) plus depreciation expenses (DPC) to the book value of assets (AT).
Stock Return Natural log of annual return on equity (fiscal year-end).

43
References Abowd J.M., and D.S. Kaplan. 1999. Executive Compensation: Six Questions that Need Answering. Journal of Economic Perspectives 13, 145–68 Adams, R., H. Almeida and D. Ferreira. 2005. Powerful CEOs and Their Impact on Corporate Performance. Review of Financial Studies 18, 1403–32. Aggarwal R.K. 2008. Executive Compensation and Incentives. Handbook of Corporate Finance: Empirical Corporate Finance, 497–538. Bennedsen M., F. Perez-Gonzales, and D. Wolfenzon. 2012. Estimating the Value of the Boss: Evidence from CEO Hospitalization Events. Working Paper, Stanford University. Bertrand M. 2009. CEOs. Annual Review of Economics 1, 121–49. Bertrand M, and S. Mullainathan. 2001. Are CEOs Rewarded for Luck? The Ones Without Principals Are. Quarterly Journal of Economics 116, 901–32 Bertrand, M. and A. Schoar. 2003. Managing with Style: The Effect of Managers on Firm Policies. Quarterly Journal of Economics 118, 1169–208. Bebchuk L.A., A. Cohen, and A Ferrell. 2009. What Matters in Corporate Governance? Review of Financial Studies 22, 783–827. Bebchuk L.A., M. Cremers, and U.C. Peyer. 2011. The CEO Pay Slice. Journal of Financial Economics 102, 199–221. Bebchuk L.A., and J.M. Fried. 2003. Executive Compensation as an Agency Problem. Working Paper, National Bureau of Economic Research ———. 2004. Pay without Performance: The Unfulfilled Promise of Executive Compensation. Harvard University Press. Carter M.E., F. Franco, and I. Tuna. 2010. Premium Pay for Executive Talent: An Empirical Analysis. Working Paper, Boston College. Core J.E., R.W. Holthausen, and D.F. Larcker. 1999. Corporate Governance, CEO Compensation, and Firm Performance. Journal of Financial Economics 51, 371–406. Core, J.E., W. Guay, and D.F. Larker. 2003. Executive Equity Compensation and Incentives: A Survey. Federal Reserve Bank New York Economic Policy Review 9, 27–50. Crawford, A.J., J.R. Ezell, and J.R. Miles. 1995. Bank CEO Pay-Performance Relations and the Effects of Deregulation. The Journal of Business 68, 231–56. Cremers, M. and Y. Grinstein. 2013. Does the Market for CEO Talent Explain Controversial CEO Pay Practices? Review of Finance, forthcoming.
Cuñat V, and M. Guadalupe. 2009a. Executive Compensation and Competition in the Banking and Financial Sectors. Journal of Banking Finance 33, 495–504

44
———. 2009b. Globalization and the Provision of Incentives Inside the Firm: The Effect of Foreign Competition. Journal of Labor Economics 27, 179–212. Edmans A, and X. Gabaix. 2009. Is CEO Pay Really Inefficient? A Survey of New Optimal Contracting Theories. European Financial Management 15, 486–96. Eisfeldt, A., and C. Kuhnen. 2013. CEO Turnover in a Competitive Assignment Framework. Journal of Financial Economics 109, 351–72. Falito A., D. Li, and T.T. Milbourn. 2013. Which Skills Matter in the Market for CEOs? Evidence from Pay for CEO Credentials. Working Paper, University of Washington in St. Louis. Fine, J.P., and R.J. Gray. 1999. A Proportional Hazards Model for the Subdistribution of a Competing Risk. Journal of the American Statistical Association 94, 496–509. Fama, E.F., and K. R. French. 1997. Industry Costs of Equity. Journal of Financial Economics 43, 153–93. Frydman, C., and D. Jenter. 2010. CEO Compensation. Annual Review of Financial Economics 2, 75–102. Gabaix X, D. Laibson, and H. Li. 2005. Extreme Value Theory and the Effects of Competition on Profits. Working Paper, New York University. Gabaix X, and A. Landier. 2008. Why has CEO Pay Increased so Much? Quarterly Journal of Economics 123, 49–100 Garvey G.T., and T.T. Milbourn. 2006. Asymmetric Benchmarking in Compensation: Executives are Rewarded for Good Luck but not Penalized for Bad. Journal of Financial Economics 82, 197–225. Gibbons R., and K.J. Murphy. 1990. Relative Performance Evaluation for Chief Executive Officers. Industrial and Labor Relations Review 43, 30S–51S. Gillan, L., J. Hartzell, A. Koch, and L. Starks. 2013. Getting the Incentives Right: Backfilling and Biases in Executive Compensation Data. Working Paper, The University of Texas. Gompers, P., J. Ishii, and A. Metrick. 2003. Corporate Governance and Equity Prices. Quarterly Journal of Economics 118, 107–56. Graham, J.R., S. Li, and J. Qiu. 2012. Managerial Attributes and Executive Compensation. Review of Financial Studies 25, 144–86. Hubbard R.G., and D. Palia. 1995. Executive Pay and Performance: Evidence from the US Banking Industry. Journal of Financial Economics 39, 105–30. Jensen, M., K.J. Murphy and E. Wruck. 2004. Remuneration: Where We’ve Been, How We Got to Here, What Are the Problems, and How to Fix Them. mimeo, Harvard University. Kaplan, S.N., M.M. Klebanov and M. Sorensen. 2012. Which CEO Characteristics and Abilities Matter? Journal of Finance 67, 973–1007. Kuhnen C.M., and J. Zwiebel. 2009. Executive Pay, Hidden Compensation and Managerial Entrenchment. Working Paper, Northwestern University.

45
Lasear, E.P., and P Oyer. 2004. Internal and External Labor Markets: A Personnel Economics Approach. Labour Economics 11, 527–54. Luttmer, E. 2007. Selection, Growth, and the Size Distribution of Firms. Quarterly Journal of Economics 122, 1103–44. Murphy K.J. 1999. Executive compensation. Handbook of Labor Economics Vol. 3B, 2485–563. Murphy K.J., and J. Zábojník. 2004. CEO Pay and Appointments: a Market-based Explanation for Recent Trends. American Economic Review 94, 192–96 ———. 2007. Managerial Capital and the Market for CEOs. Working Paper, University of Southern California. Parrino, R. 1997. CEO Turnover and Outside Succession: A Cross-Sectional Analysis. Journal of Financial Economics 46, 165–97. Rosen S. 1982. Authority, Control, and the Distribution of Earnings. The Bell Journal of Economics 13, 311–23. ———. 1992. Contracts and the Market for Executives. Contract Economics. Sattinger, M. 1993. Assignment Models of the Distribution of Earnings. Journal of Economic Literature 31 831–80. Terviö M. 2008. The Difference that CEOs Make: An Assignment Model Approach. American Economic Review 98, 642–68.

46
Panel A
Pay-Size Response
Figure 1
Wage Response to Increased Demand
This figure illustrates the change in CEO compensation in competitive equilibrium (Panel A) and the
elasticity of CEO pay to firm size for multiple distributions of talent (Panel B) following an increase in the
number of firms. Increased Demand represents the entrance of 20% more firms into the economy. Pay-Size
Elasticity is the point estimate of OLS regressions of log CEO pay on log firm size and a constant.
12.5
13.0
13.5
14.0
14.5
15.0
14 16 18 20 22
Log
CE
O C
om
pen
sati
on
Log Firm Size
Normal Distribution
12.5
13.0
13.5
14.0
14.5
15.0
14 16 18 20 22
Log
CE
O C
om
pen
sati
on
Log Firm Size
Beta Distribution
12.5
13.0
13.5
14.0
14.5
15.0
14 15 16 17 18 19 20 21 22
Log
CE
O C
om
pen
sati
on
Log Firm Size
Normal Demand Increased Demand

47
Panel B
OLS Point Estimates
0.40
0.41
0.42
0.43
0.44
0.45
0.46
Beta Chi-Squared Exponential Gamma Log-Normal Normal Uniform Weibull
Pay-S
ize E
last
icit
y
Talent Distribution
Normal Demand
Increased Demand

48
Figure 2
Yearly IPO Activity by Fama-French 48 Industry
This figure graphs the yearly number of IPOs per industry scaled by the industries average size across the
entire sample period. Only the top 2000 firms, ranked by total firm value, are considered in the sample.

49
Figure 3
CEO Compensation and IPO Activity by Size Decile
This figure graphs the average level of the log of total CEO compensation by size. Size deciles are computed
within each industry-year and lagged by one year. High IPO represent years in the top tercile of an industry’s
IPO Activity. Low IPO represent years in the bottom tercile of an industry’s IPO Activity. Shaded areas
represent the 95% confidence interval of the difference between the High IPO and Low IPO groups. IPO
Activity is the 3-year moving average within the industry. Included are controls for excess firm performance
outlined in Appendix II, industry fixed effects, and year fixed effects. Only CEOs tenures which began while
their firm ranked in the top 2000 firms, with respect to total firm value, are considered in the sample. All
firms within two years of their initial public offering are excluded.
5.5
5.7
5.9
6.1
6.3
6.5
6.7
6.9
7.1
7.3
7.5
0 2 4 6 8 10
Lo
g C
EO
Co
mp
en
sati
on
Industry Size Decile
High IPO
Low IPO

50
Table I CEO Pay-Size Elasticity and Increased Labor Demand
Ln(Total Compensation)
Cash Pay
(1) (2) (3) (4)
(5)
Ln(Market Value) 0.429 0.427 0.427 0.427
0.264 (56.81) (58.95) (58.95) (58.95) (44.01)
Ln(Market Value) x IPO Activity 0.0271 0.0232 0.0212 0.0251
0.0129 (3.98) (3.43) (3.98) (3.18) (2.03)
IPO Activity -0.198 -0.161 -0.149 -0.178
-0.0910 (-3.40) (-2.77) (-3.25) (-2.66) (-1.68)
Excess Return
0.078 0.078 0.075
0.029 (5.57) (5.69) (5.44) (3.18)
Median Return
0.052 0.053 0.054
0.041 (3.07) (3.16) (3.38) (3.34)
Excess OROS
0.385 0.406 0.370
0.003 (1.86) (1.92) (1.72) (0.03)
Median OROS
-0.042 -0.035 -0.039
-0.068 (-1.54) (-1.29) (-1.48) (-2.58)
Ln(Tenure)
0.043 0.044 0.043
0.084 (4.30) (4.37) (4.36) (10.60)
Intercept 3.810 4.539 3.571 5.260
4.804 (40.14) (30.19) (12.38) (15.93) (20.76)
Year FE Yes Yes Yes Yes
Yes
Industry FE Yes Yes Yes Yes
Yes
Performance Controls No Yes Yes Yes
Yes
Industry Level Elasticity No No Yes No
No
Year Level Elasticity No No No Yes Yes
N 19710 18372 18372 18372
18368
Adj. R-sq 0.420 0.427 0.433 0.429 0.359
Average Pay Change ($, thousands) 407.3 404.6 358.6 412.1
211.5
p-value 0.0003 0.0001 <0.0001 0.0002 0.0243
This table reports the results of OLS regressions. The dependent variable is denoted in the column header.
Ln(Market Value) is the natural log of market value of assets. Ln(Market Value) x IPO Activity is the interaction
of log market value and the three year trailing industry average number of IPOs, standardized by industry.
Excess OROS is industry-adjusted operating return over sales. Excess Return is the industry-adjusted log return
on equity. Ln(Tenure) is the natural log of a CEO’s tenure within her current spell. Performance Controls indicates
the inclusion of other firm performance related variables, detailed in Appendix II. Industry Level Elasticity
indicates an interaction between Ln(Market Value) and a full set of industry dummy variables. Year Level
Elasticity indicates an interaction between Ln(Market Value) and a full set of year dummy variables. Average Pay
Change is the mean change in compensation for a one standard deviation change in IPO Activity for a firm in
the sample. p-value reports the p-value of the test of zero change in pay, evaluated at the mean firm market
value in the sample. Firms are classified into Fama French 48 industries. Reported are t-statistics in
parentheses, clustered at the industry-year level.
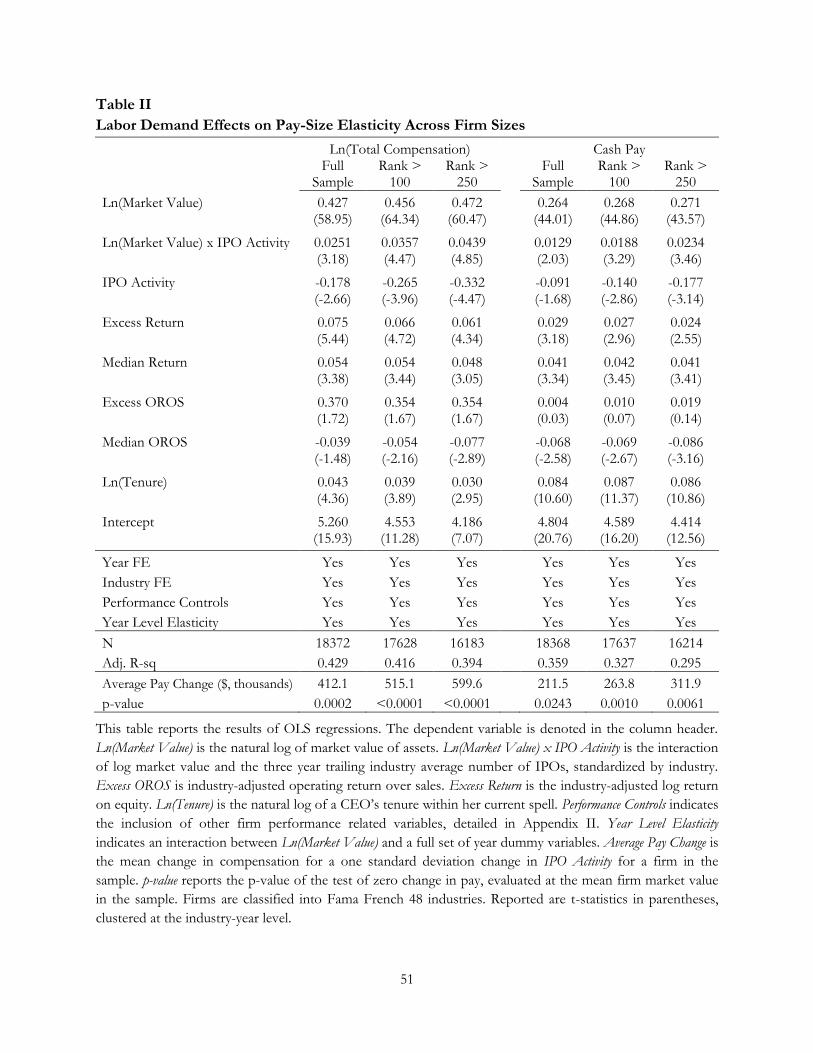
51
Table II
Labor Demand Effects on Pay-Size Elasticity Across Firm Sizes
Ln(Total Compensation)
Cash Pay
Full Sample
Rank > 100
Rank > 250
Full Sample
Rank > 100
Rank > 250
Ln(Market Value) 0.427 0.456 0.472
0.264 0.268 0.271 (58.95) (64.34) (60.47) (44.01) (44.86) (43.57)
Ln(Market Value) x IPO Activity 0.0251 0.0357 0.0439
0.0129 0.0188 0.0234 (3.18) (4.47) (4.85) (2.03) (3.29) (3.46)
IPO Activity -0.178 -0.265 -0.332
-0.091 -0.140 -0.177 (-2.66) (-3.96) (-4.47) (-1.68) (-2.86) (-3.14)
Excess Return 0.075 0.066 0.061
0.029 0.027 0.024 (5.44) (4.72) (4.34) (3.18) (2.96) (2.55)
Median Return 0.054 0.054 0.048
0.041 0.042 0.041 (3.38) (3.44) (3.05) (3.34) (3.45) (3.41)
Excess OROS 0.370 0.354 0.354
0.004 0.010 0.019 (1.72) (1.67) (1.67) (0.03) (0.07) (0.14)
Median OROS -0.039 -0.054 -0.077
-0.068 -0.069 -0.086 (-1.48) (-2.16) (-2.89) (-2.58) (-2.67) (-3.16)
Ln(Tenure) 0.043 0.039 0.030
0.084 0.087 0.086 (4.36) (3.89) (2.95) (10.60) (11.37) (10.86)
Intercept 5.260 4.553 4.186
4.804 4.589 4.414 (15.93) (11.28) (7.07) (20.76) (16.20) (12.56)
Year FE Yes Yes Yes
Yes Yes Yes
Industry FE Yes Yes Yes
Yes Yes Yes
Performance Controls Yes Yes Yes
Yes Yes Yes
Year Level Elasticity Yes Yes Yes Yes Yes Yes
N 18372 17628 16183
18368 17637 16214
Adj. R-sq 0.429 0.416 0.394 0.359 0.327 0.295
Average Pay Change ($, thousands) 412.1 515.1 599.6
211.5 263.8 311.9
p-value 0.0002 <0.0001 <0.0001 0.0243 0.0010 0.0061
This table reports the results of OLS regressions. The dependent variable is denoted in the column header.
Ln(Market Value) is the natural log of market value of assets. Ln(Market Value) x IPO Activity is the interaction
of log market value and the three year trailing industry average number of IPOs, standardized by industry.
Excess OROS is industry-adjusted operating return over sales. Excess Return is the industry-adjusted log return
on equity. Ln(Tenure) is the natural log of a CEO’s tenure within her current spell. Performance Controls indicates
the inclusion of other firm performance related variables, detailed in Appendix II. Year Level Elasticity
indicates an interaction between Ln(Market Value) and a full set of year dummy variables. Average Pay Change is
the mean change in compensation for a one standard deviation change in IPO Activity for a firm in the
sample. p-value reports the p-value of the test of zero change in pay, evaluated at the mean firm market value
in the sample. Firms are classified into Fama French 48 industries. Reported are t-statistics in parentheses,
clustered at the industry-year level.

52
Table III Within-Industry Executive Transitions
All Transitions
Upward Transition
(1) (2) (3)
(4) (5) (6)
IPO Activity 1.179 1.169 1.190
1.155 1.162 1.180 (4.12) (3.15) (3.41) (3.05) (2.54) (2.74)
Ln(Market Value)
1.150
1.129 (4.31) (3.18)
Excess Return
1.037 1.038
0.985 0.986 (0.66) (0.68) (-0.26) (-0.24)
Median Return
1.120 1.117
1.085 1.083 (2.81) (2.78) (1.84) (1.82)
Performance Controls No Yes Yes
No Yes Yes
Number Transitions 523 500 523
386 370 370
Time at Risk 132,927 121,486 132,927
132,927 121,486 121,486
Wald Chi-Sq 16.99 97.03 16.99
9.321 62.62 70.62
P-value < 0.0001 < 0.0001 < 0.0001
0.0022 < 0.0001 < 0.0001
This table reports the results of competing risk hazard models. The failure event is denoted in the column
headers. All Transitions includes all executives who leave a firm within the sample and appear in the top five
executives of another firm within the industry within two years. Upward Transition requires the executive’s total
compensation to increase following the transition. The competing risks are defined as: a transition to a
different industry, the firm’s exit from Execucomp, and for Upward Transition a decrease in total
compensation. IPO Activity is the three year trailing industry average number of IPOs, standardized by
industry. Ln(Market Value) is the natural log of market value of assets. Excess Return is the industry-adjusted
log return on equity. Excess OROS is industry-adjusted operating return over sales. Performance Controls
indicates the inclusion of other firm performance related controls, detailed in Appendix II. Firms are
classified into Fama French 48 industries. Reported are sub-hazard ratios with z-statistics in parentheses,
clustered at the industry-year level.

53
Table IV Magnitude of Demand Effect on Pay-Size Elasticity across Industries
Ln(Total Compensation)
(1) (2)
(3) (4)
(5) (6)
(7) (8)
Ln(Size) 0.401 0.345
0.401 0.347
0.394 0.343
0.396 0.343
(7.29) (10.14) (7.51) (10.19) (7.65) (9.98) (7.39) (10.00)
Ln(Size) x IPO Activity 0.0134 0.0176
0.0159 0.0184
0.0163 0.0183
0.0129 0.0163
(1.72) (2.33) (2.03) (2.41) (2.10) (2.41) (1.68) (2.16)
x % Outside Hires -0.0040 -0.0036
-0.0036 -0.0031
(-3.97) (-3.56) (-3.57) (-2.94)
x % Segment Overlap
-0.0034 -0.0044
-0.0016 -0.0032
(-2.27) (-2.92) (-1.07) (-2.11)
x Ind. Comovement
-0.0066 -0.0057
-0.0056 -0.0038
(-3.25) (-3.09) (-2.86) (-1.96)
IPO Activity -0.0932 -0.124
-0.114 -0.132
-0.0942 -0.108
-0.0706 -0.101 (-1.41) (-1.91) (-1.71) (-2.03) (-1.43) (-1.64) (-1.07) (-1.55)
Intercept 4.298 3.949
4.392 3.943
4.441 3.955
4.520 4.119 (25.61) (19.59) (24.76) (19.62) (24.86) (19.78) (25.12) (19.17)
Year FE Yes Yes
Yes Yes
Yes Yes
Yes Yes
Industry FE Yes Yes
Yes Yes
Yes Yes
Yes Yes
Performance Controls No Yes
No Yes
No Yes
No Yes
Year Level Elasticity Yes Yes Yes Yes
Yes Yes Yes Yes
N 19776 18438
19803 18465
19803 18465
19776 18438
Adj. R-sq 0.420 0.429 0.419 0.428
0.420 0.428 0.421 0.429
This table reports the results of OLS regressions. The dependent variable is the natural log of total CEO
compensation. Ln(Size) is the natural log of market value of assets. Ln(Size) x IPO Activity is the interaction of
log market value and the three year trailing industry average number of IPOs, standardized by industry. x %
Outside Hires is the interaction of Ln(Size) x IPO Activity and the percentage of an industry’s CEOs hired
from outside the industry. x % Segment Overlap is the interaction of Ln(Size) x IPO Activity and the average
percentage of sales a firm from a different industry has in the industry considered. x Ind. Comovement is the
interaction of Ln(Size) x IPO Activity and the average correlation between the industry’s returns and all other
industries. Performance Controls indicates the inclusion of other firm performance related controls, detailed in
Appendix II. Year Level Elasticity indicates an interaction between Ln(Size) and a full set of year dummy
variables. Firms are classified into Fama French 48 industries. Reported are t-statistics in parentheses,
clustered at the industry-year level.

54
Table V Demand Sensitivity of Pay-Size Elasticity and Firm Governance
G-Index
E-Index
Across Industries Within Industry
Across Industries Within Industry
Ln(Size) 0.418 0.375 0.418 0.375
0.419 0.369 0.418 0.367 (7.10) (7.19) (7.09) (7.17) (6.40) (6.89) (6.38) (6.84)
IPO Activity -0.115 -0.135 -0.112 -0.134
-0.110 -0.126 -0.106 -0.129 (-1.38) (-1.54) (-1.35) (-1.53) (-1.28) (-1.41) (-1.27) (-1.46)
Ln(Size) x IPO Activity 0.0181 0.0188 0.0177 0.0185
0.0175 0.0177 0.0170 0.0179 (1.86) (1.83) (1.83) (1.81) (1.75) (1.70) (1.72) (1.74)
x Governance -0.0030 -0.0035 -0.0034 -0.0036
-0.0028 -0.0036 -0.0031 -0.0035 (-3.84) (-3.99) (-4.17) (-4.05) (-2.97) (-3.48) (-3.44) (-3.51)
Governance 0.046 0.050 0.041 0.045
0.073 0.079 0.071 0.077 (5.98) (6.18) (5.53) (5.68) (8.52) (8.79) (8.93) (9.07)
Excess Return
0.090
0.091
0.088
0.088 (4.73) (4.75) (4.34) (4.36)
Median Return
0.047
0.047
0.055
0.055 (2.70) (2.74) (2.98) (2.98)
Excess OROS
0.134
0.134
0.170
0.170 (1.88) (1.85) (2.22) (2.20)
Median OROS
-0.016
-0.014
-0.005
-0.001 (-0.47) (-0.40) (-0.15) (-0.03)
Ln(Tenure)
0.047
0.047
0.053
0.053 (3.97) (3.97) (4.37) (4.37)
Intercept 3.930 5.061 3.937 5.068
3.983 5.182 3.990 5.187 (7.33) (9.37) (7.34) (9.37) (6.75) (9.43) (6.76) (9.41)
Year FE Yes Yes Yes Yes
Yes Yes Yes Yes
Industry FE Yes Yes Yes Yes
Yes Yes Yes Yes
Performance Controls No Yes No Yes
No Yes No Yes
Year Level Elasticity Yes Yes Yes Yes Yes Yes Yes Yes
N 11568 10921 11568 10921
10611 9989 10611 9989
Adj. R-sq 0.404 0.413 0.404 0.413 0.418 0.427 0.418 0.427
This table reports the results of OLS regressions. The dependent variable is the natural log of total CEO
compensation. The column header indicates the governance variable being considered, either standardized
across the pooled sample (Across Industries) or within each industry (Within Industry). Ln(Size) is the natural log
of market value of assets. Ln(Size) x IPO Activity is the interaction of log market value and the three year
trailing industry average number of IPOs, standardized by industry. x Governance is the interaction of Ln(Size)
x IPO Activity and the governance variable indicated in the column header. Governance is the governance
variable indicated in the header. Performance Controls indicates the inclusion of other firm performance related
controls, detailed in Appendix II. Year Level Elasticity indicates an interaction between Ln(Size) and a full set of
year dummy variables. Firms are classified into Fama French 48 industries. Reported are t-statistics in
parentheses, clustered at the industry-year level.

55
Table VI
Successor Choice and Talent Pool Depth
Panel A: Multinomial Logit, Base Case = Firm Insider
(1)
(2)
(3) (4)
Successor Industry: Inside Outside
Inside Outside
Inside Outside Inside Outside
IPO Activity 0.850 1.134
0.817 1.155
0.795 1.151 0.923 1.061
(-2.14) (1.89) (-2.34) (1.79) (-2.65) (1.75) (-0.82) (0.52)
Ln(Market Value) 0.969 0.916
0.942 0.967
0.995 0.956 0.910 0.968
(-0.60) (-1.61) (-1.02) (-0.55) (-0.09) (-0.68) (-1.52) (-0.51)
Ln(Tenure) 0.772 0.699
0.838 0.705
0.821 0.708 0.731 0.746
(-2.82) (-3.91) (-1.74) (-3.63) (-1.93) (-3.55) (-2.71) (-2.63)
Excess Return
0.633 0.834
0.637 0.835 0.814 0.814
(-3.28) (-1.14) (-3.28) (-1.13) (-1.17) (-1.17)
Median Return
0.938 1.018
0.942 1.020 0.883 0.883
(-0.78) (0.23) (-0.74) (0.25) (-0.92) (-0.92)
Market IPO Activity
0.843 1.010
(-3.13) (0.41)
Year FE No
No
No Yes
Performance Controls No Yes Yes Yes
N 1846
1738
1737 1738
Pseudo R-Sq 0.013 0.064 0.068 0.090

56
Table VI
Continued
Panel B: Plain Logit, Base Case = Industry Insider
(1) (2) (3) (4)
Successor Industry: Outside Outside Outside Outside
IPO Activity 1.373 1.495 1.566 1.205
(3.13) (3.02) (3.32) (1.06)
Ln(Market Value) 0.939 1.011 0.921 1.133
(-0.87) (0.13) (-0.87) (1.18)
Ln(Tenure) 0.859 0.780 0.787 0.934
(-1.18) (-1.66) (-1.56) (-0.36)
Excess Return
1.217 1.215 1.201
(1.69) (1.69) (1.51)
Median Return
1.110 1.094 1.037
(0.92) (0.79) (0.18)
Market IPO Activity
1.264
(3.13)
Year FE No No No Yes
Performance Controls No Yes Yes Yes
N 476 451 451 451
Pseudo R-sq 0.019 0.163 0.180 0.246
This table shows multinomial logistic results with a base case of hiring a firm insider (Panel A) and a plain
logit ordered with a base case of hiring from within the industry (Panel B). The alternative choice is denoted
in the second column header. IPO Activity is the three year trailing industry average number of IPOs,
standardized by industry. Ln(Market Value) is the natural log of market value of assets. Ln(Tenure) is the
natural log of a CEO’s tenure within her current spell. Excess Return is the industry-adjusted year-end log
return. Excess OROA is industry-adjusted operating return over book value of assets. Market IPO is the three
year trailing average total number of IPOs excluding the firm’s industry. Performance Controls indicates the
inclusion of other firm performance related controls, detailed in Appendix II. Reported are relative risk ratios
(Panel A) and odds ratios (Panel B) with White (1980) heteroskedasticity-adjusted z-statistics in parentheses.

57
Table IA I CEO Pay-Size Elasticity and Increased Labor Demand Panel A: IPOs Scaled by Full Sample Industry Average
Ln(Total Compensation)
Cash Pay
(1) (2) (3) (4)
(5)
Ln(Market Value) 0.473 0.425 0.425 0.425
0.262 (62.64) (58.68) (58.68) (58.68) (42.98)
Ln(Market Value) x IPO Activity 0.0292 0.0205 0.0192 0.0195
0.0163 (3.66) (3.01) (3.64) (2.55) (3.04)
IPO Activity -0.286 -0.146 -0.139 -0.138
-0.131 (-4.14) (-2.48) (-3.08) (-2.12) (-2.89)
Excess Return
0.0819 0.0826 0.0789
0.0313 (5.87) (5.98) (5.72) (3.42)
Median Return
0.0546 0.0547 0.0558
0.0408 (3.19) (3.27) (3.50) (3.36)
Excess OROS
0.386 0.405 0.373
-0.00346 (1.87) (1.92) (1.75) (-0.02)
Median OROS
-0.0377 -0.0307 -0.0344
-0.0630 (-1.37) (-1.13) (-1.31) (-2.39)
Ln(Tenure)
0.0405 0.0416 0.0406
0.0822 (4.05) (4.17) (4.10) (10.42)
Intercept 3.750 4.073 2.055 4.761
4.621 (16.08) (17.00) (1.56) (12.56) (17.95)
Year FE No Yes Yes Yes
Yes
Industry FE Yes Yes Yes Yes
Yes
Performance Controls No Yes Yes Yes
Yes
Industry Level Elasticity No No Yes No
No
Year Level Elasticity No No No Yes Yes
N 19803 18465 18465 18465
18462
Adj. R-sq 0.367 0.426 0.431 0.428 0.358

58
Table IA I Continued Panel B: Total Assets
Ln(Total Compensation)
Cash Pay
(1) (2) (3) (4)
(5)
Ln(Total Assets) 0.461 0.417 0.417 0.417
0.269 (55.29) (54.94) (54.94) (54.94) (45.57)
Ln(Total Assets) x IPO Activity 0.0359 0.0206 0.0184 0.0200
0.0146 (4.24) (3.01) (3.33) (2.52) (2.59)
IPO Activity -0.315 -0.121 -0.106 -0.117
-0.0944 (-4.57) (-2.14) (-2.33) (-1.81) (-2.04)
Excess Return
0.139 0.140 0.137
0.0746 (9.36) (9.47) (9.23) (8.42)
Median Return
0.0956 0.0977 0.0986
0.0761 (5.47) (5.54) (5.88) (6.43)
Excess OROS
0.354 0.387 0.335
-0.0271 (1.68) (1.77) (1.51) (-0.19)
Median OROS
-0.0549 -0.0526 -0.0581
-0.0696 (-1.80) (-1.75) (-1.98) (-3.16)
Ln(Tenure)
0.0642 0.0632 0.0646
0.0912 (6.62) (6.64) (6.67) (11.72)
Intercept 4.495 4.554 3.796 5.539
4.794 (48.14) (16.45) (10.53) (14.48) (19.88)
Year FE No Yes Yes Yes
Yes
Industry FE Yes Yes Yes Yes
Yes
Performance Controls No Yes Yes Yes
Yes
Industry Level Elasticity No No Yes No
No
Year Level Elasticity No No No Yes Yes
N 18853 17528 17528 17528
17523
Adj. R-sq 0.368 0.447 0.454 0.449 0.371

59
Table IA I Continued Panel C: Sales
Ln(Total Compensation)
Cash Pay
(1) (2) (3) (4)
(5)
Ln(Sales) 0.473 0.432 0.432 0.432
0.274 (60.04) (64.64) (64.64) (64.64) (49.26)
Ln(Sales) x IPO Activity 0.0174 0.0131 0.0136 0.0134
0.00841 (2.41) (2.21) (2.64) (2.42) (1.63)
IPO Activity -0.190 -0.0689 -0.0745 -0.00393
-0.0513 (-3.36) (-1.47) (-1.84) (-0.06) (-1.26)
Excess Return
0.140 0.140 0.140
0.0823 (10.40) (10.56) (10.41) (9.58)
Median Return
0.0905 0.0916 0.0896
0.0702 (5.96) (6.01) (5.96) (7.19)
Excess OROS
31.85 30.22 31.85
10.37 (5.23) (5.11) (5.23) (1.82)
Median OROS
-0.0475 -0.0489 -0.0376
-0.0525 (-1.64) (-1.72) (-1.30) (-2.71)
Ln(Tenure)
0.0447 0.0464 0.0465
0.0829 (4.74) (4.88) (4.95) (11.73)
Intercept 4.199 3.380 2.004 4.361
4.333 (43.10) (16.08) (6.18) (11.93) (19.01)
Year FE No Yes Yes Yes
Yes
Industry FE Yes Yes Yes Yes
Yes
Performance Controls No Yes Yes Yes
Yes
Industry Level Elasticity No No Yes No
No
Year Level Elasticity No No No Yes Yes
N 21370 20290 20290 20290
20321
Adj. R-sq 0.355 0.435 0.442 0.436 0.375
This table reports the results of OLS regressions analogous to Table II with the following exceptions. Panel A
scales IPO activity by the full sample average industry size. Panel B substitutes the natural log of total assets
for the natural log of market value. Panel C substitutes the natural log of sales for the natural log of market
value. Performance Controls indicates the inclusion of other firm performance related variables, detailed in
Appendix II. Industry Level Elasticity indicates an interaction between Ln(Size) and a full set of industry dummy
variables. Year Level Elasticity indicates an interaction between Ln(Size) and a full set of year dummy variables.
Firms are classified into Fama French 48 industries. Reported are t-statistics in parentheses, clustered at the
industry-year level.

60
Table IA II Panel A: Firm Enters After 1993
All Transitions
Upward Transition
(1) (2) (3)
(4) (5) (6)
IPO Activity 1.214 1.316 1.355
1.131 1.283 1.314 (2.28) (2.46) (2.67) (1.14) (1.82) (1.98)
Ln(Market Value)
1.256
1.214 (2.73) (2.03)
Excess Return
1.159 1.258
1.032 1.109 (0.23) (0.35) (0.04) (0.13)
Median Return
1.027 1.025
1.021 1.020 (0.38) (0.36) (0.25) (0.25)
Performance Controls No Yes Yes
No Yes Yes
Number Transitions 136 124 124
97 89 89
Competing Events 1784 1567 1567
1823 1602 1602
Time at Risk 39,190 34,610 34,610
39,190 34,610 34,610
Wald Chi-Sq 5.193 77.07 81.70
1.301 47.73 51.83
P-value 0.0227 < 0.0001 < 0.0001
0.254 0.0007 0.0003

61
Table IA II Panel B: Spell Enters After 1993
All Transitions
Upward Transition
(1) (2) (3)
(4) (5) (6)
IPO Activity 1.279 1.330 1.361
1.228 1.311 1.341 (5.29) (4.62) (4.85) (3.64) (3.55) (3.75)
Ln(Market Value)
1.198
1.187 (4.76) (3.76)
Excess Return
1.056 1.058
1.000 1.001 (0.95) (0.98) (0.00) (0.02)
Median Return
1.126 1.121
1.079 1.075 (2.69) (2.61) (1.56) (1.49)
Performance Controls No Yes Yes
No Yes Yes
Number Transitions 383 366 366
270 258 258
Competing Events 3987 3638 3638
4100 3746 3746
Time at Risk 89,228 82,533 82,533
89,228 82,533 82,533
Wald Chi-Sq 27.95 89.16 110.3
13.24 53.30 67.82
P-value < 0.0001 < 0.0001 < 0.0001
0.0002 0.0001 < 0.0001
This table reports the results of competing risk hazard models. The failure event is denoted in the column
headers. All Transitions includes all executives who leave a firm within the sample and appear in the top five
executives of another firm within the industry within two years. Upward Transition requires the executive’s total
compensation to increase following the transition. The competing risks are defined as: a transition to a
different industry, the firm’s exit from Execucomp, or for Upward Transition a decrease in total compensation.
IPO Activity is the three year trailing industry average number of IPOs, standardized by industry. Ln(Market
Value) is the natural log of market value of assets. Excess Return is the industry-adjusted log return on equity.
Excess CAPEX is industry-adjusted capital expenditures over total assets. Performance Controls indicates the
inclusion of other firm performance related controls, detailed in Appendix II. Firms are classified into Fama
French 48 industries. Reported are sub-hazard ratios with z-statistics in parentheses, clustered at the industry-
year level. Only firms first observed after 1993 (Panel A) and spells beginning after 1993 (Panel B) are
included in the sample.