Market Expansion Strategies for Turfgrass Producers in the Eastern United States€¦ · ·...
33
Market Expansion Strategies for Turfgrass Producers in the Eastern United States John J. Haydu and Alan W. Hodges Economic Information Report EIR 00-2 April 2000
Transcript of Market Expansion Strategies for Turfgrass Producers in the Eastern United States€¦ · ·...

Market Expansion Strategies for Turfgrass Producers
in the Eastern United States
John J. Haydu and Alan W. Hodges
Economic Information Report EIR 00-2
April 2000

i
Abstract
In 1998 the International Turfgrass Producers’ Foundation (ITPF) partially funded a uniqueresearch project to identify practical marketing strategies for increasing the demand for sod in theEastern U.S. This research, implemented by the University of Florida, consisted of two sequentialsteps. In the first step, case studies were conducted in six states through personal interviews of 20sod-related businesses. Their purpose was to identify the most critical factors influencing thedemand for sod. This information was necessary to design, develop and implement telephonesurveys, the second portion of the research. Over 500 firms, representing eight (8) distinct StandardIndustrial Classifications (SIC) in 26 states, were sampled. Data were analyzed by: 1) geographicregion — northeast, east central, and southeast; 2) type of business — general contractors anddevelopers, landscape architects and contractors, retail nurseries and garden centers, and sports turfusers; and 3) size of business as determined by annual sales (small = less than $500,000; medium= $500,000–$2.5 million; large = $2.5–$10 million, and very large = more than $10 million).
The results of this research indicate that demand for sod is currently very strong within theeastern U.S. The problem confronting producers is not one of demand but, essentially, ineffectiveapproaches to marketing and a lack of sufficient resources, both money and effort, directed atreaching customers. This conclusion was drawn from information gathered in response to severalquestion areas — from whom was sod purchased, what were customers looking for when theypurchased sod, did purchasing criteria vary by type of customer, how important is seasonality in thedemand for sod, and what are buyer expectations concerning the future demand for sod? Some keyfindings follow.
Firstly, sod purchases are typically at the wholesale level directly from the farm unlike mostagricultural sectors that utilize traditional marketing channels in which one to many “middle men”are involved. This direct approach to marketing suggests that many potential market niches may beoverlooked by producers as was evidenced when respondents complained of difficulty obtainingenough sod. Secondly, sod shipments were too large for many businesses in the retail sector,particularly garden centers with limited space. By exceeding the handling capacity of these retailers,an entire segment of potential buyers is eliminated. Thirdly, sports turf users in the northeast appearto represent an under-utilized market. Compared to other types of businesses in the region, thisgroup had the highest use of sod (36%) compared to seed. Sports turf businesses cannot affordextended down time of their fields and because their turf-wear is much more intensive, it necessitatesfrequent replacement. It would clearly be in the interest of sod producers to target this group moreaggressively. Finally, seasonally slow periods such as the beginning and end of winter may representsmall “market windows” for some producers. Given the intense competitive climate in the spring,summer and early fall, it makes sense to focus additional attention on these markets during theslower months of the year. Such a strategy could also help firms alleviate cash-flow constraints thattypically occur at this time of year.
Most respondents considered quality first when contemplating buying sod. In fact, quality wasvalued substantially higher than price, the second-ranked characteristic. However, when analyzedby type of buyer, general contractors and developers preferred price over quality. Third- and fourth-ranked sod features were availability of supply and reliable delivery. Producers need to be aware of

ii
the different preferences that exist among buyers since this will directly or indirectly affect marketdemand. For instance, it makes little sense to emphasize quality to a particular contractor whohappens to be more concerned about price.
When respondents were asked to identify features liked most about sod when compared to seed,rapid establishment was the clear winner. The fact that sod provides a “finished, professional look”was a recognized and substantial benefit in contrast to seed. Attractive appearance was the secondmost desirable feature, followed by erosion and weed control. Erosion control surfaced as a keyconcern for developers since soil run-off is often associated with hefty fines levied by localgovernments. Features liked least about sod were obvious — high initial cost, heavy and dirty tohandle, and the labor intensiveness of installing sod.
Based on results of this study, it is clear that abundant opportunities are available in the easternU.S. to expand sod markets. Six major market strategies are recommended:
1. Diversify distribution — sod producers are too concentrated at the farm/wholesale level and areforegoing numerous opportunities with the retail sector and other smaller market niches.
2. Target architects and developers — since this group specifies whether sod or seed is to be used,producers need to target them with descriptive, accurate and timely information that focuses onthe many advantages of sod.
3. Advertise more effectively — research indicates that sod producers do not advertise enough, donot put their ads in the right places, and do not consider the most appropriate market niches.
4. Improve quality and professionalism — quality was ranked as the most important feature desiredby buyers, yet it was also a major complaint. Producer organizations need to promote quality byproviding more educational programs for their members.
5. Educate producers and consumers — although related to advertising, education should not beconfused with it. The sod production industry should become aggressive at designing,developing and delivering educational material to both producers and consumers. Quality shouldalso be promoted by informing buyers of the many positive features of sod.
6. Target off-season periods — producers are competing aggressively with each other during peakseasons; but windows of opportunity are available in the off-season for producers who arewilling and able to find them.
Keywords: turfgrass, eastern United States, marketing, purchasing criteria, survey research.

iii
Table of Contents
Abstract . . . . . . . . . . . . . . . . . . . . . . . . . . . . . . . . . . . . . . . . . . . . . . . . . . . . . . . . . . . . . . . . . . . . . i
Introduction . . . . . . . . . . . . . . . . . . . . . . . . . . . . . . . . . . . . . . . . . . . . . . . . . . . . . . . . . . . . . . . . . . 1
Part I: Objectives . . . . . . . . . . . . . . . . . . . . . . . . . . . . . . . . . . . . . . . . . . . . . . . . . . . . . . . . . . . . . . 2
Part II: Research Methods . . . . . . . . . . . . . . . . . . . . . . . . . . . . . . . . . . . . . . . . . . . . . . . . . . . . . . . 2Study Areas . . . . . . . . . . . . . . . . . . . . . . . . . . . . . . . . . . . . . . . . . . . . . . . . . . . . . . . . . . . . . . . 2Case Studies . . . . . . . . . . . . . . . . . . . . . . . . . . . . . . . . . . . . . . . . . . . . . . . . . . . . . . . . . . . . . . . 3Telephone Surveys . . . . . . . . . . . . . . . . . . . . . . . . . . . . . . . . . . . . . . . . . . . . . . . . . . . . . . . . . . 3
Part III: Research Results . . . . . . . . . . . . . . . . . . . . . . . . . . . . . . . . . . . . . . . . . . . . . . . . . . . . . . . 8Sod Purchasing Characteristics . . . . . . . . . . . . . . . . . . . . . . . . . . . . . . . . . . . . . . . . . . . . . . . . 8Business Expectations and Market Demand . . . . . . . . . . . . . . . . . . . . . . . . . . . . . . . . . . . . . 12Desired Product Characteristics . . . . . . . . . . . . . . . . . . . . . . . . . . . . . . . . . . . . . . . . . . . . . . . 14
Purchasing Criteria . . . . . . . . . . . . . . . . . . . . . . . . . . . . . . . . . . . . . . . . . . . . . . . . . . . . . . 15Features Liked Most about Sod . . . . . . . . . . . . . . . . . . . . . . . . . . . . . . . . . . . . . . . . . . . . 16Features Liked Least About Sod . . . . . . . . . . . . . . . . . . . . . . . . . . . . . . . . . . . . . . . . . . . 19
Part IV: Market Expansion Strategies . . . . . . . . . . . . . . . . . . . . . . . . . . . . . . . . . . . . . . . . . . . . . 21Diversify distribution . . . . . . . . . . . . . . . . . . . . . . . . . . . . . . . . . . . . . . . . . . . . . . . . . . . . . . . 21Target architects and developers . . . . . . . . . . . . . . . . . . . . . . . . . . . . . . . . . . . . . . . . . . . . . . 22Advertise more effectively . . . . . . . . . . . . . . . . . . . . . . . . . . . . . . . . . . . . . . . . . . . . . . . . . . . 23Improve quality and professionalism . . . . . . . . . . . . . . . . . . . . . . . . . . . . . . . . . . . . . . . . . . . 23Educate producers and consumers . . . . . . . . . . . . . . . . . . . . . . . . . . . . . . . . . . . . . . . . . . . . . 24Target off-season periods . . . . . . . . . . . . . . . . . . . . . . . . . . . . . . . . . . . . . . . . . . . . . . . . . . . . 25
References . . . . . . . . . . . . . . . . . . . . . . . . . . . . . . . . . . . . . . . . . . . . . . . . . . . . . . . . . . . . . . . . . . 26

1 John J. Haydu is a Professor and Alan W. Hodges is Coordinator of Economic Analysis with theDepartment of Food & Resource Economics, Institute of Food & Agricultural Sciences, University ofFlorida.
1
Market Expansion Strategies for Turfgrass Producersin the United States
byJohn J. Haydu and Alan W. Hodges1
Introduction
Historically turfgrass research has focused on the numerous biological, physiological andcultural aspects of sod production and maintenance. Such efforts have included making sodvarieties more resistant to pests and diseases, increasing off-take rates through improved culturalpractices, and enhancing harvesting efficiencies through technological innovations. While thistype of research clearly fulfills an important need for the turfgrass industry, at the same time itdoes not address another problem confronting many farmers. The crux of this problem can bestated quite simply. How prudent is it to invest thousands of dollars in capital and hundreds ofman-hours in labor cultivating a crop if, when harvest time arrives, the producer has troubleselling it, at least in quantities and at prices that are acceptable to him?
Although waiting until the last minute to secure a market may seem negligent, it occursfrequently throughout agriculture, and the turfgrass industry is no exception. Research in Floridahas shown that while production of sod has kept pace with market demand, producers have donelittle to expand markets or add value to their product. Indeed, when adjusting for inflation,nearly all major Florida grasses have declined considerably in price over the past 25 years(Haydu, 1992, 1998).
This trend is not unique to Florida but common throughout the United States. Falling realsod prices have occurred in spite of rising input costs, particularly for raw materials and labor,resulting in an uncomfortable “cost-price” squeeze for many growers (Johnson, 1995). Thesetrends can and should be reversed. . The problem is not a production issue, most producersalready know how to grow quality sod, the real challenge is to sell turfgrass profitably and insufficient volumes once it is produced.
Although the present economic expansion has been both vigorous and unprecedented in itsduration and the ensuing growth in commercial and residential developments has been a boon tothe sod industry, most producers can easily recall when times were not so good. Producers shouldtake positive steps to prepare for an uncertain future. Market research is an effective tool thathelps take the “guess work” out of farming, which is precisely what this research addresses.
Sod typically is used for various applications — new residential and commercialdevelopments, re-landscaping existing developments, sports turf facilities, and other commercialapplications — including businesses, schools and roadsides. New developments are 70% of thesod market, but there has been resistance by many developers, landscape architects andcontractors to utilize sod. Many of these professionals prefer the simplicity of installation and

2
the lower, up-front cost of seeded lawns. Sod producers need practical and economically feasibleoptions to counter this situation, including alternatives that extend outside some of the moretraditional markets. Demand can be increased so that everyone benefits — the task is simply todetermine the most feasible and effective methods of doing so.
This study sought to identify practical strategies for expanding sod markets whilesimultaneously securing prices that would provide a reasonable return on investment. This dualgoal is not a simple task, for producers must increase their own market share without reducing orrestricting the market share of others. This goal can be achieved only if the total market forturfgrass is enlarged. Therefore, the objective of this research was to ascertain how to enlarge theentire turfgrass pie so that all producers have the opportunity to obtain a larger slice, as opposedto merely redistributing the same sized pie among many competing producers.
This report consists of four main parts. In the first part, the study’s overall objective andseveral sub-objectives that support and define the direction of the research are identified. In parttwo, research methods employed are presented and discussed. Part three introduces the findingsof the research. Due to the breadth and depth of the study, this section is comprised of severaltopic areas, including a summary that highlights major results. The last part may be the mostimportant from the producers’ standpoint, for it offers specific marketing recommendationsbased on conclusions of the study.
Part I: Objectives
The objective of this study was to identify major factors that currently influence the demandfor turfgrass in selected metropolitan centers in the eastern United States. Market demandopportunities were identified and practical strategies for increasing sales by individual producersare proposed. Specific objectives of the project were to:
1. Identify and select key metropolitan areas in the northern and southern regions of the UnitedStates from which to conduct case studies. Identify primary and secondary turfgrass marketswithin these areas.
2. Determine the relative demand for primary turfgrass varieties. Identify major purchasers ofsod and interview buyers to determine the most feasible markets, particularly potentialmarket niches that may have been overlooked by producers.
3. Develop practical marketing strategies that can increase a producer’s sales volume andbusiness profitability. Describe innovative methods that turfgrass associations can adopt toincrease demand for sod at the state or regional levels.
Part II: Research Methods
Study Areas. Research focused on the eastern portion of the United States. Due to the area’sgeographic diversity and in order to make project results more applicable to producers indifferent parts of the study area, it was further delineated into three sub-regions:

3
1. Northeast: Connecticut, Maine, Massachusetts, New Hampshire, New York, Rhode Island,Vermont.
2. East Central: Delaware, Indiana, Kentucky, Maryland, Michigan, New Jersey, Ohio,Pennsylvania, Virginia, West Virginia.
3. Southeast: Alabama, Arkansas, Florida, Georgia, Louisiana, Mississippi, North Carolina,South Carolina, Tennessee.
Case Studies. Case studies were conducted through personal interviews to identify importantfactors affecting sod demand in each major geographic area. Case studies were used to initiatethis research because it allows for considerable breadth and depth in the investigation process. The researchers needed to identify strategic market opportunities, some of which may haveappeared obvious, others less apparent and understood. To achieve this in-depth understanding,lengthy discussions with key players were essential. In all, twenty (20) different companies wereinterviewed in seven states. (Florida was not one of the states because of the researchers’extensive knowledge of the industry in the state). A brief profile describing the types ofbusinesses and their geographic location is presented in Table 1. Specific businesses includedsod producers (5), developers (2), golf and country clubs (2), landscape design and/orconstruction (3), a rake and seed contractor (1), landscape services (2), retail nurseries (4), sodinstaller (1), a sod broker (1), and a public school maintenance supervisor (1). Preliminaryquestionnaires were developed for the interviews, which were conducted at the business site andtook between 1 and 1½ hours to complete. The information was compiled and organized for thesecond phase of the research process, the telephone surveys.
Telephone Surveys. Whereas case studies provided the basic information from which todetermine strategic opportunities, telephone surveys were used to establish their legitimacythrough a large sample of representative firms. Phone surveys allow a wide spectrum of peopleto be covered within a short time period. Although mail surveys can provide more detail,acquiring an adequate sample of responses often takes many months. This contrasts to telephonesurveys that can be completed in a matter of weeks. However, a limitation of phone interviews isthat only a brief time is available to obtain the necessary data. Therefore, questions must beconcise and target a specific issue or need. Establishing which questions should or should not beincluded in the interviews was an essential purpose of the case studies. Potential sod “buyers”fell into four main categories based on Standard Industrial Classification (SIC) codes developedby the U.S. Department of Commerce. These four sectors — specified in this report for purposesof brevity as: 1) General Contractors, 2) Landscape Services, 3) Retailers and 4) Sports TurfUsers — include the following SIC categories:
C General Contractors — General contractors and developers of single family housingconstruction (SIC 1521), commercial residential construction (SIC 1522) and non-residentialconstruction (SIC 1542).

4
Table 1. Summary of personal interviews conducted with turfgrass-related firms, in the easternregion of the United States, 1999.
Type of Business StateAnnual
BusinessVolume
Product/Services and Markets
1. Sod Production New York $2 million Sod, roll out, delivery, bag soil. Majorcustomers: 90% wholesale, 10% retail. Large garden centers, independents andchains.
2. Sod Production;Nursery Crops
Pennsylvania $500,000 Sod, installation, nursery crops
3. Sod Production Maryland $1 million Sod, pickup and delivery
4. Sod Production NorthCarolina
$3 million Sod growing, installation. Markets are40% residential, 40% commercial, 20%golf courses
5. Sod Production Georgia $500,000 Sod, delivery up to 150 miles. Markets toretailers and landscape contractors forresidential renovation.
6. Sod Production;Broker
NorthCarolina
not available Grows nine varieties of turf, sod buyingand delivery. Markets are landscapers,homeowners, golf courses.
7. Developer Pennsylvania $6.5 million Build residential homes.
8. Landscape Services Maryland $2 million Maintenance, grading, stonework
9. Landscape Designand Construction
Pennsylvania $400,000 Design and refurbish existing homes,including sod installation.
10. LandscapeContracting
NorthCarolina
$800,000 Landscape design, installation,maintenance, hardscaping.
11. LandscapeContracting
Georgia $400,000 Landscape design and residentialconstruction. Sod sprigging.
12. LandscapeContracting; RetailNursery
Georgia $600,000 Landscape design and construction, retailnursery.
13. HydroseedingContractor
Pennsylvania $700,000 Initial and finished grading, hydro-seeding.
14. Sod Installer New York $2 million Grade and prepare soil. Install irrigation. Lay sod.
Type of Business StateAnnual
BusinessVolume
Product/Services and Markets
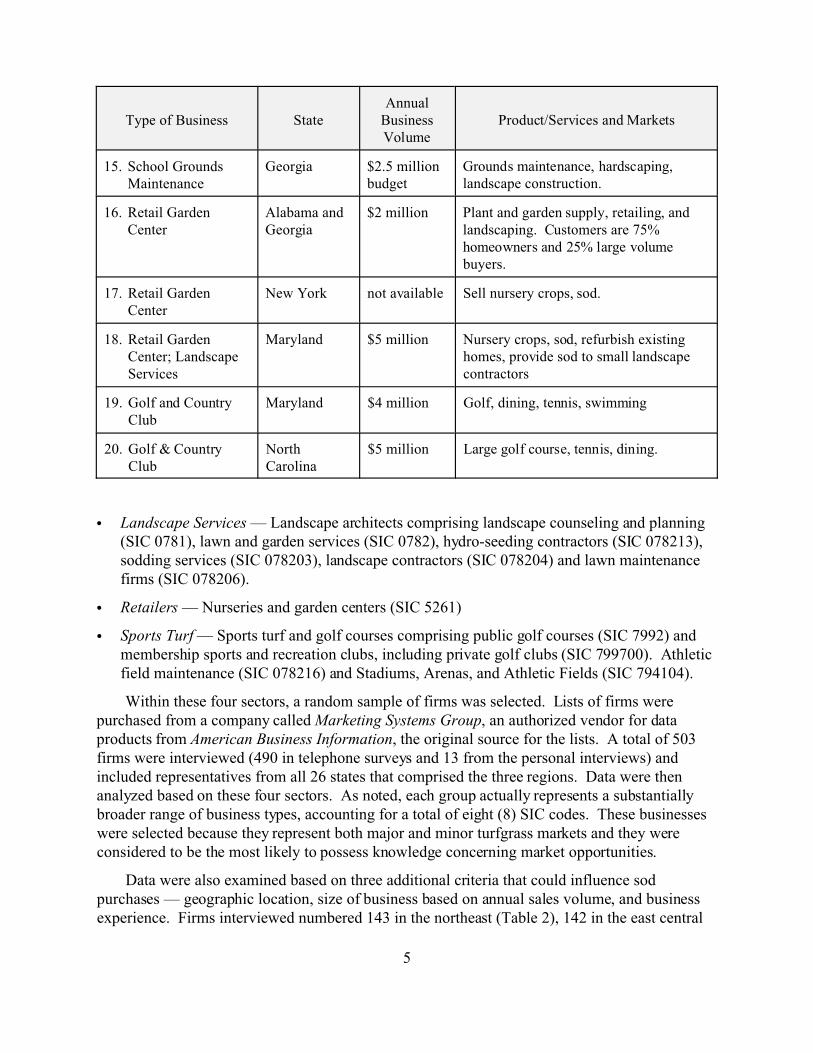
5
15. School GroundsMaintenance
Georgia $2.5 millionbudget
Grounds maintenance, hardscaping,landscape construction.
16. Retail GardenCenter
Alabama andGeorgia
$2 million Plant and garden supply, retailing, andlandscaping. Customers are 75%homeowners and 25% large volumebuyers.
17. Retail GardenCenter
New York not available Sell nursery crops, sod.
18. Retail GardenCenter; LandscapeServices
Maryland $5 million Nursery crops, sod, refurbish existinghomes, provide sod to small landscapecontractors
19. Golf and CountryClub
Maryland $4 million Golf, dining, tennis, swimming
20. Golf & CountryClub
NorthCarolina
$5 million Large golf course, tennis, dining.
C Landscape Services — Landscape architects comprising landscape counseling and planning(SIC 0781), lawn and garden services (SIC 0782), hydro-seeding contractors (SIC 078213),sodding services (SIC 078203), landscape contractors (SIC 078204) and lawn maintenancefirms (SIC 078206).
C Retailers — Nurseries and garden centers (SIC 5261)
C Sports Turf — Sports turf and golf courses comprising public golf courses (SIC 7992) andmembership sports and recreation clubs, including private golf clubs (SIC 799700). Athleticfield maintenance (SIC 078216) and Stadiums, Arenas, and Athletic Fields (SIC 794104).
Within these four sectors, a random sample of firms was selected. Lists of firms werepurchased from a company called Marketing Systems Group, an authorized vendor for dataproducts from American Business Information, the original source for the lists. A total of 503firms were interviewed (490 in telephone surveys and 13 from the personal interviews) andincluded representatives from all 26 states that comprised the three regions. Data were thenanalyzed based on these four sectors. As noted, each group actually represents a substantiallybroader range of business types, accounting for a total of eight (8) SIC codes. These businesseswere selected because they represent both major and minor turfgrass markets and they wereconsidered to be the most likely to possess knowledge concerning market opportunities.
Data were also examined based on three additional criteria that could influence sodpurchases — geographic location, size of business based on annual sales volume, and businessexperience. Firms interviewed numbered 143 in the northeast (Table 2), 142 in the east central

6
region, and 218 in the southeast. When analyzed by type of business — 54 general contractorsand developers, 150 landscape architects, 140 retail garden establishments and 159 sports turffacilities were interviewed.
A total of 135 small, 139 medium, 52 large and 19 very large businesses, based on annualbusiness volume — small (less than $500 thousand); medium ($500 thousand to $2.5 million);large ($2.5 million – $10 million); and very large (over $10 million), were interviewed (Table 3).
A fourth variable considered was the duration the company was in business. Owners/managers with extensive turfgrass experience were desired since this group would haveconsiderable knowledge concerning challenges and opportunities for the sod production industry. Figure 1 shows the average years in business for the four types of companies. Landscapeservices averaged the least with 16.5 years, followed by general contractors with nearly 24 years,sports turf users had almost 28 years and retailers had the most experience with just under 29years. In summary, this research project constituted four sequential stages requiring nearly oneyear to complete.
Table 2. Number of respondents interviewed, by turfgrass buyer category, in three easternregions of the United States in 1999.
Type of BusinessRegion1
NE 2 EC 3 SE 4 Total Percent
General Contractors 5 8 5 41 54 11%
Landscape Services 6 39 46 65 150 30%
Retailers 7 51 45 44 140 28%
Sports Turf 8 45 46 68 159 32%
Total All Buyers 143 142 218 503 100%
Percent 28% 43% 28% 100%1
Includes 490 interviews from telephone surveys in addition to 13 interviews from the case studies.2
Northeast includes the states of Connecticut, Maine, Massachusetts, New Hampshire, Vermont, Rhode Island,New York.
3East Central includes Delaware, Maryland, New Jersey, Pennsylvania, Virginia, Ohio, Michigan, Indiana,Kentucky, West Virginia.
4Southeast includes Alabama, Mississippi, Georgia, Florida, South Carolina, Louisiana, Arkansas, Tennessee,North Carolina.
5General contractors and developers of single family housing construction (SIC 1521), commercial residentialconstruction (SIC 1522) and non-residential construction (SIC 1542).
6Landscape architects and contractors comprising landscape counseling and planning (SIC 0781) and lawn andgarden services (SIC 0782).
7Nurseries and garden centers (SIC 5261).
8Sports turf and golf courses comprising public golf courses (SIC 7992) and membership sports and recreationclubs, including private golf clubs (SIC 799700).

7
Figure 1. Average years in business as specified by the type of respondentinterviewed, 1999.
Table 3. Number of respondents interviewed by type of business and annual sales volume.
Annual Sales VolumeGeneral
ContractorLandscapeServices
Retailers Sports Turf Total
Less than $500,000 4 67 31 33 135
$500,000 – $2.5 million 20 34 46 39 139
$2.5 million – $10million
15 12 11 14 52
Over $10 million 8 2 4 5 19

8

9
Part III: Research Results
Planning is indispensable when considering any new business venture. When the sodproduction industry wants to explore possibilities for expanding markets, the first step is togather as much information as possible about these potential markets — Who are the majorplayers? How many of them are there? Where are they located? What are their purchasinghabits? How do selling transactions differ by type of business or geographic region? To expandmarkets or find new market niches, it is vital to learn as much as possible to portray from severalperspectives primary and secondary sod markets. When sufficient information is obtained, viableprospects can be examined and opportunities put forth to expand market demand.
Sod Purchasing Characteristics
Unlike many other agricultural commodities that utilize several marketing channels, such asshipping point marketing firms or large integrated wholesalers, sod is handled quite simply anduniformly by passing directly from the farm to the consumer. This tendency is illustrated inFigure 2 for both quantities and dollar value. Between 85 and 95 percent of all sod waspurchased at the farm gate. Brokers represented the next substantial group, handling 13 percentof physical volume but only 2 percent of actual dollar value. Retailers played an even smallerrole, with only 2 percent of respondents purchasing from these firms. The direct mode ofdistribution is probably due to sod’s perishable nature, as well as its considerable bulkiness andweight.

10
Figure 2. Purchasing sources for sod by all buyer groups in thenortheast, east central and southeastern United States.
Table 4 presents data on the quantities and values of sod purchased by four different types ofbuyers in three regions of the eastern U.S. These numbers provide information on totalpurchases within each group, derived from the sample of roughly 500 firms interviewed. In thenortheast, sports turf users purchased the most square feet of sod. In the east central portion,landscape architects and design firms purchased the majority, and in the southeast the retailgroup was on top.
The dominant group was not developers of residential sites or sports turf groups, but ratherthe retail sector. Substantially more turf moved through the retail sector than the other outlets,indicating their surprising market influence. Normally developers and landscape contractors areperceived as the major market outlets for sod, not retail firms. Such results suggest that thisrather non-traditional segment may be gaining in prominence. This assertion was supportedwhile interviewing firms in the case studies. One large sod producer, for example, had beenselling 90 percent of total production to a retail chain. Primary buyers at retail firms are typicallyhomeowners, lawn maintenance firms, and very small landscape contractors. In conclusion, theeconomic boom that has been the impetus behind robust growth in new housing starts has alsoinfluenced owners of existing homes to renovate their residences.
11
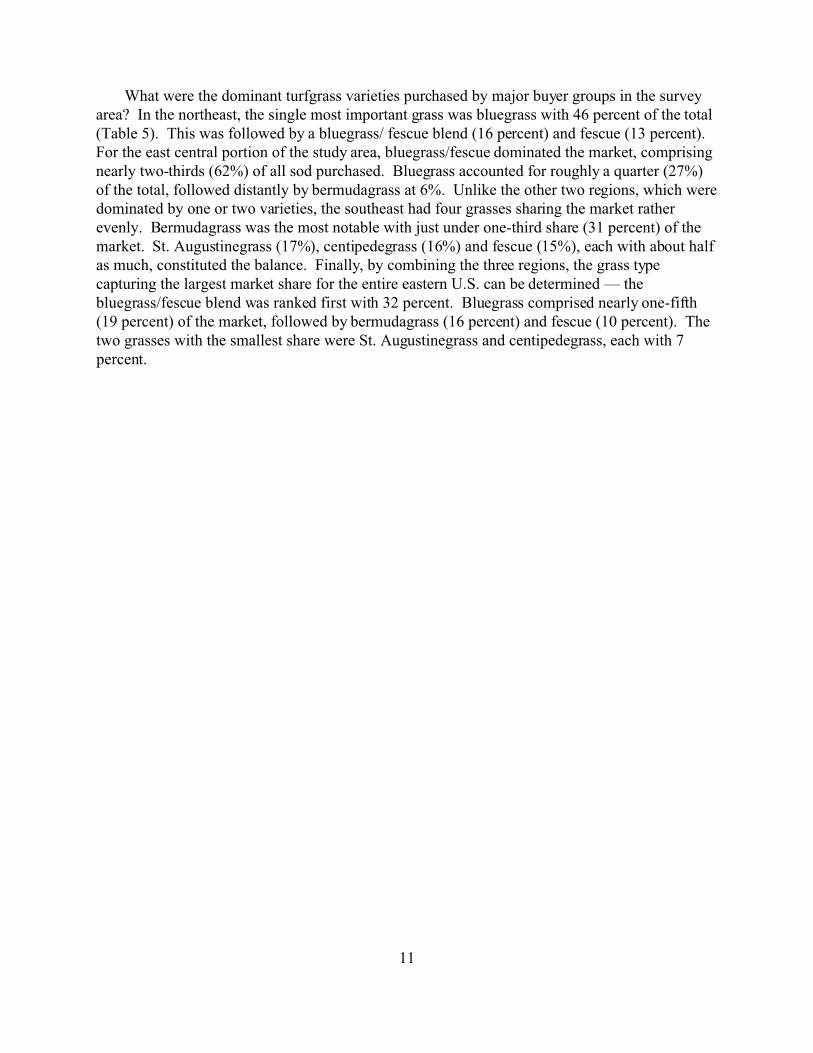
What were the dominant turfgrass varieties purchased by major buyer groups in the surveyarea? In the northeast, the single most important grass was bluegrass with 46 percent of the total(Table 5). This was followed by a bluegrass/ fescue blend (16 percent) and fescue (13 percent). For the east central portion of the study area, bluegrass/fescue dominated the market, comprisingnearly two-thirds (62%) of all sod purchased. Bluegrass accounted for roughly a quarter (27%)of the total, followed distantly by bermudagrass at 6%. Unlike the other two regions, which weredominated by one or two varieties, the southeast had four grasses sharing the market ratherevenly. Bermudagrass was the most notable with just under one-third share (31 percent) of themarket. St. Augustinegrass (17%), centipedegrass (16%) and fescue (15%), each with about halfas much, constituted the balance. Finally, by combining the three regions, the grass typecapturing the largest market share for the entire eastern U.S. can be determined — thebluegrass/fescue blend was ranked first with 32 percent. Bluegrass comprised nearly one-fifth(19 percent) of the market, followed by bermudagrass (16 percent) and fescue (10 percent). Thetwo grasses with the smallest share were St. Augustinegrass and centipedegrass, each with 7percent.

12
Table 4. Average square feet purchased by turfgrass buyer group in the three eastern regions ofthe United States in 1999.
Type of Buyer andNumber Respondents
Northeast 1 East Central 2 Southeast 3 Total
Square Ft Square Ft Square Ft Square Ft Percent
-------------------------Thousands -------------------------
Contractor 4 (54) 903 6,815 350 8,068 8%
L. Services 5 (150) 1,018 22,870 3,455 27,343 28%
Retailer 6 (140) 3,504 2,775 36,315 42,595 44%
Sports Turf 7 (159) 14,167 2,975 1,405 18,548 19%
All Groups (503) 19,591 35,437 41,526 96,555 100%
Percent Share 20% 37% 43% 100% 100%
1Includes Connecticut, Maine, M assachusetts, New Hampshire, New York, Rhode Island , Vermont.
2Includes Delaware, Indiana, Kentucky, Maryland, Michigan, New Jersey, Ohio, Pennsylvania, Virginia, W est
Virginia.3
Includes Alabama, Arkansas, Florida, Georgia, Louisiana, Mississippi, North Carolina, South Carolina,
Tennessee.4
General contractors and developers of single family housing construction (SIC 1521), commercial residential
construction (SIC 1522) and non-residential construction (SIC 1542).5
Landscape architects and contractors comprising landscape counseling and planning (SIC 0781) and lawn and
garden services (SIC 0782).6
Nurseries and garden centers (SIC 5261).7
Sports turf and golf courses comprising public golf courses (SIC 7992) and membership sports and recreation
clubs, including private golf clubs (SIC 799700).
Table 5. Top six turfgrass types purchased by survey respondents in three regions of the easternUnited States, 1999 data.
Grass Type Northeast1 East Central2 Southeast3 Total
Bluegrass 46% 27% 1% 19%
Bluegrass/Fescue 16% 62% 2% 32%
Fescue 13% 5% 15% 10%
Bermudagrass 2% 6% 31% 16%
Centipedegrass 1% (–) 16% 7%
St. Augustinegrass 2% (–) 17% 7%
1Includes Connecticut, Maine, M assachusetts, New Hampshire, New York, Rhode Island , Vermont.
2Includes Delaware, Indiana, Kentucky, Maryland, Michigan, New Jersey, Ohio, Pennsylvania, Virginia, W est
Virginia.3
Includes Alabama, Arkansas, Florida, Georgia, Louisiana, Mississippi, North Carolina, South Carolina,
Tennessee.
13
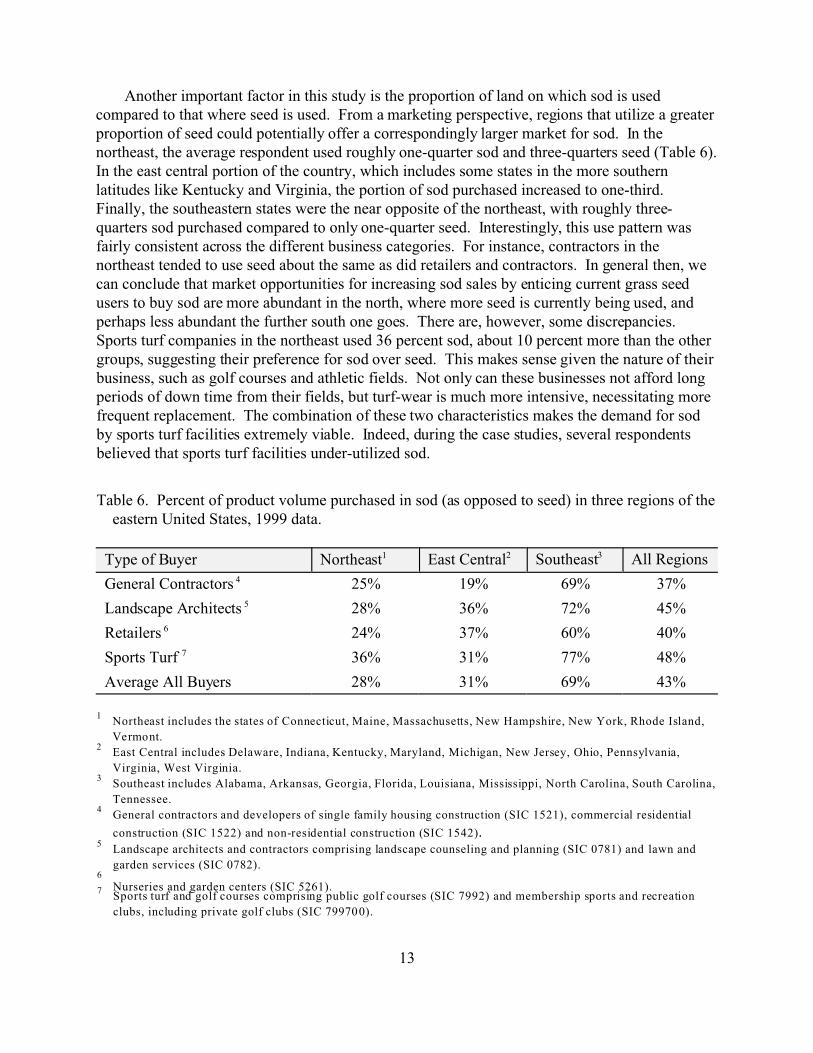
Another important factor in this study is the proportion of land on which sod is usedcompared to that where seed is used. From a marketing perspective, regions that utilize a greaterproportion of seed could potentially offer a correspondingly larger market for sod. In thenortheast, the average respondent used roughly one-quarter sod and three-quarters seed (Table 6). In the east central portion of the country, which includes some states in the more southernlatitudes like Kentucky and Virginia, the portion of sod purchased increased to one-third. Finally, the southeastern states were the near opposite of the northeast, with roughly three-quarters sod purchased compared to only one-quarter seed. Interestingly, this use pattern wasfairly consistent across the different business categories. For instance, contractors in thenortheast tended to use seed about the same as did retailers and contractors. In general then, wecan conclude that market opportunities for increasing sod sales by enticing current grass seedusers to buy sod are more abundant in the north, where more seed is currently being used, andperhaps less abundant the further south one goes. There are, however, some discrepancies. Sports turf companies in the northeast used 36 percent sod, about 10 percent more than the othergroups, suggesting their preference for sod over seed. This makes sense given the nature of theirbusiness, such as golf courses and athletic fields. Not only can these businesses not afford longperiods of down time from their fields, but turf-wear is much more intensive, necessitating morefrequent replacement. The combination of these two characteristics makes the demand for sodby sports turf facilities extremely viable. Indeed, during the case studies, several respondentsbelieved that sports turf facilities under-utilized sod.
Table 6. Percent of product volume purchased in sod (as opposed to seed) in three regions of theeastern United States, 1999 data.
Type of Buyer Northeast1 East Central2 Southeast3 All Regions
General Contractors 4 25% 19% 69% 37%
Landscape Architects 5 28% 36% 72% 45%
Retailers 6 24% 37% 60% 40%
Sports Turf 7 36% 31% 77% 48%
Average All Buyers 28% 31% 69% 43%
1Northeast includes the states of Connecticut, Maine, Massachusetts, New Hampshire, New York, Rhode Island,
Vermont.2
East Central includes Delaware, Indiana, Kentucky, Maryland, Michigan, New Jersey, Ohio, Pennsylvania,
Virginia, West Virginia.3
Southeast includes Alabama, Arkansas, Georgia, Florida, Louisiana, Mississippi, North Carolina, South Carolina,
Tennessee.4
General contractors and developers of single family housing construction (SIC 1521), commercial residential
construction (SIC 1522) and non-residential construction (SIC 1542).5
Landscape architects and contractors comprising landscape counseling and planning (SIC 0781) and lawn and
garden services (SIC 0782).6
Nurseries and garden centers (SIC 5261).7Sports turf and golf courses comprising public golf courses (SIC 7992) and membership sports and recreation
clubs, including private golf clubs (SIC 799700).

14
Figure 3. Seasonality of business volume for turfgrassrelated businesses, all regions.
A related variable influencing the utilization of sod is seasonality of the business. Marketingstrategies might target slow or fast periods, depending on the firm’s objectives and whereopportunities develop. For the firms interviewed, the peak periods were in the spring and falland the slack periods were winter and summer (Figure 3). For some growers, the interval withthe most activity might indicate the greatest opportunities, since demand at this time would behighest. On the other hand, since most producers are busiest at this time, it might also be themost competitive period. Therefore, a possible strategy is for some producers to target periods oflow intensity that could create opportunities in certain markets. Slow winter months, forexample, might be a good chance for contacting state and local governments who need lowerquality grass for roadsides and drainage areas. Turf quality in northern areas is alreadycompromised during this time of year, so offering a lower price to move excess production maybe profitable. The point is, from a cash flow standpoint, it makes sense to even out the peaks andtroughs of business activity throughout the year. Just because business is slow for mostproducers in winter months does not mean that it has to be for everyone.
Business Expectations and Market Demand
In an effort to determine current and future impacts to the sod market, people were asked howtheir business volume had changed from the previous year (1998) and, if it had changed, howmuch it had changed. Nearly all firms (87 percent), regardless of type, stated that businessactivity had grown from the previous year (Table 7). Sports turf users, architects and retailers all

15
Table 7. Changes in business volume that occurred during 1998 for turfgrass related businesses.
Type ofBusiness
Change in Business Volume from Previous Year
Increase Decrease No Change
Numberof Firms
Percentof
Firms
Avg%
Numberof Firms
Percentof
Firms
Avg%
Numberof Firms
Percentof
Firms
Contractors1 42 9% 46% 6 1% 51% 1
Architects2 118 27% 28% 11 3% 36% 3 1%
Retailers3 119 27% 24% 9 2% 11% 1
Sports Turf 4 109 24% 26% 18 4% 36% 8 2%
Total 388 87% 31% 44 10% 33% 13 3%
1General contractors and developers of single family housing construction (SIC 1521), commercial residential
construction (SIC 1522) and non-residential construction (SIC 1542).2
Landscape architects and contractors comprising landscape counseling and planning (SIC 0781) and lawn
October 26 , 1999and garden services (SIC 0782).3
Nurseries and garden centers (SIC 5261).4
Sports turf and golf courses comprising public golf courses (SIC 7992) and membership sports and recreation
clubs, including private golf clubs (SIC 799700).
claimed that business had increased roughly 25 percent from the previous year. Generalcontractors and developers indicated that business volume had grown by 46 percent. Such robustexpansion by this group bodes well for the sod industry, which depends heavily on newresidential and commercial construction. The average growth for all firms in this group was animpressive 31 percent. Ten percent of firms claimed that business had declined and three percentstated there was no change from the previous year. Although the group claiming that businessactivity had declined was small, the percentage decline for the average business was quitesubstantial. Why these firms encountered such financial turmoil amidst a generally prosperousclimate is unclear and open to speculation.
In an effort to obtain a brief glimpse into the future, respondents were asked about theirexpectations regarding sod purchases for the coming year (Table 8). In this case, fewer firmsexpressed such confidence (37 percent), although those that did were highly optimistic. Even theretail firms that were highly conservative indicated a 25 percent increase, a very strong numberby any standards. From this level, expectations grew markedly. Landscape architects, designcompanies, general contractors and developers all expected sod purchases to increase by morethan 50 percent. However, the most significant change came from the sports turf group, whichanticipated a near doubling (97 percent) of purchases in 1999. Another 37 percent ofrespondents indicated they expected no change. Given that business volume was strong in 1998,this result can be interpreted as an expression of business confidence. In spite of such optimismfrom nearly three-quarters of all firms, some businesses were apprehensive. Roughly one-fourthof respondents expected sod purchases to decline by nearly 50 percent. Interestingly, the group

16
expecting the largest reduction was sports turf users. Although not the same identical firms, theywere in the same category as those that had expressed confidence. This response could reflectthe cyclical nature of this industry, including the fact that it tends to be “project driven”. Duringa period of project activity, managers may embrace a more optimistic outlook since expansionand growth are often associated with economic health. Conversely, during a project hiatus,apprehensions may surface, including uncertainty about the economy and the financial risks adownturn portends. Sports turf facilities provide leisure activities that rely almost exclusively ondiscretionary income. During economic slowdowns, such expenditures are often the first to becut by consumers.
Table 8. Expectations, by turfgrass industry group, for sod purchases next year (year 2000).
Type ofBusiness
Expected Increase Expected Decrease No Change
Firms Percent Average Firms Percent Average Firms Percent
Contractors 1 19 4% 58% 7 1% 43% 25 5%
Architects 2 56 12% 51% 31 7% 44% 55 12%
Retailers 3 57 12% 25% 30 7% 35% 40 9%
Sports Turf 4 40 9% 94% 59 12% 63% 51 11%
Total 172 37% 127 27% 171 37%
1General contractors and developers of single family housing construction (SIC 1521), commercial residential
construction (SIC 1522) and non-residential construction (SIC 1542).2
Landscape architects and contractors comprising landscape counseling and planning (SIC 0781) and lawn
October 26 , 1999and garden services (SIC 0782).3
Nurseries and garden centers (SIC 5261).4
Sports turf and golf courses comprising public golf courses (SIC 7992) and membership sports and recreation
clubs, including private golf clubs (SIC 799700).
Desired Product Characteristics
Perhaps the most vital marketing function is to determine the types of products thatconsumers want. Stated more technically, producers need to match product characteristics withbuyer expectations. The closer the match, the happier the consumer, and the more value theyattach to that product. From a producer’s standpoint, value should translate into higher pricesand greater quantities sold, which in turn suggests higher profits. To determine buyerexpectations regarding sod, three inter-related questions were asked: (1) What are the mostimportant criteria you consider when purchasing sod? (2) What features do you like most aboutsod? (3) What features do you like least about sod? Respondents were also requested to rankcriteria from most-to-least (4 = most; 1 = least) important. Results, presented in Tables 9 and 10,are weighted averages for all firms, firms by geographic region and by type of business.

17
Highlights of these results follow.
1. Purchasing Criteria
Results of All Firms. Sod quality was the number one attribute cited by the sample of firms,as indicated by a weighted value of 3.48 (Table 9). The reader should note that, because thesetabulations are weighted, even small differences between values can be significant. For example,the variation between quality and price is considerable since price is ranked at 2.42, or more thanone full point below quality. This large differential indicates that sod quality is a far greaterconcern to the average buyer than is price. The third most important feature was availability ofsupply, with a weighted rank of 2.38. A final purchasing criterion was delivery. With a rank of1.51, delivery was either not important or was viewed as a lesser issue compared to the otherproduct features.
Regional Differences. Only very minor differences appeared when the data was examinedby geographic location. Apparently, where people lived did not influence their views regardingcriteria for purchasing sod.
Type of Business. Whereas regional influences were negligible, larger variations surfacedwhen examined by type of business (Table 10; Figure 4). Quality, for example was given a highrank of 3.62 by sports turf users, but a relatively low rank (2.65) by general contractors anddevelopers. Both retailers and architects also rated quality nearly as high as did sports turf users. On the other hand, contractors placed considerable importance on price (3.10) compared toarchitects (2.38), retailers (2.23) and sports turf (2.37). Availability of sod was ranked close tothe average of 2.38 for all businesses, and it was also very close to price in overall importance. Rankings for delivery varied slightly more, the most significance being given by retailers (1.75)and the least by architects (1.34). In summary, of the four purchasing criteria listed, quality andprice stood out as the most valued features. Furthermore, when selling sod, producers shouldemphasize quality over price for all groups except contractors.
An interesting question is why the contractor group differed so much from others by placinga premium on price rather than quality. Perhaps the most compelling reason is that sod purchasesrepresent a minor part of a contractor’s business volume. Many general contractors anddevelopers may only deal with sod indirectly, through their landscape contractors. Moreover,from a marketing perspective, this group is also furthest removed from the final consumer —whether it be a homeowner, a garden center shopper, or the member of a golf & country club. Because they are more distant, they tend to be less aware of consumer concerns, and so focusinstead on something near and dear to them — their own financial bottom line. Conversely,retailers and sports turf users are located much closer to the consumer and are more cognizant ofthe value these consumers place on turf quality.
18
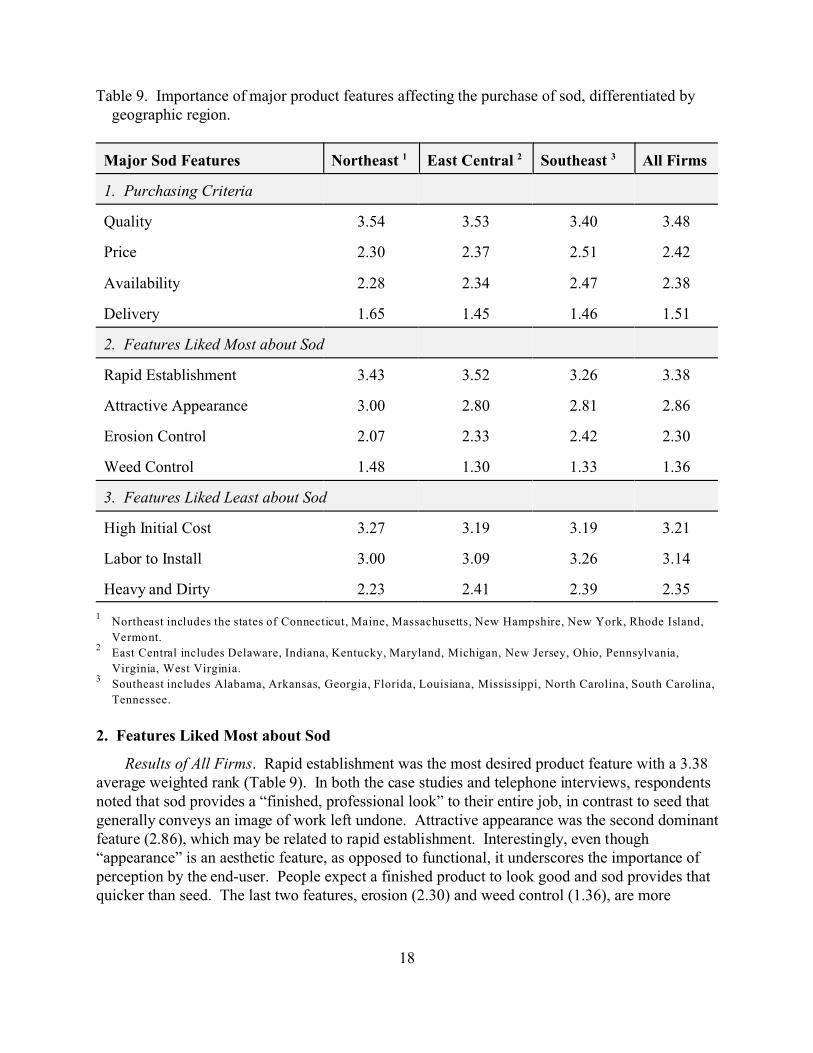
Table 9. Importance of major product features affecting the purchase of sod, differentiated bygeographic region.
Major Sod Features Northeast 1 East Central 2 Southeast 3 All Firms
1. Purchasing Criteria
Quality 3.54 3.53 3.40 3.48
Price 2.30 2.37 2.51 2.42
Availability 2.28 2.34 2.47 2.38
Delivery 1.65 1.45 1.46 1.51
2. Features Liked Most about Sod
Rapid Establishment 3.43 3.52 3.26 3.38
Attractive Appearance 3.00 2.80 2.81 2.86
Erosion Control 2.07 2.33 2.42 2.30
Weed Control 1.48 1.30 1.33 1.36
3. Features Liked Least about Sod
High Initial Cost 3.27 3.19 3.19 3.21
Labor to Install 3.00 3.09 3.26 3.14
Heavy and Dirty 2.23 2.41 2.39 2.35
1Northeast includes the states of Connecticut, Maine, Massachusetts, New Hampshire, New York, Rhode Island,
Vermont.2
East Central includes Delaware, Indiana, Kentucky, Maryland, Michigan, New Jersey, Ohio, Pennsylvania,
Virginia, West Virginia.3
Southeast includes Alabama, Arkansas, Georgia, Florida, Louisiana, Mississippi, North Carolina, South Carolina,
Tennessee.
2. Features Liked Most about Sod
Results of All Firms. Rapid establishment was the most desired product feature with a 3.38average weighted rank (Table 9). In both the case studies and telephone interviews, respondentsnoted that sod provides a “finished, professional look” to their entire job, in contrast to seed thatgenerally conveys an image of work left undone. Attractive appearance was the second dominantfeature (2.86), which may be related to rapid establishment. Interestingly, even though“appearance” is an aesthetic feature, as opposed to functional, it underscores the importance ofperception by the end-user. People expect a finished product to look good and sod provides thatquicker than seed. The last two features, erosion (2.30) and weed control (1.36), are more

19
Table 10. Importance of major product features affecting the purchase of sod, differentiated bytype of business.
Major Sod Features Contractor 1 Landscape Services2
Retailer 3 Sports Turf4
All Firms
1. Purchasing Criteria
Quality 2.65 3.54 3.56 3.62 3.48
Price 3.10 2.38 2.23 2.38 2.42
Availability 2.56 2.35 2.36 2.37 2.38
Delivery 1.60 1.34 1.75 1.42 1.51
2. Features Liked Most about Sod
Rapid Establishment 3.29 3.16 3.50 3.52 3.38
Attractive Appearance 2.62 3.02 3.09 2.58 2.86
Erosion Control 2.76 2.26 2.09 2.35 2.30
Weed Control 1.33 1.40 1.33 1.36 1.36
3. Features Liked Least about Sod
High Initial Cost 3.37 3.25 3.20 3.14 3.21
Labor to Install 3.00 3.10 3.09 3.25 3.14
Heavy and Dirty 2.39 2.39 2.36 2.31 2.35
1General contractors and developers of single family housing construction (SIC 1521), commercial residential
construction (SIC 1522) and non-residential construction (SIC 1542).2
Landscape architects and contractors comprising landscape counseling and planning (SIC 0781) and lawn
October 26 , 1999and garden services (SIC 0782).3
Nurseries and garden centers (SIC 5261).4
Sports turf and golf courses comprising public golf courses (SIC 7992) and membership sports and recreation
clubs, including private golf clubs (SIC 799700).
functional attributes and were less important to respondents. However, notice that erosioncontrol was ranked much higher than weed control. This result may stem from the fact that, insome areas, erosion can carry with it hefty fines by local government authorities. Soil run-off isviewed as harmful to streams and rivers and is increasingly becoming a sensitive issue withenvironmental agencies.
Regional Differences. Of the four features presented, only erosion control showed any typeof variation with regards to geographic location of the respondent. People in the northeastappeared to be least concerned (2.07) whereas those in the east central (2.33) and southeast (2.42)

20
Figure 4. Comparison of the importance contractors, architects,retailers and sports turf users, place on variouscharacteristics of sod.
ranked it slightly higher.
Type of Business. Although rapid establishment was ranked number one by all businesstypes, there were modest differences across business categories (Table 10). Sports turf usersranked it highest (3.52) while landscape architect and design firms ranked it the lowest (3.16). Attractive appearance was the second most important attribute desired by the average firm. Retailers felt this was more critical (3.09), followed closely by architects (3.02). Generalcontractors and developers (2.62) and sports turf facilities (2.58) ranked attractive appearanceslightly lower. Note that sports turf firms emphasized “quality” as a purchasing criteria, butquality for them may indicate tolerance to heavy traffic and perhaps the absence of weeds, asopposed to color and texture. Erosion control was considered most important by generalcontractors and developers (2.76), who also are the ones facing potential fines for soil run-off. Sports turf users placed it as a moderate feature (2.35) while architects (2.26) and retailers (2.09)valued it least. Again, sports turf facilities are probably confronted with erosion problems morefrequently in their work and so place a higher value on erosion control than retail firms who areless likely to confront such situations.

21

22
3. Features Liked Least About Sod
Results of All Firms. Three undesirable sod characteristics listed were: a) high initial cost;b) heavy and dirty; and c) the substantial labor requirements for installation. High initial costwas ranked first (3.21) followed by labor (3.14) as the most prominent disliked characteristics(Table 9). Clearly these characteristics are related — the more labor that is required to completea job drives up overall costs. In both the case studies and telephone interviews, cost became theoverriding issue . Although “heavy and dirty” was also cited repeatedly, it was not considered asimportant (weight of 2.35), probably because most people recognize there is little that can bedone about it.
Regional Differences. Differences were negligible across regions. It is interesting to notethat, whereas in the northeast high initial cost ranked highest at 3.27, in the southeast labor toinstall ranked highest at 3.26. This may point to the labor market situation in the southeast as afactor to be considered.
Type of Business. Differences were minor across type of business (Table 10).
Responses on How to Increase Sod Demand
The following section summarizes some of the more salient comments extracted from thecase studies and the open-ended portion of the telephone surveys. Although it does not includeall the information from the interviews, it does represent what the researchers believe are themore crucial observations — those that will have the most impact on the market demand for sod. These remarks were used to develop the “Market Expansion Strategies” section that follows.
1. Availability. Several noteworthy comments were made regarding a lack of sod availability. First, buyers complained that sod is difficult to get no matter where one is. Producers need tomake more sod available in general. Second, remote locations such as rural areas present an evengreater obstacle to acquiring sod. Producers concentrate too much on urban centers at theexpense of smaller, less visible markets. To remedy this situation, producers should providemore vendor locations to improve product access and customer convenience. Establishing “soddepots” was a practical suggestion for increasing availability at the local level. Third, more sodneeds to be made available in smaller quantities. Frequently nurseries take larger shipments thanthey need or can feasiblely sell. Because sod has a short shelf-life, spoilage is common. Producers should offer smaller orders, perhaps 500 square feet, and eliminate the large,minimum-sized orders of 2000 sq. ft. or more that exceed most nurseries’ carrying capacity. Fourth, have more year-around availability. Sod is always difficult to obtain in the summermonths; supplies should be better regulated. Producers should consider contract growing to theirlarger volume customers to guarantee supply. Fifth, implement more effective advertising to letcustomers know where to purchase sod. Sixth, more grass varieties are needed — too fewchoices are available, including a lack of blended grasses.
2. Cost. Respondents complained repeatedly about the high cost of sod. One individualsuggested that if producers made sod less expensive, more people would buy it, therebyincreasing demand. Others felt that high installation costs because of labor reduced sod demand.

23
In terms of positive advice, several people indicated that mechanized laying of big rollsrevolutionized their businesses, reducing labor requirements and costs, and sped up theiroperation. Promote the use of sod-laying machinery in conjunction with more sod rolls in orderto increase demand. Second, cost comparisons with seed were also encouraged. The industryneeds to inform buyers that, when one takes into account the time factor involved in establishingseed (1–2 years, depending on time of year it was planted), sod is probably cheaper. Third, somecomplaints were made that sod uses too much water. Again, water consumption comparisons ofsod versus seed might be useful to educate consumers.
3. Delivery. As in the case above, producers were asked to reduce order sizes. Prohibitivelylarge orders have three negative consequences for producers: 1) the client is forced to buy morethan wanted, in which case the producer has an unhappy customer; 2) the potential customerchooses to look elsewhere; or 3) the customer chooses seed over sod as a solution. The bottomline — under all three scenarios the producer loses a customer. A second major complaint wasunreliable delivery. Respondents felt that producers should deliver sod when the customer wantsit, not when it is convenient for the producer. Sod should also be delivered fresh — don’t cut ittoday and deliver tomorrow or the day after. Third, cover sod during shipping so that it isprotected in hot weather. Buyers complained that the ends often get dried out and burned. Aftersod is installed, it has an unsightly checkerboard appearance. To make matters worse, weedsgenerally grow in the dead areas, which compounds the problem and angers the customer. Fourth, some people believed freight charges were too high. Producers need to assess whethershipping costs are reasonable, including the prices charged by their distributors.
4. Quality. Recall that sod quality was the most important characteristic sought by buyers, yet itwas also a major complaint. First, a lack of consistency was cited from two perspectives: a)Producers need to better monitor their own product quality. Buyers felt quality varied too muchfrom one shipment to the next; and b) Quality varied too much within the industry — someproducers provide consistent and reliable quality, others do not. Sod growers who sell productsof inferior quality undermine the reputation of everyone. Providing consistent and reliablequality through a grades and standards program is critical in the long run for the industry. Asecond quality issue pertained to harvesting. Sod is often harvested immature, then falls apart bythe time the customer gets it. This makes landscapers, or whoever else is responsible for thelawn, look bad; it also raises costs when the sod has to be replaced. Third, sod purity iscompromised too often. Numerous citations were made of unacceptable contamination fromother grasses and weeds. Some people suggested developing a sod certification program (similarto grades and standards). Related to the purity issue, an unacceptable incidence of contaminationfrom pests and diseases was cited. A comment was made that producers need to clean up theirsod before selling it. Fourth, respondents complained that producers weren’t careful enoughabout sod perishability — often it is nearly dead by the time it arrives. Buyers recommendsupplying it fresher and cutting it with longer roots for quicker, more successful establishment. Fifth, storage is a major issue that has been ignored. Buyers desperately need longer shelf lifefor sod. Suggestions included allowing more space between the rolls or stacks and to considersmaller pallets for nurseries. Garden centers felt they could sell more sod if smaller pallets wereoffered in conjunction with more frequent deliveries. Nurseries lack space to lay out and watersod. Sixth, incompatible soil types — soils that come with sod are often different from the

24
customer’s soil, which complicates the establishment process. Producers should try to provide acloser match between their own soils and the soils of their customers.
5. Education & Marketing. The industry should promote the benefits of sod. First, developcomparisons between sod and seed from several perspectives: a) time standpoint — customer isprovided with an “instant” lawn; b) convenience — sod eliminates tracking in mud and dirt intonewly built homes; c) environmental benefits — sod filters out contaminants from cars andtrucks and prevents or reduces soil erosion; d) aesthetic features — sod provides a beautifulcover in city parks and is a clean place for children to play; and e) economic — seed requires 1–2years to attain the same quality as sod. Second, consider educating allied industries. Manybusinesses use sod directly, or rely on it indirectly. Architects and developers, for example, usesod but are less aware of its advantages, or the true costs of seeded areas. If businesses wereconvinced of sod’s benefits, they would use it more. Third, provide more advertising at theregional and national level. The public needs more exposure. Consumers need to be targeted,not just the garden centers or landscape businesses. If consumers want sod, they will inform thegarden centers, who in turn will supply more of it. Producers often advertise in the wrong places,like trade magazines, rather than targeting media their customers listen to or read. Market moreto sports turf businesses, an overlooked market, by promoting the benefits of sod over artificialturf.
6. Professionalism. First, producers should be more credible by standing behind their productthrough guarantees. The industry has a bad reputation of stepping away from responsibility oncea sale is made. Growers should recognize their obligations, particularly with regard to delivery. Obtaining on-time delivery is a problem, so work closer with shipping firms. Second, brokersoften behave unprofessionally by being too cut-throat. The sod industry should work closer withbrokers.
Part IV: Market Expansion Strategies
Results of this research indicate that sod producers in the eastern portion of the United Stateshave ample opportunities to increase demand for their product. Producers need to take individualand collective action to reap the full potential of the market. The recommendations that followhighlight some of the more significant market opportunities for producers; however, they shouldnot be viewed as the only ones. Indeed, if one message is clear from this research, opportunitiesare nearly limitless and sod producers merely need to become committed in their attitude andpractical in their approach. With an economy still on firm ground, housing starts showing nosign of diminishing, and the work force at full employment, the demand for sod should remainstrong in the foreseeable future.
1. Diversify distribution. Research results indicate that there is far too much concentration atthe farm/wholesale level. The distribution flow of sod is too restricted. Potential buyers needmore access. If more sod is moved to the retail sector — whether through retail chains,independent garden centers, or perhaps even “sod depots” established by producers — soddemand will increase. To do this, it means that producers must become more flexible in theirbusiness practices. In other words, producers must overcome their tendency towards selling sod

25
only in large shipments. Targeting more sod at the retail level requires selling smaller quantitiesto meet the constraints of the nurseries and garden centers. Nurseries stated repeatedly that theycould sell a lot more sod if they were allowed to purchase smaller inventories. Even large retailchains are faced with space limitations when it comes to maintaining sod.
Similarly, producers should be willing to work with the retail sector to devise technologiesfor increasing the length of time sod can be stored. To keep sod from deteriorating once it hasbeen cut, sod needs oxygen and water. To shelve sod, nurseries lay the sod in parking lots, orany other place they can find, and water it. But this requires considerable space, something mostnurseries and garden centers lack. Perhaps a new type of pallet can be devised that allows spacesbetween each sod layer on the pallet. This extra space would allow oxygen to permeate thethatch and a misting system could supply water between the layers. Such a pallet system wouldsave considerable space, allow more sod to be stored, improve on sod quality that is considered apremium feature, and result in substantially greater volumes of sod bought and sold.
Finally, producers should avoid shipping sod long distances and unprotected during periodsof extreme heat. Research indicated that frequently the buyer received sod with the ends driedout and burned. This resulted in a “quilting” effect when the sod was laid. In addition,respondents noted that these dead areas were highly prone to weeds within a short period. Noconsumer would be happy with a quilted, weed infested lawn, particularly after spending somuch money purchasing it. The message is — a little care can go a long way in keeping asatisfied customer.
2. Target architects and developers. Architects and developers are the ones that specify whatis to be included, or not included, in a building site. Concentrate on developing educationalmaterial and programs that target architects and developers of commercial and residentialcomplexes. These businesses are highly cost-conscious and need only to be convinced of thebenefits of sod. Rectify misconceptions about the cost of sod by comparing the total costsassociated with seed for the duration it takes to get it fully established. Sod has a bad reputationbecause of the high initial cost, but seed has a prolonged cost that is generally overlooked. If sodwere included in the building budget, sod would actually be a very minor expense. For example,assume that the price of sod is $0.30 square foot laid (land preparation not included since seededlawns also require it) and there is a lawn size of 3,000 square feet. Assume the cost of a newhome is $150,000. Then {$3,000 x 0.3 = nearly $1,000} ÷ {$150,000} = 0.67%, or one-third ofone percent! This is clearly not a financial obstacle by any stretch of the imagination. Theproblem is that sod is not factored into the original budget so that the homeowner is faced withthis additional cost at the very end of the project, something that most people do not anticipateand are not prepared for financially. If it were factored in initially, most homeowners would noteven notice the additional expense. Moreover, if the homeowners were educated as to thebenefits of sod, they would probably insist on it. During the personal interviews, developersnoted that seeding involved considerable aggravation and cost from: a) repeated repairs afterrains; b) fines levied by regulatory agencies for soil run-off; c) irate homeowners that were facedwith dirty homes from months of mud and dirt tracked in by kids, pets, and adults; and d) a badimage for developers from an environmental and a professional standpoint. As one developer inthe northeast — who was in the process of moving entirely out of seed and into sod, whoanticipated being 100% sod in the year 2000 and who was incorporating the cost as a line-item in

26
the budget — put it:
“People who build a home and then seed their lawns end up unhappy. After all that money, children or dogs track in mud and it ruins theentire job. We could have done everything right and built a perfecthome. But the mud and dirt leave a bad taste in their mouths, and theyblame us for it even though it’s not our fault. The problem is that oneangry customer tells ten others and the bad word keeps spreading. This is a very large over-looked cost.”
Producers should also identify local areas that actively enforce fines and other penalties forsoil erosion. Architects and developers in these areas will be particularly receptive to beingintroduced to a viable alternative to seed. Show them the numbers in terms of cost andemphasize the other benefits as well (i.e., avoiding the aggravations associated with maintainingseeded lawns). Consider also contacting city/county agencies and convince them of the manybenefits of sod.
3. Advertise more effectively. Advertising is something most businesses take for granted. Onewould imagine that advertising is commonplace. Results of this research indicate that this maybe an erroneous assumption. Indeed, due primarily to the sustained economic expansion in theU.S., it appears that in most areas of the survey region, demand exceeded supply. Therefore, ifproducers are having trouble moving product, it is not from a lack of market demand. In fact,one of the biggest complaints from customers was their frustrations in trying to find sod. Somenoted that if they did find it, it was too distant to purchase. What this suggests is that a majorobstacle to greater sales for many producers is a lack of basic communication. Producers need tobecome much more aggressive in their advertising. This means not just more advertising, butadvertising more effectively. Identify who your customers are, where they are, and then identifyspecific advertising media that will reach them. Submitting promotional materials in yourindustry trade magazine is not the answer because most of your lay customers will never see it.
The turfgrass industry should consider implementing a top-notch national advertisingcampaign. Average consumers take turfgrass for granted — they think little about how muchgrass contributes to the quality of their lives by providing a safe playing environment for theirchildren, preventing soil erosion, reducing temperatures around the house during hot summerdays, and filtering out harmful chemicals that might otherwise reach vital water supplies. Turfgrass needs more public exposure that promotes its many benefits. A positive image goes along way to alleviate unnecessary government regulations based on misconceptions or ignoranceabout this important product.
4. Improve quality and professionalism. Quality was ranked as the most important purchasingcriterion among buyers. Unfortunately, lack of quality was also a major complaint. Improvingquality needs to be exercised not only from an individual producer standpoint but alsocollectively by the industry. Research results indicates that too much poor quality sod ispresently being distributed. Poor quality from even one producer hurts everyone. Poor qualitycomes in many forms — sod infested with weeds, harmful insects, or disease; sod cut too soonand left sitting in fields waiting for shipment; sod cut improperly (not enough soil, with dullcutting blades, or unevenly) so that it falls apart by the time the customer receives it; sod

27
contaminated with unwanted grasses; etc. The sod production industry should consider strategiesfor improving quality at the local, regional and national levels. Educational programs directed atproducers that emphasize the long-term benefits of quality — benefits for everyone — should bedeveloped. Grades and standards have been brought up before, but such a program has manymerits. Given the importance that buyers attribute to quality, it is clear that producers can usethis easily and effectively to increase demand.
Quality goes way beyond just trying to improve one’s product. Rather, quality involves anattitude, a way of thinking, a philosophy of life that is embraced completely. Quality is athoroughly pragmatic, dollars and cents approach to management that, done honestly anddiligently, will enhance productivity, lower costs and increase net returns to the business. Achieving quality isn’t easy – it is a never ending effort to improve. Quality programs try toimprove the way things are done to avoid or eliminate troubles before they arise, instead ofsolving problems as they come up. The point is, nothing is free, cause and effect are real. If asod producer takes short cuts by reducing fertilizer, weed or pest control programs to savemoney, in the long run it will cost money through a poor quality product. Buyers will rememberpoor quality and soon look elsewhere. Moreover, the more it happens, the faster word spreads,and a negative image begins to encompass the business. In economic good times, a firm mightget away with it, but eventually it will be an “Achilles’ heel” and could easily lead to thetermination of the business.
Numerous respondents complained about late deliveries and/or producers that did not standbehind their product. Professionalism, quality and business success are all inter-related. Acommitment to professional standards and the quality of the product are inseparable. A trueprofessional will not allow poor quality to leave the farm. Similarly, a professional embracesethical business practices, is reliable and efficient, and treats both employees and customers right. Professionals are successful because they do things right, and everyone wants to do business withsomeone who can be trusted, time and time again. Unprofessional behavior hurts everyone —other sod producers, the customers, and even the producer with the unacceptable behavior.
5. Educate producers and consumers. The sod industry really needs to become aggressive atpromoting their product through educational programs. Although most people like sod once theyhave it, serious misconceptions surround it. At least four critical areas should be addressed bysod producers regarding education: 1) Cost – the cost factor has already been discussed, butpeople need to hear about it. Sod is not expensive, people only think it is. Therefore cost is anerroneous perception among consumers. But erroneous perceptions, if they are not corrected,have real life consequences. 2) Convenience – consumers should be educated about the timefactor — that sod provides a beautiful, green lawn with a clean playing environment almostinstantly. This should be an easy sell because Americans are notorious for demanding “instantgratification”. 3) Environment – consumers should be taught about the environmental benefits ofsod, particularly in urban areas where pollutants from street run-off is excessive and dangerous. Research has been done to show that turf acts as a natural filtering device — the homeownerneeds to know about it. 4) Maintenance and Care – sod frequently comes under attack duringperiods of drought because it requires so much water. Actually, sod does not requiredisproportionate amounts of water. The problem is not the sod, it is the homeowner or thebusiness who abuses it. People water lawns far too much. Moreover, the computerized watering

28
systems are a bane to the image of turfgrass because, once installed, the consumers think theirtasks are done — after all, its automatic! The industry should educate consumers to monitor theirirrigation systems regularly to ensure they function properly (all the heads are on properly, thereare no major leaks, etc), that watering regimes are appropriate for the time of year, that thesystem is turned off until the lawn needs additional watering after periods of heavy rainfall, etc. The sod industry should take leadership by working with the irrigation industry in promotingtechnologies that conserve water. In addition, develop inexpensive educational materials, such asbrochures and pamphlets that instruct homeowners how to care for their lawns in anenvironmentally responsible manner. By doing this, community leaders will recognize that theindustry is acting responsibly and be more willing to be a partner during periods of drought,rather than an antagonist and an enforcer.
6. Target off-season periods. Too much emphasis is placed on the spring and summer months. Producers need to identify opportunities during the beginning and end of winter months whenoutdoor activity is down. City/county governments, public and private schools, perhaps evenhomeowners and developers may be receptive to buying sod if conditions are suitable. Since it islikely that sod quality will be inferior during this period, consider selling it cheaper as a “GradeB” material. By selling it at a lower price, more volume may be sold that could help producerswho are faced with unwanted inventories. Naturally, selling in off-periods will be influenced byweather conditions, but small “windows” at the beginning and end of winter may be feasible,particularly for certain areas like roadsides and highway rights-of-way. Moreover, sod has anadvantage over seed in that it is more easily established during these marginal periods. Finally,producers located further south should recognize that these “windows of opportunity” willremain open longer for them.
Many respondents complained about not being able to obtain sod when it was needed. Thisindicates that some markets are not being served adequately. For instance, some peoplecomplained that rural areas were being overlooked because producers were concentrating onlarger volume metropolitan centers. Clearly such markets represent tangible opportunities,perhaps during off-season months. At the very least, this time should be used making contactsfor the spring, lining up customers, and selling as early as conditions allow.
Finally, sod producers should consider contract growing. Several respondents indicated theywould be interested in contracts if they could guarantee supply. Although contracting may not besuitable for everyone, it can be particularly useful for larger volume buyers. Generally, bothparties specify the types of grass, quantities, price(s), and date(s) of delivery. Although itinvolves certain risks to each party (e.g. if the market price of sod is lower than the contractprice at delivery time, the buyer loses. The converse of this would also be true.), contracts can bewritten with contingencies to protect each party. Because of their many inherent benefits, the useof contracts in agriculture continues to grow. It may prudent for the sod production industry toexplore this form of selling further.
29
References
Haydu, J. J. and J. L. Cisar. 1992. “An Economic and Agronomic Profile of Florida’s TurfgrassSod Industry.” Economics Report ER92-1, Food & Resource Economics Department,Institute of Food & Agricultural Sciences, University of Florida.
Haydu, J. J., J. L. Cisar and L. N. Satterthwaite. 1998. “An Economic and Agronomic Profile ofFlorida’s Turfgrass Sod Industry in 1996.” Economics Report ER98-7, Food & ResourceEconomics Department, Institute of Food & Agricultural Sciences, University of Florida.
Johnson, Doyle, C. 1995. “The Future of Sod: A Look into the Crystal Ball.” Speech presentedto Turfgrass Producers International, Orlando, FL, February 9th.