Market Commentary - BB&T Bank · COMMERCIAL & INDUSTRIAL Monthly Update October 2015 Changes in...
9
COMMERCIAL & INDUSTRIAL Monthly Update October 2015 Changes in Stock Prices Market Commentary EBITDA Valuation Multiples 1 Last 12 Months (LTM) Source: Capital IQ. (1) Total enterprise value is defined as equity value plus total debt less cash. Past performance is no guarantee of future results. Source: Capital IQ. 0.0x 2.0x 4.0x 6.0x 8.0x 10.0x 12.0x 14.0x 16.0x 12.7x 12.2x 13.7x 11.1x 10.2x 11.1x 8.7x 7.7x 9.9x 7.9x 8.3x 12.5x 10.0x 10.8x 11.2x 9.5x 9.1x 9.5x 9.2x 8.7x 8.8x 8/31/14 7/31/15 8/31/15 Building Materials Cement, Aggregates & Concrete Commercial Durables Consumer Durables Engineering & Construction Flow Control Industrial Distribution Industrial Equipment 13.1x 12.6x 13.5x All of our publicly traded indices were down during a month that saw the S&P 500 fall 2.6%. Four indices are still up thus far in 2015: Consumer Durables (up 8.9% year-to-date), Building Materials (up 6.8% year-to-date), Cement, Aggregates & Concrete (up 5.7% year-to-date), and Commercial Durables (up 5.4% year-to-date). Three indices have shown significant growth over the last 12 months, with Consumer Durables (31.7% one-year change), Building Materials (21.4% one-year change), and Commercial Durables (13.8% one-year change) up since this time last year. While the ISM – Purchasing Managers’ Index (“PMI”) and ISM – New Orders fell to their lowest levels in the past year, both again indicated expansion with readings above 50. The PMI has shown expansion in the manufacturing sector for 33 consecutive months, while the ISM-New Orders has indicated growth for 34 consecutive months. M&A activity remains high, and the BB&T Capital Markets Commercial & Industrial Investment Banking Group recently closed the sale of Safemark Systems from Milestone Partners to MSouth Equity Partners on September 14, 2015. (30.0%) (20.0%) (10.0%) 0.0% 10.0% 20.0% 30.0% 40.0% (4.6%) (8.2%) 6.2%) (4.1%) (8.8%) (7.8%) (20.0%) (23.0%) (7.6%) (17.8%) (22.0%) (8.9%) (23.1%) (12.4%) (28.3%) 21.4% 6.8% 0.3% 5.7% (11.4%) 13.8% 5.4% 31.7% 8.9% Building Materials Cement, Aggregates & Concrete Commercial Durables Consumer Durables Engineering & Construction Flow Control Industrial Distribution Industrial Equipment One-Year Change YTD Change One-Month Change
Transcript of Market Commentary - BB&T Bank · COMMERCIAL & INDUSTRIAL Monthly Update October 2015 Changes in...

COMMERCIAL & INDUSTRIAL
Monthly Update October 2015
Changes in Stock Prices
Market Commentary
EBITDA Valuation Multiples1
Last 12 Months (LTM)
Source: Capital IQ.(1) Total enterprise value is defined as equity value plus total debt less cash. Past performance is no guarantee of future results.
Source: Capital IQ.
0.0x
2.0x
4.0x
6.0x
8.0x
10.0x
12.0x
14.0x
16.0x
12.7x12.2x
13.7x
11.1x10.2x
11.1x
8.7x7.7x
9.9x
7.9x8.3x
12.5x
10.0x10.8x
11.2x
9.5x 9.1x9.5x 9.2x
8.7x8.8x
8/31/14 7/31/15 8/31/15
Building Materials
Cement, Aggregates & Concrete
CommercialDurables
ConsumerDurables
Engineering& Construction
Flow Control Industrial Distribution
Industrial Equipment
13.1x12.6x
13.5x
All of our publicly traded indices were down during a month that saw the S&P 500 fall 2.6%. Four indices are still up thus far in 2015: Consumer Durables (up 8.9% year-to-date), Building Materials (up 6.8% year-to-date), Cement, Aggregates & Concrete (up 5.7% year-to-date), and Commercial Durables (up 5.4% year-to-date). Three indices have shown significant growth over the last 12 months, with Consumer Durables (31.7% one-year change), Building Materials (21.4% one-year change), and Commercial Durables (13.8% one-year change) up since this time last year. While the ISM – Purchasing Managers’ Index (“PMI”) and ISM – New Orders fell to their lowest levels in the past year, both again indicated expansion with readings above 50. The PMI has shown expansion in the manufacturing sector for 33 consecutive months, while the ISM-New Orders has indicated growth for 34 consecutive months. M&A activity remains high, and the BB&T Capital Markets Commercial & Industrial Investment Banking Group recently closed the sale of Safemark Systems from Milestone Partners to MSouth Equity Partners on September 14, 2015.
(30.0%)
(20.0%)
(10.0%)
0.0%
10.0%
20.0%
30.0%
40.0%
(4.6%)(8.2%)
6.2%)(4.1%)
(8.8%) (7.8%)
(20.0%)(23.0%)
(7.6%)
(17.8%)(22.0%)
(8.9%)
(23.1%)
(12.4%)
(28.3%)
21.4%
6.8%
0.3%
5.7%
(11.4%)
13.8%
5.4%
31.7%
8.9%
Building Materials
Cement, Aggregates & Concrete
CommercialDurables
ConsumerDurables
Engineering& Construction
Flow Control Industrial Distribution
Industrial Equipment
One-Year Change YTD Change One-Month Change
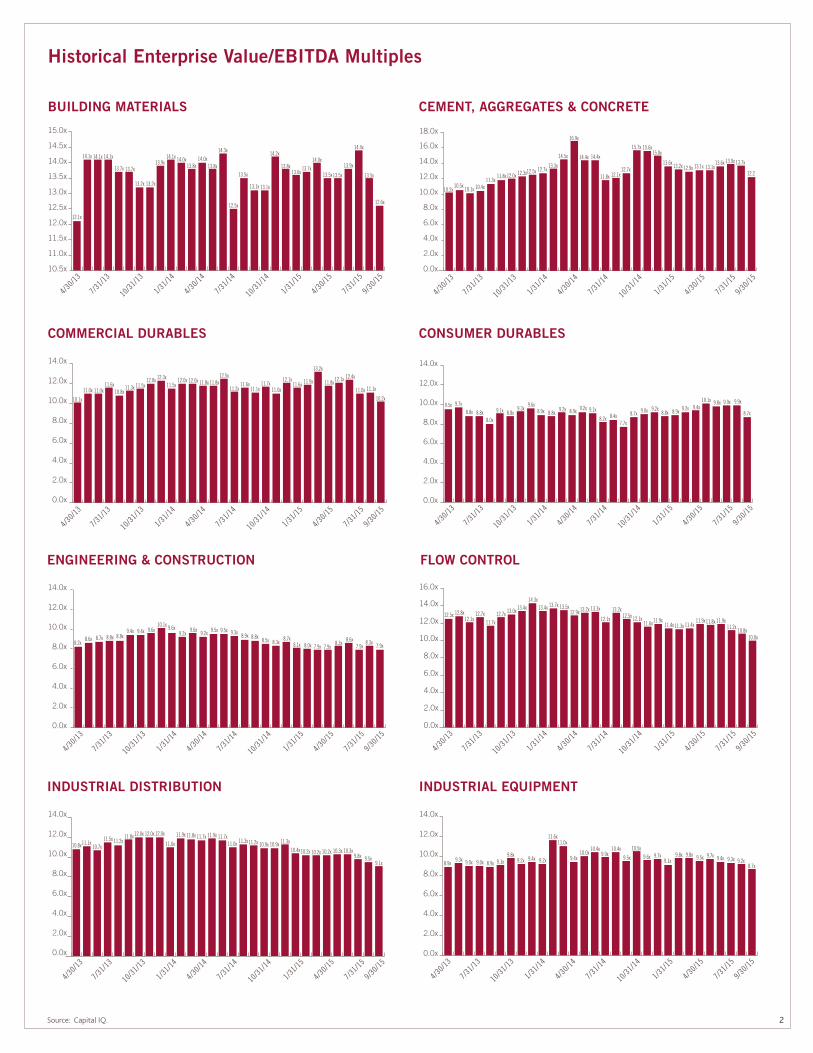
Historical Enterprise Value/EBITDA Multiples
BUILDING MATERIALS
ENGINEERING & CONSTRUCTION
COMMERCIAL DURABLES
INDUSTRIAL DISTRIBUTION
CEMENT, AGGREGATES & CONCRETE
FLOW CONTROL
CONSUMER DURABLES
INDUSTRIAL EQUIPMENT
4/30
/15
7/31
/15
9/30
/15
1/31
/15
10/3
1/14
7/31
/14
1/31
/14
4/30
/14
10/3
1/13
7/31
/13
4/30
/13
13.7x
12.1x
14.1x 14.1x 14.1x
13.7x
13.2x 13.2x
13.9x14.1x 14.0x
13.8x14.0x
13.8x
14.3x
12.5x
13.5x
13.1x 13.1x
14.2x
13.8x13.6x
13.7x14.0x
13.5x13.5x
13.9x
14.4x
13.5x
12.6x
10.5x
11.0x
11.5x
12.0x
12.5x
13.0x
13.5x
14.0x
14.5x
15.0x
0.0x
2.0x
4.0x
6.0x
8.0x
10.0x
12.0x
14.0x
4/30
/15
7/31
/15
9/30
/15
1/31
/15
10/3
1/14
7/31
/14
1/31
/14
4/30
/14
10/3
1/13
7/31
/13
4/30
/13
11.3x
10.1x
11.0x 11.0x11.6x
10.8x11.5x
12.0x 12.3x11.5x
12.0x 12.0x 11.8x 11.8x12.5x
11.2x11.6x
11.1x11.7x
11.0x
12.1x11.6x 11.9x
13.2x
11.8x12.1x 12.4x
11.0x 11.1x
10.2x
0.0x
2.0x
4.0x
6.0x
8.0x
10.0x
12.0x
14.0x
4/30
/15
7/31
/15
9/30
/15
1/31
/15
10/3
1/14
7/31
/14
1/31
/14
4/30
/14
10/3
1/13
7/31
/13
4/30
/13
9.4x
8.2x8.6x 8.7x 8.8x 8.8x
9.4x 9.6x10.1x 9.6x
9.2x9.6x 9.2x 9.5x 9.5x 9.3x 8.9x 8.8x
8.5x 8.3x8.7x
8.1x 8.0x 7.9x 7.9x8.3x
8.6x7.9x
8.3x 7.9x
0.0x
2.0x
4.0x
6.0x
8.0x
10.0x
12.0x
14.0x
11.8x
10.8x11.1x10.7x
11.5x 11.2x12.0x 12.0x 12.0x
11.0x
11.9x 11.8x 11.7x 11.9x 11.7x11.0x 11.3x11.2x 10.9x 10.9x 11.3x
10.4x10.2x 10.2x 10.2x 10.3x 10.3x9.8x 9.5x
9.1x
4/30
/15
7/31
/15
9/30
/15
1/31
/15
10/3
1/14
7/31
/14
1/31
/14
4/30
/14
10/3
1/13
7/31
/13
4/30
/13
0.0x
2.0x
4.0x
6.0x
8.0x
10.0x
12.0x
14.0x
16.0x
18.0x
4/30
/15
7/31
/15
9/30
/15
1/31
/15
10/3
1/14
7/31
/14
1/31
/14
4/30
/14
10/3
1/13
7/31
/13
4/30
/13
11.8x
10.2x10.5x
10.1x 10.4x11.3x
12.0x 12.3x12.5x 12.7x13.3x
14.5x
16.9x
14.4x 14.4x
11.8x 12.1x12.7x
15.7x 15.6x15.0x
13.6x 13.2x 12.9x 13.1x 13.1x13.6x 13.9x 13.7x
12.2
4/30
/15
7/31
/15
9/30
/15
1/31
/15
10/3
1/14
7/31
/14
1/31
/14
4/30
/14
10/3
1/13
7/31
/13
4/30
/13
0.0x
2.0x
4.0x
6.0x
8.0x
10.0x
12.0x
14.0x
9.1x9.5x 9.7x
8.8x 8.8x8.0x
8.8x9.3x
9.6x8.9x 8.8x
9.2x 8.9x 9.2x 9.1x
8.2x 8.4x7.7x
8.7x 9.0x 9.2x8.8x 8.9x 9.2x 9.4x
10.1x 9.8x 9.9x 9.9x
8.7x
0.0x
2.0x
4.0x
6.0x
8.0x
10.0x
12.0x
14.0x
16.0x
4/30
/15
7/31
/15
9/30
/15
1/31
/15
10/3
1/14
7/31
/14
1/31
/14
4/30
/14
10/3
1/13
7/31
/13
4/30
/13
12.7x12.5x 12.8x12.1x
12.7x11.7x
13.0x 13.4x14.3x
13.4x 13.7x 13.5x12.9x13.2x 13.3x
12.1x
13.2x12.5x 12.1x
11.6x11.9x11.4x11.3x 11.4x
11.9x11.8x 11.9x11.2x
10.8x10.0x
0.0x
2.0x
4.0x
6.0x
8.0x
10.0x
12.0x
14.0x
4/30
/15
7/31
/15
9/30
/15
1/31
/15
10/3
1/14
7/31
/14
1/31
/14
4/30
/14
10/3
1/13
7/31
/13
4/30
/13
9.1x8.9x9.3x 9.0x 9.0x 8.9x
9.8x9.2x 9.4x 9.2x
11.6x11.0x
9.4x10.0x
10.4x9.9x
10.4x
9.5x
10.5x9.6x 9.7x
9.1x9.8x 9.8x 9.5x 9.7x 9.4x 9.3x 9.2x
8.7x
Source: Capital IQ. 2

$ in millions (except for stock price) Market Data Financial Performance Valuation MultiplesTotal LTM TEV/LTM
TickerStock Price
8/31/15% of
52-Week HighEquity Value
Enterprise Value
Total Sales EBITDA
EBITDA Margin
Total Sales EBITDA EBIT
Armstrong World Industries, Inc. AWI $47.74 78.6% $2,640 $3,475 $2,450 $301 12.3% 1.4x 11.6x 19.2xBeacon Roofing Supply, Inc. BECN 32.49 87.6% 1,615 1,889 2,454 135 5.5% 0.8x 14.0x 20.5xBluelinx Holdings Inc. BXC 0.70 51.9% 63 539 1,975 25 1.3% 0.3x NM NM
Builders FirstSource, Inc. BLDR 12.68 76.0% 1,377 1,745 1,664 69 4.1% 1.0x NM NMContinental Building Products CBPX 20.54 84.8% 867 1,180 438 126 28.7% 2.7x 9.4x 15.9xFortune Brands Home & Security, Inc. FBHS 47.47 89.5% 7,592 8,761 4,213 527 12.5% 2.1x 16.6x 20.2x
HD Supply Holdings, Inc. HDS 28.62 77.8% 5,700 10,810 9,097 856 9.4% 1.2x 12.6x 17.5xInstalled Building Products IBP 25.28 84.4% 793 889 575 52 9.1% 1.5x 17.1x 27.1xLeggett & Platt, Incorporated LEG 41.25 80.4% 5,644 6,413 3,914 481 12.3% 1.6x 13.3x 18.3x
Masco Corporation MAS 25.18 88.1% 8,661 10,757 8,603 1,064 12.4% 1.3x 10.1x 12.3x
Owens Corning OC 41.91 87.5% 4,927 7,064 5,264 733 13.9% 1.3x 9.6x 16.7xPly Gem Holdings, Inc. PGEM 11.70 76.5% 795 1,816 1,766 140 7.9% 1.0x 13.0x 23.0xQuanex Building Products Corporation NX 18.17 82.9% 616 681 614 49 8.0% 1.1x 13.9x NMTrex Company, Inc. TREX 33.33 57.7% 1,068 1,102 427 96 22.6% 2.6x 11.4x 15.7xUSG Corporation USG 26.62 81.0% 3,872 5,768 3,805 470 12.4% 1.5x 12.3x 19.7xMEDIAN: 81.0% $1,615 $1,889 $2,450 $140 12.3% 1.3X 12.6X 17.1XAstec Industries, Inc. ASTE $33.51 73.7% $770 $766 $1,016 $84 8.3% 0.8x 9.1x 13.0xCEMEX, S.A.B. de C.V. CX 6.99 55.2% 12,633 29,275 13,978 2,638 18.9% 2.1x 11.1x NMCRH plc ISE:CRG 26.23 83.1% 21,566 23,047 22,231 1,896 8.5% 1.0x 12.2x 20.9x
Eagle Materials Inc. EXP 68.32 67.2% 3,447 3,963 1,085 313 28.8% 3.7x 12.7x 17.3xMartin Marietta Materials, Inc. MLM 151.95 85.0% 10,181 11,796 3,180 708 22.3% 3.7x 16.7x 27.0xVulcan Materials Company VMC 89.20 86.9% 11,880 13,852 3,155 679 21.5% 4.4x NM NMMEDIAN: 78.4% $11,031 $12,824 $3,167 $693 20.2% 2.9X 12.2X 19.1XAcuity Brands, Inc. AYI $175.58 82.9% $7,645 $7,347 $2,616 $420 16.1% 2.8x 17.5x 19.6xHerman Miller, Inc. MLHR 28.84 89.1% 1,726 1,968 2,198 224 10.2% 0.9x 8.8x 10.8xHNI Corporation HNI 42.90 74.3% 1,903 2,169 2,353 212 9.0% 0.9x 10.2x 13.6xHubbell Incorporated HUB.B 84.95 66.7% 5,075 5,228 3,428 600 17.5% 1.5x 8.7x 10.0x
Interface, Inc. TILE 22.44 82.6% 1,478 1,665 1,025 134 13.1% 1.6x 12.4x 16.5xKimball International, Inc. KBAL 9.46 50.6% 355 321 546 NM NM 0.6x NM NM
Knoll, Inc. KNL 21.98 84.3% 1,072 1,336 1,090 122 11.2% 1.2x 11.0x 13.1xSteelcase Inc. SCS 18.30 89.5% 2,249 2,323 3,074 270 8.8% 0.8x 8.6x 11.3xMEDIAN: 82.7% $1,814 $2,068 $2,275 $224 11.2% 1.1X 10.2X 13.1XAaron's, Inc. AAN $36.11 90.1% $2,621 $3,025 $3,068 $430 14.0% 1.0x 7.0x 8.6xBassett Furniture Industries Inc. BSET 27.85 72.1% 303 272 410 34 8.4% 0.7x 7.9x 10.8x
Dorel Industries Inc. DII.B 23.49 74.7% 760 1,350 2,709 146 5.4% 0.5x 9.2x 13.4x
Ethan Allen Interiors Inc. ETH 26.41 80.9% 750 750 755 85 11.3% 1.0x 8.8x 11.4x
Flexsteel Industries, Inc. FLXS 31.25 67.8% 234 245 467 40 8.5% 0.5x 6.2x 7.1x
Hooker Furniture Corporation HOFT 23.54 86.2% 254 210 249 25 9.9% 0.8x 8.5x 9.3xLa-Z-Boy Incorporated LZB 26.56 91.6% 1,343 1,254 1,440 130 9.0% 0.9x 9.6x 11.7xMohawk Industries, Inc. MHK 181.79 85.7% 13,437 16,769 7,865 1,242 15.8% 2.1x 13.5x 18.5x
Stanley Furniture Company, Inc. STLY 2.93 80.5% 44 39 60 0 0.2% 0.7x NM NM
MEDIAN: 80.9% $750 $750 $755 $85 9.0% 0.8X 8.7X 11.1XABM Industries Inc. ABM $27.31 80.3% $1,534 $1,788 $5,207 $148 2.8% 0.3x 12.0x $28.31 Comfort Systems USA, Inc. FIX 27.26 89.9% 1,019 1,015 1,513 88 5.8% 0.7x 11.6x 27.26 Dycom Industries, Inc. DY 72.36 89.5% 2,405 2,909 2,022 252 12.5% 1.4x 11.5x 72.36 EMCOR Group, Inc. EME 44.25 90.5% 2,779 2,748 6,523 346 5.3% 0.4x 7.9x 44.25 Fluor Corporation FLR 42.35 60.8% 6,138 5,346 20,254 1,348 6.7% 0.3x 4.0x 42.35 Granite Construction Incorporated GVA 29.67 75.9% 1,168 1,050 2,299 115 5.0% 0.5x 9.1x 29.67 Great Lakes Dredge & Dock Corp. GLDD 5.04 57.7% 305 645 861 81 9.4% 0.7x 8.0x 5.04 Jacobs Engineering Group Inc. JEC 37.43 75.0% 4,634 4,812 12,216 840 6.9% 0.4x 5.7x 37.43 KBR, Inc. KBR 16.66 80.2% 2,405 1,738 5,891 (133) NM 0.3x NM 16.66 MasTec, Inc. MTZ 15.83 51.6% 1,264 2,478 4,617 349 7.6% 0.5x 7.1x 15.83 MYR Group Inc. MYRG 26.20 81.3% 551 504 1,020 95 9.3% 0.5x 5.3x 26.20 Orion Marine Group, Inc ORN 5.98 49.4% 163 175 382 32 8.5% 0.5x 5.4x 5.98 Primoris Services Corporation PRIM 17.91 60.6% 926 1,074 1,977 134 6.8% 0.5x 8.0x 17.91 Quanta Services, Inc. PWR 24.21 66.6% 5,199 5,364 8,011 650 8.1% 0.7x 8.2x 24.21 Sterling Construction Co., Inc. STRL 4.11 44.5% 81 111 638 (4) NM 0.2x NM 4.11 Team, Inc. TISI 32.12 67.5% 672 723 842 91 10.8% 0.9x 7.9x 32.12 Tutor Perini Corporation TPC 16.46 56.3% 808 1,594 4,831 231 4.8% 0.3x 6.9x 16.46
MEDIAN: 67.5% $1,168 $1,594 $2,299 $134 6.9% 0.5X 7.9X 13.0X
Publicly Traded CompaniesCE
MENT
, AGG
REGA
TES
& CO
NCRE
TEBU
ILDI
NG M
ATER
IALS
Source: Capital IQ.Bolded companies represent BB&T Capital Markets Equity Research coverage. Past performance is no guarantee of future results.
CONS
UMER
DUR
ABLE
SCO
MM
ERCI
AL D
URAB
LES
ENGI
NEER
ING
& CO
NSTR
UCTI
ON
3
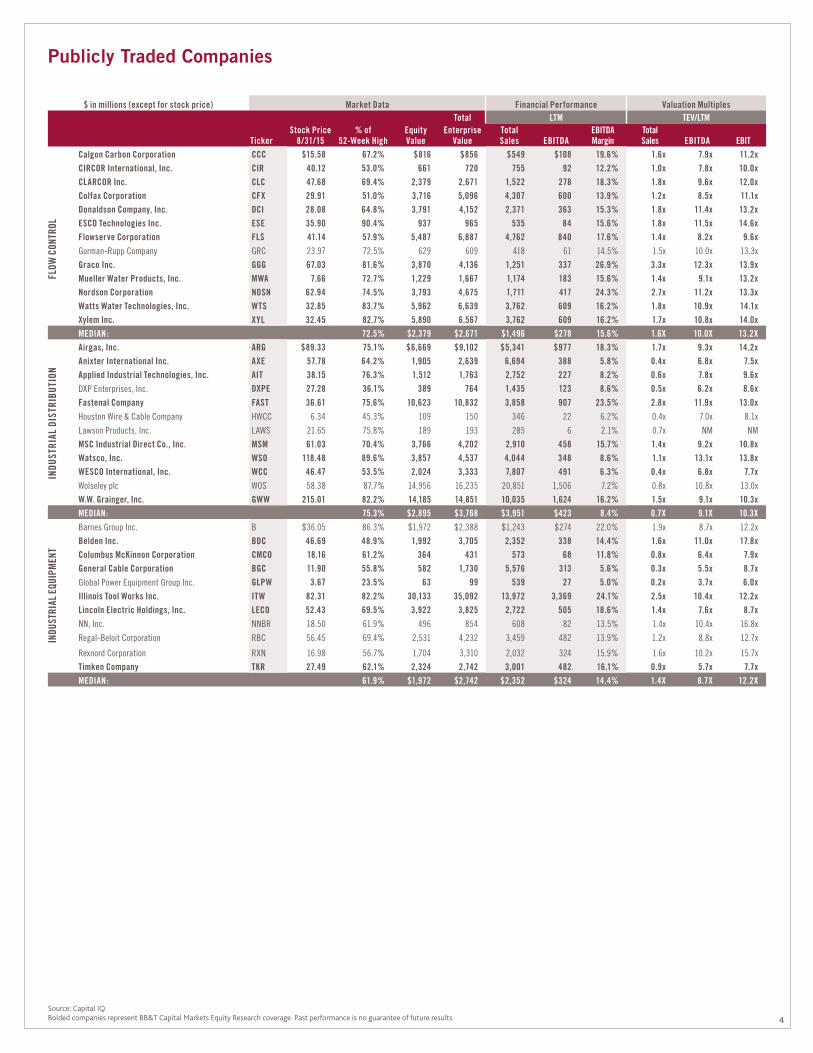
Publicly Traded Companies
Source: Capital IQ.Bolded companies represent BB&T Capital Markets Equity Research coverage. Past performance is no guarantee of future results.
$ in millions (except for stock price) Market Data Financial Performance Valuation MultiplesTotal LTM TEV/LTM
TickerStock Price
8/31/15% of
52-Week HighEquity Value
Enterprise Value
Total Sales EBITDA
EBITDA Margin
Total Sales EBITDA EBIT
Calgon Carbon Corporation CCC $15.58 67.2% $816 $856 $549 $108 19.6% 1.6x 7.9x 11.2xCIRCOR International, Inc. CIR 40.12 53.0% 661 720 755 92 12.2% 1.0x 7.8x 10.0xCLARCOR Inc. CLC 47.68 69.4% 2,379 2,671 1,522 278 18.3% 1.8x 9.6x 12.0xColfax Corporation CFX 29.91 51.0% 3,716 5,096 4,307 600 13.9% 1.2x 8.5x 11.1xDonaldson Company, Inc. DCI 28.08 64.8% 3,791 4,152 2,371 363 15.3% 1.8x 11.4x 13.2xESCO Technologies Inc. ESE 35.90 90.4% 937 965 535 84 15.6% 1.8x 11.5x 14.6xFlowserve Corporation FLS 41.14 57.9% 5,487 6,887 4,762 840 17.6% 1.4x 8.2x 9.6xGorman-Rupp Company GRC 23.97 72.5% 629 609 418 61 14.5% 1.5x 10.0x 13.3x
Graco Inc. GGG 67.03 81.6% 3,870 4,136 1,251 337 26.9% 3.3x 12.3x 13.9xMueller Water Products, Inc. MWA 7.66 72.7% 1,229 1,667 1,174 183 15.6% 1.4x 9.1x 13.2xNordson Corporation NDSN 62.94 74.5% 3,793 4,675 1,711 417 24.3% 2.7x 11.2x 13.3xWatts Water Technologies, Inc. WTS 32.85 83.7% 5,962 6,639 3,762 609 16.2% 1.8x 10.9x 14.1xXylem Inc. XYL 32.45 82.7% 5,890 6,567 3,762 609 16.2% 1.7x 10.8x 14.0xMEDIAN: 72.5% $2,379 $2,671 $1,496 $278 15.6% 1.6X 10.0X 13.2XAirgas, Inc. ARG $89.33 75.1% $6,669 $9,102 $5,341 $977 18.3% 1.7x 9.3x 14.2xAnixter International Inc. AXE 57.78 64.2% 1,905 2,639 6,694 388 5.8% 0.4x 6.8x 7.5xApplied Industrial Technologies, Inc. AIT 38.15 76.3% 1,512 1,763 2,752 227 8.2% 0.6x 7.8x 9.6xDXP Enterprises, Inc. DXPE 27.28 36.1% 389 764 1,435 123 8.6% 0.5x 6.2x 8.6xFastenal Company FAST 36.61 75.6% 10,623 10,832 3,858 907 23.5% 2.8x 11.9x 13.0xHouston Wire & Cable Company HWCC 6.34 45.3% 109 150 346 22 6.2% 0.4x 7.0x 8.1x
Lawson Products, Inc. LAWS 21.65 75.8% 189 193 285 6 2.1% 0.7x NM NM
MSC Industrial Direct Co., Inc. MSM 61.03 70.4% 3,766 4,202 2,910 458 15.7% 1.4x 9.2x 10.8xWatsco, Inc. WSO 118.48 89.6% 3,857 4,537 4,044 348 8.6% 1.1x 13.1x 13.8xWESCO International, Inc. WCC 46.47 53.5% 2,024 3,333 7,807 491 6.3% 0.4x 6.8x 7.7xWolseley plc WOS 58.38 87.7% 14,956 16,235 20,851 1,506 7.2% 0.8x 10.8x 13.0x
W.W. Grainger, Inc. GWW 215.01 82.2% 14,185 14,851 10,035 1,624 16.2% 1.5x 9.1x 10.3xMEDIAN: 75.3% $2,895 $3,768 $3,951 $423 8.4% 0.7X 9.1X 10.3XBarnes Group Inc. B $36.05 86.3% $1,972 $2,388 $1,243 $274 22.0% 1.9x 8.7x 12.2x
Belden Inc. BDC 46.69 48.9% 1,992 3,705 2,352 338 14.4% 1.6x 11.0x 17.8xColumbus McKinnon Corporation CMCO 18.16 61.2% 364 431 573 68 11.8% 0.8x 6.4x 7.9xGeneral Cable Corporation BGC 11.90 55.8% 582 1,730 5,576 313 5.6% 0.3x 5.5x 8.7xGlobal Power Equipment Group Inc. GLPW 3.67 23.5% 63 99 539 27 5.0% 0.2x 3.7x 6.0xIllinois Tool Works Inc. ITW 82.31 82.2% 30,133 35,092 13,972 3,369 24.1% 2.5x 10.4x 12.2xLincoln Electric Holdings, Inc. LECO 52.43 69.5% 3,922 3,825 2,722 505 18.6% 1.4x 7.6x 8.7xNN, Inc. NNBR 18.50 61.9% 496 854 608 82 13.5% 1.4x 10.4x 16.8x
Regal-Beloit Corporation RBC 56.45 69.4% 2,531 4,232 3,459 482 13.9% 1.2x 8.8x 12.7x
Rexnord Corporation RXN 16.98 56.7% 1,704 3,310 2,032 324 15.9% 1.6x 10.2x 15.7x
Timken Company TKR 27.49 62.1% 2,324 2,742 3,001 482 16.1% 0.9x 5.7x 7.7xMEDIAN: 61.9% $1,972 $2,742 $2,352 $324 14.4% 1.4X 8.7X 12.2X
INDU
STRI
AL D
ISTR
IBUT
ION
FLOW
CON
TROL
INDU
STRI
AL E
QUIP
MEN
T
4
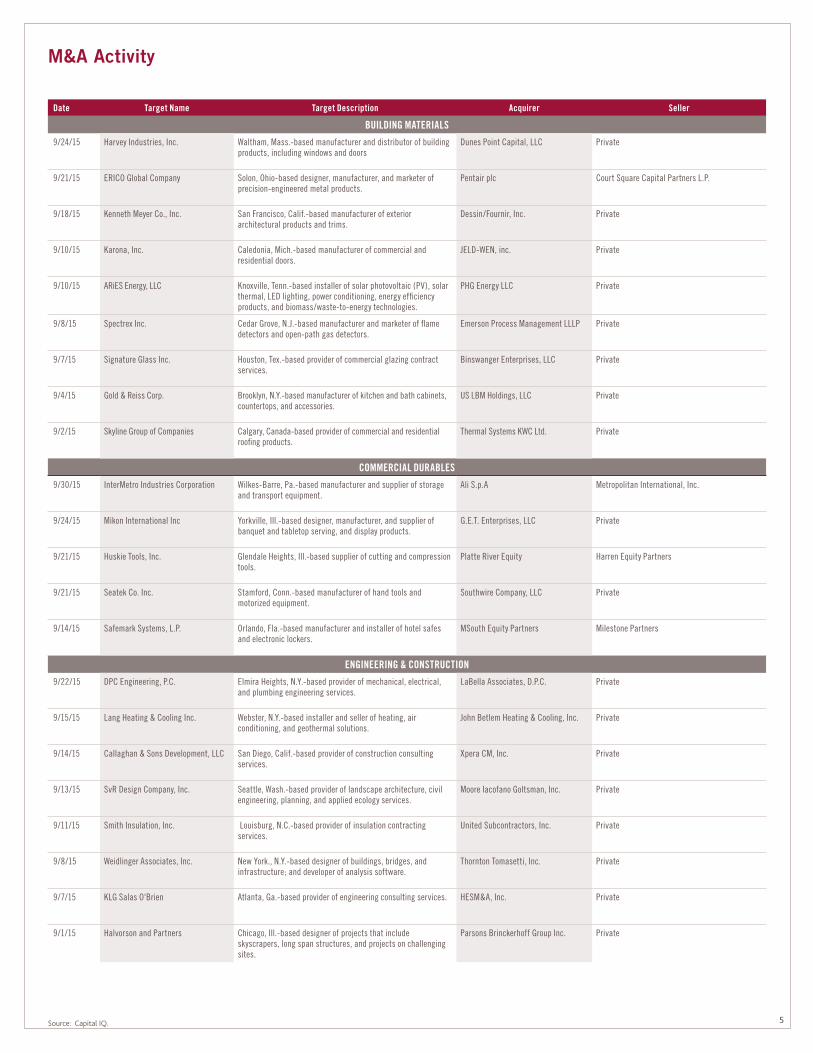
M&A Activity
Source: Capital IQ.
Date Target Name Target Description Acquirer Seller
BUILDING MATERIALS
9/24/15 Harvey Industries, Inc. Waltham, Mass.-based manufacturer and distributor of building products, including windows and doors
Dunes Point Capital, LLC Private
9/21/15 ERICO Global Company Solon, Ohio-based designer, manufacturer, and marketer of precision-engineered metal products.
Pentair plc Court Square Capital Partners L.P.
9/18/15 Kenneth Meyer Co., Inc. San Francisco, Calif.-based manufacturer of exterior architectural products and trims.
Dessin/Fournir, Inc. Private
9/10/15 Karona, Inc. Caledonia, Mich.-based manufacturer of commercial and residential doors.
JELD-WEN, inc. Private
9/10/15 ARiES Energy, LLC Knoxville, Tenn.-based installer of solar photovoltaic (PV), solar thermal, LED lighting, power conditioning, energy efficiency products, and biomass/waste-to-energy technologies.
PHG Energy LLC Private
9/8/15 Spectrex Inc. Cedar Grove, N.J.-based manufacturer and marketer of flame detectors and open-path gas detectors.
Emerson Process Management LLLP Private
9/7/15 Signature Glass Inc. Houston, Tex.-based provider of commercial glazing contract services.
Binswanger Enterprises, LLC Private
9/4/15 Gold & Reiss Corp. Brooklyn, N.Y.-based manufacturer of kitchen and bath cabinets, countertops, and accessories.
US LBM Holdings, LLC Private
9/2/15 Skyline Group of Companies Calgary, Canada-based provider of commercial and residential roofing products.
Thermal Systems KWC Ltd. Private
COMMERCIAL DURABLES
9/30/15 InterMetro Industries Corporation Wilkes-Barre, Pa.-based manufacturer and supplier of storage and transport equipment.
Ali S.p.A Metropolitan International, Inc.
9/24/15 Mikon International Inc Yorkville, Ill.-based designer, manufacturer, and supplier of banquet and tabletop serving, and display products.
G.E.T. Enterprises, LLC Private
9/21/15 Huskie Tools, Inc. Glendale Heights, Ill.-based supplier of cutting and compression tools.
Platte River Equity Harren Equity Partners
9/21/15 Seatek Co. Inc. Stamford, Conn.-based manufacturer of hand tools and motorized equipment.
Southwire Company, LLC Private
9/14/15 Safemark Systems, L.P. Orlando, Fla.-based manufacturer and installer of hotel safes and electronic lockers.
MSouth Equity Partners Milestone Partners
ENGINEERING & CONSTRUCTION
9/22/15 DPC Engineering, P.C. Elmira Heights, N.Y.-based provider of mechanical, electrical, and plumbing engineering services.
LaBella Associates, D.P.C. Private
9/15/15 Lang Heating & Cooling Inc. Webster, N.Y.-based installer and seller of heating, air conditioning, and geothermal solutions.
John Betlem Heating & Cooling, Inc. Private
9/14/15 Callaghan & Sons Development, LLC San Diego, Calif.-based provider of construction consulting services.
Xpera CM, Inc. Private
9/13/15 SvR Design Company, Inc. Seattle, Wash.-based provider of landscape architecture, civil engineering, planning, and applied ecology services.
Moore Iacofano Goltsman, Inc. Private
9/11/15 Smith Insulation, Inc. Louisburg, N.C.-based provider of insulation contracting services.
United Subcontractors, Inc. Private
9/8/15 Weidlinger Associates, Inc. New York., N.Y.-based designer of buildings, bridges, and infrastructure; and developer of analysis software.
Thornton Tomasetti, Inc. Private
9/7/15 KLG Salas O'Brien Atlanta, Ga.-based provider of engineering consulting services. HESM&A, Inc. Private
9/1/15 Halvorson and Partners Chicago, Ill.-based designer of projects that include skyscrapers, long span structures, and projects on challenging sites.
Parsons Brinckerhoff Group Inc. Private
5

Public Equity Activity
Source: Dealogic.
Pricing Date Issuer Ticker Type of Offering Total Offering Amount ($mm) Offer Price % Change Since Pricing
BUILDING MATERIALS
9/11/15 Energy Focus Inc EFOI FO $51.0 $17.00 (25.9%)
9/11/15 Continental Building Products Inc CBPX FO $80.8 $20.20 (5.5%)
INDUSTRIAL EQUIPMENT
9/25/15 Pioneer Power Solutions Inc PPSI FO $4.5 $4.00 (37.5%)
M&A Activity
Date Target Name Target Description Acquirer Seller
FLOW CONTROL
9/8/15 Cortech Engineering, Inc. Yorba Linda, Calif.-based distributor of pumps and process equipment.
DXP Enterprises, Inc. Private
INDUSTRIAL DISTRIBUTION
9/24/15 Graco Supply Company, Inc. Fort Worth, Tex.-based supplier of adhesives, sealants, coatings, lubricants, tapes, and MRO products to aircraft and industrial markets.
CM Equity Partners Cotton Creek Capital Management, LLC; Cold Mountain Capital
9/24/15 Loumac Distributors, Inc. Fort Myers, Fla.-based distributor of furniture items like windows and doors.
US LBM Holdings, LLC Private
9/14/15 Murray Supply Company, LLC Winston-Salem, N.C.-based provider of kitchen and bath solutions, such as faucet, sink, lavatory, toilet, shower/tub, cabinet, and countertop products.
Morrison Supply Company, LLC Private
9/9/15 Power & Environment International, Inc.
Los Angeles, Calif.-based provider of new and refurbished power protection and environmental control equipment.
Global Power Supply, LLC Private
9/4/15 Big Horn Corporation Denison, Tex.-based distributor of woodworking tools and accessories.
American General Tool Group Private
9/1/15 Cut Tech USA, Inc Bellingham, Wash.-based manufacturer of saws and distributor of premier saw equipment.
Burton Saw & Supply Company Private
9/1/15 Gas & Alloy Supply Co. Dallas, Tex.-based provider of industrial, medical, calibration, and spec gases; welding equipment, supplies, and services; and safety gear.
Tech Air of Connecticut, Inc. Private
9/1/15 Environmental Filtration, Inc. Santa Clara, Calif.-based distributor of HVAC filters. Camfil AB Private
INDUSTRIAL EQUIPMENT
9/21/15 Private Systems, Inc. Niagara, N.Y.-based manufacturer and marketer of aluminum and steel precision machines.
Costanzo's Welding Inc. Private
9/18/15 Tecumseh Products Company Ann Arbor, Mich.-based manufacturer and provider of hermetically sealed compressors.
Atlas Holdings LLC; DENO Investment Company II, Inc.
Aegis Financial Corporation; Herrick Foundation, Endowment Arm
9/17/15 Goss International Corporation Woodridge, Ill.-based manufacturer of web offset presses and print finishing systems.
American Industrial Partners Shanghai Electric (Group) Corp.
9/9/15 Greydon, Inc. York, Pa.-based provider of printing equipment. ID Technology, LLC Private
9/4/15 Gloucester Engineering Co., Inc. Gloucester, Mass.-based manufacturer of plastics extrusion machinery.
Davis-Standard, LLC Kabra Extrusiontechnik Ltd.; Blue Wolf Capital Partners LLC
Source: Capital IQ.
6
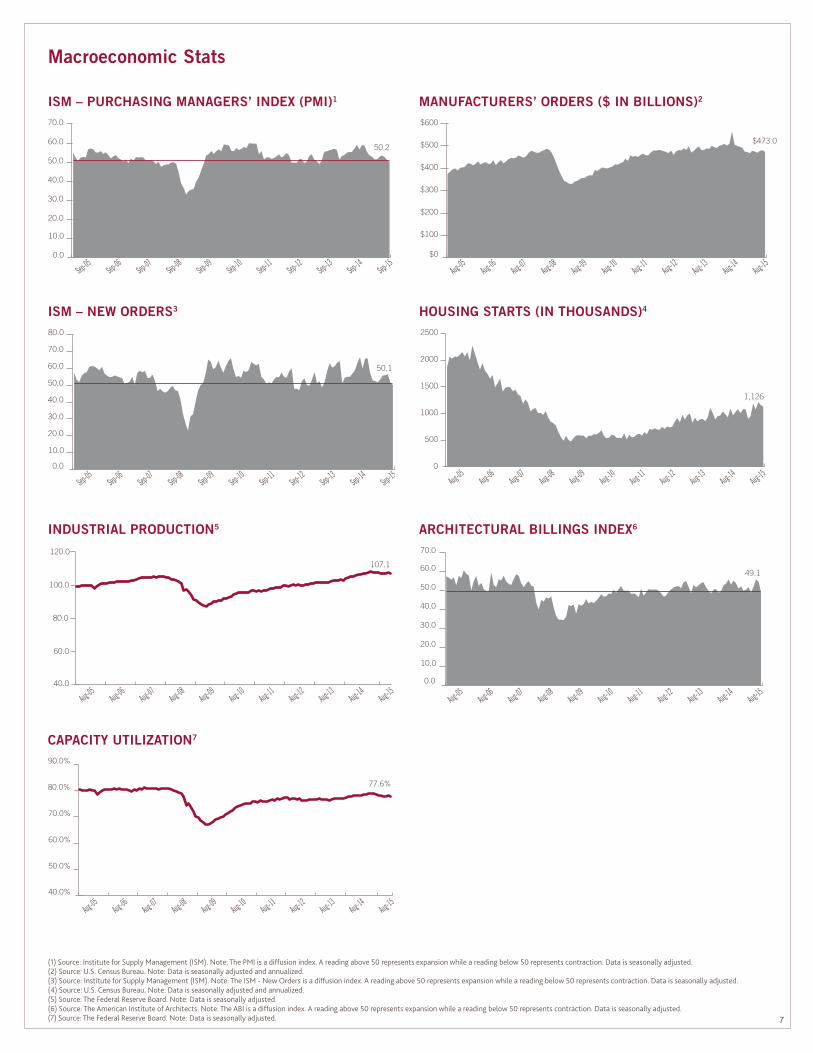
Macroeconomic Stats
ISM – PURCHASING MANAGERS’ INDEX (PMI)1
INDUSTRIAL PRODUCTION5
ISM – NEW ORDERS3
CAPACITY UTILIZATION7
0.0
10.0
20.0
30.0
40.0
50.0
60.0
70.0
Sep-15Sep-14
Sep-13Sep-12
Sep-11Sep-10
Sep-09Sep-08
Sep-07Sep-06
Sep-05
50.2
40.0
60.0
80.0
100.0
120.0
107.1
Aug-15Aug-14
Aug-13Aug-12
Aug-11Aug-10
Aug-09Aug-08
Aug-07Aug-06
Aug-05
40.0%
50.0%
60.0%
70.0%
80.0%
90.0%
77.6%
Aug-15Aug-14
Aug-13Aug-12
Aug-11Aug-10
Aug-09Aug-08
Aug-07Aug-06
Aug-05
0.0
10.0
20.0
30.0
40.0
50.0
60.0
70.0
80.0
50.1
Sep-15Sep-14
Sep-13Sep-12
Sep-11Sep-10
Sep-09Sep-08
Sep-07Sep-06
Sep-05
(1) Source: Institute for Supply Management (ISM). Note: The PMI is a diffusion index. A reading above 50 represents expansion while a reading below 50 represents contraction. Data is seasonally adjusted.(2) Source: U.S. Census Bureau. Note: Data is seasonally adjusted and annualized.(3) Source: Institute for Supply Management (ISM). Note: The ISM - New Orders is a diffusion index. A reading above 50 represents expansion while a reading below 50 represents contraction. Data is seasonally adjusted.(4) Source: U.S. Census Bureau. Note: Data is seasonally adjusted and annualized.(5) Source: The Federal Reserve Board. Note: Data is seasonally adjusted.(6) Source: The American Institute of Architects. Note: The ABI is a diffusion index. A reading above 50 represents expansion while a reading below 50 represents contraction. Data is seasonally adjusted. (7) Source: The Federal Reserve Board. Note: Data is seasonally adjusted.
MANUFACTURERS’ ORDERS ($ IN BILLIONS)2
ARCHITECTURAL BILLINGS INDEX6
HOUSING STARTS (IN THOUSANDS)4
$0
$100
$200
$300
$400
$500
$600
$473.0
Aug-15Aug-14
Aug-13Aug-12
Aug-11Aug-10
Aug-09Aug-08
Aug-07Aug-06
Aug-05
0.0
10.0
20.0
30.0
40.0
50.0
60.0
70.0
49.1
Aug-15Aug-14
Aug-13Aug-12
Aug-11Aug-10
Aug-09Aug-08
Aug-07Aug-06
Aug-05
0
500
1000
1500
2000
2500
1,126
Aug-15Aug-14
Aug-13Aug-12
Aug-11Aug-10
Aug-09Aug-08
Aug-07Aug-06
Aug-05
7
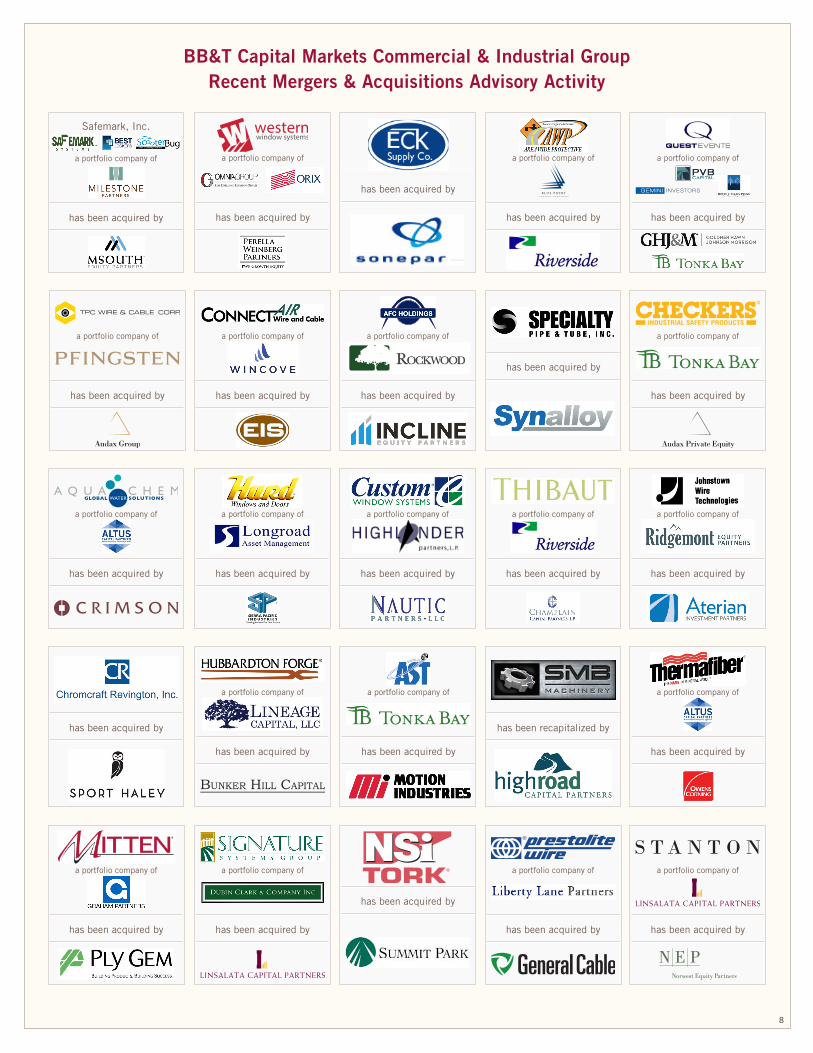
BB&T Capital Markets Commercial & Industrial GroupRecent Mergers & Acquisitions Advisory Activity
8
has been acquired by
a portfolio company of
has been acquired by
a portfolio company of
has been acquired by
a portfolio company of
has been acquired by
a portfolio company of
has been acquired by
a portfolio company of
has been acquired by
Audax Group
a portfolio company of
has been acquired by
a portfolio company of
has been acquired by
a portfolio company of
has been acquired by
a portfolio company of
has been acquired by
a portfolio company of
Safemark, Inc.
has been acquired by
a portfolio company of
has been acquired by
a portfolio company of
has been acquired by
a portfolio company of
has been acquired by
a portfolio company of
has been acquired by
a portfolio company of
has been acquired by
a portfolio company of
has been acquired by
a portfolio company of
has been acquired by
a portfolio company of
has been acquired by
has been acquired by
has been acquired by
has been acquired by
has been recapitalized by
has been acquired by
a portfolio company of
has been acquired by
a portfolio company of

Commercial & Industrial Investment Banking
The BB&T Capital Markets Commercial and Industrial Investment Banking Group provides M&A and capital-raising services to companies in the sector, including:
Investment Banking Services
Mergers & Acquisitions Advisory
n Closed more than 140 M&A deals since 2010
n Focused on middle-market companiesn Services include sell-side M&A,
buy-side M&A, and fairness opinions
Public and Private Equity Financings
n Raised more than $16 billion through public offerings of equity in 2014
n Nationally recognized equity research analysts are supported by strong institutional and retail sales and trading capabilities
Public and Private Debt Financings
n Raised more than $141 billion through fixed-income offerings in 2014
n One of the largest “Off-Wall Street” fixed-income distribution agents in the U.S., with more than 115 associates
n Building Materialsn Cement, Aggregates & Concreten Commercial Durables
n Consumer Durablesn Engineering & Constructionn Flow Control
n Industrial Distributionn Industrial Equipment
BB&T Capital Markets
BB&T Capital Markets offers a full spectrum of capital and advisory solutions including equity and debt underwriting, M&A advisory, corporate banking, equity research and sales and trading. Headquartered in Richmond, Va., with offices throughout the U.S., we have specific expertise within 11 distinct industry verticals including Aerospace, Defense & Government Services; Automotive Aftermarket; Commercial & Industrial; Financial Services; Food & Agribusiness; Logistics & Transportation Services; Healthcare Finance; Education; Energy; Real Estate; and Retail & Consumer. Our commitment to industry expertise, combined with our resources as one of the nation’s largest financial institutions, strategically positions BB&T Capital Markets to build lasting relationships and contribute measurably to the long-term success of each client.
The information contained herein has been obtained from sources that we believe to be reliable and accurate, but we do not guarantee its accuracy or completeness.
BB&T Capital Markets is a division of BB&T Securities, LLC, member FINRA/SIPC. BB&T Securities, LLC, is a wholly owned nonbank subsidiary of BB&T Corporation. Securities or insurance products and annuities sold, offered or recommended are not a deposit, not FDIC insured, not guaranteed by a bank, not guaranteed by any federal government agency and may go down in value.
© 2015, Branch Banking and Trust Company. All rights reserved.
BBTCAPITALMARKE TS.C OM / C & I
Commercial & Industrial GroupMatt Gilman
Co-Head, Managing Director804-782-8780
Ryan MitchellCo-Head, Managing Director
Jonathan Brabrand Managing Director
David KennedyManaging Director
Allan Cruickshanks Vice President804-343-3761
Nicole GuarellaVice President804-782-8760
Patrick Warren Vice President
Chip HoggeAssociate Vice President
804-787-8279 [email protected]
Andy Jones Associate Vice President
Sean BielawskiAssociate
Chris HuberAssociate
C O R P O R A T E B A N K I N G • I N V E S T M E N T B A N K I N G • R I S K M A N A G E M E N T
Connect with us on 9