Responses of IPPs against Incentive Mechanisms for Renewable Generation in Turkey
Upload
eria-economic-research-institute-for-asean-and-east-asiaCategory
view
3download
0description

ERIA-DP-2015-30
ERIA Discussion Paper Series
Market-Based Mechanisms to Promote
Renewable Energy in Asia
Venkatachalam ANBUMOZHI Economist, Economic Research Institute for ASEAN and East Asia
Alex BOWEN London School of Economics and Political Sciences, UK
Puthusserikunnel Devasia JOSE Indian Institute of Management Bangalore, India
April 2015
Abstract: Market-based instruments such as Renewable Energy Certificate (REC) are
increasingly favoured as an alternative to command-and-control legislation to increase
the uptake of renewable energy. Focusing on the renewable energy industry and policy
situation in Asia, this paper analysed the strengths and weaknesses of market-based
approaches in the long-term interest of developing Asia. It found that approaches such as
REC are disadvantaged by a lack of both market acceptance and a strong institutional
and programme support. To identify gaps in the REC system in India, a comparative
analysis with the United Kingdom (UK) model was made. This revealed some
fundamental issues around market-based approaches in Asia, underscoring the need for a
policy design to address the concerns of buyers and sellers in the market.
Keywords: Market-based mechanisms, Renewable Energy, Renewable Obligation,
Regulatory Intervention
JEL Classification: Q41, Q42, Q48

1
1. Introduction
Market-based policy instruments aim to modify the behaviour of economic
entities by changing the financial incentives and disincentives they face. They
typically operate by adjusting relative prices or creating markets that did not
previously exist. A wide range of policies can be considered market-based, including
the imposition or elimination of taxes, fees, or subsidies, and the use of energy
trading systems. Market-based policies construct systems to incorporate the costs
associated with but not normally reflected in market prices, into an entity’s decision-
making process.
Market-based instruments are attractive alternatives to traditional command-and-
control regulatory programmes, particularly for renewable energy uptake and energy
efficiency improvement. They provide firms greater flexibility to cost-effectively
achieve the required renewable energy uptake, allowing them to meet the national
objectives and targets at a lower overall cost. In addition, well-designed market-
based policies can also provide greater incentive for innovation compared with
command-and-control programmes.
Market-based instruments are being adopted in several parts of Asia. In India,
the Renewable Energy Certificate (REC) mechanism was introduced with a lot of
promise for the promotion of renewable energy in general, and wind and solar energy
in particular. For energy efficiency improvements, Performance Evaluate Transfer
(PET) is used as a mechanism to address inter-alia the problems of these two
segments of industry---i.e., the problems arising from their infirm nature and
constraints in terms of inter-state transfer of power from renewable energy (RE)
sources. Today, however, this mechanism faces real challenges that seem to be
vitiating the investment climate in RE and energy efficiency sector in general, and
wind and solar segments in particular.
This paper seeks to identify various issues and options that will enable market-
based mechanisms to facilitate large-scale RE capacity addition, particularly wind
and solar, in the long run. It also seeks to review the experiences gained by other

2
countries with the tradable renewable energy certificate system, especially the
Renewable Obligation Certificate (ROC) scheme of the United Kingdom (UK).
Renewable Obligation (RO) has played a major role in harnessing RE sources in
the United Kingdom. It has contributed effectively to widen the UK’s energy and
climate change goals, including Greenhouse Gas (GHG) emission reductions, de-
carbonizing of the UK grid and energy security. The ROC mechanism has unique
features such as banding, banking, buyout price as a penalty for non-fulfilment,
inbuilt incentive mechanism for the obligated entities to fulfil their renewable
purchase obligation (RPO), secondary and forward market mechanisms, and others.
These features are not available in the current market-based mechanisms in Asia.
This paper therefore attempts to highlight the possible steps for an effective
policy on an REC system in Asia in general and India in particular. As such, a
comparison has been done with the UK’s ROC model so as to identify the gaps in the
REC system in Asia. This has revealed some fundamental issues around the REC
framework, underscoring the need for a policy design that can take care of the
concerns of market players. Recommendations in terms of policy and regulatory
interventions here aim to address the critical issues.
2. Types of Market-Based Policy Instruments in Asia
Many countries deploy market-based instruments to promote investment RE
technology as well as to improve energy efficiency and combat climate change. The
European Union’s Emissions Trading System (ETS) is a large and well-established
cap-and-trade system. In 2011, Australia introduced its own carbon pricing
mechanism that will also transition to a cap-and-trade system. A growing number of
developing countries employ market-based policy instruments to reduce energy
consumption as well as to jumpstart investments in clean energy are also being
witnessed.
For the purpose of this paper, a market-based policy instrument is defined as one
that provides financial incentives for consumers and/or producers who are
responsible for adopting RE technologies or energy efficiency improvements.
3
Policies being practiced in Asia, for that purpose fall under three broad categories:
taxes, subsidies, and trading systems.
Taxes set a price per unit of energy either directly on emissions or on goods or
services that are carbon intensive such as coal. Meanwhile, subsidies are broadly
defined as payments to encourage a particular economic action. Subsidies are
therefore the opposite of a tax. They include tax incentives and preferential loans.
Finally, trading systems set a limit on quantities on a specific type of energy, but
allow emitters to buy and sell emissions rights, letting the market determine the price
rather than setting it directly as a tax does. Examples include cap-and-trade and
baseline-and-credit emissions trading programmes. Trading systems may also be
used to meet energy savings or RE targets. These alternative policy approaches are
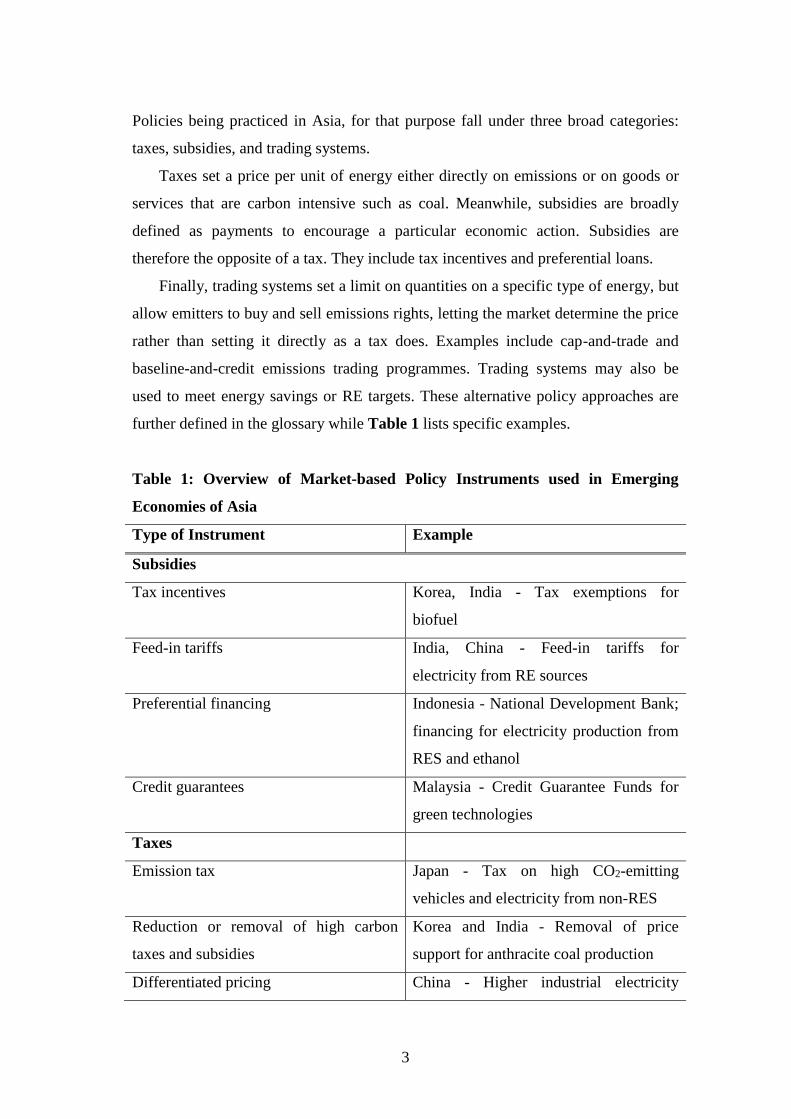
further defined in the glossary while Table 1 lists specific examples.
Table 1: Overview of Market-based Policy Instruments used in Emerging
Economies of Asia
Type of Instrument Example
Subsidies
Tax incentives Korea, India - Tax exemptions for
biofuel
Feed-in tariffs India, China - Feed-in tariffs for
electricity from RE sources
Preferential financing Indonesia - National Development Bank;
financing for electricity production from
RES and ethanol
Credit guarantees Malaysia - Credit Guarantee Funds for
green technologies
Taxes
Emission tax Japan - Tax on high CO2-emitting
vehicles and electricity from non-RES
Reduction or removal of high carbon
taxes and subsidies
Korea and India - Removal of price
support for anthracite coal production
Differentiated pricing China - Higher industrial electricity
4
prices for more energy-intensive
enterprises
Trading Systems
Energy efficiency and renewable energy
target-based
India - Energy intensity-based cap and
trade for industries and tradable
renewable energy certificates
Cap and trade Korea - Emission trading legislation;
China - pilot emission trading systems
Baseline and credit Korea - Voluntary emission reduction
programme
Taxes, subsides, and trading programmes have corresponding pros and cons. The
appropriateness of each must be weighed within the specific policy and political
context of each jurisdiction. Economic, political and cost considerations as well as
the environmental outcome and the ease with which a programme can be designed
and implemented must all be taken into account for their relative advantages and
disadvantages.
3. Emphasis on Renewable Energy and Energy Efficiency by
Market-Based Instruments
For most countries in the Asia-Pacific region---viz, Japan, Korea, Australia,
China, and India--- renewable energy development and deployment is a major goal
of market-based policies. In China, which already has vast hydropower resources,
the major drivers are the diversification of energy supply sources (i.e., as it is still in
need of more energy) and industrial development. Also, reducing fossil fuel
consumption has significant pollution and health co-benefits, while RE technology is
seen as a strategic economic growth sector in the country. Similarly, India is striving
to meet its fast-growing energy needs by developing all of its energy sources,
including renewables. South Korea and Japan, which have fewer renewable
resources than the others, still support renewable energy as a means of reducing their

5
significant dependence on imported energy. Finally, countries such as Indonesia and
Malaysia are seeking to expand and diversify their energy sources so as to meet their
growing energy demand.
Several emerging economies in Asia have formally pledged under the United
Nations Framework Convention on Climate Change (UNFCCC) to a quantified
national-level or economy-wide objective to limit the growth of GHG emissions. For
China and India, this objective is intensity-based, expressed in carbon dioxide (CO2)
emissions per unit of gross domestic product (GDP). Both aim to reduce their
economy’s CO2 intensity below the 2005 level by 2020 although both express their
goal as a range: A 40 percent to 45 percent reduction in China, and a 20 percent to 25
percent reduction in India. By contrast, Indonesia, South Korea, and Malaysia set
goals against business-as-usual emission projections in 2020 (i.e., GHG emissions as
they are expected to be in the absence of a new policy).
4. Renewable Energy Certificate (REC) Mechanism in India
In India, the generation of RE sources has been encouraged traditionally through various
financial and fiscal incentives, followed by preferential tariff, and renewable purchase
obligation (RPO) as determined by the electricity regulation generators. Wind energy
constitutes the largest share of RE generation in India. Solar has a huge potential, and present
policy and regulatory interventions are aimed at increasing the share of solar in the RE
generation portfolio. However, both solar and wind as sources are infirm in nature. They also
bear higher costs. Moreover, inter-state transfer of power generated from such RE sources is
difficult. All these explain why buyers are generally reluctant to contract such sources for
power generation. These inherent disadvantages thus require support for wind and solar energy
sources. To address these challenges, a new instrument called Renewable Energy Certificate
(REC) mechanism was introduced in 2010.
The introduction of REC is an attempt by regulators to address the problem
arising from the gap between availability of and demand for RE resources to fulfil
the RPO. Under the REC framework, an RE generator can sell electricity
components, say, to the local distribution company at its average pooled power

6
purchase cost (APPC) as well as associated environmental attributes in the form of
RECs to obligated entities or voluntary purchasers.
The Central Electricity Regulatory Commission (CERC) defines the terms and
conditions for the issuance of RECs. India has had the experience of REC
transactions for over four years now, and has seen important milestones in the
trading sessions for non-solar and solar RECs. A total of 4,022MW of RE generators
have been accredited for REC, out of which 3,632 MW of capacity had been
registered as of 1 July 2014 (REC Registry, 2014).
After the introduction of the REC mechanism on 14 January 2010, nearly 7,500
MW of renewable energy capacity had been commissioned as of March 2013. Out of
this, 2,256 MW of new generation capacity commissioned after 14 January 2010
were registered under the REC scheme as shown in Table 2.
Table 2: Status of REC Registered Projects as of March 2014
Energy
Source
Old Projects
(commissioned
before 14/01/2010
and registered under
REC)
New Projects
(commissioned
before 14/01/2010
and registered under
REC)
Total
No. of
Projects
Capacity No. of
Projects
Capacity No. of
REC-
registered
Projects
Capacity
Wind 117 281.08 391 1,632.92 508 1,914
Bio-
Cogeneration
46 532.68 24 150.32 70 683
Small Hydro 5 47.5 17 140 22 187.5
Biomass 29 293.60 29 269.4 58 563
Solar PV 20 62 20 62
Others 1 1.7 1 1.7
Total 197 1,155 482 2,256 679 3,411
Source: Processed data from REC Registry.
7
4.2. REC Demand and Supply Scenarios
Even as the registrations are substantial and the initial volume growth has been
encouraging, the trend in terms of volume and price of RECs over the period presents
a not-so-promising future for such instrument in India. In August 2013, a total of
488,824 non-solar RECs were issued. Combined with the non-solar RECs of
2,709,391 that remained unredeemed in the month of July 2013, a total of 3,359,617
non-solar RECs were available for trading in the month of August 2013. However,
only 40,889 non-solar RECs were sold/redeemed and an inventory of 3,157,326 non-
solar RECs remained unsold. Of the total non-solar RECs offered for trading, about
1.37 percent were redeemed. This clearly indicates that there is poor demand for non-
solar RECs.
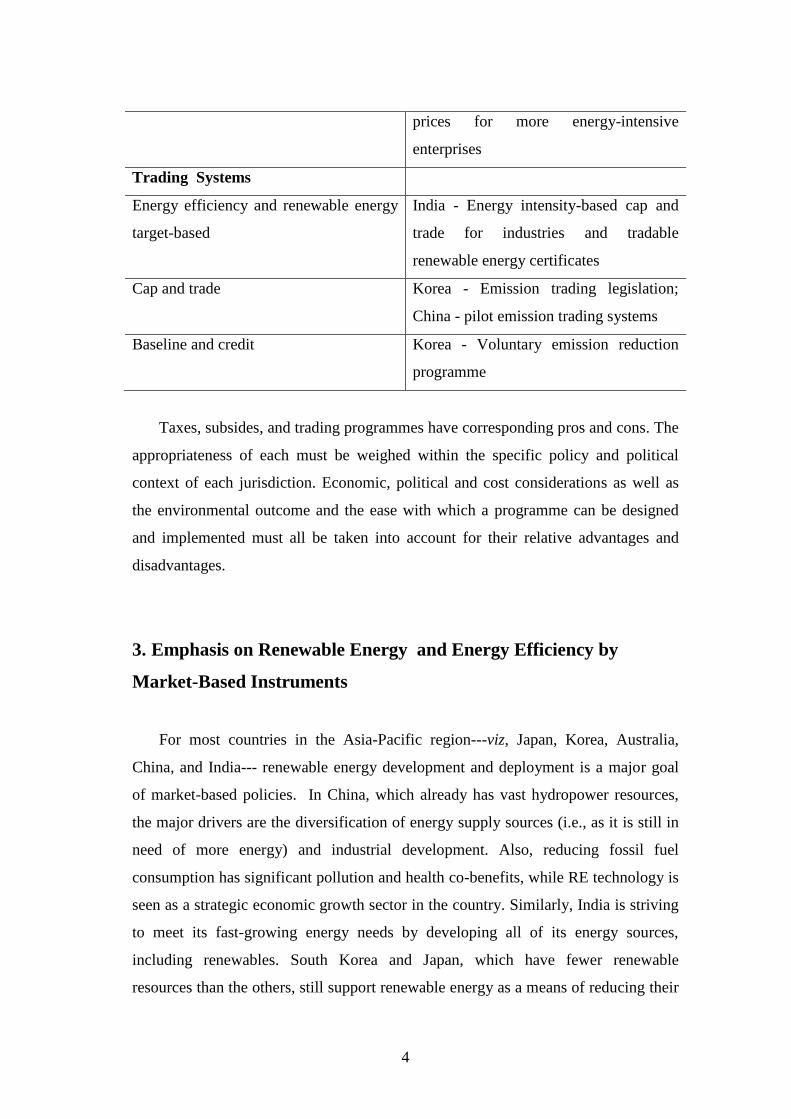
The trend analysis of RECs is presented in Figure 1. In the June 2013 trading
session, only 73,965 RECs were traded/cleared out of the total sale bid volume of
2.394 million RECs. This demand-supply gap has remained a major issue in the REC
market in India, especially in the non-solar REC category since June 2012.
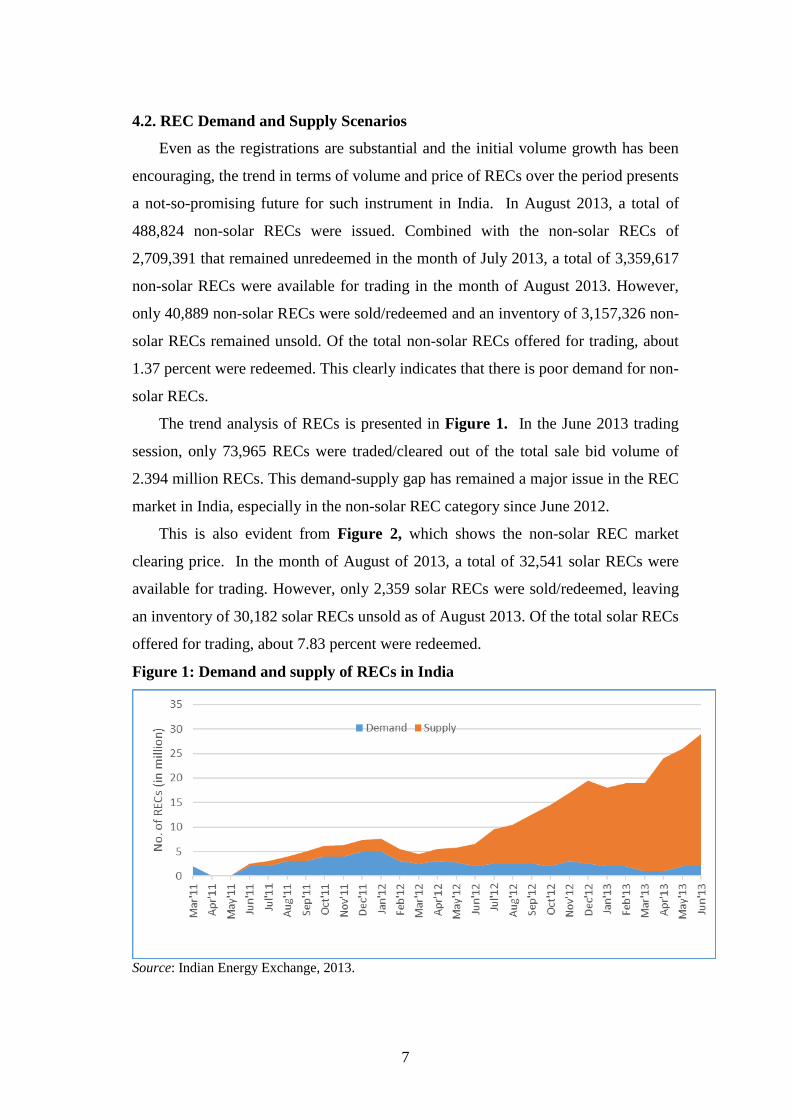
This is also evident from Figure 2, which shows the non-solar REC market
clearing price. In the month of August of 2013, a total of 32,541 solar RECs were
available for trading. However, only 2,359 solar RECs were sold/redeemed, leaving
an inventory of 30,182 solar RECs unsold as of August 2013. Of the total solar RECs
offered for trading, about 7.83 percent were redeemed.
Figure 1: Demand and supply of RECs in India
Source: Indian Energy Exchange, 2013.
8
In June 2012, the clearing ratios in the Indian Energy Exchange (IEX) and the
Power Exchange Of India Limited (PXIL), respectively, were 2.57 percent and 3.67
percent. Market clearing prices for non-solar RECs remained at the floor level ( Rs
1,500/REC or US$24.17) consistently, as shown in Figure 2.
The above figures indicate a very low demand for as well as low prices of RECs.
This leads one to wonder what the reasons are for such slow uptake in REC markets.
Figure 2: Price fluctuations in REC
Source: Power exchange of India Ltd, 2014.
4.2 Market analysis of RECs in India
4.2.1. Possible factors influencing the market trends
Figures 1 and 2 indicate that the current REC market is characterised by low
demand. Since the demand for REC is created by the RPO for obligated entities, it is
obvious then that the low demand stems from the fact that the obligated entities are
not coming forward to buy RECs. This is also borne out by the data in Table 3.
Only two distribution companies were reported to have bought RECs in June 2014 to
meet their RPO partly. Moreover, of the total RECs traded, distribution companies’
share in the total REC purchased was less than 50 percent.

9
Table 3: REC Buyers Market in India
Name of the Buyer Type of obligated
entity
No. of RECs
purchased
%
Electricity
Department,
Chandigarh
Distribution licence 2,000 3
Tata Power,
Maharashtra
Distribution licence 30,200 41
Others – 464 entities Open Access and
Captive users
41,765 56
Total RECs 73,965 100
Source: REC Registry, 2014.
Why obligated entities are not participating in the REC market were analysed
through a questionnaire survey. The responses and available data reveal two possible
reasons.
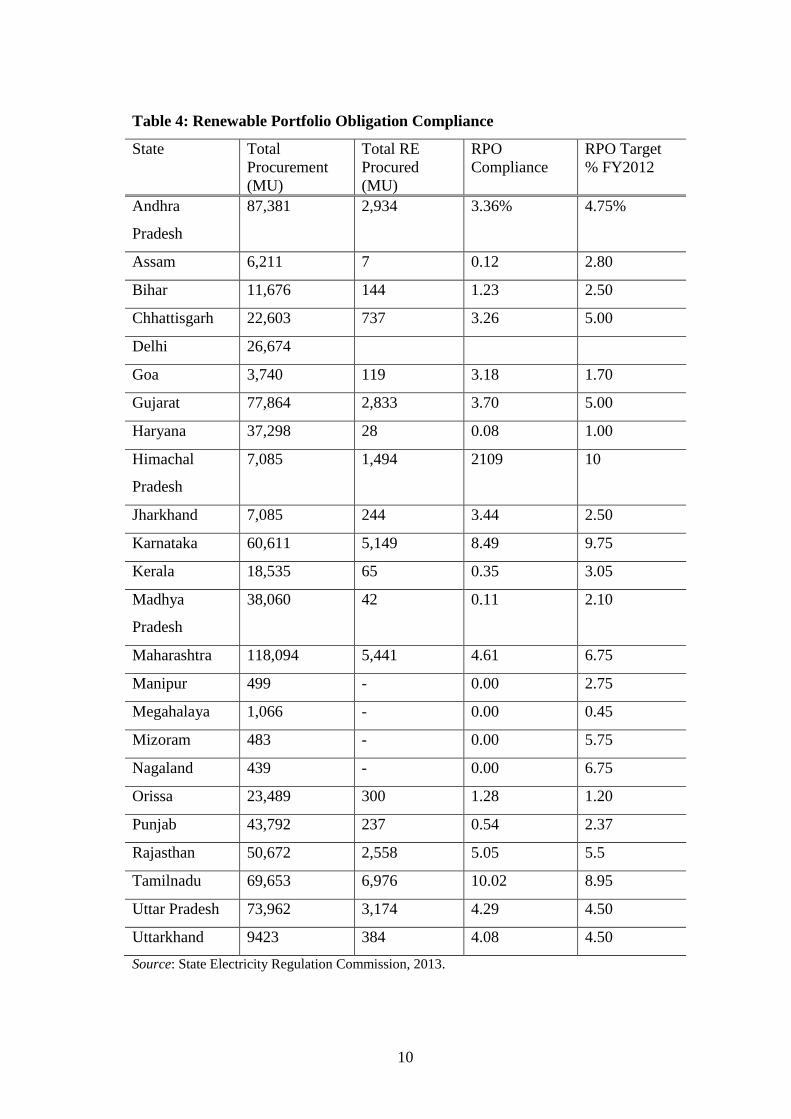
At one level, the low demand is due to the lack of RPO compliance as well as
weak enforcement by state electricity regulators, as indicated in Table 4. Table 5
demonstrates that RPO compliance in most states (except the states of Tamil Nadu,
Orissa, Jharkhand, Himachal Pradesh, and Goa) fall short of the target set.
10
Table 4: Renewable Portfolio Obligation Compliance
State Total
Procurement
(MU)
Total RE
Procured
(MU)
RPO
Compliance
RPO Target
% FY2012
Andhra
Pradesh
87,381 2,934 3.36% 4.75%
Assam 6,211 7 0.12 2.80
Bihar 11,676 144 1.23 2.50
Chhattisgarh 22,603 737 3.26 5.00
Delhi 26,674
Goa 3,740 119 3.18 1.70
Gujarat 77,864 2,833 3.70 5.00
Haryana 37,298 28 0.08 1.00
Himachal
Pradesh
7,085 1,494 2109 10
Jharkhand 7,085 244 3.44 2.50
Karnataka 60,611 5,149 8.49 9.75
Kerala 18,535 65 0.35 3.05
Madhya
Pradesh
38,060 42 0.11 2.10
Maharashtra 118,094 5,441 4.61 6.75
Manipur 499 - 0.00 2.75
Megahalaya 1,066 - 0.00 0.45
Mizoram 483 - 0.00 5.75
Nagaland 439 - 0.00 6.75
Orissa 23,489 300 1.28 1.20
Punjab 43,792 237 0.54 2.37
Rajasthan 50,672 2,558 5.05 5.5
Tamilnadu 69,653 6,976 10.02 8.95
Uttar Pradesh 73,962 3,174 4.29 4.50
Uttarkhand 9423 384 4.08 4.50
Source: State Electricity Regulation Commission, 2013.
11
As per regulations in most states, when the obligated entity does not meet its
RPO targets during a year, the State Electricity Regulatory Commission (SERC) may
instruct the obligated entity to pay into a fund an amount equivalent to the shortfall in
quantum of RPO equivalent of energy multiplied by the forbearance price of REC.
However, the enforcement of these provisions is weak. Most state commissions fail
to conduct checks and audits to ensure that the obligated entities are complying with
the regulations and duly purchasing RECs to meet their obligations. For example, in
its order dated 18 June 2013, the Chhattisgarh State Electricity Regulatory
Commission (CSERC) assessed the distribution companies’ level of RPO
compliance for the year 2010-2011. Although the CSERC in its order had noted that
the overall RPO met by the state was around 4.3 percent against the target of 4.75
percent (non-solar), and 0 percent for solar, it did not impose any penalties and
merely asked all the three distribution companies to share the burden. In states such
as Maharashtra, Punjab, and Gujarat, the shortfall in RPO have been carried forward
to future years. In the absence of a strict RPO enforcement, the obligated entities
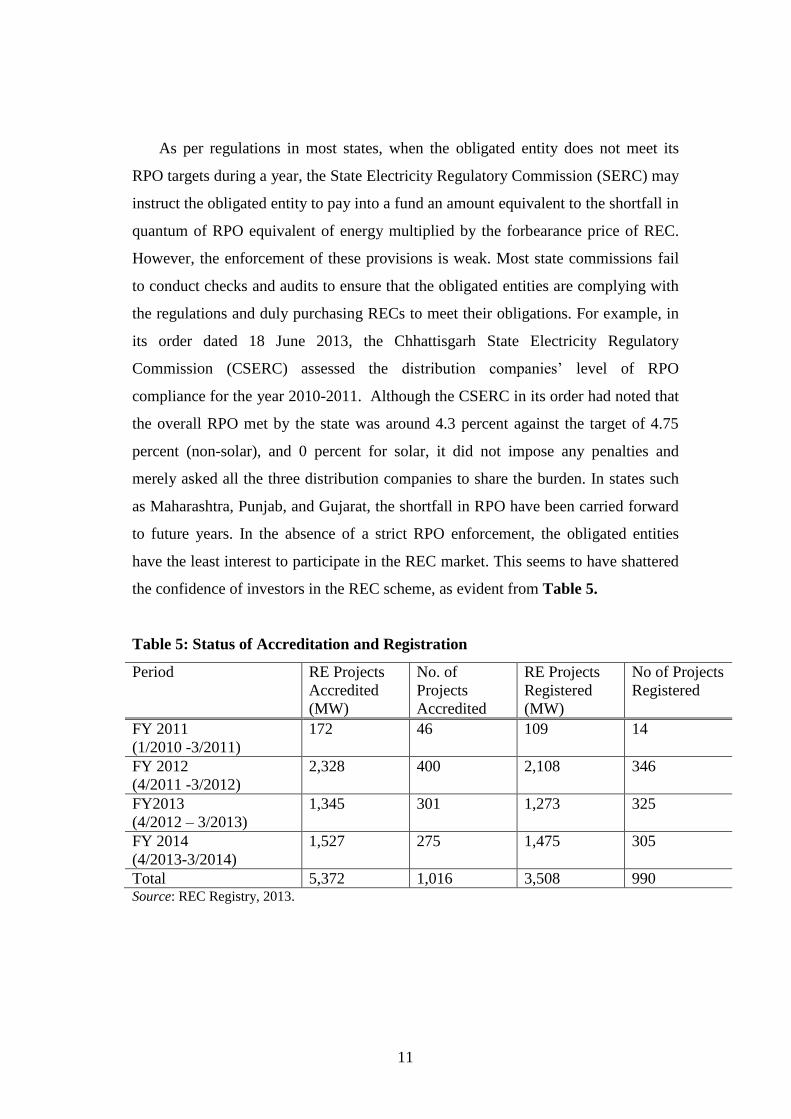
have the least interest to participate in the REC market. This seems to have shattered
the confidence of investors in the REC scheme, as evident from Table 5.
Table 5: Status of Accreditation and Registration
Period RE Projects
Accredited
(MW)
No. of
Projects
Accredited
RE Projects
Registered
(MW)
No of Projects
Registered
FY 2011
(1/2010 -3/2011)
172 46 109 14
FY 2012
(4/2011 -3/2012)
2,328 400 2,108 346
FY2013
(4/2012 – 3/2013)
1,345 301 1,273 325
FY 2014
(4/2013-3/2014)
1,527 275 1,475 305
Total 5,372 1,016 3,508 990 Source: REC Registry, 2013.
12
The above table shows the declining trend in the accreditation and registration of
RE projects under the REC mechanism, especially since April 2012. The MW
capacity accredited during 2012-2013 is almost half the capacity accredited during
2011-2012. So is the case with registration: Only 1,273 MW was registered during
2012-2013 as against the capacity of 2,108 MW registered in 2011-2012. These data
indicate that the initial enthusiasm of investors for projects through the REC route is
waning in India.
On the other hand, worldwide experience shows that (i) a stable and long-term
RPO trajectory and (ii) strong deterrent against non-compliance of RPOs have both
been used as important interventions for the promotion of renewable energy
(Sonneborn, 2004; Dulal et al., 2011; Vogstd, 2002: Martinot, 2007; Holt, 2007;
Martin, 2008; Midttun, 2007; Cunha, 2012; Zhou, 2010). These are the elements that
India lacks. Thus, the Central Electricity Regulatory Commission has advise the
Ministry of Power that: (i) The national electricity policy and tariff policy should
provide long-term RPO trajectory of five years to 10 years; (ii) The Electricity Act
2003 should require SERCs to fix the RPO as per the provisions of the national
electricity policy and the tariff policy; and (iii) SERCs should be empowered to
impose penalties in addition to the provisions made in section 142 of the Act. The
Ministry of Power has accordingly constituted a committee to accelerate the
development of RE through legislative and policy changes.
The above analysis clearly discloses that absence of proper enforcement of RPO
is one of the major factors responsible for non-participation of distribution
companies in the REC market. This, however, is not the only reason.
Other reasons for non-participation as culled from the questionnaire survey include:
i. Poor financial health of distribution companies
ii. The REC not being a viable option for resource-rich states
iii. The REC provides only electronic certificates and not energy
iv. Poor financial health of distribution companies
v. Reluctance due to infirm nature

13
4.2.2. Poor financial health of distribution licensees
According to the report on the financial health of distribution utilities, electricity
distribution licensees incurred losses of about Rs 700 million in 2010-2011 (Shrimali,
2012). Such poor financial health restricts distribution companies’ ability to purchase
the desired quantum of power or, for that matter, the otherwise expensive power
from RE source for the RECs. Quite often, they resort to load shedding to avoid the
purchase of power. This issue has to be addressed to improve the viability of the
power sector in general as well to bring the distribution companies back into the
REC market and rev up the demand for them.
4.2.3. REC not a viable option especially for RE resource-rich states
For the resource-rich states, the cost of fulfilment of RPO through Feed-In-Tariff
(FIT) route and REC route constitutes overlapping components. Table 6 compares
the costs of RPO compliance under ROC and FIT routes for the resource-rich state
Karnataka.
Table 6: RPO Compliance-cost economics comparison for Karnataka (Rs/KWh)
APPC
including
Transmissio
n Loss
Transmissio
n cost
Total
APC
C
Cost
(A)
REC
Pric
e
(B)
Energy Cost
(FIT)
Including
transmissio
n and
balancing
Cost (C)
A+B
-C
REC @ Floor
Price
3.46 0.5 3.97 1.5 4.59 0.87
REC@Avg
Price
3.46 0.5 3.97 2.4 4.59 1.77
REC
@forebearanc
e Price
3.46 0.5 3.97 3.3 4.59 2.67
Source: Forum of Regulators, 2012.

14
From the above table, it appears that the cost of RPO compliance by procuring power
at FIT is cheaper than the cost of RPO compliance by purchasing REC. Therefore,
distribution companies in the resource-rich state may not necessarily come to the
REC market for RPO compliance.
4.2.4. REC viable option especially for RE resource-deficit states only at floor price
A similar comparison of RPO compliance costs has been done for the resource-
deficit state of Delhi as shown in Table 7.
Table 7. Cost comparison for resource-deficit state of Delhi under IPCC+REC
Route Vs FIT Route
IPCC+REC Rs/Kwh (A) FIT Rs/Kwh (B)
IPCC 3.34 -
REC (Floor Price) 1.50 -
FIT 4.63
Transmission Cost 0.10 0.23
Transmission Loss 0.04 0.14
Sub-Total 4.98 5.00
Balancing Energy Cost 0.33
Total Cost 4.98 5.33
Difference
REC at Floor price (1.50) 0.33 – 0.58
REC at Ave. Price (2.55) 0.55
REC at Forbearance (3.40) 1.45
Source: Forum of Regulators, 2012.
From the cost comparison, one can say that the REC route is attractive for
resource-deficit states only if RECs are available at floor prices. Therefore, such
states may prefer to fulfil their RPO target by procuring power through the FIT route
instead of the REC scheme the moment REC price exceeds the floor price.
Since renewable energy is intermittent in nature and perceived to be a costly
source of energy, both resource-rich and resource-deficit states are generally

15
unwilling to increase their RPO obligation beyond current limits, as RPO compliance
would result in:
- Additional cost to be incurred by the host state’s utility in procuring
balancing power because of the variable nature of renewable energy sources.
- Additional expenditure in establishing transmission infrastructure for new
renewable energy capacity.
4.2.5. REC: Only an electronic certificate without physical electricity
Renewable Energy Certificates are sold in the form of electronic certificates
without the electricity itself. Since there is a shortage of power supply, the purchase
of RECs does not meet the need of the distribution companies in terms of power
procurement. They are, therefore, generally reluctant to buy RECs, which are not
accompanied by physical energy. Instead, they would be willing to pay for electricity
that is produced on their behalf using cleaner, renewable sources of generation. As
such, they often prefer to procure renewable energy via the FIT route than through
RECs to meet the RPO.
4.3 Risk Analysis from REC from the generator perspective
In the preceding section, the REC market data were analysed from the perspective of
the buyers. In this section, analysis is done from the RE generators’ perspective. It
attempts to find out how RE generators view REC as an option for investment.
4.3.1. Bankability and Financing Risk
In most part of Asia as well as India, there is a real concern about the bankability
of RE projects under the REC route because of high risks as perceived by financiers.
The key constraint identified is the lack of visibility of pricing and regularity of cash
flows. In India’s REC case, there is a shorter visibility of the REC price band as the
current floor and forbearance price determined by the central commission are valid
only until FY 2016-2017. Thus, there is uncertainty over the REC revenue after FY
2017.
Another revenue source under the REC mechanism is the sale of electricity
component to local distribution licensees at the Average Power Purchase Cost
(APPC). The CERC regulations provide that the electricity component can be

16
purchased by the local licensee at a price not exceeding the APPC, other could be a
viability gap for the RE projects, especially in the event of the REC price discovered
in the power
4.3.2. Mitigating the institutional, economic and financial risks
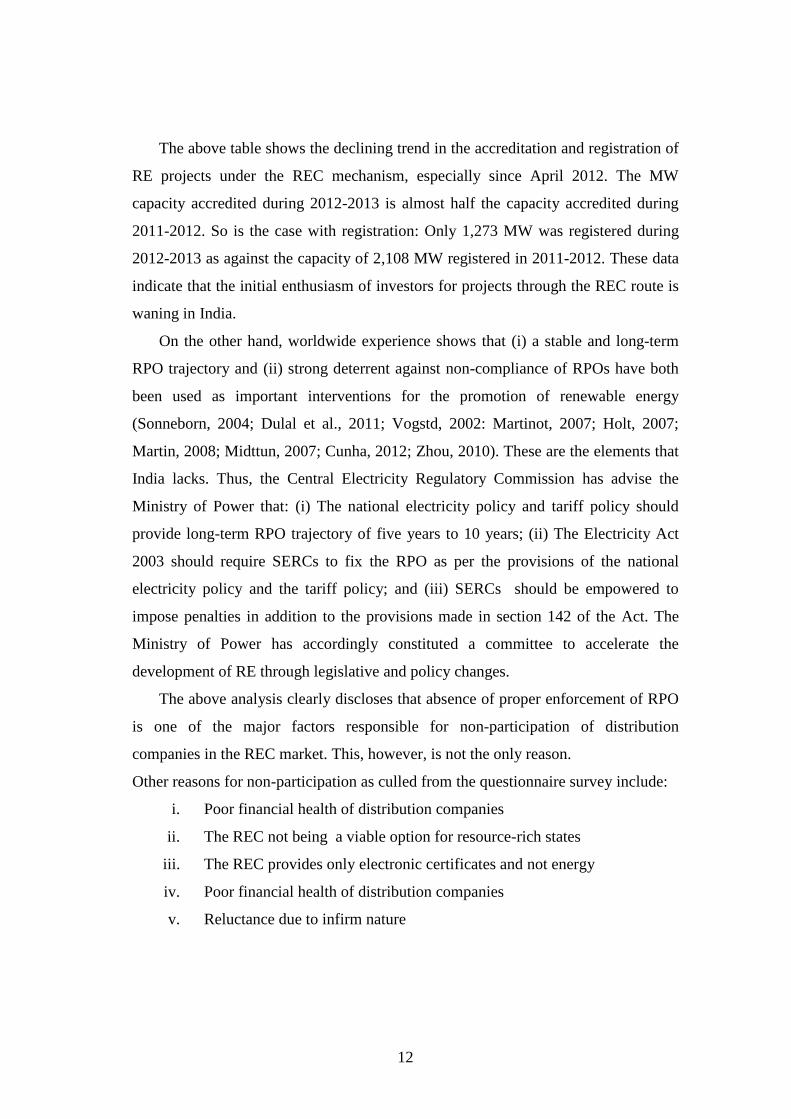
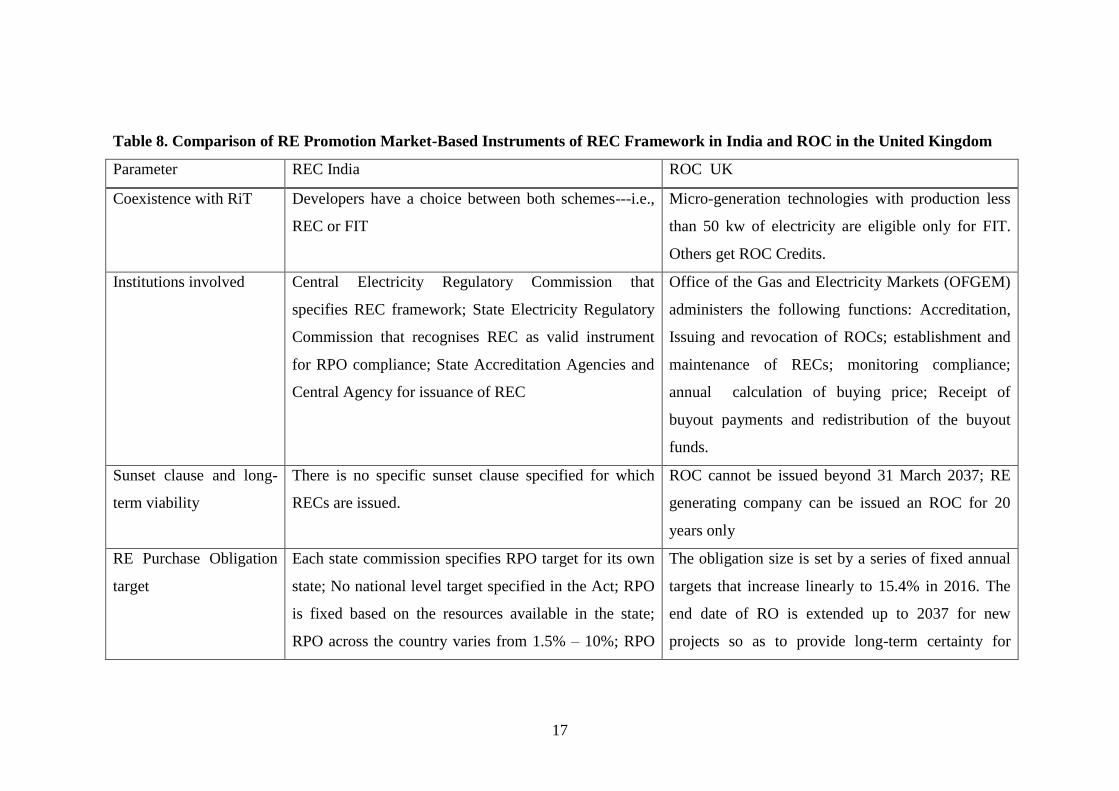
Both RECs in India and ROCs in the United Kingdom represent the green
attributes of electricity generated from RE sources. In order to identify various risks
associated with the Indian REC, a comparative analysis on key attributes is made and
presented in Table 8.
17
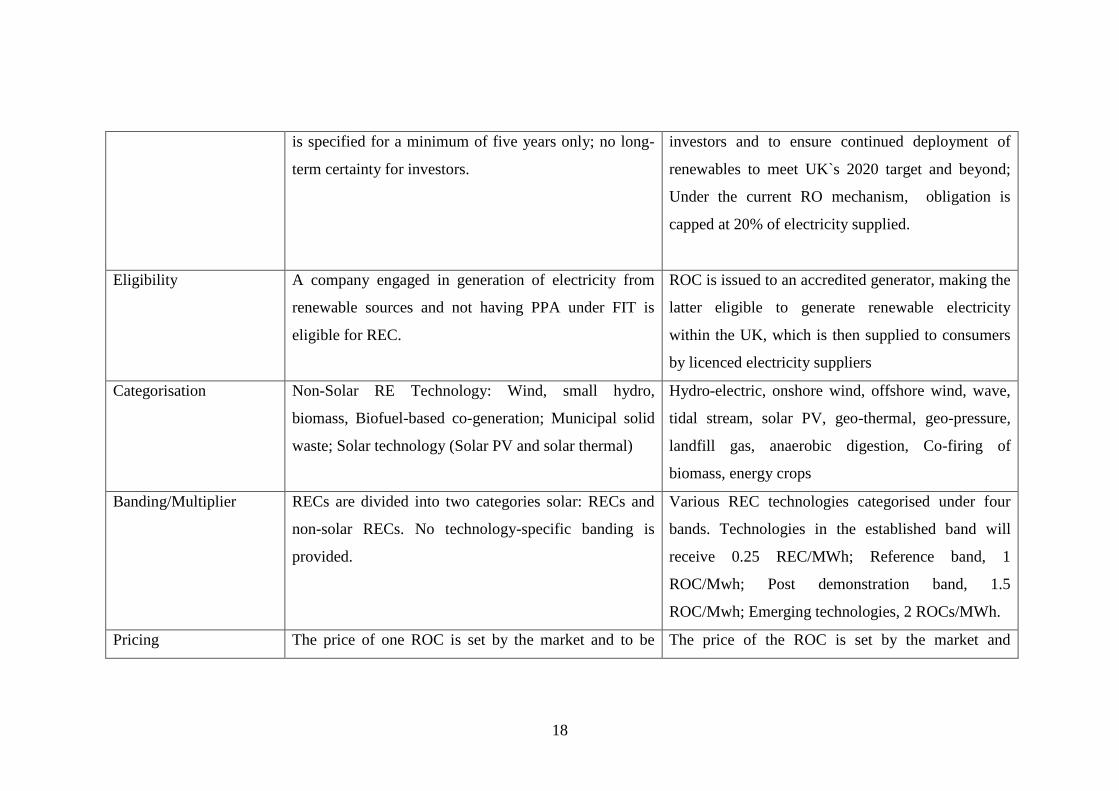
Table 8. Comparison of RE Promotion Market-Based Instruments of REC Framework in India and ROC in the United Kingdom
Parameter REC India ROC UK
Coexistence with RiT Developers have a choice between both schemes---i.e.,
REC or FIT
Micro-generation technologies with production less
than 50 kw of electricity are eligible only for FIT.
Others get ROC Credits.
Institutions involved Central Electricity Regulatory Commission that
specifies REC framework; State Electricity Regulatory
Commission that recognises REC as valid instrument
for RPO compliance; State Accreditation Agencies and
Central Agency for issuance of REC
Office of the Gas and Electricity Markets (OFGEM)
administers the following functions: Accreditation,
Issuing and revocation of ROCs; establishment and
maintenance of RECs; monitoring compliance;
annual calculation of buying price; Receipt of
buyout payments and redistribution of the buyout
funds.
Sunset clause and long-
term viability
There is no specific sunset clause specified for which
RECs are issued.
ROC cannot be issued beyond 31 March 2037; RE
generating company can be issued an ROC for 20
years only
RE Purchase Obligation
target
Each state commission specifies RPO target for its own
state; No national level target specified in the Act; RPO
is fixed based on the resources available in the state;
RPO across the country varies from 1.5% – 10%; RPO
The obligation size is set by a series of fixed annual
targets that increase linearly to 15.4% in 2016. The
end date of RO is extended up to 2037 for new
projects so as to provide long-term certainty for
18
is specified for a minimum of five years only; no long-
term certainty for investors.
investors and to ensure continued deployment of
renewables to meet UK`s 2020 target and beyond;
Under the current RO mechanism, obligation is
capped at 20% of electricity supplied.
Eligibility A company engaged in generation of electricity from
renewable sources and not having PPA under FIT is
eligible for REC.
ROC is issued to an accredited generator, making the
latter eligible to generate renewable electricity
within the UK, which is then supplied to consumers
by licenced electricity suppliers
Categorisation Non-Solar RE Technology: Wind, small hydro,
biomass, Biofuel-based co-generation; Municipal solid
waste; Solar technology (Solar PV and solar thermal)
Hydro-electric, onshore wind, offshore wind, wave,
tidal stream, solar PV, geo-thermal, geo-pressure,
landfill gas, anaerobic digestion, Co-firing of
biomass, energy crops
Banding/Multiplier RECs are divided into two categories solar: RECs and
non-solar RECs. No technology-specific banding is
provided.
Various REC technologies categorised under four
bands. Technologies in the established band will
receive 0.25 REC/MWh; Reference band, 1
ROC/Mwh; Post demonstration band, 1.5
ROC/Mwh; Emerging technologies, 2 ROCs/MWh.
Pricing The price of one ROC is set by the market and to be The price of the ROC is set by the market and

19
traded between the floor and forbearance price; Central
commissions specify floor and forbearance price for
solar and non-solar RECs. The floor and forbearance
price is set for five years up to FY2017. There is no
price visibility beyond that.
reflects the size of the difference between the
percentage of RE electricity generated in the UK and
the RO percentage. The ROC buyout price was set at
30 Euro in 2002 and adjusted every year.
Trading RECs are traded separately from electricity. They can
be traded only through power exchange. Voluntary
market is negligible.
ROCs can be sold directly to suppliers. These can
also be traded separately from electricity. REC
market is characterised by obligatory market and
voluntary market.
Monitoring and
Compliance
State commission specifies RPO for obligated entities.
RPO is administered by state commission. Regulations
provide that if the obligated entities do not meet their
RPO targets, which may create shortfall in the units of
RPO, the commission may instruct the obligated entity
to pay an amount equivalent to the shortfall in quantum
of RPO multiplied by the forbearance price of REC.
The RO order places a mandatory requirement on
licenced electricity suppliers---supply electricity
from eligible RE sources or pay a penalty---and
obligates suppliers to meet their obligation on or
before 1 September ____. The order allows suppliers
to meet their RO by either presenting ROCs or
paying an equivalent amount into the buyout fund;
All buyouts are redistributed to suppliers who have
presented ROCs against their obligation
proportionate to the number of ROCs that each has
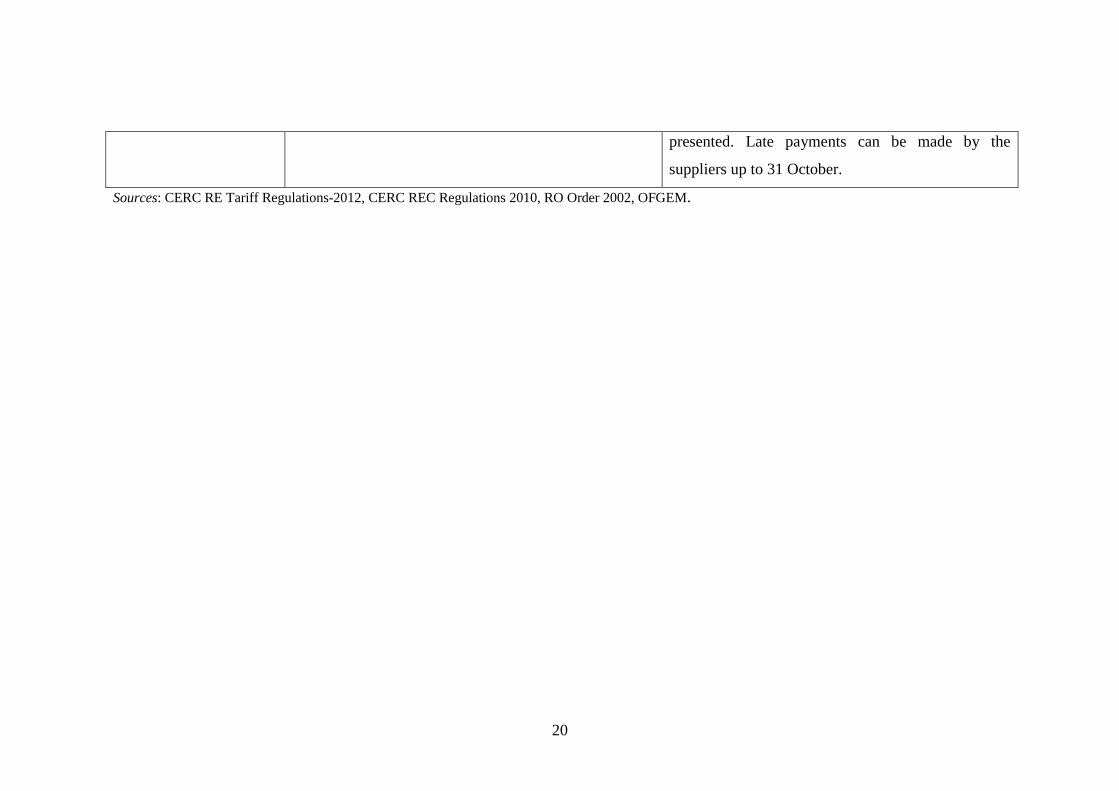
20
presented. Late payments can be made by the
suppliers up to 31 October.
Sources: CERC RE Tariff Regulations-2012, CERC REC Regulations 2010, RO Order 2002, OFGEM.

21
These features are:
- Currently, the REC framework in India does not specify a sunset clause, which is
present in the ROC framework of the United Kingdom up to 2037. The REC mechanism in
India has no long-term visibility. That is, it does not have any long-term, national-level
RPO. In contrast, the United Kingdom has a clear mandate in its law to achieve the 20
percent RPO target by year 2020.
- India’s REC mechanism categorises its RECs as either solar or non-solar. Such
dichotomy potentially reduces liquidity and trade in the two separate markets as compared
to a common market in the case of ROCs. The United Kingdom’s unified market of ROCs
uses a multiplier for different sources. The objective is to provide greater support to
emerging technologies using a higher multiplier than for matured technologies. The value
is gradually reduced in line with their cost competitiveness. For the RECs, a pre-specified
schedule of declining multipliers provides a benchmark for cost reductions to aim for so as
to remain viable in the changing environment for a particular technology.
- Currently, trade in RECs is allowed only at the exchange platform in India. In the
United Kingdom, the forward market allows bilateral over-the-counter trade to take place.
Sellers and buyers agree to trade ROCs. Buyers could be obligated entities, market makers
and traders. Such provides liquidity in the market.
- The REC regulations in India specify that RECs are valid for 365 days from the
date of issue. There is no safeguard in case of oversupply of RECs. In the case of the
United Kingdom, its ROC mechanism facilitates banking of certificates. This can be an
aspect India can look into for its RECs as banking of certificates could also be an
economic solution to reduce the volatility in the REC prices.
- In India, if the obligated entity fails to fulfil its obligation, it has to pay a penalty at
the rate of the forbearance price. Funds collected in this process can be used to buy the
RECs from the open market. In the United Kingdom, an obligated entity that fails to fulfil
its obligation has to pay the regulator a penalty in the form of a buyout price. This fund
collected is then redistributed back to the other entities that have fulfilled their obligation.
Such mechanism of redistributing the funds encourages more participation as it acts as an
incentive to those entities that abide by their renewable obligations.
- The buyout price in the United Kingdom was fixed in 2001 and linked to the retail
price index, which has had an increasing trend. In India, the forbearance price is the
highest difference between the cost of generation/RE tariff and the APPC.

22
- India currently offers two alternate revenue schemes for investors in RE projects:
(i) the FIT scheme; and (ii) the REC scheme. The present REC scheme does not allow
certificates to be issued to projects registered under the FIT mechanism. On the other hand,
the United Kingdom’s ROC is the primary instrument for fulfilment of RPO.
- In India’s current mechanism, RECs are required to be traded between a
determined floor price and forbearance price. There are no floor and forbearance prices in
the UK’s case.
- In the United Kingdom, the buyout price is set as the difference between the
electricity cost and the anticipated value of marginal cost.
5. Government’s Role in Promoting the Uptake of RE Under Market-
based Approaches
The contrast between the United Kingdom’s ROC model and India’s REC framework
underscores the need for a policy design to take care of the concerns of buyers as well as
sellers. As the first level of intervention, incentives should be provided to induce buyers to
come to the REC market. Analyses have revealed that one of the reasons for buyers’
reluctance to come forward is that the REC in its present form is not a viable proposition
for them. As mentioned earlier, in the case of the United Kingdom, the obligated suppliers
meet their renewables obligation by either presenting ROCs or paying an equivalent
amount into the buyout fund as penalty. All such buyout payments are redistributed to
suppliers who have presented ROCs against their obligation, in proportion to their number
of ROCs. This serves as incentive for those who have fulfilled the RPO targets. In a
developing country context, there should be an incentive to encourage states to set and
fulfil higher RPO target. The incentive level for RE resource-deficit states should differ
from that for RE resource-rich states. That is, incentive for resource-deficit states should
be designed to take care of the higher cost of compliance, while that for resource-rich
states should aim to help create transmission infrastructure and to set up a flexible energy
generation so as to balance the variability of RE resources.
Traditionally, incentives in developing countries have been targeted towards investors
only. This study does not imply that incentives are not required by investors, but it
suggests that the irritants from the buyers’ point of view should be recognised and

23
corrective policy decisions taken to address these. Incentivising and inducing the buyers
would, in turn, also help investors in the long run. For example, RE generation facility can
come up only in the states rich in RE resources. But higher penetration of RE generation,
especially in wind and solar---which are variable and uncertain in nature---brings with it
challenges for the host state in terms of managing grids and arranging balancing power to
match the variability of the infirm RE sources. This causes operational and financial stress
on the distribution companies---i.e., the buyers of the host state. Such stress, on top of their
present weak financial health, leads them to develop a resistance against RE generation.
Unless these issues are addressed through suitable policy interventions such as incentive
schemes, the promotion of RE in general, and sustainability of the REC framework as well
as the wind and solar industry in particular, would not be attained.
Incentive is a short-term measure; in the long run, there is a need for a policy
framework to make REC a win-win proposition for buyers as well as sellers. A framework
should be designed whereby REC is credited to every unit of RE generation irrespective of
whether the said generation has been sold through preferential tariff /regulated tariff or
otherwise. Buyers of RE generation through preferential tariff could earn REC credit along
with the energy. The RECs earned by the buyers in this manner can be used to meet RPO
and any of their surplus RECs can be sold in the market to mitigate their high RE purchase
cost. This framework would, however, imply a paradigm shift in the existing policy design
for the promotion of RE in general and REC in particular.
This suggested model is based on lessons from other nations but customised to meet
the specific needs of Asian countries. In the United Kingdom, RE generators participate in
the power market for the sale of electricity components and then get credit in the form of
ROCs for every one megawatt hour of electricity generated. For India, the first part is not
recommended---that is, it is not suggested that the wind and solar plants be made to
compete with conventional sources in the power market for the sale of electricity
components. Long-term contracting, either through cost plus regulated regime or through
competitive bidding, can continue as at present for these RE sources. This is considered
necessary for investment certainty in such infirm sources of power over the longer term.
However, the second component of the UK ROC system is recommended for India. All
RE generation should get the REC credit and in the event that a buyer contracts such RE
generation, the REC credit, along with the energy, should be transferred to the buyer. At
the same time, the energy generation company shall have the liberty to sell its electricity in
either bundled or unbundled form.
24
Once an REC framework that presents a win-win proposition for buyers as well as
sellers has been developed, it would be desirable to set appropriate levels of RPO to
generate the demand for RE generation and consumption. At the same time, regulators
should ensure that all obligated entities comply with the RPO. It should be made clear to
all that non-compliance of RPO will entail penalties. In addition, compliance should also
be ensured through appropriate commercial mechanisms such as imposing non-compliance
charges on an obligated entity that fails to meet the desired level of RPO. In the UK, the
compliance with the RPO is strictly monitored by the regulator, and the penalty framework
of buyout price has turned out to be an effective deterrent against non-compliance of RPO.
It is equally important that there is clarity and policy certainty over the long-term
sustainability of the REC framework and visibility of revenue . In UK, the Renewable
Obligation (RO) Order initially set the RPO target at 3 percent for the period 2002-2003,
with the aim to further raise it to 15.4 percent by 2015-2016. On 1 April 2010, the
scheme’s time period was extended from 2027 to 2037. Similarly, in India, the Electricity
Act of 2003 and National Electricity Policy and the Tariff Policy should clearly stipulate
that they are empowering the CERC to decide the time frame for the continuation of REC.
The CERC should specify in its regulations that the REC will be issued to eligible RE
generators for at least 15 years.
6. An Evolving Policy Landscape of Market-Based Instruments in Asia
Market-based instruments for RE and energy efficiency have evolved significantly
over time. In India, for example, renewable energy policies have moved from feed-in-tariff
to auctioning of REC mechanisms. Conversely, China transitioned from an auctioning
programme for wind power to feed-in-tariffs to a regulatory command-and-control
approach that directly imposes renewable obligations. In the area of GHG policies, South
Korea encouraged the domestic voluntary market and established mandatory GHG targets
for major industries before transitioning to a cap-and-trade programme in 2015. While
some of China’s pilot trading systems are getting off from the ground, several are still in
the process of collecting necessary data, engaging with private sector operators, and
developing institutional frameworks.
25
Market-based instruments can either incentivise or disincentivise behaviours. In the
case of nations covered in this study, the mechanisms quite strongly leaned toward the
positive outcome. In most emerging economies in Asia, the use of incentives is more
extensive than the use of taxes or policies that increase the cost of a given activity. Most
incentives aim to remove financial barriers, particularly the higher cost of renewable
energy production. These are often integrated into or supportive of energy or climate or
industrial development policies. China employs both command-and-control and market-
based mechanisms such as by combining policies that support efficient renewable energy
purchase and those that increase taxes on fossil fuel use as well as preferential lending to
RE industries such as those on solar and wind. As examples of disincentives, India applies
levies on coal, while Japan imposes taxes on electricity from non-renewables as well as
considering the implementation of an economy-wide energy tax.
7. Conclusions
Considering that there remain policies and market structures that inhibit renewable
energy development and energy efficiency improvements, market-based approaches such
as RECs have huge potentials. However, they need to address several pre-requisite issues.
While energy policy and energy market structures are crucial, there are options that the
renewable industry may consider so as to be well placed to take advantage of market-based
instruments, including identifying multiple income streams from RE and energy efficiency
projects; bundle or pool carbon credits for small projects; streamline certification,
verification and monitoring; and promote RE and energy efficiency as a GHG solution.
Renewable electricity projects can potentially create several income streams such as
REC credits for national targets – a nominal market value; carbon credits – a range of
permit prices; Green power premium – more for RE than standard rates; and Standard
price of electricity – to the customers. They should be identified and integrated.
Many RE projects, especially off-grid projects, are often small, making the cost of
monitoring the MBI uneconomic and the REC prices fluctuate. A large pool of RE projects
could balance off these fluctuations. Certification, verification and the sale of credits from
numerous small- to medium-sized RE projects could be bundled and sold without the
buyer having to be directly involved in the on-the-ground projects.

26
Multiple institutions that work without targets and non-standardised approaches can
find their cost increasing and effectiveness falling. Thus, to streamline the certification
process, monitoring is a must. Correcting existing institutional flaws and providing policy
and programme support through legislations are thus elements that can make RE and
energy efficiency under market-based approaches succeed.
References
Central Electricity Regulatory Commission [CERC] (2010a), Detailed Procedure Under
REC Mechanism Submitted by the Central Agency (NLDC). Available at:
https://www.recregistryindia.nic.in:
https://www.recregistryindia.nic.in/pdf/REC_Procedures.pdf
Central Electricity Regulatory Commission [CERC] (2010b), CERC (Terms and
Conditions for recognition and issuance of Renewable Energy Certificate for
Renewable Energy Generation) Regulation, 2010. Available at:
https://www.recregistryindia.nic.in:
https://www.recregistryindia.nic.in/pdf/REC_Regulation/Statement_of_Reasons_S
OR_for_CERC_REC_regualtions_2010.pdf
Central Electricity Regulatory Commission [CERC] Petition No. 99/2010 (2010c),
Determination of Forbearance and Floor Price for the REC framework. Available
at: https://www.recregistryindia.nic.in:
https://www.recregistryindia.nic.in/pdf/REC_Regulation/Final_Order_on_Forbeara
nce_and_Floor_Price_for_REC.pdf
Central Electricity Regulatory Commission [CERC] (2011), CERC-Statutory Advice to
Government. Available at: http://www.cercind.gov.in:
http://www.cercind.gov.in/2011/Advice_Gov/DOC000.PDF
Centre for Wind Energy Technology (2013), Wind Power Density. Available at:
http://www.cwet.tn.nic.inhttp://www.cwet.tn.nic.in/html/departments_wpdmap.htm
l
Cunha, L.A. (2012), Fostering Wind Power through Auctions: the Brazilian Experience.
International Association for Energy Economics.
Dulal H.B, K.U. Shah, C. Sapkota, G. Uma, and B.R. Kandel (2013), Renewable Energy
diffusion in Asia: Can It Happen Without Government Support? Energy Policy 59,
pp. 301-311.
Forum of Regulators (2012), ‘Preparing Incentive Structure for States for Fulfilling
Renewable Purchase Obligation Targets’. Available at:
http://www.forumofregulators.gov.in:
http://www.forumofregulators.gov.in/Data/CLEAN-
RPO%20Incentivization_report_final.pdf
Forum of Regulators (2009), Draft Model Regulation for SERC U/S 86 (1)(e) of the Act.
Retrieved August 28, 2013. Available at: http://www.forumofregulators.gov.in:

27
http://www.forumofregulators.gov.in/Data/Reports/Final-Model-regulations-for-
SERCs-for-REC-implementation.pdf
Garrett Martin, R.N. (2008), ‘Tailoring Renewable Portfolio Standards to Achieve
Disparate economic and Environmental Goals’. Available at:
http://dukespace.lib.duke.edu:
http://dukespace.lib.duke.edu/dspace/bitstream/handle/10161/851/MP_gdm4_a_20
0812.pdf?sequence=1
Gireesh Shrimali, S.T. (2012), Falling Short: An Evaluation of the Indian Renewable
Certificate Market. Indian School of Business, Climate Policy Initiative.
Hyderabad: CPI-ISB.
Klaus Vogstad, I.S. (2002), Tradable green certificates: The dynamics of coupled
electricity markets. The TGC market Powers in Studio.
Holt, E.H. (2007), The Treatment of Renewable Energy Certificates, Emissions
Allowances, and Green Power Programs in State Renewables Portfolio Standards.
Available at: http://www.escholarship.org:
http://www.escholarship.org/uc/item/4jj146vk#page-1
Indian Energy Exchange (2012), Renewable Energy Certificate. Available at:
http://www.iexindia.com: http://www.iexindia.com/Reports/RECData.aspx
Martinot, R.W. (2007), ‘Renewable Energy Policies and Markets in the United States’.
Available at: http://martinot.info: http://martinot.info/Martinot_et_al_CRS.pdf
Midttun, K. G. (2007), Feed in or certificates, competition or complementarity?
Combining a Static efficiency and a dynamic innovation perspective of the
greening of green industry. Energy Policy, 1419-1422.
Ministry of Law and Justice. (2003), The Electricity Act, 2003. The Gazette of India. New
Delhi, Delhi, India: Ministry of Law and Justice, Legislative Department.
Ministry of New and Renewable Energy (2013), India Solar Resource. Available at:
http://mnre.gov.in: http://mnre.gov.in/sec/DNI_Annual.jpg
Ministry of Power, Government of India (2012), Accelerated Development of Renewable
Energy through Legislative and Policy Changes. Available at:
http://www.powermin.nic.in:
http://www.powermin.nic.in/whats_new/pdf/Accelerated_development_of_RE_thr
ough_L&P_changes_Mar2012.pdf
Office of Gas and Electricity Markets [Ofgem] (2012), Renewable Obligation Annual
Report 2011-12. Available at: https://www.ofgem.gov.uk:
https://www.ofgem.gov.uk/ofgem-publications/58133/ro-annual-report-2011-
12web.pdf
Pandit, A. (2009), Infraline Round Table Discussions Renewable Energy Certificates :
Opportunities and Challenges. Available at: http://www.infraline.com:
http://www.infraline.com/power/Events/Presentations/AjitPandit-ABPS.pdf
Planning Commission (2011), Report of High Level on Financial Position of Distribution
Utilities. Available at: http://planningcommission.nic.in:
http://planningcommission.nic.in/reports/genrep/hlpf/hlpf.pdf (accessed 27 August
2013).
28
Power Exchange of India Limited (2013), Clearing. Available at:
http://www.powerexindia.com:
http://www.powerexindia.com/PXIL/insidepage.aspx?id=43
Purohit, S.K. (2013), ‘Renewable Energy Certificate Mechanism in India: A Preliminary
Assessment‘, Renewable and Sustainable Energy Reviews, pp. 380-391.
Ragwitz, C.H. (2005), Feed-In Systems in Germany and Spain and a Comparison.
Available at: http://www.erneuerbare-energien.de: http://www.erneuerbare-
energien.de/fileadmin/ee-
import/files/english/pdf/application/pdf/langfassung_einspeisesysteme_en.pdf
REConnect Energy Solutions (2011), ‘Significant Changes in the REC Mechanism
Proposed’. V. Nuwal (Ed.), Open Access 10, p. 4.
REC Registry of India (2013), REC Summary. Available at:
https://www.recregistryindia.nic.in/: https://www.recregistryindia.nic.in/
Renewable Obligation Order 2002 (2002), ‘Electricity England Wales: The Renewable
Obligation Order 2002’. Available at: http://www.legislation.gov.uk:
http://www.legislation.gov.uk/uksi/2002/914/pdfs/ uksi_20020914_en.pdf
Renewal Obligation Order 2009 (2009), ‘Electricity England Wales: The Renewable
Obligation Order 2009‘.Available at: http://www.legislation.gov.uk:
http://www.legislation.gov.uk/uksi/2009/785/article/33/made
Rossiter, D. (2007), ‘Australia‘s Renewable Energy Certificate System’. Available at:
http://www.ieadsm.org/Files/Content/April2002_B4abstract%20papers%20Rossite
r%20Wass.pdf
Singh, A. (2010), Economics, Regulation, and Implementation Strategy for Renewable
Energy Certificates in India. Available at: http://www.idfc.com:
http://www.idfc.com/pdf/report/Chapter-3.pdf.
Sonneborn C.L. (2004), ‘Renewable Energy and Market Based Approaches to Green –
house Gas Reduction – Opportunity Or Obstacle?’ Energy Policy 32, pp. 1799 -
1805.
Soonee, S. K. (2010), ‘Renewable Energy Certificate Mechanism in India’, 16th National
Power System Conference (pp. 92-97). Hyderabad: Osmania University.
Wind Independent Power Producer Association [WIPPA] (2012), Round Table on Wind
Power Program. Available at: http://mnre.gov.in: http://mnre.gov.in/file-
manager/UserFiles/presentation-
01082012/Presentation%20by%20Shri%20Sunil%20Jain,%20President,%20WIPP
A.pdf
Zhou, Y. (2010), Designing Effective and Efficient Incentive Policies for Renewable in
Expansion Generation Planning. Available at: http://lib.dr.iastate.edu:
http://lib.dr.iastate.edu/cgi/viewcontent.cgi?article=2649&context=etd

29
ERIA Discussion Paper Series
No. Author(s) Title Year
2015-30
Venkatachalam
ANBUMOZHI, Alex
BOWEN and
Puthusserikunnel
Devasia JOSE
Market-Based Mechanisms to Promote
Renewable Energy in Asia
Apr
2015
2015-29 Venkatachalam
ANBUMOZHI
Low Carbon Green Growth in Asia: What is the
Scope for Regional Cooperation?
Apr
2015
2015-28 Tan LI and Larry D.
QIU
Beyond Trade Creation: Free Trade Agreements
and Trade Disputes
Mar
2015
2015-27 Mai Anh NGO Exporting and Firm-Level Credit Constraints –
Evidence from Ghana
Mar
2015
2015-26
Sunghoon CHUNG,
Joonhyung LEE,
Thomas OSANG
Did China Tire Safeguard Save U.S. Workers? Mar
2015
2015-25
Esther Ann BØLER,
Beata JAVORCIK,
Karen Helene
ULLTVEI-MOE
Globalization: A Woman’s Best Friend?
Exporters and the Gender Wage Gap
Mar
2015
2015-24 Tristan Leo Dallo
AGUSTIN and Martin
SCHRÖDER
The Indian Automotive Industry and the ASEAN
Supply Chain Relations
Mar
2015
2015-23 Hideo KOBAYASHI
and Yingshan JIN The CLMV Automobile and Auto Parts Industry
Mar
2015
2015-22 Hideo KOBAYASHI Current State and Issues of the Automobile and
Auto Parts Industries in ASEAN
Mar
2015
2015-21 Yoshifumi
FUKUNAGA
Assessing the Progress of ASEAN MRAs on
Professional Services
Mar
2015
2015-20 Yoshifumi
FUKUNAGA and
Hikari ISHIDO
Values and Limitations of the ASEAN
Agreement on the Movement of Natural Persons
Mar
2015
2015-19 Nanda NURRIDZKI Learning from the ASEAN + 1 Model and the
ACIA
Mar
2015
30
No. Author(s) Title Year
2015-18
Patarapong
INTARAKUMNERD
and Pun-Arj
CHAIRATANA and
Preeda CHAYANAJIT
Global Production Networks and Host-Site
Industrial Upgrading: The Case of the
Semiconductor Industry in Thailand
Feb
2015
2015-17 Rajah RASIAH and
Yap Xiao SHAN
Institutional Support, Regional Trade Linkages
and Technological Capabilities in the
Semiconductor Industry in Singapore
Feb
2015
2015-16 Rajah RASIAH and
Yap Xiao SHAN
Institutional Support, Regional Trade Linkages
and Technological Capabilities in the
Semiconductor Industry in Malaysia
Feb
2015
2015-15 Xin Xin KONG, Miao
ZHANG and Santha
Chenayah RAMU
China’s Semiconductor Industry in Global Value
Chains
Feb
2015
2015-14 Tin Htoo NAING and
Yap Su FEI
Multinationals, Technology and Regional
Linkages in Myanmar’s Clothing Industry
Feb
2015
2015-13 Vanthana NOLINTHA
and Idris JAJRI
The Garment Industry in Laos: Technological
Capabilities, Global Production Chains and
Competitiveness
Feb
2015
2015-12 Miao ZHANG, Xin Xin
KONG, Santha
Chenayah RAMU
The Transformation of the Clothing Industry in
China
Feb
2015
2015-11
NGUYEN Dinh Chuc,
NGUYEN Dinh Anh,
NGUYEN Ha Trang
and NGUYEN Ngoc
Minh
Host-site institutions, Regional Production Linkages and Technological Upgrading: A study of Automotive Firms in Vietnam
Feb
2015
2015-10
Pararapong
INTERAKUMNERD
and Kriengkrai
TECHAKANONT
Intra-industry Trade, Product Fragmentation and Technological Capability Development in Thai Automotive Industry
Feb
2015
2015-09 Rene E. OFRENEO Auto and Car Parts Production: Can the Philippines Catch Up with Asia
Feb
2015
2015-08
Rajah RASIAH, Rafat
Beigpoor
SHAHRIVAR, Abdusy
Syakur AMIN
Host-site Support, Foreign Ownership, Regional Linkages and Technological Capabilites: Evidence from Automotive Firms in Indonesia
Feb
2015
2015-07 Yansheng LI, Xin Xin
KONG, and Miao
ZHANG
Industrial Upgrading in Global Production Networks: Te Case of the Chinese Automotive Industry
Feb
2015
2015-06 Mukul G. ASHER and
Fauziah ZEN Social Protection in ASEAN: Challenges and Initiatives for Post-2015 Vision
Feb
2015

31
No. Author(s) Title Year
2015-05 Lili Yan ING, Stephen
MAGIERA, and Anika
WIDIANA
Business Licensing: A Key to Investment Climate Reform
Feb
2015
2015-04
Gemma ESTRADA,
James ANGRESANO,
Jo Thori LIND, Niku
MÄÄTÄNEN, William
MCBRIDE, Donghyun
PARK, Motohiro
SATO, and Karin
SVANBORG-
SJÖVALL
Fiscal Policy and Equity in Advanced Economies: Lessons for Asia
Jan
2015
2015-03 Erlinda M. MEDALLA Towards an Enabling Set of Rules of Origin for the Regional Comprehensive Economic Partnership
Jan
2015
2015-02
Archanun
KOHPAIBOON and
Juthathip
JONGWANICH
Use of FTAs from Thai Experience
Jan
2015
2015-01 Misa OKABE Impact of Free Trade Agreements on Trade in East Asia
Jan
2015
2014-26 Hikari ISHIDO Coverage of Trade in Services under ASEAN+1 FTAs
Dec
2014
2014-25 Junianto James
LOSARI
Searching for an Ideal International Investment Protection Regime for ASEAN + Dialogue Partners (RCEP): Where Do We Begin?
Dec
2014
2014-24 Dayong ZHANG and
David C. Broadstock
Impact of International Oil Price Shocks on Consumption Expenditures in ASEAN and East Asia
Nov
2014
2014-23 Dandan ZHANG,
Xunpeng SHI, and Yu
SHENG
Enhanced Measurement of Energy Market Integration in East Asia: An Application of Dynamic Principal Component Analysis
Nov
2014
2014-22 Yanrui WU Deregulation, Competition, and Market Integration in China’s Electricity Sector
Nov
2014
2014-21 Yanfei LI and Youngho
CHANG
Infrastructure Investments for Power Trade and Transmission in ASEAN+2: Costs, Benefits, Long-Term Contracts, and Prioritised Development
Nov
2014
2014-20 Yu SHENG, Yanrui
WU, Xunpeng SHI,
Dandan ZHANG
Market Integration and Energy Trade Efficiency: An Application of Malmqviat Index to Analyse Multi-Product Trade
Nov
2014
2014-19 Andindya
BHATTACHARYA
and Tania
ASEAN-India Gas Cooperation: Redifining India’s “Look East” Policy with Myanmar
Nov
2014

32
No. Author(s) Title Year
BHATTACHARYA
2014-18 Olivier CADOT, Lili
Yan ING How Restrictive Are ASEAN’s RoO?
Sep
2014
2014-17 Sadayuki TAKII Import Penetration, Export Orientation, and Plant Size in Indonesian Manufacturing
July
2014
2014-16 Tomoko INUI, Keiko
ITO, and Daisuke
MIYAKAWA
Japanese Small and Medium-Sized Enterprises’ Export Decisions: The Role of Overseas Market Information
July
2014
2014-15 Han PHOUMIN and
Fukunari KIMURA
Trade-off Relationship between Energy Intensity-thus energy demand- and Income Level: Empirical Evidence and Policy Implications for ASEAN and East Asia Countries
June
2014
2014-14 Cassey LEE The Exporting and Productivity Nexus: Does Firm Size Matter?
May
2014
2014-13 Yifan ZHANG Productivity Evolution of Chinese large and Small Firms in the Era of Globalisation
May
2014
2014-12 Valéria SMEETS, Sharon TRAIBERMAN, Frederic WARZYNSKI
Offshoring and the Shortening of the Quality
Ladder:Evidence from Danish Apparel
May
2014
2014-11 Inkyo CHEONG Korea’s Policy Package for Enhancing its FTA
Utilization and Implications for Korea’s Policy
May
2014
2014-10 Sothea OUM, Dionisius NARJOKO, and Charles HARVIE
Constraints, Determinants of SME Innovation,
and the Role of Government Support
May
2014
2014-09 Christopher PARSONS and Pierre-Louis Vézina
Migrant Networks and Trade: The Vietnamese
Boat People as a Natural Experiment
May
2014
2014-08 Kazunobu HAYAKAWA and Toshiyuki MATSUURA
Dynamic Tow-way Relationship between
Exporting and Importing: Evidence from Japan
May
2014
2014-07 DOAN Thi Thanh Ha and Kozo KIYOTA
Firm-level Evidence on Productivity
Differentials and Turnover in Vietnamese
Manufacturing
Apr
2014
2014-06 Larry QIU and Miaojie YU
Multiproduct Firms, Export Product Scope, and
Trade Liberalization: The Role of Managerial
Efficiency
Apr
2014
2014-05 Han PHOUMIN and Shigeru KIMURA
Analysis on Price Elasticity of Energy Demand
in East Asia: Empirical Evidence and Policy
Apr
2014

33
No. Author(s) Title Year
Implications for ASEAN and East Asia
2014-04 Youngho CHANG and Yanfei LI
Non-renewable Resources in Asian Economies:
Perspectives of Availability, Applicability,
Acceptability, and Affordability
Feb
2014
2014-03 Yasuyuki SAWADA and Fauziah ZEN
Disaster Management in ASEAN Jan
2014
2014-02 Cassey LEE Competition Law Enforcement in Malaysia Jan
2014
2014-01 Rizal SUKMA ASEAN Beyond 2015: The Imperatives for
Further Institutional Changes
Jan
2014
2013-38 Toshihiro OKUBO, Fukunari KIMURA, Nozomu TESHIMA
Asian Fragmentation in the Global Financial
Crisis
Dec
2013
2013-37 Xunpeng SHI and Cecilya MALIK
Assessment of ASEAN Energy Cooperation
within the ASEAN Economic Community
Dec
2013
2013-36 Tereso S. TULLAO, Jr. And Christopher James CABUAY
Eduction and Human Capital Development to
Strengthen R&D Capacity in the ASEAN
Dec
2013
2013-35 Paul A. RASCHKY
Estimating the Effects of West Sumatra Public
Asset Insurance Program on Short-Term
Recovery after the September 2009 Earthquake
Dec
2013
2013-34 Nipon POAPONSAKORN and Pitsom MEETHOM
Impact of the 2011 Floods, and Food
Management in Thailand
Nov
2013
2013-33 Mitsuyo ANDO Development and Resructuring of Regional
Production/Distribution Networks in East Asia
Nov
2013
2013-32 Mitsuyo ANDO and Fukunari KIMURA
Evolution of Machinery Production Networks:
Linkage of North America with East Asia?
Nov
2013
2013-31 Mitsuyo ANDO and Fukunari KIMURA
What are the Opportunities and Challenges for
ASEAN?
Nov
2013
2013-30 Simon PEETMAN Standards Harmonisation in ASEAN: Progress,
Challenges and Moving Beyond 2015
Nov
2013
2013-29 Jonathan KOH and Andrea Feldman MOWERMAN
Towards a Truly Seamless Single Windows and
Trade Facilitation Regime in ASEAN Beyond
2015
Nov
2013
34
No. Author(s) Title Year
2013-28 Rajah RASIAH
Stimulating Innovation in ASEAN Institutional
Support, R&D Activity and Intelletual Property
Rights
Nov
2013
2013-27 Maria Monica WIHARDJA
Financial Integration Challenges in ASEAN
beyond 2015
Nov
2013
2013-26 Tomohiro MACHIKIT
A and Yasushi UEKI
Who Disseminates Technology to Whom, How,
and Why: Evidence from Buyer-Seller Business
Networks
Nov
2013
2013-25 Fukunari KIMURA
Reconstructing the Concept of “Single Market a
Production Base” for ASEAN beyond 2015
Oct
2013
2013-24
Olivier CADOT Ernawati MUNADI Lili Yan ING
Streamlining NTMs in ASEAN:
The Way Forward
Oct
2013
2013-23
Charles HARVIE,
Dionisius NARJOKO, S
othea OUM
Small and Medium Enterprises’ Access to
Finance: Evidence from Selected Asian
Economies
Oct
2013
2013-22 Alan Khee-Jin TAN Toward a Single Aviation Market in ASEAN:
Regulatory Reform and Industry Challenges
Oct
2013
2013-21
Hisanobu SHISHIDO,
Shintaro SUGIYAMA,
Fauziah ZEN
Moving MPAC Forward: Strengthening Public-
Private Partnership, Improving Project Portfolio
and in Search of Practical Financing Schemes
Oct
2013
2013-20
Barry DESKER, Mely
CABALLERO-
ANTHONY, Paul
TENG
Thought/Issues Paper on ASEAN Food Security:
Towards a more Comprehensive Framework
Oct
2013
2013-19
Toshihiro KUDO,
Satoru KUMAGAI, So
UMEZAKI
Making Myanmar the Star Growth Performer in
ASEAN in the Next Decade: A Proposal of Five
Growth Strategies
Sep
2013
2013-18 Ruperto MAJUCA
Managing Economic Shocks and
Macroeconomic Coordination in an Integrated
Region: ASEAN Beyond 2015
Sep
2013
2013-17 Cassy LEE and Yoshifumi
FUKUNAGA
Competition Policy Challenges of Single Market
and Production Base
Sep
2013
35
No. Author(s) Title Year
2013-16 Simon TAY Growing an ASEAN Voice? : A Common
Platform in Global and Regional Governance
Sep
2013
2013-15 Danilo C. ISRAEL and
Roehlano M. BRIONES
Impacts of Natural Disasters on Agriculture, Food
Security, and Natural Resources and Environment in
the Philippines
Aug
2013
2013-14 Allen Yu-Hung LAI and
Seck L. TAN
Impact of Disasters and Disaster Risk Management in
Singapore: A Case Study of Singapore’s Experience
in Fighting the SARS Epidemic
Aug
2013
2013-13 Brent LAYTON Impact of Natural Disasters on Production Networks
and Urbanization in New Zealand
Aug
2013
2013-12 Mitsuyo ANDO Impact of Recent Crises and Disasters on Regional
Production/Distribution Networks and Trade in Japan
Aug
2013
2013-11 Le Dang TRUNG Economic and Welfare Impacts of Disasters in East
Asia and Policy Responses: The Case of Vietnam
Aug
2013
2013-10
Sann VATHANA, Sothea
OUM, Ponhrith KAN,
Colas CHERVIER
Impact of Disasters and Role of Social Protection in
Natural Disaster Risk Management in Cambodia
Aug
2013
2013-09
Sommarat
CHANTARAT, Krirk
PANNANGPETCH,
Nattapong
PUTTANAPONG,
Preesan RAKWATIN,
and Thanasin
TANOMPONGPHANDH
Index-Based Risk Financing and Development of
Natural Disaster Insurance Programs in Developing
Asian Countries
Aug
2013
2013-08 Ikumo ISONO and Satoru
KUMAGAI
Long-run Economic Impacts of Thai Flooding:
Geographical Simulation Analysis
July
2013
2013-07 Yoshifumi FUKUNAGA
and Hikaru ISHIDO
Assessing the Progress of Services Liberalization in
the ASEAN-China Free Trade Area (ACFTA)
May
2013
2013-06
Ken ITAKURA,
Yoshifumi FUKUNAGA,
and Ikumo ISONO
A CGE Study of Economic Impact of Accession of
Hong Kong to ASEAN-China Free Trade Agreement
May
2013
2013-05 Misa OKABE and Shujiro
URATA The Impact of AFTA on Intra-AFTA Trade
May
2013
36
No. Author(s) Title Year
2013-04 Kohei SHIINO How Far Will Hong Kong’s Accession to ACFTA
will Impact on Trade in Goods?
May
2013
2013-03 Cassey LEE and
Yoshifumi FUKUNAGA
ASEAN Regional Cooperation on Competition
Policy
Apr
2013
2013-02 Yoshifumi FUKUNAGA
and Ikumo ISONO
Taking ASEAN+1 FTAs towards the RCEP:
A Mapping Study
Jan
2013
2013-01 Ken ITAKURA
Impact of Liberalization and Improved Connectivity
and Facilitation in ASEAN for the ASEAN Economic
Community
Jan
2013
2012-17 Sun XUEGONG, Guo
LIYAN, Zeng ZHENG
Market Entry Barriers for FDI and Private Investors:
Lessons from China’s Electricity Market
Aug
2012
2012-16 Yanrui WU Electricity Market Integration: Global Trends and
Implications for the EAS Region
Aug
2012
2012-15 Youngho CHANG,
Yanfei LI
Power Generation and Cross-border Grid Planning
for the Integrated ASEAN Electricity Market: A
Dynamic Linear Programming Model
Aug
2012
2012-14 Yanrui WU, Xunpeng
SHI
Economic Development, Energy Market Integration
and Energy Demand: Implications for East Asia
Aug
2012
2012-13
Joshua AIZENMAN,
Minsoo LEE, and
Donghyun PARK
The Relationship between Structural Change and
Inequality: A Conceptual Overview with Special
Reference to Developing Asia
July
2012
2012-12
Hyun-Hoon LEE, Minsoo
LEE, and Donghyun
PARK
Growth Policy and Inequality in Developing Asia:
Lessons from Korea
July
2012
2012-11 Cassey LEE Knowledge Flows, Organization and Innovation:
Firm-Level Evidence from Malaysia
June
2012
2012-10
Jacques MAIRESSE,
Pierre MOHNEN, Yayun
ZHAO, and Feng ZHEN
Globalization, Innovation and Productivity in
Manufacturing Firms: A Study of Four Sectors of
China
June
2012
2012-09 Ari KUNCORO
Globalization and Innovation in Indonesia: Evidence
from Micro-Data on Medium and Large
Manufacturing Establishments
June
2012
2012-08 Alfons
PALANGKARAYA
The Link between Innovation and Export: Evidence
from Australia’s Small and Medium Enterprises
June
2012
2012-07 Chin Hee HAHN and
Chang-Gyun PARK
Direction of Causality in Innovation-Exporting
Linkage: Evidence on Korean Manufacturing
June
2012

37
No. Author(s) Title Year
2012-06 Keiko ITO Source of Learning-by-Exporting Effects: Does
Exporting Promote Innovation?
June
2012
2012-05 Rafaelita M. ALDABA Trade Reforms, Competition, and Innovation in the
Philippines
June
2012
2012-04
Toshiyuki MATSUURA
and Kazunobu
HAYAKAWA
The Role of Trade Costs in FDI Strategy
of Heterogeneous Firms: Evidence from
Japanese Firm-level Data
June
2012
2012-03
Kazunobu HAYAKAWA,
Fukunari KIMURA, and
Hyun-Hoon LEE
How Does Country Risk Matter for Foreign Direct
Investment?
Feb
2012
2012-02
Ikumo ISONO, Satoru
KUMAGAI, Fukunari
KIMURA
Agglomeration and Dispersion in China and ASEAN: A Geographical Simulation Analysis
Jan
2012
2012-01 Mitsuyo ANDO and
Fukunari KIMURA
How Did the Japanese Exports Respond to Two Crises
in the International Production Network?: The Global
Financial Crisis and the East Japan Earthquake
Jan
2012
2011-10 Tomohiro MACHIKITA
and Yasushi UEKI
Interactive Learning-driven Innovation in
Upstream-Downstream Relations: Evidence from
Mutual Exchanges of Engineers in Developing
Economies
Dec
2011
2011-09
Joseph D. ALBA, Wai-
Mun CHIA, and
Donghyun PARK
Foreign Output Shocks and Monetary Policy
Regimes in Small Open Economies: A DSGE
Evaluation of East Asia
Dec
2011
2011-08 Tomohiro MACHIKITA
and Yasushi UEKI
Impacts of Incoming Knowledge on Product
Innovation: Econometric Case Studies of Technology
Transfer of Auto-related Industries in Developing
Economies
Nov
2011
2011-07 Yanrui WU Gas Market Integration: Global Trends and
Implications for the EAS Region
Nov
2011
2011-06 Philip Andrews-SPEED Energy Market Integration in East Asia: A Regional
Public Goods Approach
Nov
2011
2011-05 Yu SHENG,
Xunpeng SHI
Energy Market Integration and Economic
Convergence: Implications for East Asia
Oct
2011
2011-04
Sang-Hyop LEE, Andrew
MASON, and Donghyun
PARK
Why Does Population Aging Matter So Much for
Asia? Population Aging, Economic Security and
Economic Growth in Asia
Aug
2011
2011-03 Xunpeng SHI, Harmonizing Biodiesel Fuel Standards in East Asia: May

38
No. Author(s) Title Year
Shinichi GOTO Current Status, Challenges and the Way Forward 2011
2011-02 Hikari ISHIDO Liberalization of Trade in Services under ASEAN+n :
A Mapping Exercise
May
2011
2011-01
Kuo-I CHANG,
Kazunobu HAYAKAWA
Toshiyuki MATSUURA
Location Choice of Multinational Enterprises in
China: Comparison between Japan and Taiwan
Mar
2011
2010-11
Charles HARVIE,
Dionisius NARJOKO,
Sothea OUM
Firm Characteristic Determinants of SME
Participation in Production Networks
Oct
2010
2010-10 Mitsuyo ANDO Machinery Trade in East Asia, and the Global
Financial Crisis
Oct
2010
2010-09 Fukunari KIMURA
Ayako OBASHI
International Production Networks in Machinery
Industries: Structure and Its Evolution
Sep
2010
2010-08
Tomohiro MACHIKITA,
Shoichi MIYAHARA,
Masatsugu TSUJI, and
Yasushi UEKI
Detecting Effective Knowledge Sources in Product
Innovation: Evidence from Local Firms and
MNCs/JVs in Southeast Asia
Aug
2010
2010-07
Tomohiro MACHIKITA,
Masatsugu TSUJI, and
Yasushi UEKI
How ICTs Raise Manufacturing Performance: Firm-
level Evidence in Southeast Asia
Aug
2010
2010-06 Xunpeng SHI
Carbon Footprint Labeling Activities in the East Asia
Summit Region: Spillover Effects to Less Developed
Countries
July
2010
2010-05
Kazunobu HAYAKAWA,
Fukunari KIMURA, and
Tomohiro MACHIKITA
Firm-level Analysis of Globalization: A Survey of
the Eight Literatures
Mar
2010
2010-04 Tomohiro MACHIKITA
and Yasushi UEKI
The Impacts of Face-to-face and Frequent
Interactions on Innovation:
Upstream-Downstream Relations
Feb
2010
2010-03 Tomohiro MACHIKITA
and Yasushi UEKI
Innovation in Linked and Non-linked Firms:
Effects of Variety of Linkages in East Asia
Feb
2010
2010-02 Tomohiro MACHIKITA
and Yasushi UEKI
Search-theoretic Approach to Securing New
Suppliers: Impacts of Geographic Proximity for
Importer and Non-importer
Feb
2010

39
No. Author(s) Title Year
2010-01 Tomohiro MACHIKITA
and Yasushi UEKI
Spatial Architecture of the Production Networks in
Southeast Asia:
Empirical Evidence from Firm-level Data
Feb
2010
2009-23 Dionisius NARJOKO
Foreign Presence Spillovers and Firms’ Export
Response:
Evidence from the Indonesian Manufacturing
Nov
2009
2009-22
Kazunobu HAYAKAWA,
Daisuke HIRATSUKA,
Kohei SHIINO, and Seiya
SUKEGAWA
Who Uses Free Trade Agreements? Nov
2009
2009-21 Ayako OBASHI Resiliency of Production Networks in Asia:
Evidence from the Asian Crisis
Oct
2009
2009-20 Mitsuyo ANDO and
Fukunari KIMURA Fragmentation in East Asia: Further Evidence
Oct
2009
2009-19 Xunpeng SHI The Prospects for Coal: Global Experience and
Implications for Energy Policy
Sept
2009
2009-18 Sothea OUM Income Distribution and Poverty in a CGE
Framework: A Proposed Methodology
Jun
2009
2009-17 Erlinda M. MEDALLA
and Jenny BALBOA
ASEAN Rules of Origin: Lessons and
Recommendations for the Best Practice
Jun
2009
2009-16 Masami ISHIDA Special Economic Zones and Economic Corridors Jun
2009
2009-15 Toshihiro KUDO Border Area Development in the GMS: Turning the
Periphery into the Center of Growth
May
2009
2009-14 Claire HOLLWEG and
Marn-Heong WONG
Measuring Regulatory Restrictions in Logistics
Services
Apr
2009
2009-13 Loreli C. De DIOS Business View on Trade Facilitation Apr
2009
2009-12 Patricia SOURDIN and
Richard POMFRET Monitoring Trade Costs in Southeast Asia
Apr
2009
2009-11 Philippa DEE and
Huong DINH
Barriers to Trade in Health and Financial Services in
ASEAN
Apr
2009
2009-10 Sayuri SHIRAI
The Impact of the US Subprime Mortgage Crisis on
the World and East Asia: Through Analyses of Cross-
border Capital Movements
Apr
2009
2009-09 Mitsuyo ANDO and International Production Networks and Export/Import
Responsiveness to Exchange Rates: The Case of
Mar
2009

40
No. Author(s) Title Year
Akie IRIYAMA Japanese Manufacturing Firms
2009-08 Archanun
KOHPAIBOON
Vertical and Horizontal FDI Technology
Spillovers:Evidence from Thai Manufacturing
Mar
2009
2009-07
Kazunobu HAYAKAWA,
Fukunari KIMURA, and
Toshiyuki MATSUURA
Gains from Fragmentation at the Firm Level:
Evidence from Japanese Multinationals in East Asia
Mar
2009
2009-06 Dionisius A. NARJOKO
Plant Entry in a More
LiberalisedIndustrialisationProcess: An Experience
of Indonesian Manufacturing during the 1990s
Mar
2009
2009-05
Kazunobu HAYAKAWA,
Fukunari KIMURA, and
Tomohiro MACHIKITA
Firm-level Analysis of Globalization: A Survey Mar
2009
2009-04 Chin Hee HAHN and
Chang-Gyun PARK
Learning-by-exporting in Korean Manufacturing: A
Plant-level Analysis
Mar
2009
2009-03 Ayako OBASHI Stability of Production Networks in East Asia:
Duration and Survival of Trade
Mar
2009
2009-02 Fukunari KIMURA
The Spatial Structure of Production/Distribution
Networks and Its Implication for Technology
Transfers and Spillovers
Mar
2009
2009-01 Fukunari KIMURA and
Ayako OBASHI
International Production Networks: Comparison
between China and ASEAN
Jan
2009
2008-03 Kazunobu HAYAKAWA
and Fukunari KIMURA
The Effect of Exchange Rate Volatility on
International Trade in East Asia
Dec
2008
2008-02
Satoru KUMAGAI,
Toshitaka GOKAN,
Ikumo ISONO, and
Souknilanh KEOLA
Predicting Long-Term Effects of Infrastructure
Development Projects in Continental South East
Asia: IDE Geographical Simulation Model
Dec
2008
2008-01
Kazunobu HAYAKAWA,
Fukunari KIMURA, and
Tomohiro MACHIKITA
Firm-level Analysis of Globalization: A Survey Dec
2008