Market Analytics - December 2010 - Gordon T · PDF fileMarket Analytics - December 2010 ......
25
1 RESTRICTED & CONFIDENTIAL Market Analytics - December 2010 Technical Analysis of the Financial Markets Gordon T Long 12/20/2010
Transcript of Market Analytics - December 2010 - Gordon T · PDF fileMarket Analytics - December 2010 ......

1 RESTRICTED & CONFIDENTIAL
Market Analytics - December 2010 Technical Analysis of the Financial Markets Gordon T Long 12/20/2010

2 RESTRICTED & CONFIDENTIAL
Market Analytics - December 2010 Technical Analysis of the Financial Markets
MARKET ANALYTICS ............................................................................................................................................................................... 3
APPROACH ...................................................................................................................................................................................................... 3
SHORT TERM – TECHNICAL ANALYSIS ........................................................................................................................................................... 4
Gann ............................................................................................................................................................................................................. 4 Elliott Wave .................................................................................................................................................................................................. 5 Channels ...................................................................................................................................................................................................... 6 Bradley Model ............................................................................................................................................................................................. 6 Sentiment ..................................................................................................................................................................................................... 7
Investors Intelligence ............................................................................................................................ 7 American Association of Independent Investors ......................................................................................... 8 National Association of Active Investment Managers (NAAIM) ...................................................................... 9 Sum of Variant Perception Sell Signals ..................................................................................................... 9 Smart Money / Dumb Money Confidence ................................................................................................. 10 Options Speculation Index .................................................................................................................... 10
Oscillators .................................................................................................................................................................................................. 12
INTERMEDIATE TERM – RISK ANALYSIS .................................................................................................................................................... 14
Margin Levels ............................................................................................................................................................................................ 15
LONGER TERM - FUNDAMENTAL ANALYSIS ................................................................................................................................................. 17
Q Ratio ....................................................................................................................................................................................................... 17 Value Line Arithmetic ............................................................................................................................................................................... 20 Shiller PE Ratio ......................................................................................................................................................................................... 20 S&P Earnings Minus 10 Year treasury Yield ......................................................................................................................................... 21
S&P 500 TARGETS ...................................................................................................................................................................................22
CONCLUSION ...........................................................................................................................................................................................23

3 RESTRICTED & CONFIDENTIAL
MARKET ANALYTICS APPROACH
We take a completely different approach to Techno-Fundamental Analysis. It is best summarized as follows: TIME FRAME DURATION APPROACH KEY TOOLS Short Term Less than 90 Days Technical Analysis Elliott Wave Principle, WD Gann,
JD Hurst, Bradley Model, Proprietary Mandelbrot Fractal Generator
Intermediate 12 Months Risk Analysis Global Macro Analysis Tipping Points - Pivots
Longer Term 18 Months + Fundamental Analysis Financial Metrics The Global Macro Analysis, which is so prevalent in our articles and on our Tipping Points site, plays the critical role of bridging our highly analytic Technical Analysis with our detailed Fundamental Analysis. We have found that in the short term the markets are driven by emotion and sentiment. In the longer term, they are driven by financial fundamentals. As Warren Buffett is often quoted as saying: ―In the short term the market is a slot machine but in the long term it is a weighing machine.‖ We have found that the transition shows a lagging correlation between changes in the Global Macro, followed by Corporate Earnings, then followed by the sell side analyst community estimates. Our focus within the Global Macro is:
i) Quantification of Risk, ii) Establishment of pivots through the mapping of Tipping Points iii) Identification of ever shifting competitive financial drivers to corporate profitability
OUR CURRENT MACRO EXPECTATIONS FOR FINANCIAL EQUITY MARKETS
The following schematic best represents the US S&P 500 Stock Index

4 RESTRICTED & CONFIDENTIAL
SHORT TERM – Technical Analysis
"Investors are beginning to feel more confident in the economic recovery and believe that equity prices have
but one direction to move." The market has risen 86% over the last 21 months without a significant Fibonacci correction or consolidation. This is extremely unusual and a strong indicator the market is due for a rest. The market looks overbought and overextended, and is showing signs of an imminent top with:
1- Lagging breadth, 2- A lower number of new highs, 3- Overenthusiastic sentiment, 4- Higher-volume down days and 5- A more frequent number of late-day selloffs.
In the short term we think that potential upside progress is limited while downside corrective risk is high. Gann

5 RESTRICTED & CONFIDENTIAL
Elliott Wave All Elliott Wave Analysis is signaling a major multi-year reversal. We disagree that it is imminent though a continuation and the ongoing period of higher level consolidation is in the works. The real EW count which aligns with the Gann Analysis above we share with our clients only.

6 RESTRICTED & CONFIDENTIAL
Channels The consolidation / correction stage is drawing to a close and will likely end with a retest of the 200 Day Moving Average which will act as a launch pad for the final "Minsky Melt-Up" wave. The 200 DMA test will be approximately 1160 in the S& P 500. This also correlates to a 38.2% Fibonacci retracement since the July 1st lows.
Bradley Model The Bradley Model is a highly proprietary technical analysis methodology. It is signaling that the consolidation ends in late Match with final leg finishing by June 2011. This matches precisely our analysis. We can't show you the Bradley Model but we can give you a 'blurred' view as depicted to the right.

7 RESTRICTED & CONFIDENTIAL
Sentiment
Investors Intelligence

8 RESTRICTED & CONFIDENTIAL
American Association of Independent Investors
As shown in the first chart below, the S&P 500 remains at the very top of its trading range, which is two standard deviations above the index's 50-day moving average. But even though the market is this overbought, only 78% of the stocks in the index are trading above their 50-day moving averages. When the index has been at similar elevated levels over the past year, the percentage of stocks above their 50-days has typically been in the high 80s. The low reading this time around means not all stocks have been participating in the current rally, which is not a good thing.
This week’s surveys of bullish sentiment from Investors Intelligence (II) and the American Association of Individual Investors (AAII) showed the ninth highest combined reading since 1987, and it was the sixth period ever where the combined reading was above 120%. One place where the holiday spirit is not in short supply is the equity market.

9 RESTRICTED & CONFIDENTIAL
National Association of Active Investment Managers (NAAIM)
The National Association of Active Investment Managers (NAAIM) shows that on average they are 81.83% invested. This is in the high end of the range and shows that these managers are quite bullish.
Sum of Variant Perception Sell Signals

10 RESTRICTED & CONFIDENTIAL
Smart Money / Dumb Money Confidence
Options Speculation Index

11 RESTRICTED & CONFIDENTIAL

12 RESTRICTED & CONFIDENTIAL
Oscillators

13 RESTRICTED & CONFIDENTIAL
Both of the charts above indicate we are tracking as expected and there is still another leg down before the consolidation, risk-off stage is complete. Watch the TRIN and McClellan Oscillators. Both are signaling a tradable reversal.

14 RESTRICTED & CONFIDENTIAL
INTERMEDIATE TERM – Risk Analysis
The dramatic rise in the 10 Year US Treasury following the November 3rd FOMC Q2 press release is nothing short of dramatic.
It is reflected across the entire yields curve.
15 RESTRICTED & CONFIDENTIAL
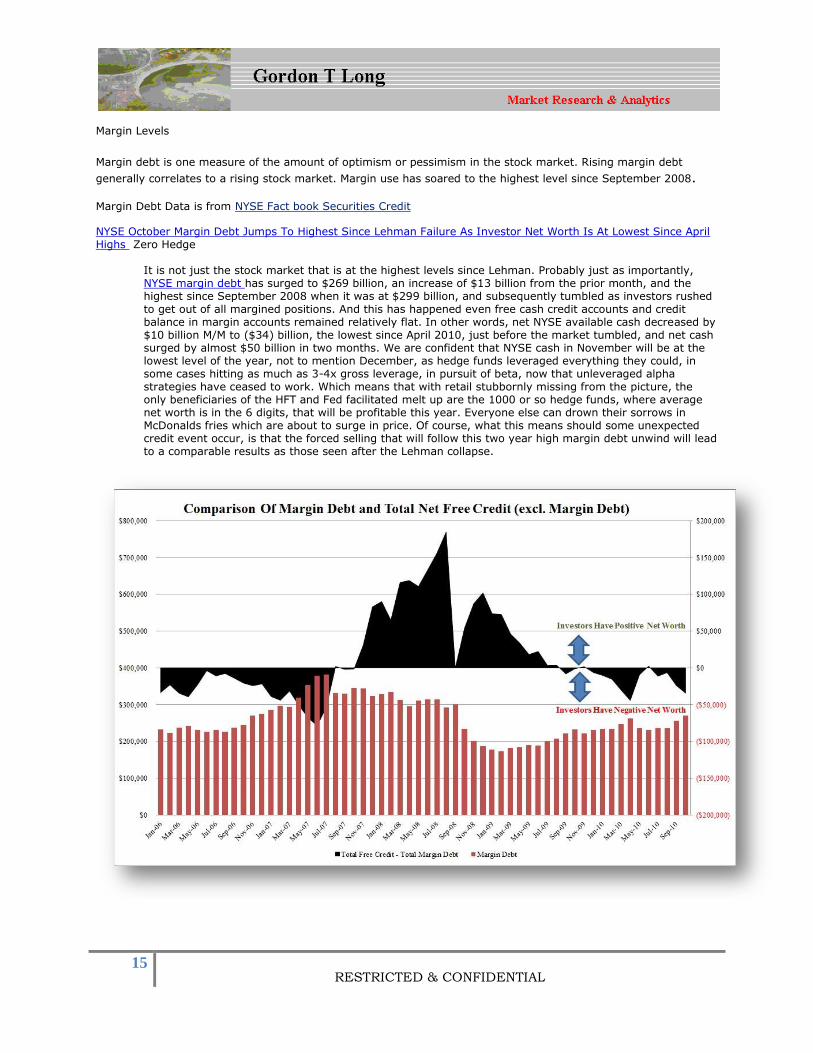
Margin Levels
Margin debt is one measure of the amount of optimism or pessimism in the stock market. Rising margin debt
generally correlates to a rising stock market. Margin use has soared to the highest level since September 2008. Margin Debt Data is from NYSE Fact book Securities Credit
NYSE October Margin Debt Jumps To Highest Since Lehman Failure As Investor Net Worth Is At Lowest Since April Highs Zero Hedge
It is not just the stock market that is at the highest levels since Lehman. Probably just as importantly, NYSE margin debt has surged to $269 billion, an increase of $13 billion from the prior month, and the highest since September 2008 when it was at $299 billion, and subsequently tumbled as investors rushed to get out of all margined positions. And this has happened even free cash credit accounts and credit balance in margin accounts remained relatively flat. In other words, net NYSE available cash decreased by $10 billion M/M to ($34) billion, the lowest since April 2010, just before the market tumbled, and net cash surged by almost $50 billion in two months. We are confident that NYSE cash in November will be at the lowest level of the year, not to mention December, as hedge funds leveraged everything they could, in some cases hitting as much as 3-4x gross leverage, in pursuit of beta, now that unleveraged alpha strategies have ceased to work. Which means that with retail stubbornly missing from the picture, the only beneficiaries of the HFT and Fed facilitated melt up are the 1000 or so hedge funds, where average net worth is in the 6 digits, that will be profitable this year. Everyone else can drown their sorrows in McDonalds fries which are about to surge in price. Of course, what this means should some unexpected credit event occur, is that the forced selling that will follow this two year high margin debt unwind will lead to a comparable results as those seen after the Lehman collapse.

16 RESTRICTED & CONFIDENTIAL
According to Mish in Margin Debt Soars to Highest Levels Since September 2008 mutual fund cash levels have been near record lows since September, and topping it off, a respected friend tells me NYSE cash levels are negative $35 billion.

17 RESTRICTED & CONFIDENTIAL
LONGER TERM - Fundamental Analysis
Warning - An Updated Who's Who of Awful Times to Invest Hussman
The following set of conditions is one way to capture the basic "overvalued, overbought, overbullish, rising-yields" syndrome:
1) S&P 500 more than 8% above its 52 week (exponential) average 2) S&P 500 more than 50% above its 4-year low 3) Shiller P/E greater than 18 4) 10-year Treasury yield higher than 6 months earlier 5) Advisory bullishness > 47%, with bearishness < 27% (Investor's Intelligence)
[These are observationally equivalent to criteria I noted in the July 16, 2007 comment, A Who's Who of Awful Times to Invest. The Shiller P/E is used in place of the price/peak earnings ratio (as the latter can be corrupted when prior peak earnings reflect unusually elevated profit margins). Also, it's sufficient for the market to have advanced substantially from its 4-year low, regardless of whether that advance represents a 4-year high. I've added elevated bullish sentiment with a 20 point spread to capture the "overbullish" part of the syndrome, which doesn't change the set of warnings, but narrows the number of weeks at each peak to the most extreme observations]. The historical instances corresponding to these conditions are as follows:
December 1972 - January 1973 (followed by a 48% collapse over the next 21 months) August - September 1987 (followed by a 34% plunge over the following 3 months) July 1998 (followed abruptly by an 18% loss over the following 3 months) July 1999 (followed by a 12% market loss over the next 3 months) January 2000 (followed by a spike 10% loss over the next 6 weeks) March 2000 (followed by a spike loss of 12% over 3 weeks, and a 49% loss into 2002) July 2007 (followed by a 57% market plunge over the following 21 months) January 2010 (followed by a 7% "air pocket" loss over the next 4 weeks) April 2010 (followed by a 17% market loss over the following 3 months) December 2010
Q Ratio Doug Short is the CEO of Dshort.com. The Q Ratio is a popular method of estimating the fair value of the stock market developed by Nobel Laureate James Tobin. It's a fairly simple concept, but laborious to calculate. The Q Ratio is the total price of the market divided by the replacement cost of all its companies. The data for making the calculation comes from the Federal Reserve Z.1 Flow of Funds Accounts of the United States, which is released quarterly for data that is already over two months old. The first chart shows Q Ratio from 1900 through the first quarter of 2010. I've also extrapolated the ratio since the end of Q3 based on the price of VTI, the Vanguard Total Market ETF, to give a more up-to-date estimate.

18 RESTRICTED & CONFIDENTIAL
Interpreting the Ratio The data since 1945 is a simple calculation using data from the Federal Reserve Z.1 Statistical Release, section B.102., Balance Sheet and Reconciliation Tables for Nonfinancial Corporate Business. Specifically it is the ratio of Line 35 (Market Value) divided by Line 32 (Replacement Cost). It might seem logical that fair value would be a 1:1 ratio. But that has not historically been the case. The explanation, according to Smithers & Co. (more about them later) is that "the replacement cost of company assets is overstated. This is because the long-term real return on corporate equity, according to the published data, is only 4.8%, while the long-term real return to investors is around 6.0%. Over the long-term and in equilibrium, the two must be the same." The average (arithmetic mean) Q ratio is about 0.70. In the chart below I've adjusted the Q Ratio to an arithmetic mean of 1 (i.e., divided the ratio data points by the average). This gives a more intuitive sense to the numbers. For example, the all-time Q Ratio high at the peak of the Tech Bubble was 1.82 — which suggests that the market price was 158% above the historic average of replacement cost. The all-time lows in 1921, 1932 and 1982 were around 0.30, which is about 57% below replacement cost. That's quite a range.

19 RESTRICTED & CONFIDENTIAL
Another Means to an End Smithers & Co., an investment firm in London, incorporates the Q Ratio in their analysis. In fact, CEO Andrew Smithers and economist Stephen Wright of the University of London coauthored a book on the Q Ratio, Valuing Wall Street. They prefer the geometric mean for standardizing the ratio, which has the effect of weighting the numbers toward the mean. The chart below is adjusted to the geometric mean, which, based on the same data as the two charts above, is 0.65. This analysis makes the Tech Bubble an even more dramatic outlier at 179% above the (geometric) mean.

20 RESTRICTED & CONFIDENTIAL
Extrapolating Q Unfortunately, the Q Ratio isn't a very timely metric. The Flow of Funds data is over two months old when it's released, and three months will pass before the next release. To address this problem, I've been making extrapolations for the more recent months based on changes in the market value of the VTI, the Vanguard Total Market ETF, which essentially becomes a surrogate for line 32 in the data. The last two Z.1 releases have validated this approach. Based on the Flow of Funds data, at the end of the third quarter, the Q Ratio was 1.03. The extrapolated monthly ratios for October, November and December are 1.07, 1.08 and 1.12, respectively (the last calculated through today's VTI). Bottom Line: The Message of Q The mean-adjusted charts above indicate that the market remains significantly overvalued by historical standards — by about 59% in the arithmetic-adjusted version and 72% in the geometric-adjusted version. Of course periods of over- and under-valuation can last for many years at a time. Value Line Arithmetic
Shiller PE Ratio

21 RESTRICTED & CONFIDENTIAL
S&P Earnings Minus 10 Year treasury Yield
2010: Bulls Make Money, PIIGS Get Slaughtered
22 RESTRICTED & CONFIDENTIAL
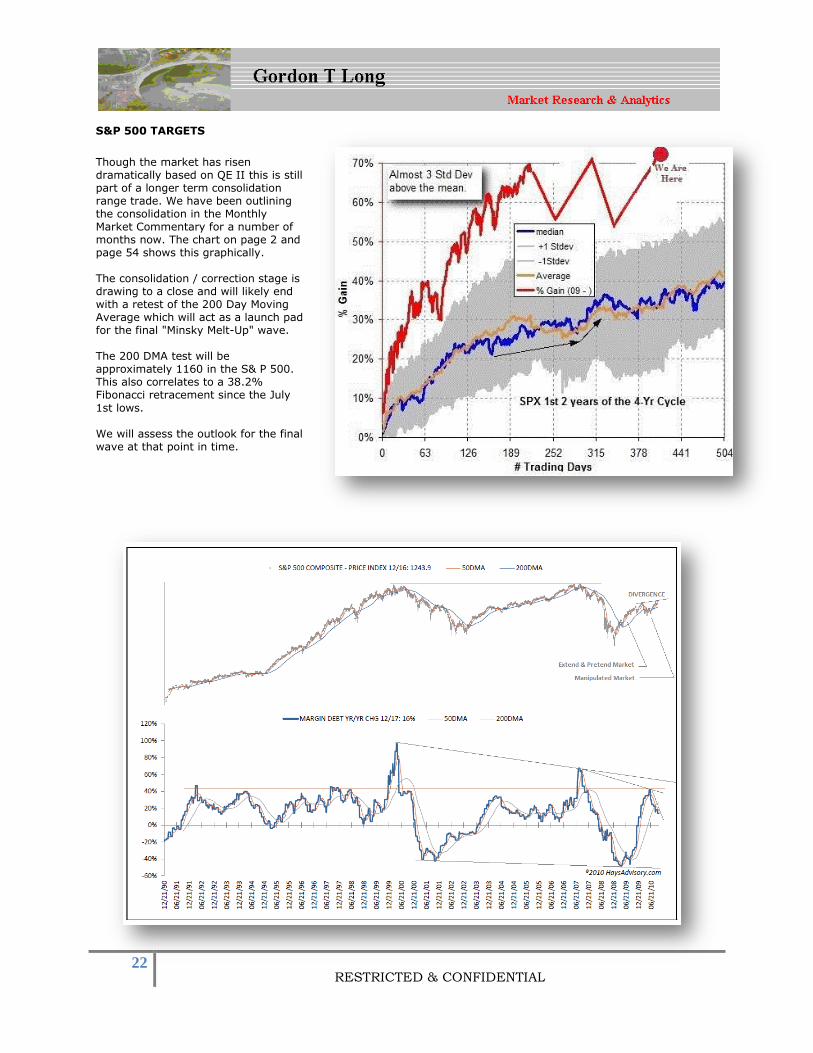
S&P 500 TARGETS
Though the market has risen dramatically based on QE II this is still part of a longer term consolidation range trade. We have been outlining the consolidation in the Monthly Market Commentary for a number of months now. The chart on page 2 and page 54 shows this graphically. The consolidation / correction stage is drawing to a close and will likely end with a retest of the 200 Day Moving Average which will act as a launch pad for the final "Minsky Melt-Up" wave. The 200 DMA test will be approximately 1160 in the S& P 500. This also correlates to a 38.2% Fibonacci retracement since the July
1st lows. We will assess the outlook for the final wave at that point in time.
23 RESTRICTED & CONFIDENTIAL
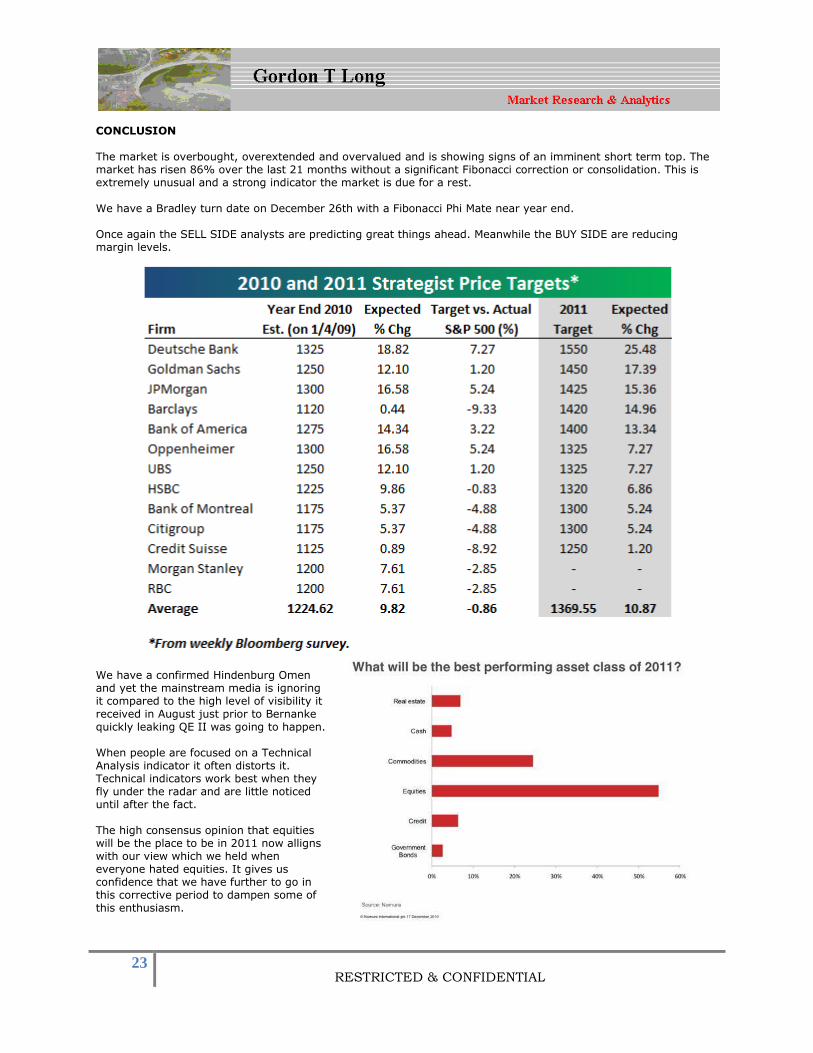
CONCLUSION The market is overbought, overextended and overvalued and is showing signs of an imminent short term top. The market has risen 86% over the last 21 months without a significant Fibonacci correction or consolidation. This is extremely unusual and a strong indicator the market is due for a rest. We have a Bradley turn date on December 26th with a Fibonacci Phi Mate near year end. Once again the SELL SIDE analysts are predicting great things ahead. Meanwhile the BUY SIDE are reducing margin levels.
We have a confirmed Hindenburg Omen and yet the mainstream media is ignoring it compared to the high level of visibility it received in August just prior to Bernanke quickly leaking QE II was going to happen. When people are focused on a Technical Analysis indicator it often distorts it. Technical indicators work best when they fly under the radar and are little noticed until after the fact. The high consensus opinion that equities will be the place to be in 2011 now alligns with our view which we held when everyone hated equities. It gives us confidence that we have further to go in this corrective period to dampen some of this enthusiasm.

24 RESTRICTED & CONFIDENTIAL
"Gold as money is incompatible with unlimited majority rule and scoffs at the idea that money is just 'credit'. It negates any rationale, however farfetched, for the existence of central banks. It precludes 'fractional reserve banking' or any other method of debasing its utility as a medium of exchange. Last and most important, it SEVERELY curbs the power of government to interfere in the lives of its citizens. No assembly of national “leaders” brought together to “modernize” a financial system will ever agree to its use as money. But let one nation anywhere implement it, and the lid blows off."
William A Buckler
Publisher: The Privateer
Extend & Pretend has mutated to another level of US government policy formulation.

25 RESTRICTED & CONFIDENTIAL
MEDIA COVERAGE
I encourage you to look through the COMMENTARY page of Tipping Points for articles you may have missed. I also
encourage you to try our new page for real time Tipping Point news. We continue to make improvements to the page based on reader feedback
Gordon T Long [email protected] Web Page Tipping Points (http://lcmgroupe.home.comcast.net/Tipping_Points.htm) Gordon T Long is not a registered advisor and does not give investment advice. His comments are an expression of opinion only and should not be construed in any manner whatsoever as recommendations to buy or sell a stock, option, future, bond, commodity or any other financial instrument at any time. While he believes his statements to be true, they always depend on the reliability of his own credible sources. Of course, he recommends that you consult with a qualified investment advisor, one licensed by appropriate regulatory agencies in your legal jurisdiction, before making any investment decisions, and barring that you are encouraged to confirm the facts on your own before making important investment commitments. © Copyright 2010 Gordon T Long. The information herein was obtained from sources which Mr. Long believes reliable, but he does not guarantee its accuracy. None of the information, advertisements, website links, or any opinions expressed constitutes a solicitation of the purchase or sale of any securities or commodities. Please note that Mr. Long may already have invested or may from time to time invest in securities that are recommended or otherwise covered on this website. Mr. Long does not intend to disclose the extent of any current holdings or future transactions with respect to any particular security. You should consider this possibility before investing in any security based upon statements and information contained in any report, post, comment or suggestions you receive from him.