MARKET ANALYSIS Proposed Headquarters Hotel...property would contain an appropriate mix of room...
44
MARKET ANALYSIS Proposed Headquarters Hotel BROWARD COUNTY, FLORIDA SUBMITTED TO:Mr. Carlos Puentes Broward County Convention Center 1950 Eisenhower Boulevard Fort Lauderdale, Florida, 33316 [email protected] +1 (954) 765-5908 PREPARED BY: HVS Convention, Sports & Entertainment Facilities Consulting 205 West Randolph Suite 1650 Chicago, Illinois 60606 +1 (312)-587-9900 April 3, 2014
Transcript of MARKET ANALYSIS Proposed Headquarters Hotel...property would contain an appropriate mix of room...

MARKET ANALYSIS
Proposed Headquarters Hotel BROWARD COUNTY, FLORIDA
SUBMITTED TO:EXISTING
Mr. Carlos Puentes Broward County Convention Center 1950 Eisenhower Boulevard Fort Lauderdale, Florida, 33316 [email protected] +1 (954) 765-5908
PREPARED BY:
HVS Convention, Sports & Entertainment Facilities Consulting 205 West Randolph Suite 1650 Chicago, Illinois 60606 +1 (312)-587-9900
April 3, 2014

Convention, Sports & Entertainment Facilities Consulting Chicago, Illinois
April 3, 2014 Mr. Carlos Puentes Broward County Convention Center 1950 Eisenhower Boulevard Fort Lauderdale, Florida, 33316 [email protected] (954) 765-5908
Re: Proposed Headquarters Hotel Ft. Lauderdale, Florida
Dear Mr. Puentes: Pursuant to your request, we herewith submit our Market Analysis of the Proposed Headquarters Hotel in Ft. Lauderdale, Florida. We hereby certify that we have no undisclosed interest in the property, and our employment and compensation are not contingent upon our findings. This study is subject to the comments made throughout this report and to all assumptions and limiting conditions set forth herein. It has been a pleasure working with you. Please let us know if we can provide any additional services. Sincerely,
HVS Convention, Sports & Entertainment Facilities Consulting Thomas A Hazinski Managing Director Brian Harris Director
205 West Randolph
Suite 1650
Chicago, Illinois 60606
+1 312-587-9900
+1 312-488-3631 FAX
www.hvs.com
Atlanta
Boston
Boulder
Chicago
Dallas
Denver
Las Vegas
Mexico City
Miami
Nassau
New York
Newport
San Francisco
Toronto
Vancouver
Washington
Athens
Buenos Aires
Dubai
Hong Kong
Lima
London
Madrid
Mumbai
New Delhi
Sao Paulo
Shanghai
Singapore

Convention, Sports & Entertainment Facilities Consulting Chicago, Illinois
Table of Contents
SECTION TITLE
1. Proposed Headquarters Hotel Market Analysis 2. Statement of Assumptions and Limiting Conditions 3. Certifications

Convention, Sports & Entertainment Facilities Consulting Chicago, Illinois
April 3, 2014 Hotel Market Analysis Headquarters Hotel, Broward County, Florida 1-1
1. Proposed Headquarters Hotel Market Analysis
HVS performed a hotel market analysis for a proposed 750-room convention center headquarters hotel property (“Proposed Headquarters Hotel”) that would be constructed concurrently with the proposed Broward County Convention Center (“BCCC”) expansion. HVS assessed the current hotel room night demand and average daily room rates in a set of completive hotels properties. HVS incorporated its forecast of new hotel room night demand induced by the proposed expansion of the BCCC into the analysis of market occupancy and room rates and market growth in room night demand, assuming that the Proposed Headquarters Hotel would be added to the market. Through a penetration analysis, HVS projected the average daily room rate and occupancy of the Proposed Headquarters Hotel. Using data on the financial operations of comparable hotel properties, HVS generated a ten-year pro forma of hotel operations, which shows the amounts of net operating income that would be available to repay debt or provide a return on equity investment in the Proposed Headquarters Hotel. The Proposed Headquarters Hotel project and the BCCC expansion should be connected to, and integrated with, the existing BCCC, the public spaces, and the waterfront. While the branding of the Proposed Headquarters Hotel is not determined, for the purposes of this report, HVS assumes that the hotel would conform to the brand standards of major nationally branded full-service products. We assume that all property management and guestroom technology would be appropriately installed for the effective management of hotel operation. The property would contain an appropriate mix of room types (king, double, suites, etc.) and should offer the highest quality hotel amenities available in this neighborhood. Under a full-service, upscale scope, the Proposed Headquarters Hotel should offer a significant amount of modern and technologically-advanced meeting space. We have assumed the integration of a fully divisible 40,000 square-foot grand ballroom, a 15,000 square-foot junior ballroom, and 25,000 square feet of primary meeting space for a total of 80,000 square feet of meeting space. The Proposed Headquarters Hotel would also contain a 200 seat full-service restaurant, a 100 seat short-order food outlet, a 113 seat bar/lounge facility, and a 40 seat coffee outlet. Other amenities of a full-service branded hotel would include a pool, whirlpool, fitness center, business center, gift shop, and well-appointed lobby area. Valet parking would be available as well as dedicated self-parking spaces for hotel guests through an operating agreement that should make use of the existing
Description of the Proposed Headquarters Hotel

Convention, Sports & Entertainment Facilities Consulting Chicago, Illinois
April 3, 2014 Hotel Market Analysis Headquarters Hotel, Broward County, Florida 1-2
parking structure and a limited number of parking spaces built adjacent to the Proposed Headquarters Hotel. For the purposes of this analysis, we assume that the Proposed Headquarters Hotel would be financed sometime in 2014-15 and after a three-year design and construction period, the hotel would open in 2018. Overall, the Proposed Headquarters Hotel should offer a well-designed, functional layout of support areas and guestrooms. All typical and market-appropriate features and amenities should be included in the hotel's design. We assume that the building would be fully open and operational on the assumed opening date and would meet all local building codes and brand standards. Furthermore, we assume that the hotel staff would be adequately trained to allow for a successful opening and that pre-marketing efforts would have introduced the product to major local accounts at least six months in advance of the opening date. We assume that the Proposed Headquarters Hotel would be built according to all pertinent codes and brand standards. Moreover, we assume its construction would not create any environmental hazards and that the property would fully comply with the Americans with Disabilities Act. After its opening, the Proposed Headquarters Hotel would require ongoing upgrades and periodic renovations in order to maintain its competitive level in this market. These costs should be adequately funded by the forecasted reserve for replacement, as long as hotel’s staff employs a successful, ongoing preventive-maintenance program. HVS obtained Smith Travel Research (“STR”) data on the historical supply and demand for a set of hotel properties deemed to be competitive with the Proposed Headquarters Hotel. The following map illustrates the locations of the Proposed Headquarters Hotel and its future competitors.
Capital Expenditures
Historical Supply and Demand Data

Convention, Sports & Entertainment Facilities Consulting Chicago, Illinois
April 3, 2014 Hotel Market Analysis Headquarters Hotel, Broward County, Florida 1-3
MAP OF COMPETITION
The following figure shows market-wide occupancy, average rate, and rooms revenue per available room (RevPAR). RevPAR is calculated by multiplying occupancy by average rate and provides an indication of how well rooms revenue is being maximized.

Convention, Sports & Entertainment Facilities Consulting Chicago, Illinois
April 3, 2014 Hotel Market Analysis Headquarters Hotel, Broward County, Florida 1-4
FIGURE 1 HISTORICAL SUPPLY AND DEMAND TRENDS
YearAverage Daily Room Count
Available Room Nights Change
Occupied Room Nights Change Occupancy
Average Rate Change RevPAR Change
2002 4,929 1,799,172 — 1,120,237 — 62.3 % $145.70 — $90.72 — 2003 5,014 1,830,110 1.7 % 1,218,919 8.8 % 66.6 147.04 0.9 % 97.94 8.0 %2004 5,014 1,830,110 0.0 1,297,147 6.4 70.9 148.85 1.2 105.50 7.72005 5,014 1,830,110 0.0 1,234,239 (4.8) 67.4 161.73 8.7 109.07 3.42006 5,014 1,830,110 0.0 1,160,813 (5.9) 63.4 181.95 12.5 115.41 5.82007 4,675 1,706,514 (6.8) 1,184,285 2.0 69.4 188.57 3.6 130.86 13.42008 4,765 1,739,184 1.9 1,140,468 (3.7) 65.6 191.18 1.4 125.36 (4.2)2009 4,645 1,695,373 (2.5) 1,016,860 (10.8) 60.0 169.07 (11.6) 101.41 (19.1)2010 4,994 1,822,688 7.5 1,209,027 18.9 66.3 162.38 (4.0) 107.71 6.22011 4,994 1,822,810 0.0 1,289,922 6.7 70.8 162.35 (0.0) 114.89 6.72012 4,994 1,822,810 0.0 1,349,523 4.6 74.0 163.38 0.6 120.96 5.32013 4,934 1,800,910 (1.2) 1,383,228 2.5 76.8 165.65 1.4 127.23 5.2
Hotels Included in Sample
Hyatt Regency Pier 66 384 Dec-94 Jun 1957Sheraton Hotel Fort Lauderdale Beach Resort 487 Jan-10 Jun 1959Westin Beach Resort & Spa Fort Lauderdale 432 Mar-09 Jun 1966Doubletree Fort Lauderdale Bahia Mar Hotel 296 Dec-11 Jun 1966Hilton Fort Lauderdale Marina 589 Mar-09 Dec 1980Bonaventure Resort & Spa 501 Sep-12 Jan 1982Marriott Harbor Beach Resort & Spa 650 Oct-84 Oct 1984Embassy Suites Fort Lauderdale 17th Street 361 Dec-95 Dec 1986Westin Diplomat Resort Golf & Spa 998 Feb-02 Mar 2000Renaissance Fort Lauderdale Cruise Port Hotel 236 May-01 May 2001
Total 4,934
Source: STR Global
YearOpened
Number Yearof Rooms Affiliated
Convention, Sports & Entertainment Facilities Consulting Chicago, Illinois
April 3, 2014 Hotel Market Analysis Headquarters Hotel, Broward County, Florida 1-5
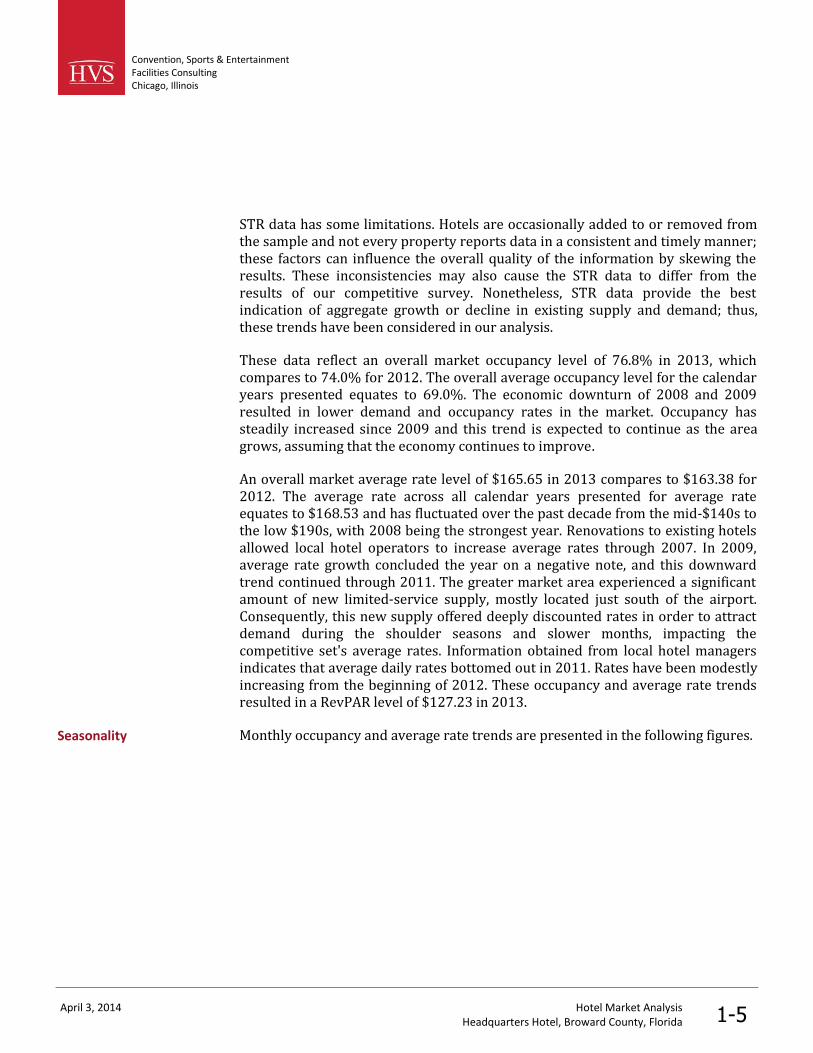
STR data has some limitations. Hotels are occasionally added to or removed from the sample and not every property reports data in a consistent and timely manner; these factors can influence the overall quality of the information by skewing the results. These inconsistencies may also cause the STR data to differ from the results of our competitive survey. Nonetheless, STR data provide the best indication of aggregate growth or decline in existing supply and demand; thus, these trends have been considered in our analysis. These data reflect an overall market occupancy level of 76.8% in 2013, which compares to 74.0% for 2012. The overall average occupancy level for the calendar years presented equates to 69.0%. The economic downturn of 2008 and 2009 resulted in lower demand and occupancy rates in the market. Occupancy has steadily increased since 2009 and this trend is expected to continue as the area grows, assuming that the economy continues to improve. An overall market average rate level of $165.65 in 2013 compares to $163.38 for 2012. The average rate across all calendar years presented for average rate equates to $168.53 and has fluctuated over the past decade from the mid-$140s to the low $190s, with 2008 being the strongest year. Renovations to existing hotels allowed local hotel operators to increase average rates through 2007. In 2009, average rate growth concluded the year on a negative note, and this downward trend continued through 2011. The greater market area experienced a significant amount of new limited-service supply, mostly located just south of the airport. Consequently, this new supply offered deeply discounted rates in order to attract demand during the shoulder seasons and slower months, impacting the competitive set's average rates. Information obtained from local hotel managers indicates that average daily rates bottomed out in 2011. Rates have been modestly increasing from the beginning of 2012. These occupancy and average rate trends resulted in a RevPAR level of $127.23 in 2013. Monthly occupancy and average rate trends are presented in the following figures. Seasonality

Convention, Sports & Entertainment Facilities Consulting Chicago, Illinois
April 3, 2014 Hotel Market Analysis Headquarters Hotel, Broward County, Florida 1-6
FIGURE 2 SEASONALITY GRAPH
$0
$50
$100
$150
$200
$250
0%
10%
20%
30%
40%
50%
60%
70%
80%
90%
Room
Rat
e (a
vera
ged
over
tren
d pe
riod)
Occ
upan
cy (a
vera
ged
over
tren
d pe
riod
)
Source: STR Global
Areawide Occupancy
Areawide Average Rate
Leisure travel drives the highest rates and occupancies during the winter months, with the peak month of February. A review of the trends in occupancy, average rate, and RevPAR by the night of the week over the past three fiscal years provides some insight into the impact that the current economic conditions have had on the competitive lodging market. The data, as provided by Smith Travel Research, is set forth in the following figure.
Patterns of Demand

Convention, Sports & Entertainment Facilities Consulting Chicago, Illinois
April 3, 2014 Hotel Market Analysis Headquarters Hotel, Broward County, Florida 1-7
FIGURE 3 OCCUPANCY, AVERAGE RATE, AND REVPAR BY DAY OF WEEK
$160
$161
$162
$163
$164
$165
$166
$167
0%10%20%30%40%50%60%70%80%90%
ADR
Occ
upan
cy R
ate
Occupancy ADR
The nearby location of the cruise ships in the Port Everglades are an important contributor to the high levels of leisure travel from Thursday to Sunday. Leisure travelers and non-business-related groups generate peak occupancy on Friday and Saturday nights. Peak rate is not generated on Friday and Saturday nights, which is typical for hotel markets. HVS compiled information on the primary and secondary competitors based on personal interviews, site inspections, lodging directories, and our in-house library of operating data. We estimated each property’s penetration factors—the ratio between a specific hotel’s operating results and the corresponding data for the market. Occupancy penetration is the ratio of a hotel’s occupancy to the market occupancy. Yield penetration is the ratio of a hotel’s RevPAR to market RevPAR. If the penetration factor is greater than 100%, the property is performing better than the market as a whole; conversely, if the penetration is less than 100%, the hotel is performing at a level below the market-wide average. Five properties will compete with the Proposed Headquarters Hotel on a primary basis and five properties on a secondary basis. We weighted the room count of each secondary competitor based on its future competitiveness with the Proposed Headquarters Hotel.
Supply
Competitors

Convention, Sports & Entertainment Facilities Consulting Chicago, Illinois
April 3, 2014 Hotel Market Analysis Headquarters Hotel, Broward County, Florida 1-8
The only significant recent change in room supply involves the Westin Diplomat Resort & Spa, which reduced its room count by 60 on January 1, 2013. The following figures set forth the pertinent operating characteristics of the primary and secondary competitors.
FIGURE 4 COMPETITORS – OPERATING PERFORMANCE
Est. Segmentation Estimated 2011 Estimated 2012 Estimated 2013
Property Occ. RevPAR Occ. RevPAR RevPARRevPAR Change
Occupancy Penetration
Yield Penetration
Embassy Suites Fort Lauderdale 17th Street 361 18 % 20 % 42 % 20 % 361 79 % $135.00 $106.65 361 82 % $135.00 $110.70 361 84 % $136.00 $114.24 3.2 % 108.7 % 92.4 %Hilton Fort Lauderdale Marina 589 20 30 40 10 589 72 128.00 92.16 589 78 128.00 99.84 589 81 129.00 104.64 4.8 105.0 84.6Hyatt Regency Pier Sixty-Six 384 10 10 60 20 384 64 145.00 92.80 384 67 149.00 99.83 384 70 150.00 104.52 4.7 90.2 84.5Renaissance Fort Lauderdale Cruise Port Hotel 236 15 15 50 20 236 89 116.00 103.24 236 92 118.00 108.56 236 92 119.00 109.48 0.8 119.1 88.5Sheraton Fort Lauderdale Beach Hotel 487 7 20 50 23 487 67 129.00 86.43 488 72 136.00 97.92 488 75 137.00 102.59 4.8 96.9 83.0
Sub-Totals/Averages 2,057 14 % 21 % 47 % 18 % 2,057 72.5 % $130.67 $94.74 2,058 76.8 % $133.13 $102.29 2,058 79.3 % $134.21 $106.37 4.0 % 102.6 % 86.0 %
Secondary Competitors 2,877 5 % 54 % 30 % 10 % 1,726 70.0 % $192.50 $134.66 1,726 72.1 % $192.05 $138.55 1,687 74.8 % $193.42 $144.75 4.5 % 96.9 % 117.1 %
Totals/Averages 4,934 10 % 35 % 40 % 14 % 3,783 71.3 % $158.33 $112.95 3,785 74.7 % $159.09 $118.83 3,746 77.3 % $160.04 $123.66 4.1 % 100.0 % 100.0 %
Occ.Average
RateNumber
of Rooms
Weighted Annual Room Count
Weighted Annual Room CountCo
nven
tion
Mee
ting
and
Gro
up
Leis
ure
Com
mer
cial
Average Rate
Weighted Annual Room Count
Average Rate
FIGURE 5 SECONDARY COMPETITORS – OPERATING PERFORMANCE
Est. Segmentation Estimated 2011 Estimated 2012 Estimated 2013
Total
PropertyNumber
of RoomsCompetitive
Level Occ.Average
Rate RevPAR Occ.Average
Rate RevPAR Occ.Average
Rate RevPAR
Bonaventure Conference Center & Spa 501 0 % 51 % 30 % 19 % 50 % 251 50 % $130.00 $65.00 251 53 % $133.00 $70.49 251 55 % $134.00 $73.86DoubleTree by Hilton Bahia Mar Fort Lauderdale Beach 296 5 20 70 5 65 192 48 143.00 68.64 192 57 128.00 72.96 192 59 129.00 76.47Marriott Harbor Beach Resort 650 8 50 32 10 65 423 75 220.00 165.00 423 76 220.00 167.20 423 79 222.00 175.47Westin Beach Resort & Spa Fort Lauderdale 432 5 15 55 25 40 173 71 162.00 115.02 173 76 166.00 126.16 173 79 168.00 132.79Westin Diplomat Resort & Spa Hollywood 998 5 75 15 5 65 688 80 206.00 164.80 688 80 209.00 167.20 649 83 211.00 175.55
Totals/Averages 2,877 5 % 54 % 30 % 10 % 59 % 1,726 70.0 % $192.50 $134.66 1,726 72.1 % $192.05 $138.55 1,687 74.8 % $193.42 $144.75
Weighted Annual Room CountCo
mm
ercia
l
Conv
entio
n
Mee
ting
and
Grou
p
Leisu
re
Weighted Annual Room Count
Weighted Annual Room Count
Based on primary research, HVS assumes that 1,350 new hotel rooms will enter the market, including the Proposed Headquarters Hotel. See the figure below.
FIGURE 6 NEW SUPPLY
Total
Proposed PropertyNumber
of Rooms Competitive
Level
Proposed Headquarters Hotel 750 100 % 750Conrad 400 25 100Full Service Hotel 200 75 150
Totals/Averages 1,350 1,000
Weighted Room Count
Supply Changes

Convention, Sports & Entertainment Facilities Consulting Chicago, Illinois
April 3, 2014 Hotel Market Analysis Headquarters Hotel, Broward County, Florida 1-9
Based on media accounts, we assume the former Trump International Hotel & Tower, at 551 North Fort Lauderdale Beach Boulevard, would open as a Conrad Hotel with Hilton management after a $34 million in upgrades. Due to the Fort Lauderdale Beach location and expected luxury product type, this property has been weighted as a secondary competitor. HVS also assumed that a 200-room full-service hotel would open in January of 2019. Given the level of rate and occupancy in the market, some new hotel development is likely to occur after the opening of the Proposed Headquarters Hotel. This property has been weighted as a secondary competitor. While we have taken reasonable steps to investigate proposed hotel projects and their status, due to the nature of real estate development, it is impossible to determine with certainty every hotel that will be opened in the future. Future improvement in market conditions will raise the risk of increased competition. Our forecasts reflect this risk. The following figure presents the most recent trends for the competitive set. HVS estimated performance results and in some cases weighted data on secondary competitors. In this respect, this information differs from the previously presented STR data.
FIGURE 7 HISTORICAL MARKET TRENDS
Year
Est. 2011 985,020 — 1,380,759 — 71.3 % $158.33 — $112.95 — Est. 2012 1,031,790 4.7 % 1,381,418 0.0 % 74.7 159.09 0.5 % 118.83 5.2 %Est. 2013 1,056,361 2.4 1,367,183 (1.0) 77.3 160.04 0.6 123.66 4.1
Avg. Annual Compounded
Accommodated Room Nights % Change
Room Nights Available
Market RevPAR % Change% Change% Change
Market Occupancy Market ADR
For the purpose of the demand analysis, the overall market is divided into four segments based on the nature of travel. Based on our fieldwork and knowledge of the local lodging market, we estimate the 2013 distribution of accommodated room night demand as shown in the figure below.
Demand
Demand Analysis Using Market Segmentation

Convention, Sports & Entertainment Facilities Consulting Chicago, Illinois
April 3, 2014 Hotel Market Analysis Headquarters Hotel, Broward County, Florida 1-10
FIGURE 8 ACCOMMODATED ROOM NIGHT DEMAND
Marketwide
Market Segment
Convention 109,980 10 %Meeting and Group 373,022 35Leisure 421,510 40Commercial 151,849 15
Total 1,056,361 100 %
Accommodated Demand
Percentage of Total
Convention demand (10%) is generated by BCCC events. Meeting and group demand (35%) is from events that occur only within hotels and include group tours. Leisure demand (40%) consists of individual travelers and includes cruise ship passengers staying in hotels before and after cruises. Commercial demand (15%) includes individuals traveling for business purposes, which is a relatively weak source of demand in this market. Based on historical growth rates and on interviews with hotel managers, HVS assumed growth rates in room night demand for each market segment as shown in the figure below.
FIGURE 9 AVERAGE ANNUAL COMPOUNDED MARKET SEGMENT GROWTH RATES
Annual Growth RateMarket Segment
Convention 2.5 % 1.8 % 1.5 % 1.3 % 1.3 % 1.3 % 1.3 % 1.3 %Meeting and Group 2.0 1.5 1.3 1.3 1.3 1.3 1.3 1.3Leisure 2.5 1.8 1.5 1.3 1.3 1.3 1.3 1.3Commercial 2.5 1.8 1.5 1.3 1.3 1.3 1.3 1.3
Base Demand Growth 2.3 % 1.7 % 1.4 % 1.3 % 1.3 % 1.3 % 1.3 % 1.3 %
2017 20192018 2020 20212014 2015 2016
The baseline growth in convention demand does not include the induced demand that could be generated by the BCCC expansion and the opening of the Proposed Headquarters Hotel (see below for a further discussion of induced demand).

Convention, Sports & Entertainment Facilities Consulting Chicago, Illinois
April 3, 2014 Hotel Market Analysis Headquarters Hotel, Broward County, Florida 1-11
Latent demand reflects potential room night demand that has not been realized by the existing competitive supply; this type of demand is divided into unaccommodated demand and induced demand. Unaccommodated demand refers to individuals who are unable to secure accommodations in the market because all the local hotels are filled. These travelers must defer their trips, settle for less desirable accommodations, or stay in properties located outside the market area. Because this demand did not yield occupied room nights, it is not included in the estimate of historical accommodated room night demand. If additional lodging facilities are expected to enter the market, it is reasonable to assume that these guests will be able to secure hotel rooms in the future, and it is therefore necessary to quantify this demand. Unaccommodated demand is further indicated if the market is at all seasonal, with distinct high and low seasons; such seasonality indicates that although year-end occupancy may not average in excess of 70%, the market sells out many nights during the year. The primary source of unaccommodated demand is the popular winter season, which has historically had the highest occupancy rates. The following figure presents our estimate of unaccommodated demand in the subject market. FIGURE 10 UNACCOMMODATED DEMAND ESTIMATE
Market Segment
Convention 109,980 2.9 % 3,161Meeting and Group 373,022 3.3 12,388Leisure 421,510 5.8 24,541Commercial 151,849 2.3 3,498
Total 1,056,361 4.1 % 43,588
Accommodated Room Night Demand
Unaccommodated Demand Percentage
Unaccommodated Room Night Demand
Based upon an analysis of monthly and weekly peak demand and sell-out trends, we estimate that 4.1% of the base-year demand is unaccommodated. Induced demand represents the additional room nights that are expected to be attracted to the market following the introduction of a new demand generator. Situations that can result in induced demand include the opening of a new manufacturing plant, the expansion of a convention center, or the addition of a new hotel with a distinct chain affiliation or unique facilities.
Latent Demand
Unaccommodated Demand
Induced Demand

Convention, Sports & Entertainment Facilities Consulting Chicago, Illinois
April 3, 2014 Hotel Market Analysis Headquarters Hotel, Broward County, Florida 1-12
The expansion of the BCCC creates a larger demand generator, which will induce new demand into the local market. The creation of an integrated convention destination and construction of the ballroom and meeting space associated with the Proposed Headquarters Hotel will also induce new demand into the local market. The following figure summarizes our estimate of induced demand. FIGURE 11 INDUCED DEMAND CALCULATION
Market Segment
Convention 17,100 29,100 46,900 58,900Meeting and Group 4,200 5,100 6,000 6,000Leisure 5,400 6,480 7,200 7,200Commercial 1,800 2,160 2,400 2,400
Total 28,500 42,840 62,500 74,500
20212019 20202018
Accordingly, we have incorporated approximately 75,000 room nights into our analysis, phased-in over a four year ramp-up period. The following figure details our projection of lodging demand growth for the subject market, including the total number of occupied room nights and any residual unaccommodated demand in the market, provided that the BCCC undergoes expansion.
Accommodated Demand and Market-wide Occupancy

Convention, Sports & Entertainment Facilities Consulting Chicago, Illinois
April 3, 2014 Hotel Market Analysis Headquarters Hotel, Broward County, Florida 1-13
FIGURE 12 FORECAST OF MARKET OCCUPANCY
119,411 120,963 122,536 124,129 124,129Unaccommodated Demand 3,432 3,477 3,522 3,568 3,568
17,100 29,100 46,900 58,900 58,900139,943 153,540 172,958 186,597 186,597
Growth Rate 15.4 % 9.7 % 12.6 % 7.9 % 0.0 %
401,052 406,265 411,547 416,897 416,89713,319 13,492 13,668 13,845 13,845
4,200 5,100 6,000 6,000 6,000418,571 424,858 431,214 436,742 436,742
2.3 % 1.5 % 1.5 % 1.3 % 0.0 %
457,653 463,602 469,629 475,734 475,73426,645 26,992 27,343 27,698 27,698
5,400 6,480 7,200 7,200 7,200489,698 497,074 504,172 510,632 510,632
2.4 % 1.5 % 1.4 % 1.3 % 0.0 %
164,870 167,013 169,184 171,384 171,384Unaccommodated Demand 3,798 3,847 3,897 3,948 3,948Induced Demand 1,800 2,160 2,400 2,400 2,400Total Demand 170,467 173,020 175,481 177,731 177,731Growth Rate 2.4 % 1.5 % 1.4 % 1.3 % 0.0 %
Base Demand 1,142,985 1,157,844 1,172,896 1,188,144 1,188,144Unaccommodated Demand 47,194 47,808 48,429 49,059 49,059Induced Demand 28,500 42,840 62,500 74,500 74,500Total Demand 1,218,680 1,248,492 1,283,826 1,311,703 1,311,703less: Residual Demand 7,887 2,782 11,057 18,862 18,862Total Accommodated Demand 1,210,793 1,245,710 1,272,768 1,292,841 1,292,841Overall Demand Growth 11.0 % 2.9 % 2.2 % 1.6 % 0.0 %Market Mix
11.5 % 12.3 % 13.5 % 14.2 % 14.2 %34.3 34.0 33.6 33.3 33.340.2 39.8 39.3 38.9 38.9
Commercial 14.0 13.9 13.7 13.5 13.53,744 3,744 3,744 3,744 3,744
Proposed Headquarters Hotel ¹ 750 750 750 750 750Conrad ² 100 100 100 100 100Full Service Hotel ³ 150 150 150 150
Available Rooms per Night 1,676,774 1,731,524 1,731,524 1,731,524 1,731,524Nights per Year 365 365 365 365 365Total Supply 4,594 4,744 4,744 4,744 4,744Rooms Supply Growth 19.5 % 3.3 % 0.0 % 0.0 % 0.0 %
Marketwide Occupancy 72.2 % 71.9 % 73.5 % 74.7 % 74.7 %
¹ Opening in January 2018 of the 100% competitive, 750-room Proposed Headquarters Hotel² Opening in July 2015 of the 25% competitive, 400-room Conrad³ Opening in January 2019 of the 75% competitive, 200-room Full Service Hotel
Convention
2018 2019 2020
Base Demand
Induced Demand
2021 2022
Growth Rate
Total Demand
Induced DemandTotal Demand
Total Demand
Meeting and GroupBase DemandUnaccommodated DemandInduced Demand
Commercial
Growth Rate
LeisureBase DemandUnaccommodated Demand
Totals
Base Demand
Proposed Hotels
ConventionMeeting and GroupLeisure
Existing Hotel Supply

Convention, Sports & Entertainment Facilities Consulting Chicago, Illinois
April 3, 2014 Hotel Market Analysis Headquarters Hotel, Broward County, Florida 1-14
These room night projections for the market area will be used in forecasting the Proposed Headquarters Hotel's occupancy and average rate later in this report. Along with average rate results, the occupancy levels achieved by a hotel are the foundation of the property's financial performance and market value. Most of a lodging facility's other revenue sources (such as food, beverages, and telephone income) are driven by the number of guests, and many expense levels also vary with occupancy. To a certain degree, management can manipulate the level of occupancy. For example, hotel operators may choose to lower rates in an effort to maximize occupancy. Our forecasts reflect an operating strategy that we believe would be implemented by a typical, professional hotel management team to achieve an optimal mix of occupancy and average rate. The Proposed Headquarters Hotel's forecasted market share and occupancy levels are based upon its anticipated competitive position within the market, as quantified by its penetration rate. The penetration rate is the ratio of a property's market share to its fair share. In the following figure, shows the penetration rates attained by the primary competitors and the aggregate secondary competitors for each segment during the base year.
FIGURE 13 2013 HISTORICAL PENETRATION RATES
Property
Embassy Suites Fort Lauderdale 17th Street 188 % 62 % 114 % 151 % 109 %Hilton Fort Lauderdale Marina 202 89 105 73 105Hyatt Regency Pier Sixty-Six 87 26 136 125 90Renaissance Fort Lauderdale Cruise Port Hotel 172 51 149 166 119Sheraton Fort Lauderdale Beach Hotel 65 55 121 155 97Secondary Competition 49 149 74 68 97
Com
mer
cial
Over
all
Conv
entio
n
Mee
ting a
nd
Grou
p
Leisu
re
The Hilton Fort Lauderdale Marina achieved the highest penetration rate within the convention segment. The highest penetration rate in the meeting and group segment was achieved by the secondary competition, while the Renaissance Fort Lauderdale Cruise Port Hotel led the market with the highest leisure penetration rate.
Projections of Occupancy and Average Rate
Penetration Rate Analysis
Historical Penetration Rates by Market Segment

Convention, Sports & Entertainment Facilities Consulting Chicago, Illinois
April 3, 2014 Hotel Market Analysis Headquarters Hotel, Broward County, Florida 1-15
Because the supply and demand balance for the competitive market is dynamic, there is a circular relationship between the penetration factors of each hotel in the market. The performance of individual new hotels has a direct effect upon the aggregate performance of the market, and consequently upon the calculated penetration factor for each hotel in each market segment. A hotel’s penetration factor is calculated as its market share of demand divided by its fair share of demand. Thus, if one hotel’s penetration performance increases, thereby increasing its achieved market share, this leaves less demand available in the market for the other hotels to capture and the penetration performance of one or more of those other hotels consequently declines (other things remaining equal). This type of market share adjustment takes place every time there is a change in supply, or a change in the relative penetration performance of one or more hotels in the competitive market. Our projections of penetration, demand capture, and occupancy performance for the Proposed Headquarters Hotel account for these types of adjustments to market share within the defined competitive market. Consequently, the actual penetration factors applicable to the Proposed Headquarters Hotel and its competitors for each market segment in each projection year may vary somewhat from the penetration factors delineated in the previous figures. HVS forecast the following occupancy and average rates segment for the competitive set and the Proposed Headquarters Hotel. FIGURE 14 OCCUPANCY AND AVERAGE RATE FORECASTS
Year
Base Year 77.3 % — $160.04 — — $150.00 93.7 %2014 77.6 3.5 % 165.64 — 3.5 % 155.25 93.72015 77.4 3.0 170.61 — 3.0 159.91 93.72016 77.6 2.5 174.88 — 2.5 163.91 93.72017 77.7 2.5 179.25 — 2.5 168.00 93.72018 72.2 2.5 183.73 61.0 % 2.5 172.20 93.72019 71.9 2.5 188.33 64.0 2.5 176.51 93.72020 73.5 2.5 193.03 68.0 2.5 180.92 93.72021 74.7 2.5 197.86 70.0 2.5 185.44 93.7
Average Rate Growth
Area-wide Market (Calendar Year) Subject Property (Calendar Year)
Average Rate
Average Rate Penetration
Average Rate Growth
Average Rate OccupancyOccupancy
Forecast of Proposed Headquarters Hotel’s Occupancy

Convention, Sports & Entertainment Facilities Consulting Chicago, Illinois
April 3, 2014 Hotel Market Analysis Headquarters Hotel, Broward County, Florida 1-16
Using the estimated penetration rates, HVS calculated the room night demand and occupancy of the Proposed Headquarters Hotel as shown in the figure below.
FIGURE 15 OCCUPANCY BY MARKET SEGMENT
Market Segment
ConventionDemand 139,339 153,214 171,555 184,084 184,084Market Share 33.8 % 34.1 % 34.5 % 34.9 % 34.9 %Capture 47,134 52,192 59,148 64,220 64,220Penetration 207 % 215 % 218 % 221 % 221 %
Meeting and GroupDemand 416,301 423,929 427,550 430,528 430,528Market Share 16.4 % 16.4 % 16.7 % 16.7 % 16.7 %Capture 68,331 69,504 71,232 71,728 71,728Penetration 101 % 104 % 105 % 105 % 105 %
LeisureDemand 485,364 495,918 499,643 502,972 502,972Market Share 8.8 % 9.0 % 9.3 % 9.3 % 9.3 %Capture 42,940 44,688 46,564 46,874 46,874Penetration 54 % 57 % 59 % 59 % 59 %
CommercialDemand 169,789 172,649 174,020 175,257 175,257Market Share 5.6 % 5.4 % 5.4 % 5.4 % 5.4 %Capture 9,460 9,275 9,349 9,415 9,415Penetration 34 % 34 % 34 % 34 % 34 %
Total Room Nights Captured 167,866 175,658 186,292 192,236 192,236
Available Room Nights 273,749 273,750 273,750 273,750 273,750
Subject Occupancy 61 % 64 % 68 % 70 % 70 %
Marketwide Available Room Nights 1,676,774 1,731,524 1,731,524 1,731,524 1,731,524
Fair Share 16 % 16 % 16 % 16 % 16 %
Marketwide Occupied Room Nights 1,210,793 1,245,710 1,272,768 1,292,841 1,292,841
Market Share 14 % 14 % 15 % 15 % 15 %
Marketwide Occupancy 72 % 72 % 74 % 75 % 75 %
Total Penetration 85 % 89 % 93 % 94 % 94 %
2020 2021 20222018 2019
The stabilized occupancy rate of 70% reflects the anticipated results of the property over its remaining economic life, given any and all changes in the life cycle of the hotel. Thus, the stabilized occupancy excludes from consideration any

Convention, Sports & Entertainment Facilities Consulting Chicago, Illinois
April 3, 2014 Hotel Market Analysis Headquarters Hotel, Broward County, Florida 1-17
abnormal relationship between supply and demand, as well as any nonrecurring conditions that may result in unusually high or low occupancies. The Proposed Headquarters Hotel may operate at occupancies above or below this stabilized level in any given year. Average rate is calculated by dividing the total rooms revenue achieved during a specified period by the number of rooms sold during the same period. Although the average rate analysis presented here follows the occupancy projection, these two statistics are highly correlated; in reality, one cannot project occupancy without making specific assumptions regarding average rate. This relationship is best illustrated by revenue per available room (RevPAR), which reflects a property's ability to maximize rooms revenue. The following figure summarizes the historical average rate and the RevPAR of the Proposed Headquarters Hotel’s future primary competitors.
FIGURE 16 BASE YEAR AVERAGE RATE AND REVPAR OF THE COMPETITORS
Property
Embassy Suites Fort Lauderdale 17th Street $136.00 85.0 % $114.24 92.4 %Hilton Fort Lauderdale Marina 129.00 80.6 104.64 84.6Hyatt Regency Pier Sixty-Six 150.00 93.7 104.52 84.5Renaissance Fort Lauderdale Cruise Port Hotel 119.00 74.4 109.48 88.5Sheraton Fort Lauderdale Beach Hotel 137.00 85.6 102.59 83.0
Average - Primary Competitors $134.21 83.9 % $106.37 86.0 %Average - Secondary Competitors 193.42 120.9 144.75 117.1
Overall Average $160.04 $123.66
Estimated 2013 Average Room
Rate
Rooms Revenue Per Available
Room (RevPAR)
Average Room Rate Penetration
RevPAR Penetration
The primary competitors realized an overall average rate of $134.21 in the 2013 base year, improving from the 2012 level of $133.13. The Hyatt Regency Pier Sixty-Six achieved the highest estimated average rate in the local competitive market, by a significant margin, because of its strong brand, extensive meeting space and waterfront location. Other important rate aspects of this market include strong winter season and the premium from beach front properties. The selected rate position for the Proposed Headquarters Hotel, in base-year dollars, takes into consideration factors such as the Port Everglades location, connection to the BCCC and expected brand affiliation. We have selected the rate position of $150.00, in base-year dollars, for the Proposed Headquarters Hotel, which is above the average of the primary competitors but below the top performer.
Average Rate Analysis

Convention, Sports & Entertainment Facilities Consulting Chicago, Illinois
April 3, 2014 Hotel Market Analysis Headquarters Hotel, Broward County, Florida 1-18
Based upon our research and analysis, rates fell to a low of approximately $130 during 2011 and then began a modest upward climb. We anticipate modest rate growth to continue as the economy continues to recover from the downturn. Based on these considerations, the following figure illustrates the projected average rate and the growth rates assumed. As a context for the average rate growth factors, note that we have applied a base underlying inflation rate of 2.5% annually throughout our projection period.
FIGURE 17 AVERAGE RATE FORECAST
Year
Base Year 77.3 % — $160.04 — — $150.00 93.7 %2014 77.6 3.5 % 165.64 — 3.5 % 155.25 93.72015 77.4 3.0 170.61 — 3.0 159.91 93.72016 77.6 2.5 174.88 — 2.5 163.91 93.72017 77.7 2.5 179.25 — 2.5 168.00 93.72018 72.2 2.5 183.73 61.0 % 2.5 172.20 93.72019 71.9 2.5 188.33 64.0 2.5 176.51 93.72020 73.5 2.5 193.03 68.0 2.5 180.92 93.72021 74.7 2.5 197.86 70.0 2.5 185.44 93.7
Average Rate Growth
Area-wide Market (Calendar Year) Subject Property (Calendar Year)
Average Rate
Average Rate Penetration
Average Rate Growth
Average Rate OccupancyOccupancy
As illustrated above, a 3.5% growth in the average room rate is expected for the Proposed Headquarters Hotel's positioned base rate from 2013 to 2014. This is followed by growth rates of 3.0% and 2.5% in 2015 and 2016, respectively. The Proposed Headquarters Hotel's rate position should reflect growth similar to market trends because of the proposed hotel's new facility, strong brand affiliation, Port of Everglade location, and connection to the BCCC. The property’s average penetration rate is forecast to reach 93.7% by the stabilized period. A new property must establish its reputation and a client base in the market during its ramp-up period; as such, the Proposed Headquarters Hotel’s average rates in the initial operating period have been discounted to reflect this likelihood. We forecast 2.0% and 1.0% discounts to the Proposed Headquarters Hotel’s forecast room rates in the first two operating years, which would be typical for a new operation of this type.

Convention, Sports & Entertainment Facilities Consulting Chicago, Illinois
April 3, 2014 Hotel Market Analysis Headquarters Hotel, Broward County, Florida 1-19
The following occupancies and average rates will be used to project the Proposed Headquarters Hotel's rooms revenue; this forecast reflects years which begin January 1, 2018 and correspond with our financial projections. FIGURE 18 FORECAST OF OCCUPANCY, AVERAGE RATE, AND REVPAR
Year
2018 61 % 172.20 2.0 % 168.76 102.942019 64 176.51 1.0 174.74 111.842020 68 180.92 0.0 180.92 123.032021 70 185.44 0.0 185.44 129.812022 70 190.08 0.0 190.08 133.06
OccupancyAverage Rate
Before Discount DiscountAverage Rate After Discount RevPAR
The impact of the Proposed Headquarters Hotel’s opening in January 1, 2018 on the competitive set without inclusion of the Proposed Headquarters Hotel (“Competitive Hotels”) is shown in the following figure.
FIGURE 19 FORECAST OF ACCOMMODATED ROOM NIGHT DEMAND IN THE COMPETITIVE HOTELS
2014 2015 2016 2017 2018 2019 2020 2021 2022Occupancy 78% 77% 78% 78% 72% 72% 74% 75% 75%ADR $155.3 $159.9 $163.9 $168.0 $172.2 $176.5 $180.9 $185.4 $190.1Room Nights 1,059,796 1,071,488 1,089,174 1,090,627 1,042,927 1,070,052 1,086,476 1,100,604 1,100,604Annual Change 11,692 17,685 1,454 -47,700 27,125 16,423 14,129 0Change from Prior Year 1.1% 1.7% 0.1% -4.4% 2.6% 1.5% 1.3% 0.0%
HVS used its forecast of room night demand and average rates to calculate the Proposed Headquarters Hotel’s room revenue. HVS forecast the income and expenses for the Proposed Headquarters Hotel. We assume operation would begin on January 1, 2018. The forecast of income and expense is expressed in current dollars for each year. The stabilized year reflects the anticipated operating results of the property over its remaining economic life, given any or all applicable stages of build-up, plateau, and decline in the life cycle of the hotel. Thus, income and expense estimates from the stabilized year forward exclude from consideration any abnormal relationship between supply and demand, as well as any nonrecurring conditions that may result in unusual revenues or expenses. The ten-year period reflects the typical holding period of large real estate assets such as hotels.
Impact on Competitive Set
Projections of Income and Expense

Convention, Sports & Entertainment Facilities Consulting Chicago, Illinois
April 3, 2014 Hotel Market Analysis Headquarters Hotel, Broward County, Florida 1-20
The projection of income and expense for the Proposed Headquarters Hotel rely on sample comparable operating statements from the HVS database of hotel statistics. The comparable financial statements were carefully selected based on similarities with the Proposed Headquarters Hotel including: room count, property type, location in resort markets, amounts of function space, occupancy rates, and average daily room rates. All financial data is presented according to the three most common measures of industry performance: ratio to sales (RTS), amounts per available room (PAR), and amounts per occupied room night (POR). These historical income and expense statements will be used as benchmarks in our forthcoming forecast of income and expense.
FIGURE 20 COMPARABLE OPERATING STATEMENTS: RATIO TO SALES
Comp 1 Comp 2 Comp 3 Comp 4 Comp 5 Subject
Year: 2010/11 2011/12 2012 2012 2013 2013Number of Rooms: 730 to 910 550 to 680 550 to 680 570 to 710 600 to 750 750
Days Open: 365 366 365 365 365 365Occupancy: 72% 69% 78% 81% 78% 70%
Average Rate: $135 $170 $148 $165 $166 $152RevPAR: $97 $116 $116 $133 $130 $107
REVENUE Rooms 61.4 % 49.8 % 68.9 % 56.6 % 67.0 % 63.3 % Food & Beverage 34.8 42.9 28.4 36.6 31.3 32.0 Other Operated Departments 1.3 6.3 2.6 6.8 1.8 3.0 Rentals & Other Income 2.3 1.0 0.0 0.0 0.0 1.7 Total 100.0 100.0 100.0 100.0 100.0 100.0 DEPARTMENTAL EXPENSES* Rooms 23.6 19.5 25.8 29.0 21.3 25.0 Food & Beverage 54.2 60.6 72.6 63.7 70.0 68.0 Other Operated Departments 64.8 94.8 84.2 36.7 89.9 50.0 Total 34.4 41.7 40.7 42.2 37.8 39.1DEPARTMENTAL INCOME 65.6 58.3 59.3 57.8 62.2 60.9OPERATING EXPENSES Administrative & General 7.0 7.1 8.8 8.8 8.3 8.0 Marketing 7.9 8.7 6.6 7.2 8.7 7.1 Property Operations & Maintenance 4.0 3.4 4.5 4.7 3.4 4.5 Utilities 3.1 3.2 4.4 3.9 4.2 5.0 Total 22.1 22.4 24.3 24.6 24.6 24.6HOUSE PROFIT 43.5 35.9 35.0 33.2 37.6 36.3Management Fee 3.0 2.5 3.0 1.0 3.0 3.0INCOME BEFORE FIXED CHARGES 40.5 33.4 32.1 32.2 34.6 33.3
* Departmental expense ratios are expressed as a percentage of departmental revenues
Stabilized $
Comparable Operating Statements

Convention, Sports & Entertainment Facilities Consulting Chicago, Illinois
April 3, 2014 Hotel Market Analysis Headquarters Hotel, Broward County, Florida 1-21
FIGURE 21 COMPARABLE OPERATING STATEMENTS: AMOUNTS PER AVAILABLE ROOM
Comp 1 Comp 2 Comp 3 Comp 4 Comp 5 Subject
Year: 2010/11 2011/12 2012 2012 2013 2013Number of Rooms: 730 to 910 550 to 680 550 to 680 570 to 710 600 to 750 750
Days Open: 365 366 365 365 365 365Occupancy: 72% 69% 78% 81% 78% 70%
Average Rate: $135 $170 $148 $165 $166 $152RevPAR: $97 $116 $116 $133 $130 $107
REVENUE Rooms $35,426 $42,624 $42,284 $48,559 $47,537 $38,888 Food & Beverage 20,100 36,713 17,427 31,366 22,184 19,674 Other Operated Departments 741 5,432 1,624 5,809 1,266 1,852 Rentals & Other Income 1,326 857 0 0 0 1,048 Total 57,694 85,626 61,336 85,734 70,986 61,461 DEPARTMENTAL EXPENSES Rooms 8,350 8,292 10,914 14,092 10,148 9,722 Food & Beverage 10,890 22,249 12,657 19,981 15,532 13,378 Other Operated Departments 480 5,150 1,369 2,129 1,138 926 Total 19,720 35,690 24,940 36,202 26,818 24,026DEPARTMENTAL INCOME 37,974 49,935 36,396 49,532 44,168 37,435OPERATING EXPENSES Administrative & General 4,029 6,094 5,374 7,518 5,905 4,900 Marketing 4,571 7,420 4,035 6,145 6,204 4,350 Property Operations & Maintenance 2,333 2,933 2,789 4,015 2,406 2,750 Utilities 1,816 2,739 2,694 3,381 2,966 3,100 Total 12,749 19,187 14,892 21,059 17,481 15,100HOUSE PROFIT 25,225 30,748 21,504 28,473 26,687 22,335Management Fee 1,730 2,176 1,840 834 2,129 1,844INCOME BEFORE FIXED CHARGES 23,395 28,572 19,664 27,638 24,558 20,491
Stabilized $

Convention, Sports & Entertainment Facilities Consulting Chicago, Illinois
April 3, 2014 Hotel Market Analysis Headquarters Hotel, Broward County, Florida 1-22
FIGURE 22 COMPARABLE OPERATING STATEMENTS: AMOUNTS PER OCCUPIED ROOM
Comp 1 Comp 2 Comp 3 Comp 4 Comp 5 Subject
Year: 2010/11 2011/12 2012 2012 2013 2013Number of Rooms: 730 to 910 550 to 680 550 to 680 570 to 710 600 to 750 750
Days Open: 365 366 365 365 365 365Occupancy: 72% 69% 78% 81% 78% 70%
Average Rate: $135 $170 $148 $165 $166 $152RevPAR: $97 $116 $116 $133 $130 $107
REVENUE Rooms $135.36 $169.69 $147.58 $165.10 $166.33 $152.20 Food & Beverage 76.80 146.16 60.83 106.64 77.62 77.00 Other Operated Departments 2.83 21.62 5.67 19.75 4.43 7.25 Rentals & Other Income 5.07 3.41 0.00 0.00 0.00 4.10 Total 220.45 340.89 214.08 291.49 248.38 240.55 DEPARTMENTAL EXPENSES Rooms 31.90 33.01 38.09 47.91 35.51 38.05 Food & Beverage 41.61 88.58 44.18 67.93 54.35 52.36 Other Operated Departments 1.83 20.50 4.78 7.24 3.98 3.63 Total 75.35 142.09 87.05 123.08 93.84 94.04DEPARTMENTAL INCOME 145.10 198.80 127.03 168.40 154.54 146.52OPERATING EXPENSES Administrative & General 15.40 24.26 18.76 25.56 20.66 19.18 Marketing 17.47 29.54 14.08 20.89 21.71 17.03 Property Operations & Maintenance 8.91 11.68 9.73 13.65 8.42 10.76 Utilities 6.94 10.91 9.40 11.50 10.38 12.13 Total 48.71 76.39 51.98 71.60 61.17 59.10HOUSE PROFIT 96.39 122.41 75.05 96.80 93.38 87.42Management Fee 6.61 8.66 6.42 2.84 7.45 7.22INCOME BEFORE FIXED CHARGES 89.39 113.75 68.63 93.97 85.93 80.20
Stabilized $
We will refer to the comparable operating data in the following discussion of each line item. HVS uses a fixed and variable component model to project a lodging facility's revenue and expense levels. This model is based on the premise that hotel revenues and expenses have one component that is fixed and another that varies directly with occupancy and facility usage. A projection can be made by taking a known level of revenue or expense and calculating its fixed and variable components. The fixed component is then increased in tandem with the underlying rate of inflation, while the variable component is adjusted for a specific measure of volume such as total revenue.
Fixed and Variable Component Analysis

Convention, Sports & Entertainment Facilities Consulting Chicago, Illinois
April 3, 2014 Hotel Market Analysis Headquarters Hotel, Broward County, Florida 1-23
The following figure illustrates the revenue and expense categories that can be projected using this fixed and variable component model. These percentages show the portion of each category that is typically fixed and variable; the middle column describes the basis for calculating the percentage of variability, while the last column sets forth the fixed percentage that has been utilized in this valuation.
FIGURE 23 RANGE OF FIXED AND VARIABLE RATIOS
SelectedCategory Percent Fixed Percent Variable Index of Variability Fixed Ratio
Revenues Food 25 - 50 % 50 - 75 % Occupancy 15 % Beverage 0 - 30 70 - 100 Occupancy 0 Other Operated Departments 10 - 40 60 - 90 Occupancy 10 Rentals & Other Income 30 - 70 30 - 70 Occupancy 10
Departmental Expenses Rooms 50 - 70 30 - 50 Occupancy 60 Food & Beverage 35 - 60 40 - 65 Food & Beverage Revenue 55 Other Operated Departments 40 - 60 40 - 60 Other Operated Departments Revenue 70 Rentals & Other Expenses 30 - 70 30 - 70 Rentals & Other Income 70
Undistributed Operating Expenses Administrative & General 65 - 85 15 - 35 Total Revenue 75 Marketing 65 - 85 15 - 35 Total Revenue 75 Prop. Operations & Maint. 55 - 75 25 - 45 Total Revenue 75 Utilities 75 - 95 5 - 25 Total Revenue 75
Management Fee 0 100 Total Revenue 0
Fixed Expenses Property Taxes 100 0 Total Revenue 100 Insurance 100 0 Total Revenue 100 Reserve for Replacement 0 100 Total Revenue 0
Our fixed and variable projection model is based upon variables that we input for each revenue and expense item for a “base year,” which in this case is the year 2013. The base-year forecast sets forth the ratios to revenue, amounts per available room, or amounts per occupied room that we believe can be achieved at the stated base-year average rate and occupancy. Our input variables are derived from the comparable hotel statements. The model then calculates a base-year forecast of income and expense in these base-year dollars. The actual forecast is derived by adjusting each year’s revenue and expense by the amount fixed (the fixed expense multiplied by the inflated base-year amount) plus the variable amount (the variable expense multiplied by the inflated base-year amount) multiplied by the ratio of the projection year’s occupancy to the base-year occupancy (in the case of departmental revenue and expense) or the ratio of the

Convention, Sports & Entertainment Facilities Consulting Chicago, Illinois
April 3, 2014 Hotel Market Analysis Headquarters Hotel, Broward County, Florida 1-24
projection year’s revenue to the base year’s revenue (in the case of undistributed operating expenses). Fixed expenses remain fixed, increasing only with inflation. Our discussion of the revenue and expense forecast in this report is based upon the output derived from the fixed and variable model. This forecast of revenue and expense is accomplished through a step-by-step approach, following the format of the Uniform System of Accounts for the Lodging Industry. Each category of revenue and expense is estimated separately and combined at the end in the final statement of income and expense. A general rate of inflation must be established that will be applied to most revenue and expense categories. The following figure shows inflation estimates made by economists at some noted institutions and corporations.
Inflation Assumption

Convention, Sports & Entertainment Facilities Consulting Chicago, Illinois
April 3, 2014 Hotel Market Analysis Headquarters Hotel, Broward County, Florida 1-25
FIGURE 24 INFLATION ESTIMATES
Dec. June Dec. June Dec.Name Firm 2013 2014 2014 2015 2015
Lewis Alexander Nomura Securities International 1.3 % 1.9 % 1.9 % 1.9 % 2.0 %Paul Ashworth Capital Economics 1.4 1.8 1.9 2.0 2.0Beth Ann Bovino Standard and Poor's 1.1 1.5 1.7 1.7 1.9Jay Brinkmann Mortgage Bankers Association 1.5 2.1 2.0 2.1 2.3Michael Carey Credit Agricole CIB 1.5 1.4 1.8 1.9 2.0Joseph Carson AllianceBernstein 1.8 2.0 2.0 2.2 2.4Julia Coronado BNP Paribas 1.5 1.3 1.7 1.8 1.8Mike Cosgrove Econoclast 1.8 2.0 2.0 2.3 2.4Lou Crandall Wrightson ICAP 1.4 1.5 2.2 2.4 2.5J. Dewey Daane Vanderbilt University 1.0 2.0 2.0 2.0 2.0Douglas Duncan Fannie Mae 1.1 1.5 1.6 1.7 1.8Robert Dye Comerica Bank 1.2 1.7 1.8 1.8 1.9Maria Fiorini Ramirez/Joshua Shapiro MFR, Inc. 1.3 1.8 1.8 — — Doug Handler IHS Global Insight 1.5 1.5 1.5 1.6 1.7Ethan Harris Bank of America Securities- Merrill Lynch 1.5 1.4 1.4 — — Maury Harris UBS 1.2 1.8 2.4 2.5 2.5Jan Hatzius Goldman, Sachs & Co. 1.2 1.7 1.7 1.8 2.0Tracy Herrick Avidbank 2.6 2.7 2.9 3.4 3.9Stuart Hoffman PNC Financial Services Group 1.2 1.8 2.0 2.2 2.2Joseph LaVorgna Deutsche Bank Securities, Inc. 1.8 2.7 2.6 2.4 2.2Edward Leamer/David Shulman UCLA Anderson Forecast 1.4 1.6 2.0 2.4 2.3Don Leavens/Tim Gill NEMA Business Information Services 1.6 1.9 2.0 2.1 2.2John Lonski Moody's Investors Service 1.3 1.6 1.8 1.8 1.6Dean Maki Barclays Capital 1.7 1.7 2.2 — — Aneta Markowska Societe Generale 1.3 1.4 2.0 2.0 2.4Jim Meil/Arun Raha Eaton Corp. 1.0 1.4 1.8 2.0 2.1Robert Mellman JP Morgan Chase & Co. 1.2 1.6 1.6 1.8 1.9Michael P. Niemira International Council of Shopping Centers 1.5 2.2 2.3 2.5 2.5Jim O'Sullivan High Frequency Economics 1.2 1.7 2.3 2.4 2.5Dr. Joel Prakken/ Chris Varvares Macroeconomic Advisers 1.1 1.7 1.7 1.7 1.8Vincent Reinhart Morgan Stanley 1.7 1.9 2.0 2.0 2.1John Ryding/Conrad DeQuadros RDQ Economics 1.3 1.8 2.3 — — Ian Shepherdson Pantheon Macroeconomics 1.7 1.9 1.9 2.0 2.0Allen Sinai Decision Economics, Inc. 1.4 1.6 2.8 2.2 2.3James F. Smith Parsec Financial Management 1.0 1.0 1.1 1.2 1.3Sean M. Snaith University of Central Florida 1.0 1.9 1.6 1.6 1.7Sung Won Sohn California State University 1.8 1.9 1.7 1.6 1.9Neal Soss CSFB 1.5 1.4 1.7 — — Stephen Stanley Pierpont Securities 1.6 2.0 2.4 2.6 2.9Susan M. Sterne Economic Analysis Associates Inc. 1.6 1.9 2.6 2.1 2.0Diane Swonk Mesirow Financial 1.2 1.3 1.4 1.5 1.6Carl Tannenbaum The Northern Trust 1.5 1.6 2.0 2.1 2.2Bart van Ark The Conference Board 1.2 1.8 2.0 2.1 2.2Brian S. Wesbury/ Robert Stein First Trust Advisors, L.P. 1.3 1.9 2.0 2.3 2.5William T. Wilson Skolkovo Institute for Emerging Market Studies 0.9 1.1 1.2 1.6 1.8Lawrence Yun National Association of Realtors 1.2 2.3 2.8 3.3 3.4
Averages: 1.4 % 1.7 % 2.0 % 2.1 % 2.2 %
Source: wsj.com, January 15, 2014
Projected Increase in Consumer Price Index (Annualized Rate Versus 12 Months Earlier)
Convention, Sports & Entertainment Facilities Consulting Chicago, Illinois
April 3, 2014 Hotel Market Analysis Headquarters Hotel, Broward County, Florida 1-26
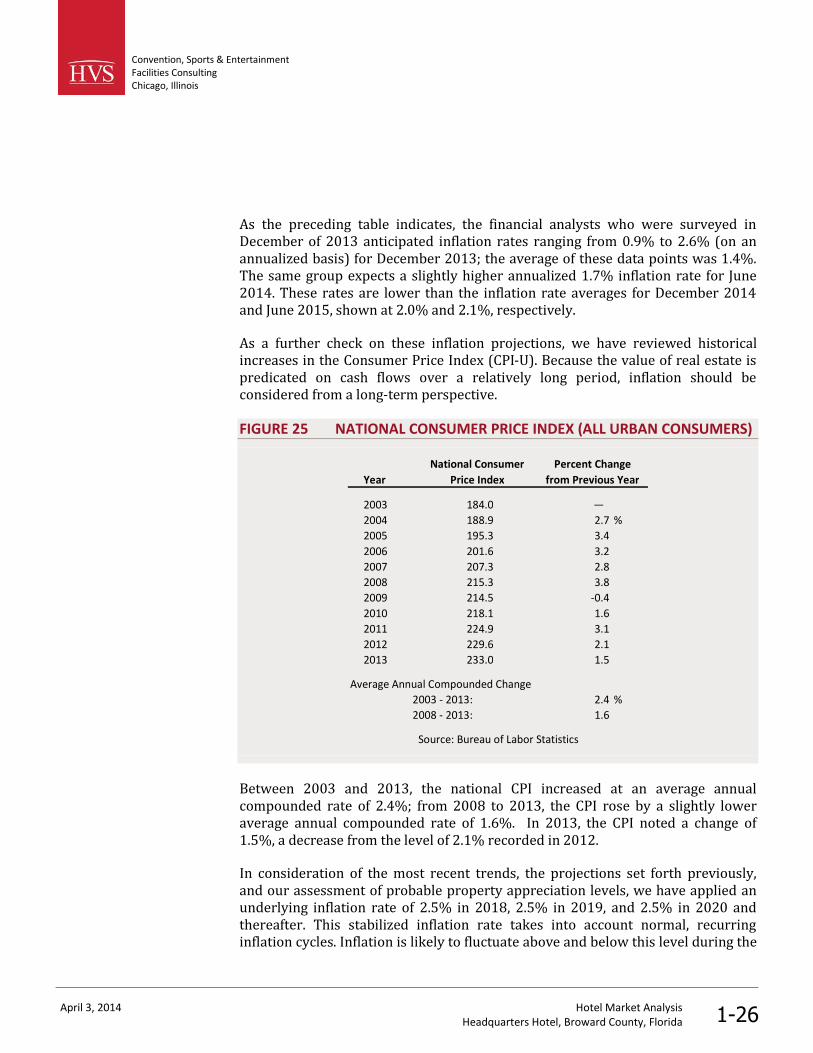
As the preceding table indicates, the financial analysts who were surveyed in December of 2013 anticipated inflation rates ranging from 0.9% to 2.6% (on an annualized basis) for December 2013; the average of these data points was 1.4%. The same group expects a slightly higher annualized 1.7% inflation rate for June 2014. These rates are lower than the inflation rate averages for December 2014 and June 2015, shown at 2.0% and 2.1%, respectively. As a further check on these inflation projections, we have reviewed historical increases in the Consumer Price Index (CPI-U). Because the value of real estate is predicated on cash flows over a relatively long period, inflation should be considered from a long-term perspective. FIGURE 25 NATIONAL CONSUMER PRICE INDEX (ALL URBAN CONSUMERS)
National Consumer Percent ChangeYear Price Index from Previous Year
2003 184.0 — 2004 188.9 2.7 %2005 195.3 3.42006 201.6 3.22007 207.3 2.82008 215.3 3.82009 214.5 -0.42010 218.1 1.62011 224.9 3.12012 229.6 2.12013 233.0 1.5
Average Annual Compounded Change2003 - 2013: 2.4 %2008 - 2013: 1.6
Source: Bureau of Labor Statistics
Between 2003 and 2013, the national CPI increased at an average annual compounded rate of 2.4%; from 2008 to 2013, the CPI rose by a slightly lower average annual compounded rate of 1.6%. In 2013, the CPI noted a change of 1.5%, a decrease from the level of 2.1% recorded in 2012. In consideration of the most recent trends, the projections set forth previously, and our assessment of probable property appreciation levels, we have applied an underlying inflation rate of 2.5% in 2018, 2.5% in 2019, and 2.5% in 2020 and thereafter. This stabilized inflation rate takes into account normal, recurring inflation cycles. Inflation is likely to fluctuate above and below this level during the
Convention, Sports & Entertainment Facilities Consulting Chicago, Illinois
April 3, 2014 Hotel Market Analysis Headquarters Hotel, Broward County, Florida 1-27
projection period. Any exceptions to the application of the assumed underlying inflation rate are discussed in our write-up of individual income and expense items. The following figure presents a detailed forecast through the fifth projection year, including amounts per available room and per occupied room. The second figure illustrates our ten-year forecast of income and expense, presented with a lesser degree of detail. The forecasts pertain to years beginning January 1, 2018 and are expressed in inflated dollars for each year.
Summary of Projections

Convention, Sports & Entertainment Facilities Consulting Chicago, Illinois
April 3, 2014 Hotel Market Analysis Headquarters Hotel, Broward County, Florida 1-28
FIGURE 26 DETAILED FORECAST OF INCOME AND EXPENSE
2018 (Calendar Year) 2019 2020 Stabilized 2022
Number of Rooms: 750 750 750 750 750Occupancy: 61% 64% 68% 70% 70%Average Rate: $168.76 $174.74 $180.92 $185.44 $190.08RevPAR: $102.94 $111.84 $123.03 $129.81 $133.06Days Open: 365 365 365 365 365Occupied Rooms: 166,988 %Gross PAR POR 175,200 %Gross PAR POR 186,150 %Gross PAR POR 191,625 %Gross PAR POR 191,625 %Gross PAR POR REVENUE Rooms $28,181 62.3 % $37,575 $168.76 $30,615 62.7 % $40,820 $174.74 $33,678 63.2 % $44,904 $180.92 $35,536 63.3 % $47,381 $185.45 $36,424 63.3 % $48,565 $190.08 Food 12,552 27.8 16,736 75.17 13,392 27.4 17,856 76.44 14,446 27.1 19,262 77.61 15,176 27.0 20,235 79.20 15,555 27.0 20,740 81.18 Beverage 2,317 5.1 3,090 13.88 2,472 5.1 3,297 14.11 2,667 5.0 3,556 14.33 2,802 5.0 3,736 14.62 2,872 5.0 3,829 14.99 Other Operated Departments 1,390 3.1 1,853 8.32 1,487 3.0 1,982 8.49 1,609 3.0 2,145 8.64 1,693 3.0 2,257 8.83 1,735 3.0 2,313 9.05 Rentals & Other Income 786 1.7 1,048 4.71 841 1.7 1,121 4.80 910 1.7 1,213 4.89 957 1.7 1,276 5.00 981 1.7 1,308 5.12 Total Revenues 45,227 100.0 60,302 270.84 48,807 100.0 65,077 278.58 53,310 100.0 71,080 286.38 56,164 100.0 74,885 293.09 57,567 100.0 76,756 300.42DEPARTMENTAL EXPENSES * Rooms 7,825 27.8 10,434 46.86 8,166 26.7 10,888 46.61 8,568 25.4 11,424 46.03 8,884 25.0 11,845 46.36 9,106 25.0 12,141 47.52 Food & Beverage 10,794 72.6 14,392 64.64 11,254 70.9 15,006 64.24 11,796 68.9 15,728 63.37 12,225 68.0 16,300 63.80 12,530 68.0 16,707 65.39 Other Operated Departments 759 54.6 1,012 4.54 787 52.9 1,049 4.49 819 50.9 1,092 4.40 846 50.0 1,128 4.42 868 50.0 1,157 4.53 Total 19,378 42.8 25,837 116.04 20,207 41.4 26,943 115.34 21,184 39.7 28,245 113.80 21,955 39.1 29,273 114.57 22,504 39.1 30,005 117.44DEPARTMENTAL INCOME 25,849 57.2 34,465 154.80 28,600 58.6 38,134 163.24 32,126 60.3 42,835 172.58 34,209 60.9 45,611 178.52 35,063 60.9 46,751 182.98UNDISTRIBUTED OPERATING EXPENSES Administrative & General 4,020 8.9 5,360 24.07 4,169 8.5 5,559 23.80 4,339 8.1 5,785 23.31 4,478 8.0 5,970 23.37 4,590 8.0 6,119 23.95 Marketing 3,569 7.9 4,758 21.37 3,701 7.6 4,935 21.13 3,852 7.2 5,136 20.69 3,975 7.1 5,300 20.74 4,074 7.1 5,433 21.26 Prop. Operations & Maint. 2,256 5.0 3,008 13.51 2,340 4.8 3,120 13.36 2,435 4.6 3,247 13.08 2,513 4.5 3,351 13.11 2,576 4.5 3,434 13.44 Utilities 2,543 5.6 3,391 15.23 2,638 5.4 3,517 15.06 2,745 5.1 3,660 14.75 2,833 5.0 3,777 14.78 2,904 5.0 3,871 15.15 Total 12,388 27.4 16,517 74.18 12,848 26.3 17,131 73.33 13,371 25.0 17,828 71.83 13,798 24.6 18,398 72.01 14,143 24.6 18,858 73.81HOUSE PROFIT 13,461 29.8 17,948 80.61 15,752 32.3 21,003 89.91 18,756 35.3 25,007 100.75 20,410 36.3 27,213 106.51 20,920 36.3 27,893 109.17Management Fee 1,357 3.0 1,809 8.13 1,464 3.0 1,952 8.36 1,599 3.0 2,132 8.59 1,685 3.0 2,247 8.79 1,727 3.0 2,303 9.01INCOME BEFORE FIXED CHARGES 12,104 26.8 16,139 72.49 14,288 29.3 19,051 81.55 17,156 32.3 22,875 92.16 18,725 33.3 24,967 97.72 19,193 33.3 25,591 100.16FIXED EXPENSES Insurance 1,527 3.4 2,037 9.15 1,566 3.2 2,087 8.94 1,605 3.0 2,140 8.62 1,645 2.9 2,193 8.58 1,686 2.9 2,248 8.80 Reserve for Replacement 905 2.0 1,206 5.42 1,464 3.0 1,952 8.36 2,132 4.0 2,843 11.46 2,247 4.0 2,995 11.72 2,303 4.0 3,070 12.02 Total 2,432 5.4 3,243 14.56 3,030 6.2 4,040 17.29 3,737 7.0 4,983 20.08 3,891 6.9 5,189 20.31 3,989 6.9 5,318 20.81NET INCOME $9,672 21.4 % $12,897 $57.92 $11,258 23.1 % $15,011 $64.26 $13,419 25.3 % $17,892 $72.09 $14,834 26.4 % $19,778 $77.41 $15,204 26.4 % $20,272 $79.34
*Departmental expenses are expressed as a percentage of departmental revenues.

Convention, Sports & Entertainment Facilities Consulting Chicago, Illinois
April 3, 2014 Hotel Market Analysis Headquarters Hotel, Broward County, Florida 1-29
FIGURE 27 TEN-YEAR FORECAST OF INCOME AND EXPENSE
2018 2019 2020 2021 2022 2023 2024 2025 2026 2027
Number of Rooms: 750 750 750 750 750 750 750 750 750 750Occupied Rooms: 166,988 175,200 186,150 191,625 191,625 191,625 191,625 191,625 191,625 191,625Occupancy: 61% 64% 68% 70% 70% 70% 70% 70% 70% 70%Average Rate: $168.76 % of $174.74 % of $180.92 % of $185.44 % of $190.08 % of $194.83 % of $199.70 % of $204.70 % of $209.81 % of $215.06RevPAR: $102.94 Gross $111.84 Gross $123.03 Gross $129.81 Gross $133.06 Gross $136.38 Gross $139.79 Gross $143.29 Gross $146.87 Gross $150.54REVENUE Rooms $28,181 62.3 % $30,615 62.7 % $33,678 63.2 % $35,536 63.3 % $36,424 63.3 % $37,335 63.3 % $38,268 63.3 % $39,225 63.3 % $40,205 63.3 % $41,210 63.3 % Food 12,552 27.8 13,392 27.4 14,446 27.1 15,176 27.0 15,555 27.0 15,944 27.0 16,343 27.0 16,751 27.0 17,170 27.0 17,599 27.0 Beverage 2,317 5.1 2,472 5.1 2,667 5.0 2,802 5.0 2,872 5.0 2,944 5.0 3,017 5.0 3,093 5.0 3,170 5.0 3,249 5.0 Other Operated Departments 1,390 3.1 1,487 3.0 1,609 3.0 1,693 3.0 1,735 3.0 1,778 3.0 1,823 3.0 1,868 3.0 1,915 3.0 1,963 3.0 Rentals & Other Income 786 1.7 841 1.7 910 1.7 957 1.7 981 1.7 1,006 1.7 1,031 1.7 1,057 1.7 1,083 1.7 1,110 1.7 Total 45,227 100.0 48,807 100.0 53,310 100.0 56,164 100.0 57,567 100.0 59,007 100.0 60,482 100.0 61,994 100.0 63,543 100.0 65,132 100.0 DEPARTMENTAL EXPENSES* Rooms 7,825 27.8 8,166 26.7 8,568 25.4 8,884 25.0 9,106 25.0 9,334 25.0 9,567 25.0 9,806 25.0 10,051 25.0 10,303 25.0 Food & Beverage 10,794 72.6 11,254 70.9 11,796 68.9 12,225 68.0 12,530 68.0 12,844 68.0 13,165 68.0 13,494 68.0 13,831 68.0 14,177 68.0 Other Operated Departments 759 54.6 787 52.9 819 50.9 846 50.0 868 50.0 889 50.0 911 50.0 934 50.0 958 50.0 982 50.0 Total 19,378 42.8 20,207 41.4 21,184 39.7 21,955 39.1 22,504 39.1 23,067 39.1 23,643 39.1 24,234 39.1 24,840 39.1 25,461 39.1DEPARTMENTAL INCOME 25,849 57.2 28,600 58.6 32,126 60.3 34,209 60.9 35,063 60.9 35,940 60.9 36,838 60.9 37,760 60.9 38,703 60.9 39,671 60.9UNDISTRIBUTED OPERATING EXPENSES Administrative & General 4,020 8.9 4,169 8.5 4,339 8.1 4,478 8.0 4,590 8.0 4,704 8.0 4,822 8.0 4,942 8.0 5,066 8.0 5,193 8.0 Marketing 3,569 7.9 3,701 7.6 3,852 7.2 3,975 7.1 4,074 7.1 4,176 7.1 4,281 7.1 4,388 7.1 4,497 7.1 4,610 7.1 Prop. Operations & Maint. 2,256 5.0 2,340 4.8 2,435 4.6 2,513 4.5 2,576 4.5 2,640 4.5 2,706 4.5 2,774 4.5 2,843 4.5 2,914 4.5 Utilities 2,543 5.6 2,638 5.4 2,745 5.1 2,833 5.0 2,904 5.0 2,976 5.0 3,051 5.0 3,127 5.0 3,205 5.0 3,285 5.0 Total 12,388 27.4 12,848 26.3 13,371 25.0 13,798 24.6 14,143 24.6 14,497 24.6 14,859 24.6 15,231 24.6 15,612 24.6 16,002 24.6HOUSE PROFIT 13,461 29.8 15,752 32.3 18,756 35.3 20,410 36.3 20,920 36.3 21,443 36.3 21,979 36.3 22,529 36.3 23,091 36.3 23,669 36.3Management Fee 1,357 3.0 1,464 3.0 1,599 3.0 1,685 3.0 1,727 3.0 1,770 3.0 1,814 3.0 1,860 3.0 1,906 3.0 1,954 3.0INCOME BEFORE FIXED CHARGES 12,104 26.8 14,288 29.3 17,156 32.3 18,725 33.3 19,193 33.3 19,673 33.3 20,165 33.3 20,669 33.3 21,185 33.3 21,715 33.3FIXED EXPENSES Insurance 1,527 3.4 1,566 3.2 1,605 3.0 1,645 2.9 1,686 2.9 1,728 2.9 1,771 2.9 1,816 2.9 1,861 2.9 1,908 2.9 Reserve for Replacement 905 2.0 1,464 3.0 2,132 4.0 2,247 4.0 2,303 4.0 2,360 4.0 2,419 4.0 2,480 4.0 2,542 4.0 2,605 4.0 Total 2,432 5.4 3,030 6.2 3,737 7.0 3,891 6.9 3,989 6.9 4,088 6.9 4,191 6.9 4,295 6.9 4,403 6.9 4,513 6.9NET INCOME $9,672 21.4 % $11,258 23.1 % $13,419 25.3 % $14,834 26.4 % $15,204 26.4 % $15,585 26.4 % $15,974 26.4 % $16,374 26.4 % $16,782 26.4 % $17,202 26.4 %
1 1 1 1 1 1 1 1 1 1*Departmental expenses are expressed as a percentage of departmental revenues.
% ofGross
Convention, Sports & Entertainment Facilities Consulting Chicago, Illinois
April 3, 2014 Hotel Market Analysis Headquarters Hotel, Broward County, Florida 1-30
The following description sets forth the basis for the forecast of income and expense. We anticipate that it will take four years for the Proposed Headquarters Hotel to reach a stabilized level of operation. Each revenue and expense item has been forecast based upon our review of the Proposed Headquarters Hotel’s operating budget and comparable income and expense statements. Our forecast is based upon calendar years beginning January 1, 2018 and is expressed in inflated dollars for each year. Rooms revenue is determined by two variables: occupancy and average rate. We projected occupancy and average rate in a previous section of this report. The Proposed Headquarters Hotel is expected to stabilize at an occupancy level of 70% with an average rate of $185.44 in 2021. Following the stabilized year, the property’s average rate is projected to increase along with the underlying rate of inflation. A hotel’s restaurants, lounges, coffee shops, snack bars, banquet rooms, and room service generate food and beverage revenue. In addition to providing a source of revenue, these outlets serve as an amenity that assists in the sale of guestrooms. With the exception of properties with active lounges or banquet facilities that draw local residents, in-house guests generally represent a substantial percentage of a hotel's food and beverage patrons. In the case of the Proposed Headquarters Hotel, the food and beverage department will include a 200 seat full-service restaurant, a 100 seat short-order food outlet, a 113 seat bar/lounge facility, and a 40 seat coffee outlet. Banquet space is expected to include a fully divisible 40,000 square-foot grand ballroom, a 15,000 square-foot junior ballroom, and 25,000 square feet of primary meeting space for a total of 80,000 square feet of meeting space. Although food and beverage revenue varies directly with changes in occupancy, the portion generated by banquet sales and outside capture is relatively fixed. The comparable statements illustrated food and beverage revenue between 41.2% to 86.1% of rooms revenue, or $60.83 and $146.16 per occupied room. The Proposed Headquarters Hotel's food and beverage operation is expected to be an important component of the property. Therefore, based upon our review of comparable operating statements, we have positioned an appropriate revenue level given the hotel's planned facility and price point. We would expect future moderate growth to occur within this category after the hotel's opening. We project food and beverage revenue to be $75.17 and $13.88 per occupied room, respectively, in the first projection year, or respectively 44.5% and 8.2% of the rooms revenue. These per-occupied-room amounts increase to $79.20 and $14.62 for hotel food service by the stabilized year, or respectively 42.7% and 7.9% of rooms revenue.
Forecast of Income and Expense
Rooms Revenue
Food and Beverage Revenue

Convention, Sports & Entertainment Facilities Consulting Chicago, Illinois
April 3, 2014 Hotel Market Analysis Headquarters Hotel, Broward County, Florida 1-31
According to the Uniform System of Accounts, Other Operated Departments include any major or minor operated department other than rooms, food, and beverage. These departmental revenues and expenses are presented in the Other Operated Department revenue and expense line items on a Summary Operating Statement, with sub-schedules setting forth the individual departmental revenues and expenses in more detail. An Other Operated Department revenue and expense may be presented in the summary statement if it is considered a significant factor in the hotel operation. Telephone revenue and expense is now considered a component of Other Operated Departments and is being reported as a separate line item more infrequently now that telephone revenue has become so inconsequential. The Proposed Headquarters Hotel's other operated departments revenue sources are expected to be generated primarily from the hotel's telephone charges, parking operation, and gift shop. Based on our review of operations with a similar extent of offerings, we have positioned an appropriate revenue level for the Proposed Headquarters Hotel. We forecast the Proposed Headquarters Hotel’s other operated departments revenue to stabilize at 3.0% of rooms revenue or $8.83 per occupied room by the stabilized year, 2021. The comparable operating statements illustrate Other Operated Departments Revenue ranging from 2.6 % to 6.8 % of revenue and $2.83 to $19.75 per occupied room. Rentals & other income is derived from sources other than guestrooms, food and beverage, and the Other Operated Departments. Rentals & other income revenue for the comparables ranged 2.0% to 3.7% of rooms revenue or $3.41 to $5.07 on a per-occupied-room basis. Changes in this revenue item through the projection period result from the application of the underlying inflation rate and projected changes in occupancy. We forecast the Proposed Headquarters Hotel’s rentals & other income to stabilize at $5.00 per occupied room by the stabilized year, 2021. Rooms expense consists of items related to the sale and upkeep of guestrooms and public space. Salaries, wages, and employee benefits account for a substantial portion of this category. Although payroll varies somewhat with occupancy and managers can generally scale the level of service staff on hand to meet an expected occupancy level, much of a hotel's payroll is fixed. A base level of front desk personnel, housekeepers, and supervisors must be maintained at all times. As a result, salaries, wages, and employee benefits are only moderately sensitive to changes in occupancy. Commissions and reservations are usually based on room sales, and thus are highly sensitive to changes in occupancy and average rate. While guest supplies vary 100% with occupancy, linens and other operating expenses are only slightly affected by volume.
Other Operated Departments Revenue Including the Garage
Rentals & Other Income
Rooms Expense

Convention, Sports & Entertainment Facilities Consulting Chicago, Illinois
April 3, 2014 Hotel Market Analysis Headquarters Hotel, Broward County, Florida 1-32
The comparables illustrated rooms expense ranging between 19.5% and 29.0% of rooms revenue; on a per-occupied-room basis, the range was between $31.90 and $47.91. We have projected rooms expense for the Proposed Headquarters Hotel at 27.8% in the first year (or $46.86 per occupied room), stabilizing at 25.0% in 2021 (or $46.36 per occupied room). The Proposed Headquarters Hotel's rooms department expense has been positioned based upon our review of the comparable operating data and our understanding of the hotel's future service level and price point. Food and beverage departmental expenses consist of items necessary for the primary operation of a Proposed Headquarters Hotel's food and banquet facilities. Most of the cost of food and beverage sales and related payroll vary with the level of food revenues; however, this departmental operation has a fixed component. The comparables illustrate food and beverage expense ranging between 54.2% and 72.6% of food and beverage revenue. We have projected a stabilized expense ratio of 68.0% in 2021 for hotel food & beverage. The Proposed Headquarters Hotel's food and beverage operation is expected to be efficiently managed and operate at an expense level that is in line with other comparable operations. Other operated departments expense includes all expenses reflected in the summary statements for the divisions associated in these categories previously discussed. The comparables illustrated other operated departments expense ranging between $1.83 and $20.50 per occupied room. The comparables illustrated other operated departments expense as a percentage of other operated departments revenue ranging between 94.8 % and 84.2 %. We have projected a stabilized expense ratio of 50.0% in 2021. Administrative and general expense includes the salaries and wages of all administrative personnel who are not directly associated with a particular department. Expense items related to the management and operation of the property are also allocated to this category. Most administrative and general expenses are relatively fixed. The exceptions are cash overages and shortages; commissions on credit card charges; provision for doubtful accounts, which are moderately affected by the number of transactions or total revenue; and salaries, wages, and benefits, which are very slightly influenced by volume. On a percentage of total revenue basis, the comparable operations indicate an administrative and general expense range from 7.0% to 8.8%, or $4,029 to $7,518 per available room. Based upon our review of the comparable operating data and the expected scope of facility for the Proposed Headquarters Hotel, we have
Food and Beverage Expense
Other Operated Departments Expense
Administrative and General Expense

Convention, Sports & Entertainment Facilities Consulting Chicago, Illinois
April 3, 2014 Hotel Market Analysis Headquarters Hotel, Broward County, Florida 1-33
positioned the administrative and general expense level at a market- and property-supported level. In the first projection year, we have projected administrative and general expense for the Proposed Headquarters Hotel to be $5,360 per available room, or 8.9% of total revenue. By the 2021 stabilized year, these amounts change to $5,970 per available room and 8.0% of total revenue. Marketing expense consists of all costs associated with advertising, sales, and promotion; these activities are intended to attract and retain customers. Marketing can be used to create an image, develop customer awareness, and stimulate patronage of a property's various facilities. The marketing category is unique in that all expense items, with the exception of fees and commissions, are totally controlled by management. Most hotel operators establish an annual marketing budget that sets forth all planned expenditures. If the budget is followed, total marketing expenses can be projected accurately. Marketing expenditures are unusual because although there is a lag period before results are realized, the benefits are often extended over a long period. Depending on the type and scope of the advertising and promotion program implemented, the lag time can be as short as a few weeks or as long as several years. However, the favorable results of an effective marketing campaign tend to linger, and a property often enjoys the benefits of concentrated sales efforts for many months. On a percentage of total revenue basis, the comparable operations indicate a marketing expense range from 6.6% to 8.7%, or $4,035 to $7,420 per available room. Based upon our review of the comparable operating data and the expected scope of facility for the Proposed Headquarters Hotel, we have positioned the marketing expense level at a market- and property-supported level. In the first projection year, we have projected marketing expense for the Proposed Headquarters Hotel to be $4,758 per available room, or 7.9% of total revenue. By the 2021 stabilized year, these amounts change to $5,300 per available room and 7.1% of total revenue. As previously discussed, the Proposed Headquarters Hotel is expected to be brand operated; as such, no franchise agreement will exist and no franchise fees are expected to be required throughout the ten-year forecast period. Property operations and maintenance expense is another expense category that is largely controlled by management. Except for repairs that are necessary to keep the facility open and prevent damage (e.g., plumbing, heating, and electrical items), most maintenance can be deferred for varying lengths of time.
Marketing Expense
Franchise Fee
Property Operations and Maintenance

Convention, Sports & Entertainment Facilities Consulting Chicago, Illinois
April 3, 2014 Hotel Market Analysis Headquarters Hotel, Broward County, Florida 1-34
Maintenance is an accumulating expense. If management elects to postpone performing a required repair, they have not eliminated or saved the expenditure; they have only deferred payment until a later date. A lodging facility that operates with a lower-than-normal maintenance budget is likely to accumulate a considerable amount of deferred maintenance. The age of a lodging facility has a strong influence on the required level of maintenance. A new or thoroughly renovated property is protected for several years by modern equipment and manufacturers' warranties. However, as a hostelry grows older, maintenance expenses escalate. A well-organized preventive maintenance system often helps delay deterioration, but most facilities face higher property operations and maintenance costs each year, regardless of the occupancy trend. The quality of initial construction can also have a direct impact on future maintenance requirements. The use of high-quality building materials and construction methods generally reduces the need for maintenance expenditures over the long term. On a percentage of total revenue basis, the comparable operations indicate a property operations and maintenance expense range from 3.4% to 4.7%, or $2,333 to $4,015 per available room. We expect the Proposed Headquarters Hotel's maintenance operation to be well managed, and expense levels should stabilize at a typical level for a property of this type. Changes in this expense item through the projection period result from the application of the underlying inflation rate and projected changes in occupancy. In the first projection year, we have projected property operations and maintenance expense for the Proposed Headquarters Hotel to be $3,008 per available room, or 5.0% of total revenue. By the 2021 stabilized year, these amounts change to $3,351 per available room and 4.5% of total revenue. The utilities consumption of a lodging facility takes several forms, including water and space heating, air conditioning, lighting, cooking fuel, and other miscellaneous power requirements. The most common sources of hotel utilities are electricity, natural gas, fuel oil, and steam. This category also includes the cost of water service. Total energy cost depends on the source and quantity of fuel used. Electricity tends to be the most expensive source, followed by oil and gas. Although all hotels consume a sizable amount of electricity, many properties supplement their utility requirements with less expensive sources, such as gas and oil, for heating and cooking. On a percentage of total revenue basis, the comparable operations indicate a utilities expense range from 3.1% to 4.4%, or $1,816 to $3,381 per available room.
Utilities Expense

Convention, Sports & Entertainment Facilities Consulting Chicago, Illinois
April 3, 2014 Hotel Market Analysis Headquarters Hotel, Broward County, Florida 1-35
The changes in this utilities line item through the projection period are a result of the application of the underlying inflation rate and projected changes in occupancy. In the first projection year, we have projected utilities expense for the Proposed Headquarters Hotel to be $3,391 per available room, or 5.6% of total revenue. By the 2021 stabilized year, these amounts change to $3,777 per available room and 5.0% of total revenue. Management expense consists of the fees paid to the managing agent contracted to operate the property. Some companies provide management services and a brand-name affiliation (first-tier management company), while others provide management services alone (second-tier management company). Some management contracts specify only a base fee (usually a percentage of total revenue), while others call for both a base fee and an incentive fee (usually a percentage of defined profit). Basic hotel management fees are almost always based on a percentage of total revenue, which means they have no fixed component. While base fees typically range from 2% to 4% of total revenue, incentive fees are deal specific and often are calculated as a percentage of income available after debt service and, in some cases, after a preferred return on equity. Total management fees for the Proposed Headquarters Hotel have been forecast at 3.0% of total revenue. Property (or ad valorem) tax is one of the primary revenue sources of municipalities. Based on the concept that the tax burden should be distributed in proportion to the value of all properties within a taxing jurisdiction, a system of assessments is established. Theoretically, the assessed value placed on each parcel bears a definite relationship to market value, so properties with equal market values will have similar assessments and properties with higher and lower values will have proportionately larger and smaller assessments. For the purposes of this analysis, it has been assumed that property taxes will not be owed due to government ownership of the site. The insurance expense category consists of the cost of insuring the hotel and its contents against damage or destruction by fire, weather, sprinkler leakage, boiler explosion, plate glass breakage, and so forth. General insurance costs also include premiums relating to liability, fidelity, and theft coverage. Insurance rates are based on many factors, including building design and construction, fire detection and extinguishing equipment, fire district, distance from the firehouse, and the area's fire experience. Insurance expenses do not vary with occupancy. Based on comparable data and the structural attributes of the Proposed Headquarters Hotel project, we project the property's insurance expense at $2,193 per available room by the stabilized year (positioned at $1,800 on a per-available-
Management Fee
Property Taxes
Insurance Expense

Convention, Sports & Entertainment Facilities Consulting Chicago, Illinois
April 3, 2014 Hotel Market Analysis Headquarters Hotel, Broward County, Florida 1-36
room basis in base-year dollars). This forecast equates to 2.9% of total revenue on a stabilized basis. In subsequent years, this amount is assumed to increase in tandem with inflation. Furniture, fixtures, and equipment are essential to the operation of a lodging facility, and their quality often influences a property's class. This category includes all non-real estate items that are capitalized, rather than expensed. The furniture, fixtures, and equipment of a hotel are exposed to heavy use and must be replaced at regular intervals. The useful life of these items is determined by their quality, durability, and the amount of guest traffic and use. Periodic replacement of furniture, fixtures, and equipment is essential to maintain the quality, image, and income-producing potential of a lodging facility. Because capitalized expenditures are not included in the operating statement but nevertheless affect an owner's cash flow, a forecast of income and expense should reflect these expenses in the form of an appropriate reserve for replacement. The International Society of Hospitality Consultants (“ISHC”) undertook a major industry-sponsored study of the capital expenditure requirements for full-service/luxury, select-service, and extended-stay hotels. The most recent findings of the study were published in a report in 2007. Historical capital expenditures of well-maintained hotels were investigated through the compilation of data provided by most of the major hotel companies in the United States. A prospective analysis of future capital expenditure requirements was also performed based upon the cost to replace short- and long-lived building components over a hotel's economic life. The study showed that the capital expenditure requirements for hotels vary significantly from year to year, and depend upon both the actual and effective age of a property. The results of this study showed that hotel lenders and investors are requiring reserves for replacement ranging from 4% to 5% of total revenue. Based on the results of this study, our review of the Proposed Headquarters Hotel and comparable lodging facilities, and our industry expertise, we estimate that a reserve for replacement of 4% of total revenues is sufficient to provide for the timely and periodic replacement of the property's furniture, fixtures, and equipment. This amount is ramped up during the initial projection period. In conclusion, our analysis reflects a profitable operation, with net income expected to total 26.4% of total revenue by the stabilized year. The stabilized total revenue comprises primarily rooms and food and beverage revenue, with a secondary portion derived from other income sources. On the cost side, departmental expenses total 39.1% of revenue by the stabilized year, while undistributed operating expenses total 24.6% of total revenues; this assumes that
Reserve for Replacement
Conclusion

Convention, Sports & Entertainment Facilities Consulting Chicago, Illinois
April 3, 2014 Hotel Market Analysis Headquarters Hotel, Broward County, Florida 1-37
the property will be operated competently by a well-known hotel operator. After a 3.0% of total revenues management fee, and 6.9% of total revenues in fixed expenses, a net income ratio of 26.4% is forecast by the stabilized year.

Convention, Sports & Entertainment Facilities Consulting Chicago, Illinois
April 3, 2014 Hotel Market Analysis Headquarters Hotel, Broward County, Florida 2-1
2. Statement of Assumptions and Limiting Conditions
1. This report is to be used in whole and not in part. 2. All information, financial operating statements, estimates, and opinions
obtained from parties not employed by HVS are assumed to be true and correct. We can assume no liability resulting from misinformation.
3. Unless noted, we assume that there are no encroachments, zoning violations, or building violations encumbering the proposed subject property.
4. The proposed facility is assumed to be in full compliance with all applicable federal, state, local, and private codes, laws, consents, licenses, and regulations (including a liquor license where appropriate), and that all licenses, permits, certificates, franchises, and so forth can be freely renewed or transferred to a purchaser.
5. We are not required to give testimony or attendance in court by reason of this analysis without previous arrangements, and only when our standard per-diem fees and travel costs are paid prior to the appearance.
6. If the reader is making a fiduciary or individual investment decision and has any questions concerning the material presented in this report, it is recommended that the reader contact us.
7. We take no responsibility for any events or circumstances that take place subsequent to the date of our report.
8. The quality of a facility's on-site management has a direct effect on a property's economic performance. The demand and financial forecasts presented in this analysis assume responsible ownership and competent management. Any departure from this assumption may have a significant impact on the projected operating results.
9. The impact analysis presented in this report is based upon assumptions, estimates, and evaluations of the market conditions in the local and national economy, which may be subject to sharp rises and declines. Over the projection period considered in our analysis, wages and other operating expenses may increase or decrease due to market volatility and economic forces outside the control of the venue’s management.
Convention, Sports & Entertainment Facilities Consulting Chicago, Illinois
April 3, 2014 Hotel Market Analysis Headquarters Hotel, Broward County, Florida 2-2
10. We do not warrant that our estimates will be attained, but they have been developed on the basis of information obtained during the course of our market research and are intended to reflect reasonable expectations.
11. Many of the figures presented in this report were generated using sophisticated computer models that make calculations based on numbers carried out to three or more decimal places. In the interest of simplicity, most numbers have been rounded. Thus, these figures may be subject to small rounding errors.
12. It is agreed that our liability to the client is limited to the amount of the fee paid as liquidated damages. Our responsibility is limited to the client, and use of this report by third parties shall be solely at the risk of the client and/or third parties. The use of this report is also subject to the terms and conditions set forth in our engagement letter with the client.
13. Although this analysis employs various mathematical calculations, the final estimates are subjective and may be influenced by our experience and other factors not specifically set forth in this report.
14. This report was prepared by HVS Convention, Sports & Entertainment Facilities Consulting. All opinions, recommendations, and conclusions expressed during the course of this assignment are rendered by the staff of this organization, as employees, rather than as individuals.
15. This report is set forth as an market study of the proposed subject project; this is not an appraisal report.

Convention, Sports & Entertainment Facilities Consulting Chicago, Illinois
April 3, 2014 Hotel Market Analysis Headquarters Hotel, Broward County, Florida 3-1
3. Certification
The undersigned hereby certify that, to the best of our knowledge and belief: 1. the statements of fact presented in this report are true and correct; 1. the reported analyses, opinions, and conclusions are limited only by the
reported assumptions and limiting conditions, and are our personal, impartial, and unbiased professional analyses, opinions, and conclusions;
2. we have no (or the specified) present or prospective interest in the property that is the subject of this report and no (or the specified) personal interest with respect to the parties involved;
3. we have no bias with respect to the property that is the subject of this report or to the parties involved with this assignment;
4. our engagement in this assignment was not contingent upon developing or reporting predetermined results;
5. our compensation for completing this assignment is not contingent upon the development or reporting of a predetermined value or direction in value that favors the cause of the client, the amount of the value opinion, the attainment of a stipulated result, or the occurrence of a subsequent event directly related to the intended use of this appraisal;
6. our analyses, opinions, and conclusions were developed, and this report has been prepared, in conformity with the Uniform Standards of Professional Appraisal Practice;
7. Thomas Hazinksi and Brian Harris participated in the analysis; 8. the reported analyses, opinions, and conclusions were developed, and this
report has been prepared, in conformity with the requirements of the Code of Professional Ethics and the Standards of Professional Appraisal Practice of the Appraisal Institute;
9. the use of this report is subject to the requirements of the Appraisal Institute relating to review by its duly authorized representatives; and

Convention, Sports & Entertainment Facilities Consulting Chicago, Illinois
April 3, 2014 Hotel Market Analysis Headquarters Hotel, Broward County, Florida 3-2
_________ Thomas Hazinski Managing Director
_________
Brian Harris Director