MARKET ANALYSIS OF BIO-COMPOSITE · PDF fileBio-composite products defined here are any...
38
MARKET ASSESSMENT: Review market data and examine trends to understand what bio-composite products are sold today and where are they sold A paper prepared for CFC/ITTO-USDL By Bintang C. H. Simangunsong Bedyaman Tambunan i
-
Upload
truonghanh -
Category
Documents
-
view
217 -
download
1
Transcript of MARKET ANALYSIS OF BIO-COMPOSITE · PDF fileBio-composite products defined here are any...
MARKET ASSESSMENT: Review market data and examine trends to understand what
bio-composite products are sold today and where are they sold
A paper prepared for CFC/ITTO-USDL
By
Bintang C. H. Simangunsong Bedyaman Tambunan
i
CONTENTS
Page I. Introduction 1 II. Market and Trade of Plywood 3
2.1. World 3 2.2. ITTO Countries 5 2.3. Indonesia 6 2.4. Malaysia 8 2.5. Papua New Guinea 9
III. Market and Trade of Veneer Sheets 10
3.1. World 10 3.2. ITTO Countries 12 3.3. Indonesia 13 3.4. Malaysia 15 3.5. Papua New Guinea 16
IV. Market and Trade of Particleboard 17
4.1. World 17 4.2. ITTO Countries 19 4.3. Indonesia 20 4.4. Malaysia 22 4.5. Papua New Guinea 23
V. Market and Trade of Fibreboard 24
5.1. World 24 5.2. ITTO Countries 26 5.3. Indonesia 27 5.4. Malaysia 28 5.5. Papua New Guinea 29
VI. Summary 30
References 32
i

LIST OF TABLES Page
Table 1. World production, imports, and exports of plywood in 2002-2006 3 Table 2. Production, exports, change, country and regional shares of
plywood in the period 2002-2006 6 Table 3. Production, imports, and exports of Indonesia plywood
in 2003-2007 (MOF 2008a and 2008b) 7 Table 4. Production, imports, and exports of Indonesia plywood
in 2002-2006 (FAO 2008) 7 Table 5. Production, imports, and exports of Malaysia plywood
in 2002-2006 8 Table 6. World production, imports, and exports of veneer sheets
in 2002-2006 10 Table 7. Production, exports, change, country and regional shares of
veneer sheets in the period 2002-2006 13 Table 8. Production, imports, and exports of Indonesia veneer sheets
in 2003-2007 (MOF 2008a and 2008b) 14 Table 9. Production, imports, and exports of Indonesia veneer sheets
in 2002-2006 (FAO 2008) 14 Table 10. Production, imports, and exports of Malaysia veneer sheets
in 2002-2006 16 Table 11. World production, imports, and exports of particleboard
in 2002-2006 17 Table 12. Production, exports, change, country and regional shares of
particleboard in the period 2002-2006 19 Table 13. Production, imports, and exports of Indonesia particleboard
in 2003-2007 (MOF 2008a and 2008b) 20 Table 14. Production, imports, and exports of Indonesia particleboard
in 2002-2006 (FAO 2008) 21 Table 15. Production, imports, and exports of Malaysia particleboard
in 2002-2006 22 Table 16. World production, imports, and exports of fiberboard
in 2002-2006 24
ii
Table 17. Production, exports, change, country and regional
shares of fibreboard in the period 2002-2006 26 Table 18. Production, imports, and exports of Indonesia fiberboard
in 2003-2007 (MOF 2008a and 2008b) 27 Table 19. Production, imports, and exports of Indonesia fiberboard
in 2002-2006 (FAO 2008) 28 Table 20. Production, imports, and exports of Malaysia fiberboard
in 2002-2006 29
iii

LIST OF FIGURES
Page Figure 1. World’s plywood production and its major producers
in 2002-2006 3 Figure 2. World’s plywood export and its major exporters in 2002-2006 4 Figure 3. World’s plywood import and its major importers in 2002-2006 4 Figure 4. Major importers of Indonesia's plywood over
the period 2002-2006 8 Figure 5. Major importers of Malaysia's plywood in 2005 9 Figure 6. World’s veneer sheets production and its major producers
in 2002-2006 10 Figure 7. World’s veneer sheets export and its major exporters
in 2002-2006 11 Figure 8. World’s veneer sheets import and its major importers
in 2002-2006 11 Figure 9. Major importers of Indonesia's veneer sheets
over the period 2002-2006 15 Figure 10. Major importers of Malaysia's veneer sheets in 2005 16 Figure 11. World’s particleboard production and its major producers
in 2002-2006 17 Figure 12. World’s particleboard export and its major exporters
in 2002-2006 18 Figure 13. World’s particleboard import and its major importers
in 2002-2006 18 Figure 14. Major importers of Indonesia's particleboard
over the period 2002-2006 21 Figure 15. Major importers of Malaysia's particleboard in 2005 23 Figure 16. World’s fiberboard production and its major producers
in 2002-2006 24
iv
Page Figure 17. World’s fiberboard export and its major exporters in 2002-2006 25 Figure 18. World’s fiberboard export and its major exporters in 2002-2006 25 Figure 19. Major importers of Indonesia's fiberboard
over the period 2002-2006 28
Figure 20. Major importers of Malaysia's fiberboard in 2005 29
v
I. INTRODUCTION
This paper provides a review and brief analysis of bio-composite products
markets and trade. Bio-composite products defined here are any composite that
contains a blend of wood and other lignocellulosic fiber and polymer to produce a
material that can be processed like wood and has the best features of wood and
plastic. These products can be used in building and construction, interiors,
automobiles, mouldings, garden and outdoor, etc. Initially, engineered wood
products such as glued-laminated timber, laminated veneer lumber and parallel
strand lumber would be included in a review as these products represent emerging
markets for tropical timber. However, due to the lack of data on production and
trade for those products, the review and analysis are focused instead on wood-
composite products such as plywood, veneer sheets, particleboard and fiberboard
in ITTO countries for the period 2002-2006. These are known commodities and
have been proven in the marketplace. The review and analysis for those products
were also conducted for countries such as Indonesia, Malaysia, and Papua New
Guinea.
Comparisons with global totals or totals for ITTO countries for wood-
composite products are based on statistics from the FAOSTAT database, the latest
summary of global forest statistics available. For each product, year and country,
apparent consumption was estimated by production + imports - exports. The data
on production, imports and exports were obtained from the FAOSTAT database
(FAO 2008). Similar data reported in Forest Products Annual Market Review
published by United Nations Economic Commission for Europe (UNECE) and in
Annual Review and Assessment of the World Timber Situation published by ITTO
were also used. In addition, data on production and trade provided by Ministry of
Forestry of Indonesia (MOF) and related agencies such as Central Bureau of
Statistics of Indonesia (BPS) and Indonesia Wood Based Panel Association
(APKINDO) were also used.
There are few data on domestic prices of forest products, and those that are
reported are often export or import prices. For countries that have both
import/export and domestic price, the two are usually highly correlated, as they
should in competitive markets. Therefore, for this study, the unit values of imports
1
or exports were used to build the price index. Quantities and values, in current
United States dollars, of imports and exports have been obtained from the
FAOSTAT database. The nominal price in each country, in current United States
dollars, was estimated as the weighted arithmetic average of the unit value of
imports and exports.
In the case of Indonesia, plywood product includes block board and
laminated veneer lumber and particleboard includes oriented strand board (OSB)
product. Moreover, as Indonesia’s forest products industry facing a wood raw
materials deficit and government policy and industry push for innovation and value
addition to resources, utilization of small-diameter logs from plantations, logging
waste, community forests, and rubber estates by this industry continues to rise.
The review consists of four substantive chapters, which provide an analysis
of production, export, import, consumption, trade and prices for each wood-
composite products: plywood, veneer sheets, particleboard and fiberboard; in
World, ITTO countries, Indonesia, Malaysia, and Papua New Guinea.
2
II. MARKET AND TRADE OF PLYWOOD
2.1. World
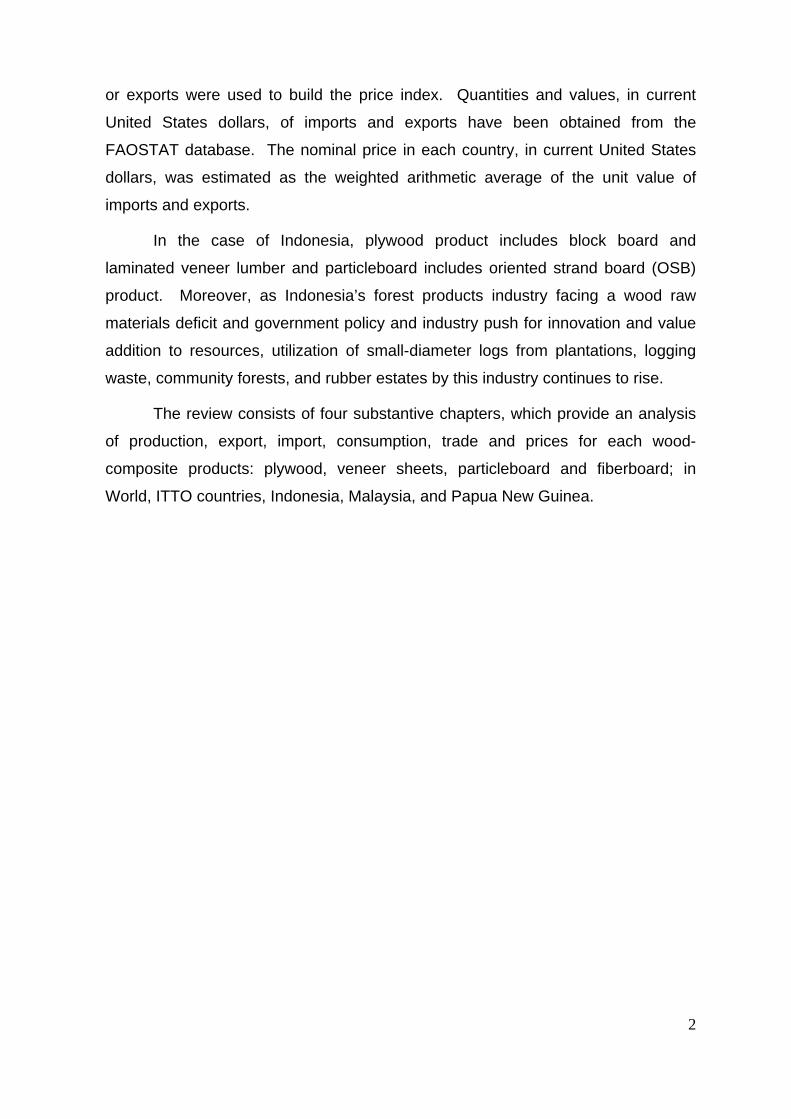
During the period 2002-2006, world’s plywood production increased from
59.25 millions m3 in year 2002 to 68.01 millions m3 in year 2006, a 15% increase
(Table 1). Table 1 also shows world’s plywood export quantity, import quantity, and
price increased by 23%, 21%, and 25% over the period 2002-2006, respectively.
Table 1. World production, imports, and exports of plywood in 2002-2006
2002 2003 2004 2005 2006 Periodic AnnualProduction Quantity Million M3 59.27 68.79 68.66 69.08 68.01 15% 3%Imports Quantity Million M3 20.81 21.80 24.35 24.66 25.08 21% 5%Imports Value US$ Million 7.36 7.88 9.99 10.31 10.83 47% 10%Exports Quantity Million M3 20.75 21.49 24.49 25.35 25.52 23% 5%Exports Value US$ Million 6.69 7.42 9.30 10.23 10.50 57% 12%Price US$/M3 338 354 395 411 421 25% 6%
Item UnitYear Growth (%)
Source: FAO (2008)
Major world’s producers were China, United States of America (USA),
Indonesia, Malaysia, Brazil and Japan, which together accounted for 77% of
world’s production (Figure 1). The production increase has occurred mainly in
China followed by Malaysia, Brazil and Japan. In Indonesia and USA, production
decreased.
Major World Producers of Plywood over the period 2002-2006
Malaysia7%
Indonesia8%
Brazil5%
Japan4%
Others23%
USA21%
China32%
Plywood production by Major Producer in the period 2002-2006
0.0
10.0
20.0
30.0
40.0
50.0
60.0
70.0
80.0
2002 2003 2004 2005 2006Year
Mill
ion
M3
Others
Japan
Brazil
Indonesia
Malaysia
USA
China
Figure 1. World’s plywood production and its major producers in 2002-2006
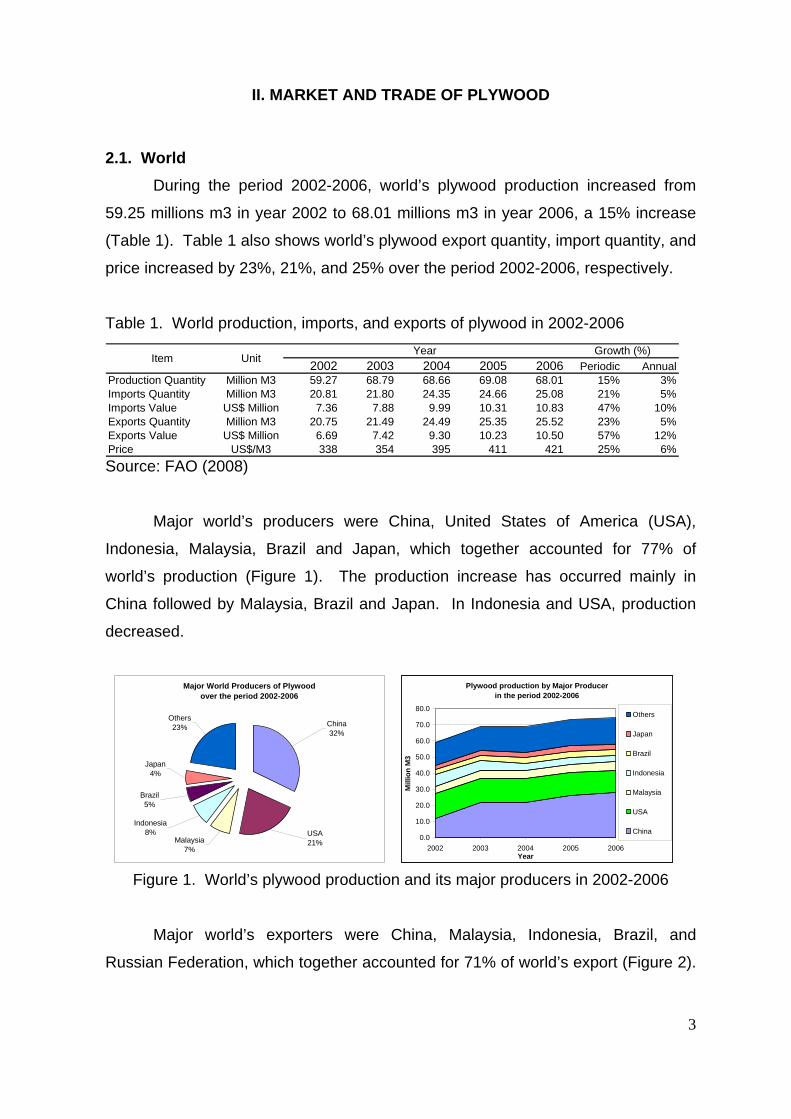
Major world’s exporters were China, Malaysia, Indonesia, Brazil, and
Russian Federation, which together accounted for 71% of world’s export (Figure 2).
3
The export increase has occurred mainly in China, Malaysia and Russian
Federation, while production decreased in Indonesia.
Figure 2. World’s plywood export and its major exporters in 2002-2006
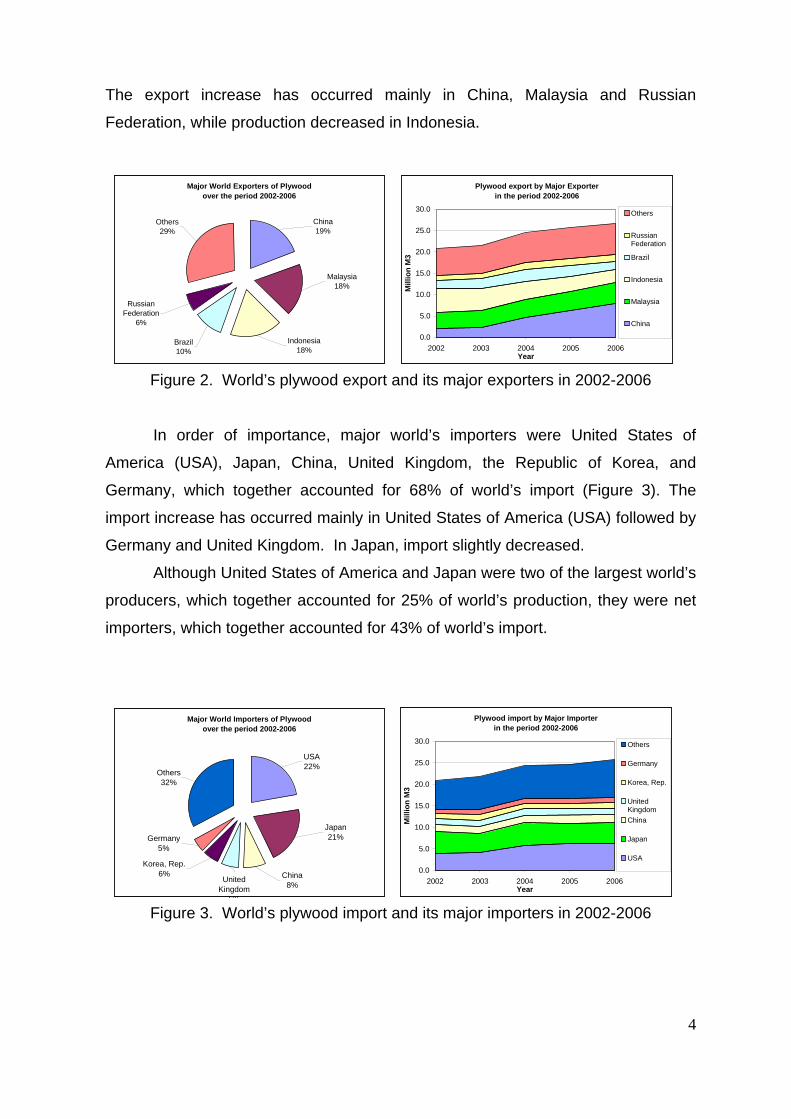
In order of importance, major world’s importers were United States of
Americ
largest world’s
produc
Major World Exporters of Plywood over the period 2002-2006
China19%
Malaysia18%
Others29%
Russian Federation
6%
Brazil10%
Indonesia18%
Plywood export by Major Exporter in the period 2002-2006
0.0
5.0
10.0
15.0
20.0
25.0
30.0
2002 2003 2004 2005 2006Year
Mill
ion
M3
Others
RussianFederation
Brazil
Indonesia
Malaysia
China
a (USA), Japan, China, United Kingdom, the Republic of Korea, and
Germany, which together accounted for 68% of world’s import (Figure 3). The
import increase has occurred mainly in United States of America (USA) followed by
Germany and United Kingdom. In Japan, import slightly decreased.
Although United States of America and Japan were two of the
ers, which together accounted for 25% of world’s production, they were net
importers, which together accounted for 43% of world’s import.
Figure 3. World’s plywood import and its major importers in 2002-2006
Major World Importers of Plywood over the period 2002-2006
USA22%
Japan21%
Others32%
Germany5%
Korea, Rep.6%
United Kingdom
6%
China8%
Plywood import by Major Importer in the period 2002-2006
0.0
5.0
10.0
15.0
20.0
25.0
30.0
2002 2003 2004 2005 2006Year
Mill
ion
M3
Others
Germany
Korea, Rep.
UnitedKingdomChina
Japan
USA
4

2.2. ITTO Countries Plywood production from ITTO producing countries decreased slightly from
17.53 million m3 in 2002 to 16.31 million m3 in 2006, a decrease of 7.0% (Table 2).
Over this period, about 84.32 million m3 of plywood were produced which
accounted for 25% of the world’s production of plywood. Of this 63.19 million m3
(74.9%) was provided by the Asia-Pacific region, 19.30 million m3 (22.9%) by Latin
America, and 1.83 million m3 (2.2%) by Africa. The largest single producer was
Indonesia, which alone accounted for 31.5% of ITTO producing countries’
production. Other important producers were Malaysia (28.8%), Brazil (20.3%) and
India (11.3%).
Production grew fastest in the Latin America region followed by Africa,
whereas in Asia-Pacific region, production decreased. The production decrease
has occurred mainly in Indonesia. In Malaysia, India and Brazil, production
increased.
From 2002 to 2006, ITTO producing countries exported about 57.42 million
m3 of plywood or about 68.1% of their production (Table 2). The largest share
came from the Asia-Pacific region with exports of 43.55 million m3 (75.8%). Latin
America and Africa exported about 12.63 million m3 (22.0%) and 1.25 million m3
(2.2%), respectively. The main exporting countries were Indonesia and Malaysia,
which together accounted for 74.5% of ITTO plywood exports. Another important,
but smaller exporter was Brazil (20.8%). Although Indonesia was an exporter
country, its exports declined by 2.76 million m3 between 2002 and 2006.
Further, plywood exports decreased as production decreased (Table 2).
This decrease in exports mainly came from Indonesia and Guyana, while in other
countries exports increased. ITTO (2007) reported major tropical plywood
importers in 2006 were Japan, United States of America, The Republic of Korea,
Taiwan and China. A few Western European countries were also important
importers, though smaller.
5
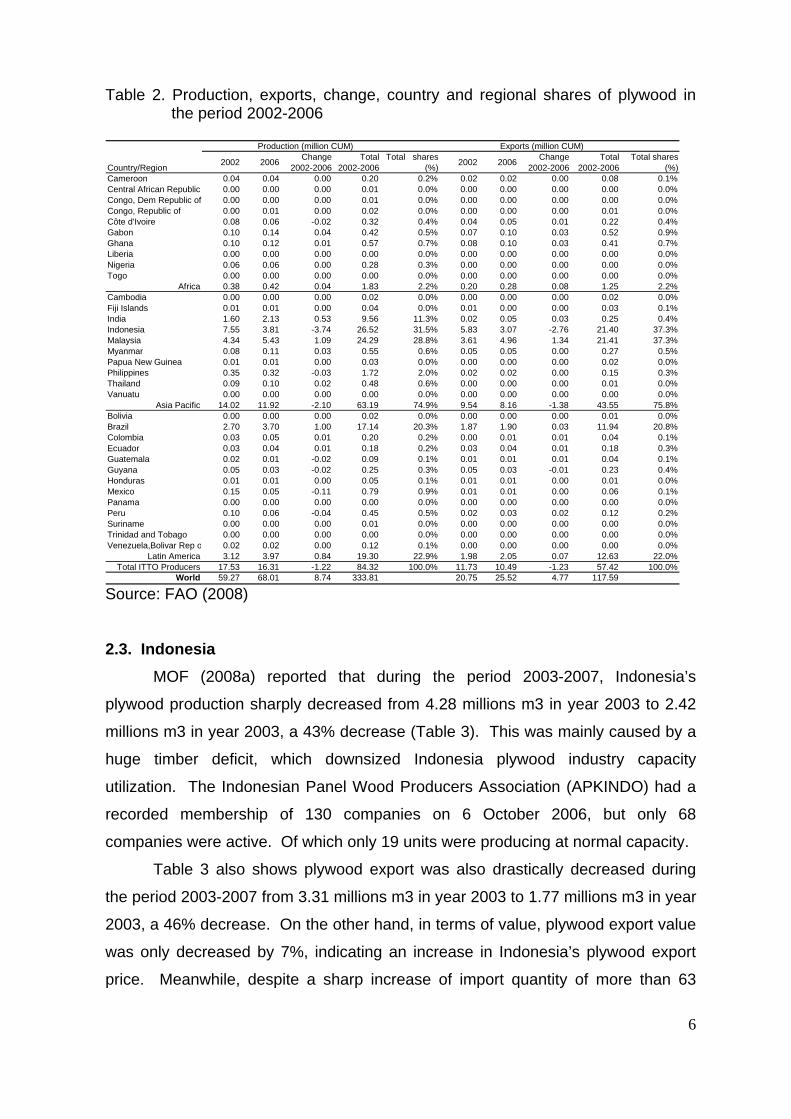
Table 2. Production, exports, change, country and regional shares of plywood in
which only 19 units were producing at normal capacity.
Table 3 also shows plywood export was also drastically decreased during
the period 2003-2007 from 3.31 millions m3 in year 2003 to 1.77 millions m3 in year
003, a 46% decrease. On the other hand, in terms of value, plywood export value
as only decreased by 7%, indicating an increase in Indonesia’s plywood export
price. Meanwhile, despite a sharp increase of import quantity of more than 63
7.55 3.81 -3.74 26.52 31.5% 5.83 3.07 -2.76 21.40 37.3%4.34 5.43 1.09 24.29 28.8% 3.61 4.96 1.34 21.41 37.3%0.08 0.11 0.03 0.55 0.6% 0.05 0.05 0.00 0.27 0.5%
Papua NewPhilippinesThailand
0.03 0.04 0.01 0.18 0.2% 0.03 0.04 0.01 0.18 0.3%0.02 0.01 -0.02 0.09 0.1% 0.01 0.01 0.01 0.04 0.1%
GuyanaHondurasMe co
the period 2002-2006
Production (million CUM) Exports (million CUM)
Country/Region 2002 2006 Change 2002-2006
Total 2002-2006
Total shares (%) 2002 2006 Change
2002-2006Total
2002-2006Total shares
(%)Cameroon 0.04 0.04 0.00 0.20 0.2% 0.02 0.02 0.00 0.08 0.1%Central African Republic 0.00 0.00 0.00 0.01 0.0% 0.00 0.00 0.00 0.00 0.0%Congo, Dem Republic of 0.00 0.00 0.00 0.01 0.0% 0.00 0.00 0.00 0.00 0.0%Congo, Republic of 0.00 0.01 0.00 0.02 0.0% 0.00 0.00 0.00 0.01 0.0%Côte d'Ivoire 0.08 0.06 -0.02 0.32 0.4% 0.04 0.05 0.01 0.22 0.4%Gabon 0.10 0.14 0.04 0.42 0.5% 0.07 0.10 0.03 0.52 0.9%Ghana 0.10 0.12 0.01 0.57 0.7% 0.08 0.10 0.03 0.41 0.7%Liberia 0.00 0.00 0.00 0.00 0.0% 0.00 0.00 0.00 0.00 0.0%Nigeria 0.06 0.06 0.00 0.28 0.3% 0.00 0.00 0.00 0.00 0.0%Togo 0.00 0.00 0.00 0.00 0.0% 0.00 0.00 0.00 0.00 0.0%
Africa 0.38 0.42 0.04 1.83 2.2% 0.20 0.28 0.08 1.25 2.2%Cambodia 0.00 0.00 0.00 0.02 0.0% 0.00 0.00 0.00 0.02 0.0%Fiji Islands 0.01 0.01 0.00 0.04 0.0% 0.01 0.00 0.00 0.03 0.1%India 1.60 2.13 0.53 9.56 11.3% 0.02 0.05 0.03 0.25 0.4%IndonesiaMalaysiaMyanmar
Source: FAO (2008)
2.3. Indonesia MOF (2008a) reported that during the period 2003-2007, Ind
0.05 0.03 -0.02 0.25 0.3% 0.05 0.03 -0.01 0.23 0.4%0.01 0.01 0.00 0.05 0.1% 0.01 0.01 0.00 0.01 0.0%
xi 0.15 0.05 -0.11 0.79 0.9% 0.01 0.01 0.00 0.06 0.1%Panama 0.00 0.00 0.00 0.00 0.0% 0.00 0.00 0.00 0.00 0.0%Peru 0.10 0.06 -0.04 0.45 0.5% 0.02 0.03 0.02 0.12 0.2%Suriname 0.00 0.00 0.00 0.01 0.0% 0.00 0.00 0.00 0.00 0.0%Trinidad and Tobago 0.00 0.00 0.00 0.00 0.0% 0.00 0.00 0.00 0.00 0.0%Venezuela,Bolivar Rep
Guinea 0.01 0.01 0.00 0.03 0.0% 0.00 0.00 0.00 0.02 0.0%0.35 0.32 -0.03 1.72 2.0% 0.02 0.02 0.00 0.15 0.3%0.09 0.10 0.02 0.48 0.6% 0.00 0.00 0.00 0.01 0.0%
Vanuatu 0.00 0.00 0.00 0.00 0.0% 0.00 0.00 0.00 0.00 0.0%Asia Pacific 14.02 11.92 -2.10 63.19 74.9% 9.54 8.16 -1.38 43.55 75.8%
Bolivia 0.00 0.00 0.00 0.02 0.0% 0.00 0.00 0.00 0.01 0.0%Brazil 2.70 3.70 1.00 17.14 20.3% 1.87 1.90 0.03 11.94 20.8%Colombia 0.03 0.05 0.01 0.20 0.2% 0.00 0.01 0.01 0.04 0.1%EcuadorGuatemala
o 0.02 0.02 0.00 0.12 0.1% 0.00 0.00 0.00 0.00 0.0%Latin America 3.12 3.97 0.84 19.30 22.9% 1.98 2.05 0.07 12.63 22.0%
Total ITTO Producers 17.53 16.31 -1.22 84.32 100.0% 11.73 10.49 -1.23 57.42 100.0%World 59.27 68.01 8.74 333.81 20.75 25.52 4.77 117.59
onesia’s
plywood production sharply decreased from 4.28 millions m3 in year 2003 to 2.42
millions m3 in year 2003, a 43% decrease (Table 3). This was mainly caused by a
huge timber deficit, which downsized Indonesia plywood industry capacity
utilization. The Indonesian Panel Wood Producers Association (APKINDO) had a
recorded membership of 130 companies on 6 October 2006, but only 68
companies were active. Of
2
w
6
times, plywood consumption decreased from 0.97 million m3 in year 2003 to 0.72
million m3 in year 2007, a 26% decrease.
Table 3. Production, imports, and exports of Indonesia plywood in 2003-2007
%
2003 2004 2005 2006 2007 Periodic AnnualProduction Quantity Million ton 4.28 3.16 3.17 2.67 2.42 -43% -13%Imports Quantity Million ton 0.00 0.01 0.02 0.06 0.07 6306% 183%Imports Value US$ Million 0.98 3.72 8.87 23.53 32.38 3212% 140%Import s Price US$/ton 842.30 567.12 427.04 401.39 435.51 -48% -15%Exports Quantity Million ton 3.31 2.60 2.21 1.98 1.77 -46% -14%Exports Value US$ Million 1,662.91 1,576.87 1,374.67 1,506.68 1,543.18 -7% -2%Exports Price US$/ton 502.93 605.78 620.68 761.29 869.45 73% 15%Consumption Million ton 0.97 0.56 0.98 0.75 0.72 -26% -7
Item Unit Year Growth (%)
Sources: MOF (2008a and 2008b)
FAO (2008) also reported that Indonesia’s plywood production sharply
decreased during the period 2002-2006. That is from 7.55 millions m3 in year 2002
to 3.81 millions m3 in year 2006, a 50% decrease (Table 4). Moreover, plywood
export was also decreased during the period 2002-2006 even though its decrease
was not as drastic as a decrease of plywood production. On the other hand, in
terms of value, plywood export value was only decreased by 21%, a half the
decrease of export quantity, indicating an increase in Indonesia’s plywood export
production and export figures were much higher than those
roduction figures reported by MOF (2008a and 2008b).
Table
price. These FAO’s
p
4. Production, imports, and exports of Indonesia plywood in 2002-2006
Source: FAO (2008)
2002 2003 2004 2005 2006 Periodic AnnualProduction Quantity Million M3 7.55 6.11 4.51 4.53 3.81 -50% -16%Imports Quantity Million M3 0.00 0.00 0.01 0.03 0.03 573% 61%Imports Value US$ Million 1.54 0.93 3.72 20.77 20.77 1253% 92%Imports Price US$/M3 324.32 535.55 368.67 652.08 652.08 101% 19%Exports Quantity Million M3 5.83 5.09 4.00 3.41 3.41 -42% -13%Exports Value US$ Million 1748.31 1662.91 1576.90 1374.67 1374.67 -21% -6%Exports Price US$/M3 300.09 326.58 393.77 403.60 403.60 34% 8%Consumption Million M3 1.73 1.02 0.52 1.16 0.44 -75% -29%
Item UnitYear Growth (%)
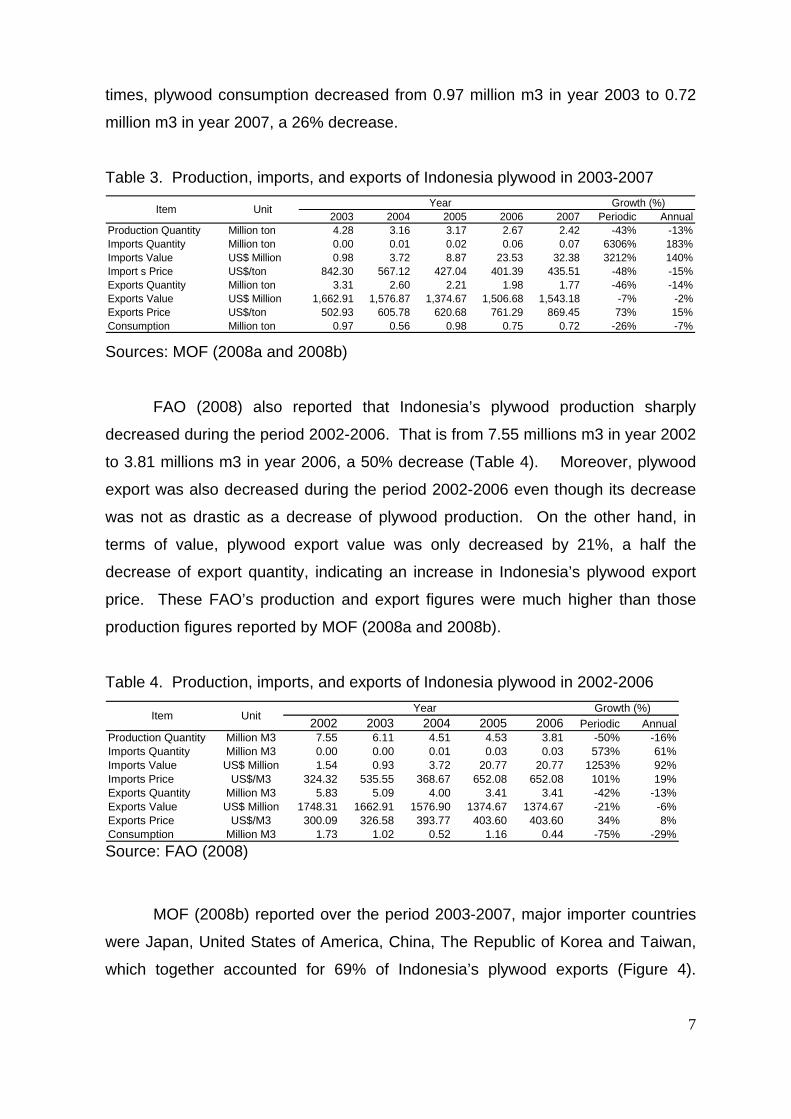
MOF (2008b) reported over the period 2003-2007, major importer countries
were Japan, United States of America, China, The Republic of Korea and Taiwan,
which together accounted for 69% of Indonesia’s plywood exports (Figure 4).
7
Moreover, during that period Indonesia’s plywood exports to those countries were
also declining.
Japan39%
Major importers of Indonesia's plywood over the period 2003-2007
United States8%China
8%
7%Korea, Republic of
7%
Other Countries31%
Taiwan, Province of China
Figure 4. Major importers of Indonesia's plywood over the period 2003-2007
2.4. Malaysia Over the period 2002-2006, Malaysia’s plywood production sharply
increased by 25%, from 4.34 millions m3 in year 2002 to 5.43 millions m3 in year
2006 (Table 5). Moreover, although plywood import were drastically increased by
6% and plywood export increased by the same percentage as of production
(26%), domestic plywood consumption only increased by 25% because import
quantity was negligible over that period.
Table 5. Production, imports, and exports of Malaysia plywood in 2002-2006
Source
2002 2003 2004 2005 2006 Periodic AnnualProduction Quantity Million M3 4.34 4.77 4.73 5.01 5.43 25% 6%Imports Quantity Million M3 0.02 0.02 0.02 0.03 0.03 86% 17%
1%5%
M3 3.61 3.95 4.35 4.54 4.54 26% 6%illion 1005.49 1094.00 1485.00 1472.10 1472.10 46% 10%
ports Price US$/M3 278.22 276.89 341.46 324.47 324.47 17% 4%nsumption Million M3 0.74 0.84 0.41 0.50 0.93 25% 6%
Item UnitYear Growth (%)
8
Imports Value US$ Million 7.00 5.00 5.93 10.70 10.70 53% 1Imports Price US$/M3 411.76 233.18 257.78 338.27 338.27 -18% -Exports Quantity MillionExports Value US$ M
: FAO (2008)
ExCo
8
On the other hand, in terms of value, plywood export value was increased by
46%, almost double the increase of export quantity, indicating an increase in
Malaysia’s plywood export price. In contrast, even though import quantity
increased by 86%, import value only increased by 53%, indicating a decrease in
Malaysia’s plywood import price during the period 2002-2006.
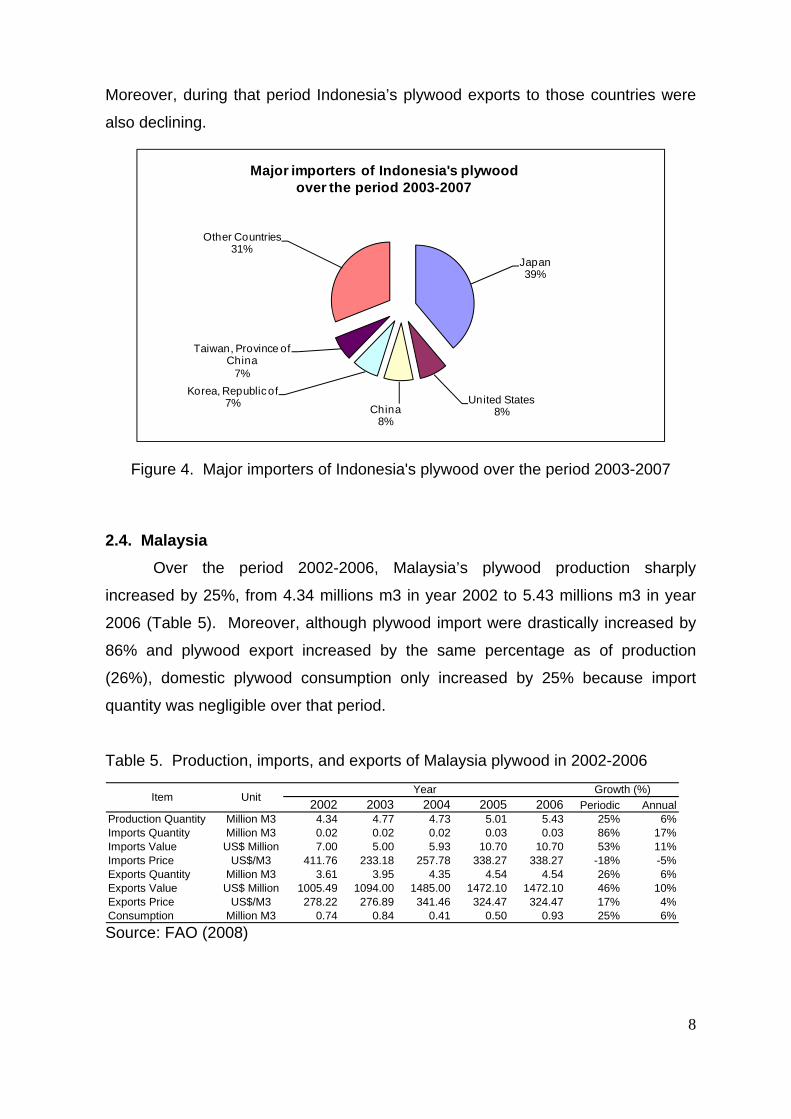
FAO (2008) reported in 2005, major importer countries were Japan, United
States of America, The Republic of Korea, China, and United Kingdom, which
together accounted for 81% of Malaysia’s plywood exports (Figure 5).
.5. Papua New Guinea tistics
Major importer of Malaysia plywood in 2005
China4%
United Kingdom
Others19%
Japan51%
4%
Korea, Republic of
10% United States of America
12%
Figure 5. Major importers of Malaysia's plywood in 2005
2During the period 2002-2006, FAOSTAT database did not report sta
data on production and import of plywood, except data on export, which was about
3000 m3 each year with export value of US$1.05 million. This report was not
accurate since FAOSTAT trade database, also reported that Papua New Guinea’s
plywood export was about 3,870 m3 with export value of US$2.31 millions in 2005.
Country destinations were Australia, New Zealand, and New Caledonia.
9
III. MARKET AND TRADE OF VENEER SHEETS
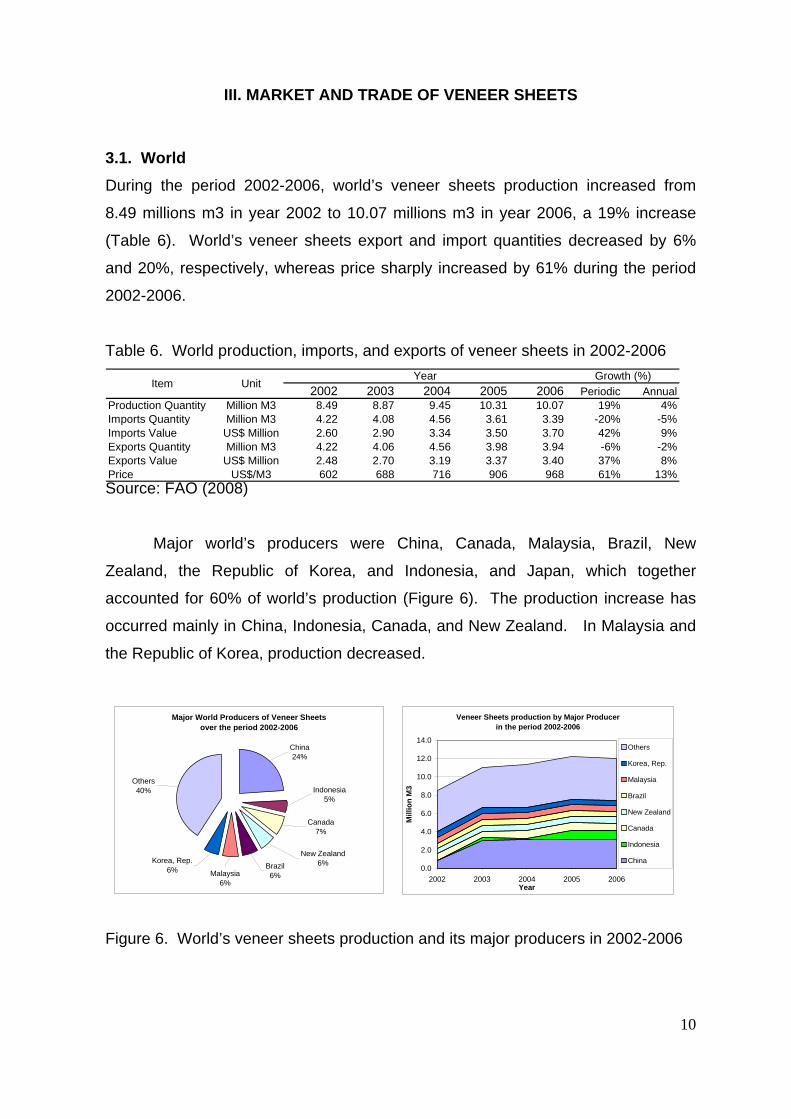
3.1. World During the period 2002-2006, world’s veneer sheets production increased from
8.49 millions m3 in year 2002 to 10.07 millions m3 in year 2006, a 19% increase
(Table
6). World’s veneer sheets export and import quantities decreased by 6%
and 20%, respectively, whereas price sharply increased by 61% during the period
2002-2006.
Table 6. World production, imports, and exports of veneer sheets in 2002-2006
Source: FAO (2008)
Major world’s producers were China, Canada, Malaysia, Brazil, New
Zealand, the Republic of Korea, and Indonesia, and Japan, which together
accounted for 60% of world’s production (Figure 6). The production increase has
occurred mainly in China, Indonesia, Canada, and New Zealand. In Malaysia and
the Republic of Korea, production decreased.
2002 2003 2004 2005 2006 Periodic AnnualProduction Quantity Million M3 8.49 8.87 9.45 10.31 10.07 19% 4%Imports Quantity Million M3 4.22 4.08 4.56 3.61 3.39 -20% -5%Imports Value US$ Million 2.60 2.90 3.34 3.50 3.70 42% 9%Exports Quantity Million M3 4.22 4.06 4.56 3.98 3.94 -6% -2%Exports Value US$ Million 2.48 2.70 3.19 3.37 3.40 37% 8%Price US$/M3 602 688 716 906 968 61% 13%
Item UnitYear Growth (%)
Figure 6. World’s veneer sheets production and its major producers in 2002-2006
Major World Producers of Veneer Sheetsover the period 2002-2006
Others
China24%
Indonesia5%
40%
Korea, Rep.6% Malaysia
6%
Brazil6%
New Zealand6%
Canada7%
Veneer Sheets production by Major Producer
6.0
8.0
10.0
12.0
Mill
ion
M3
in the period 2002-2006
14.0
0.0
2.0
4.0
2002 2003 2004 2005 2006Year
Others
Korea, Rep.
Malaysia
Brazil
New Zealand
Canada
Indonesia
China
10

Major world’s exporters were Canada, United States of America, Malaysia,
Brazil, Côte d'Ivo nted for 69% of
world’s export (Figure 7). The export increase has occurred mainly in Canada,
razil and New Zealand, while production decreased sharply in United States of
Malaysia.
portance, major world’s importers were United States of
merica (USA), China, the Republic of Korea, Canada, and Italy, which together
accoun
together accounted for 18% of world’s import. On the other hand, although, United
ire, China, and New Zealand, which together accou
B
America and
Major World Exporters of Veneer Sheetsover the period 2002-2006
Figure 7. World’s veneer sheets export and its major exporters in 2002-2006
In order of im
A
ted for 57% of world’s import (Figure 8). The import decrease has occurred
mainly in United States of America (USA) followed by China and the Republic of
Korea.
Figure 8. World’s veneer sheets import and its major importers in 2002-2006
Although China and Korea were two of the largest world’s producers, which
together accounted for 30% of world’s production, they were net importers, which
Malaysia11%Brazil
4%
Côte d'Ivoire4%
New Zealand
China4%
3% USA20%
Canada23%Others
31%
Veneer Sheets export by Major Exporter in the period 2002-2006
4.5
5.0
0.0
0.5
2.0
2.5
3.0
3.5
4.0
2002 2003 2004 2005 2006Year
Mill
ion
M3
Others
New Zealand
China
Côte d'Ivoire
Brazil
Malaysia
USA1.0
1.5
Canada
Major World Importers of Veneer Sheetsover the period 2002-2006
Canada7%Korea, Rep.
8%
Italy5%
Others43%
USA27%
China10%
Veneer Sheets import by Major Importer in the period 2002-2006
0.0
0.5
1.0
1.5
2.0
2.5
3.0
3.5
4.0
4.5
5.0
2002 2003 2004 2005 2006Year
Mill
ion
M3
Others
Italy
Korea, Rep.
Canada
USA
China
11
States of America’s import significantly decreased, it was still the largest single
import
2 million m3 in 2006, an increase of 33.6% (Table 7). Over
this period, about 15.78 million m3 of veneer sheet were produced which accounted 3
hereas in Asia-Pacific region, production decreased. The production increase has
ction
ecreased.
3
5%), respectively. The main exporting countries were Malaysia, Côte
d'Ivoire, Brazil, Gabon, Ghana, which together accounted for 85.7% of ITTO veneer
er country.
3.2. ITTO Countries Veneer sheet production from ITTO countries increased sharply from 2.64
million m3 in 2002 to 3.5
for one third of the world’s production of veneer sheets. Of this 8.57 million m
(54.3%) was provided by the Asia-Pacific region, 3.83 million m3 (24.3%) by Latin
America, and 3.38 million m3 (21.4%) by Africa. Main producers were Malaysia,
Brazil, Indonesia, Ghana, India, the Philippines, and Côte d'Ivoire, which together
accounted for 87.2% of ITTO production. Other important producers were Gabon,
Ecuador, and Papua New Guinea.
Production grew fastest in the Asia-Pacific region followed by Africa,
w
occurred mainly in Indonesia. In the Philippines, Ghana and Malaysia, produ
d
From 2002 to 2006, ITTO producing countries exported about 5.64 million
m of veneer sheets or about 35.7% of their production (Table 7). The largest
share came from the Asia-Pacific region with exports of 2.74 million m3 (48.6%).
Africa and Latin America exported about 2.08 million m3 (36.9%) and 0.82 million
m3 (14.
sheet exports. Another important, but smaller exporter were Papua New Guinea,
Indonesia and Cameroon.
Despite an increase in veneer sheet production, veneer sheet export from
ITTO producer countries was only slightly increased. Malaysia’s veneer sheet
export was even decreased (Table 7). ITTO (2007) reported major tropical veneer
sheet importers in 2006 were The Republic of Korea, Taiwan, French, China and
Italy. Japan, formerly a major tropical veneer importer, became less significant with
imports continuing to decline.
12

Table 7. Production, exports, change, country and regional shares of veneer sheets
3.3. Indonesia
t price. Meanwhile, veneer sheet export quantity
increas
in the period 2002-2006
Production (million CUM) Exports (million CUM)
Country/Region 2002 2006 Change 2002-2006
Total 2002-2006
Total shares (%) 2002 2006 Change
2002-2006Total
2002-2006Total shares
(%)Cameroon 0.05 0.05 -0.01 0.25 1.6% 0.02 0.03 0.01 0.15 2.6%Central African Republic 0.00 0.00 0.00 0.00 0.0% 0.00 0.00 0.00 0.00 0.0%Congo, Dem Republic of 0.00 0.00 0.00 0.01 0.0% 0.00 0.00 0.00 0.00 0.1%Congo, Republic of 0.02 0.01 -0.01 0.08 0.5% 0.02 0.00 -0.02 0.06 1.0%Côte d'IvoireGabonGhana
0.25 0.24 -0.01 1.14 7.2% 0.15 0.18 0.03 0.80 14.1%0.05 0.15 0.10 0.53 3.4% 0.11 0.18 0.07 0.57 10.2%0.26 0.21 -0.05 1.38 8.7% 0.12 0.07 -0.05 0.50 8.9%
beria 0.00 0.00 0.00 0.00 0.0% 0.00 0.00 0.00 0.00 0.0%igeria 0.00 0.00 0.00 0.00 0.0% 0.00 0.00 0.00 0.00 0.0%
0.00 0.00 0.00 0.0% 0.00 0.00 0.00 0.00 0.0%0.66 0.02 3.38 21.4% 0.42 0.46 0.05 2.08 36.9%0.00 0.00 0.01 0.1% 0.01 0.00 -0.01 0.01 0.2%
Fiji IslandsIndia
0.00 0.0% 0.00 0.00 0.00 0.00 0.0%0.10 0.6% 0.00 0.00 0.00 0.00 0.0%
Tota
LiNTogo 0.00
Africa 0.64Cambodia 0.00
0.01 0.01 0.00 0.04 0.2% 0.00 0.00 0.00 0.00 0.0%0.23 0.27 0.04 1.28 8.1% 0.00 0.01 0.01 0.03 0.6%
Indonesia 0.05 1.01 0.97 2.51 15.9% 0.00 0.05 0.04 0.18 3.1%Malaysia 0.66 0.61 -0.05 3.22 20.4% 0.60 0.33 -0.27 2.21 39.2%Myanmar 0.00 0.00 0.00 0.01 0.1% 0.00 0.00 0.00 0.00 0.0%Papua New Guinea 0.07 0.08 0.01 0.32 2.0% 0.04 0.07 0.03 0.27 4.7%Philippines 0.21 0.10 -0.11 1.15 7.3% 0.00 0.01 0.00 0.03 0.5%Thailand 0.00 0.00 0.00 0.02 0.1% 0.00 0.01 0.00 0.01 0.3%Vanuatu 0.00 0.00 0.00 0.00 0.0% 0.00 0.00 0.00 0.00 0.0%
Asia Pacific 1.23 2.09 0.86 8.57 54.3% 0.66 0.47 -0.19 2.74 48.6%Bolivia 0.00 0.00 0.00 0.03 0.2% 0.00 0.00 0.00 0.01 0.1%Brazil 0.62 0.62 0.00 3.10 19.6% 0.07 0.21 0.14 0.75 13.3%Colombia 0.00 0.00 0.00 0.01 0.0% 0.00 0.00 0.00 0.00 0.0%Ecuador 0.09 0.11 0.03 0.48 3.0% 0.00 0.00 0.00 0.01 0.1%Guatemala 0.02 0.02 0.00 0.09 0.6% 0.00 0.00 0.00 0.00 0.1%Guyana 0.00 0.00 0.00 0.00 0.0% 0.00 0.00 0.00 0.00 0.0%Honduras 0.00 0.00 0.00 0.00 0.0% 0.00 0.00 0.00 0.00 0.0%Mexico 0.00 0.00 0.00 0.00 0.0% 0.00 0.01 0.01 0.02 0.4%Panama 0.00 0.00 0.00 0.00 0.0% 0.00 0.00 0.00 0.00 0.0%Peru 0.01 0.00 0.00 0.03 0.2% 0.01 0.01 0.00 0.03 0.6%Suriname 0.00 0.00 0.00 0.00 0.0% 0.00 0.00 0.00 0.00 0.0%Trinidad and Tobago 0.00 0.00 0.00Venezuela,Bolivar Rep of 0.03 0.01 -0.02
Source: FAO (2008)
Latin America 0.77 0.77 0.00 3.83 24.3% 0.07 0.23 0.15 0.82 14.5%l ITTO Producers 2.64 3.52 0.89 15.78 100.0% 1.15 1.16 0.01 5.64 100.0%
World 8.49 10.07 1.58 47.20 4.22 3.94 -0.27 20.75
Over the period 2003-2007, MOF (2008a) reported that Indonesia’s veneer
sheets production slightly increased from 0.20 millions m3 in year 2003 to 0.21
millions m3 in year 2007, a 3% increase (Table 8). Most veneer sheets production
were consumed domestically as indicated by a consumption increase of 7% over
that period.
Table 8 also shows import quantity increased by 179% during the period
2003-2007, but import value only increased by 95%, indicating a decrease in
Indonesia’s veneer sheet impor
ed by 104% during that period, but veneer sheet export value increased by
399%, indicating an increase in Indonesia’s veneer sheet export price.
Although import veneer sheets price as well as plywood production
decreased, veneer sheet exports were doubled over that period. Given that veneer
13

sheets price were much higher than plywood price (Compare Table 8 with Table 3),
this indicated that it would have still been more profitable to sell veneer sheets than
process it into plywood and then sold it.
%
%
to
Table 8. Production, imports, and exports of Indonesia veneer sheets in 2003-2007
2003 2004 2005 2006 2007 Periodic AnnualProduction Quantity Million ton 0.20 0.11 0.71 0.18 0.21 3% 1%Imports Quantity Million ton 0.01 0.01 0.01 0.02 0.02 179% 29Imports Value US$ Million 14.24 19.33 19.59 25.52 27.76 95% 18%Import s Price US$/ton 1,954.13 1,987.34 1,921.96 1,496.08 1,366.68 -30% -9%Exports Quantity Million ton 0.01 0.06 0.00 0.01 0.01 104% 20%Exports Value US$ Million 2.94 33.10 9.32 19.95 29.98 918% 79%Exports Price US$/ton 544.94 601.16 2,339.86 2,518.93 2,718.79 399% 49%Consumption Million ton 0.20 0.06 0.71 0.19 0.22 7% 2
Item Unit Year Growth (%)
Sources: MOF (2008a and 2008b)
Meanwhile, over the period 2002-2006, FAO (2008) reported that
Indonesia’s veneer sheets production drastically increased from 0.05 millions m3 in
year 2002 to 1.01 millions m3 in year 2006 (Table 9). Most veneer sheets
production were consumed domestically as indicated by a consumption increase of
more than nineteen times over that period.
Table 9 also shows import quantity increased by 81% during the period
2002-2006, but import value only increased by 43%, indicating a decrease in
Indonesia’s veneer sheet import price. Meanwhile, veneer sheet export quantity
increased by 975% during that period, but veneer sheet export value increased by
increase in Indonesia’s veneer sheet export price. As in
lywood product, these FAO’s veneer sheets production and export figures were
much higher than those production figures reported by MOF (2008a and 2008b).
Table
US$/M3 1830.13 1469.89 1400.00 1440.37 1440.37 -21% -6%Exports Exports
1742%, indicating an
p
9. Production, imports, and exports of Indonesia veneer sheets in 2002-2006
2002 2003 2004 2005 2006 Periodic AnnualProduction Quantity Million M3 0.05 0.29 0.16 1.01 1.01 2149% 118%Imports Quantity Million M3 0.01 0.01 0.01 0.01 0.01 81% 16%Imports ValueImports Price
Item UnitYear Growth (%)
Source: FAO (2008)
Quantity Million M3 0.00 0.01 0.07 0.05 0.05 975% 81%Value US$ Million 1.65 2.94 33.05 30.41 30.41 1742% 107%
Exports Price US$/M3 375.23 408.78 450.19 642.86 642.86 71% 14%Consumption Million M3 0.05 0.29 0.10 0.98 0.98 1934% 112%
US$ Million 13.73 14.23 19.33 19.59 19.59 43% 9%
14
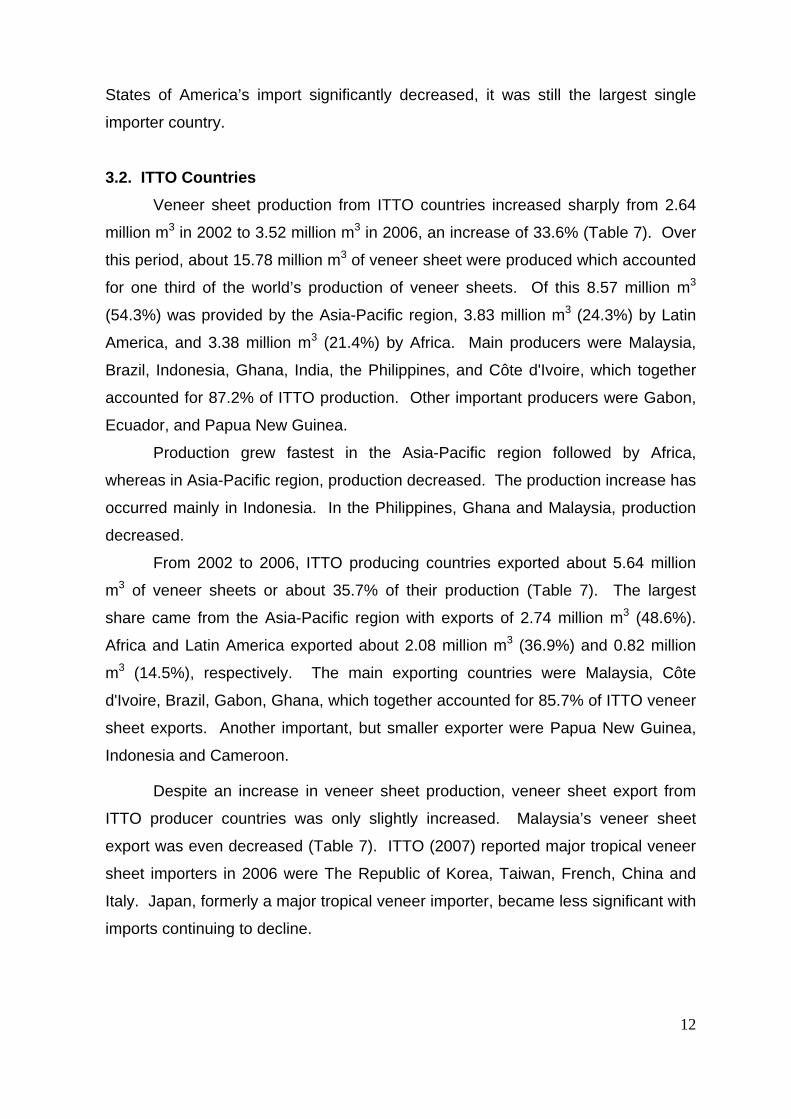
MOF (2008b) reported over the period 2003-2007, major importer countries
were Japan, United States of America, China, The Republic of Korea and Taiwan,
which together accounted for 69% of Indonesia’s veneer sheet exports (Figure 9).
However, during that period exports to China, The Republic of Korea and Taiwan
were decreased.
Japan38%
United States15%7%
ChinaKorea, Republic of
6%
Taiwan, Province of China
Other Countries31%
Major importers of Indonesia's veneer sheets over the period 2003-2007
3%
Figure 9. Major importers of Indonesia's veneer sheets over the period 2003-2007
3.4. Malaysia Over the period 2002-2006, Malaysia’s veneer sheets production slightly
decreased by 8%, from 0.66 millions m3 in year 2002 to 0.61 millions m3 in year
2006 (Table 10). Veneer sheets import quantity was drastically decreased by 70%,
while veneer sheets export quantity was also decreased with a lower rate of 31%.
Further, domestic veneer sheets consumption only increased by 11% over the
period 2002-2006. On the other hand, in terms of value, veneer sheets export
value was decreased by 1%, indicating an increase in Malaysia’s veneer sheets
xport price, while import value only increased by 24%, indicating a sharply
FAO (2008) reported in 2005, the single largest country was Japan followed
by United States of America, The Republic of Korea, China, and United Kingdom,
e
increase in Malaysia’s veneer sheets import price during the period 2002-2006.
15

which all together accounted for 81% of Malaysia’s veneer sheets exports (Figure
0). Table 1
Source: FAO (2008)
Figure 10. Major importers of Malaysia's veneer sheets in 2005
3.5. P
llion M3 0.60 0.46 0.40 0.41 0.41 -31% -9%S$ Million 112.80 109.20 97.57 111.12 111.12 -1% 0%
ports Price US$/M3 187.69 236.36 245.15 268.40 268.40 43% 9%nsumption Million M3 0.22 0.31 0.30 0.30 0.25 11% 3%
10. Production, imports, and exports of Malaysia veneer sheets in 2002-2006
2002 2003 2004 2005 2006 Periodic AnnualProduction Quantity Million M3 0.66 0.64 0.64 0.67 0.61 -8% -2%Imports Quantity Million M3 0.16 0.13 0.06 0.05 0.05 -70% -26%Imports Value US$ Million 35.87 28.17 44.30 44.38 44.38 24% 5%Imports Price US$/M3 222.80 220.05 738.40 924.58 924.58 315% 43%Exports Quantity MiExports Value U
Item UnitYear Growth (%)
ExCo
Major importer of Malaysia veneer sheets in 2005
China4%
United Kingdom4%
Others19%
Korea, Republic of
10% United States of
Japan51%
America12%
apua New Guinea Similar to that plywood product, during the period 2002-2006, FAOSTAT
database did not report statistics data on veneer sheets, except data on export,
which ranged from 36,000 m3 in 2002 to 65,000 m3 in 2006 with export value
ranging from US$6.30 millions in 2002 to US$12.48 millions in 2006. This report
was closed to data provided by FAOSTAT trade database, which reported that
Papua New Guinea’s veneer sheets export was about 35,043 m3 with export value
of US$11.47 millions in 2005. Country destinations were The Republic of Korea,
China, Australia and Japan.
16

IV. MARKET AND TRADE OF PARTICLEBOARD
4.1. World
antly
increased from 85.81 millions m3 in year 2002 to 104.13 millions m3 in year 2006,
t
2002 2003 2004 2005 2006 Periodic AnnualProduction Quantity Million M3 85.81 92.08 98.44 101.32 104.13 21% 5%Imports Quantity Million M3 24.07 25.06 28.51 28.98 30.04 25% 6%Imports Value US$ Million 4.00 5.38 7.19 7.20 6.68 67% 14%Exports Quantity Million M3 24.32 25.48 28.72 29.39 30.30 25% 6%Exports Value US$ Million 4.16 5.47 7.43 7.39 7.30 75% 15%Price US$/M3 169 215 255 250 232 37% 8%
Item UnitYear Growth (%)
During the period 2002-2006, world’s particleboard production signific
a 21% increase (Table 11). Table 9 also shows world’s particleboard expor
quantity, import quantity, and price increased by 25%, 25%, and 37% over the
period 2002-2006, respectively.
Table 11. World production, imports, and exports of particleboard in 2002-2006
Source: FAO (2008)
Major world’s producers were United States of America (USA), Canada,
Germany, China, and France, which together accounted for 54% of world’s
production (Figure 11). The production increase has occurred mainly in China
followed by United States of America (USA), Canada, and Germany.
Figure 11. World’s particleboard production and its major producers in 2002-2006
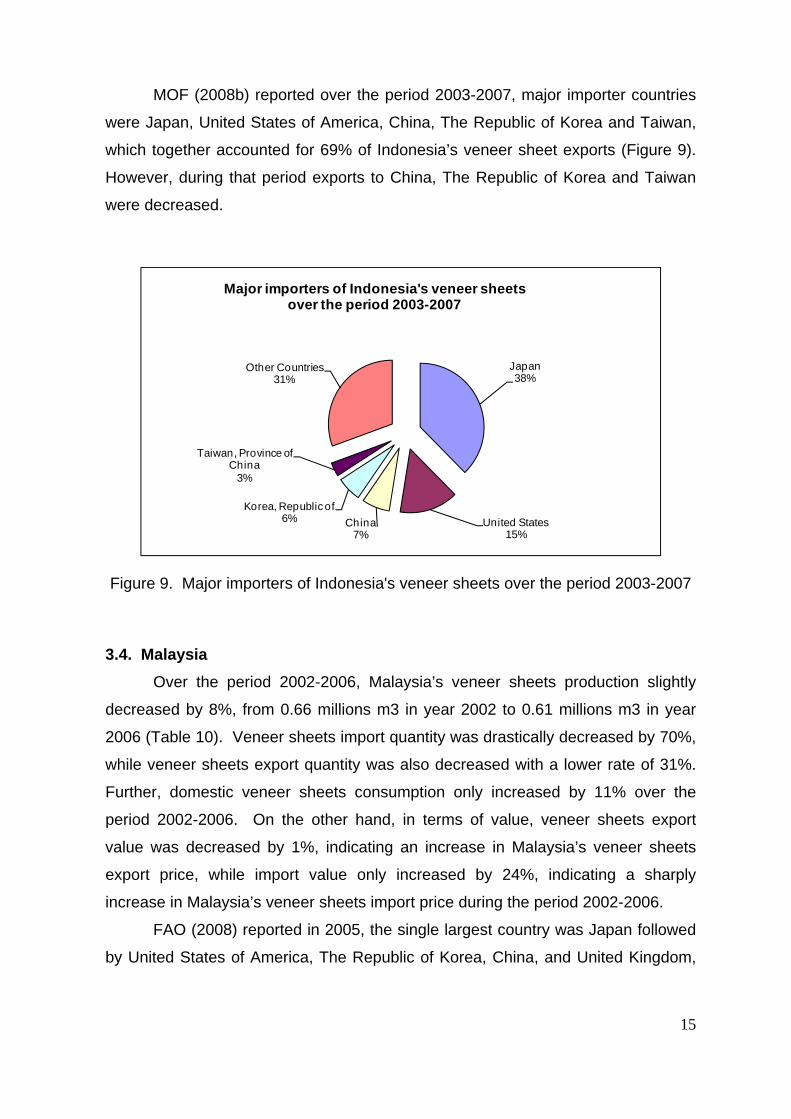
Major world’s exporters were Canada, Germany, Austria, Belgium, and
France, which together accounted for 65% of world’s export (Figure 12). The
Major World Producers of Particleboardover the period 2002-2006
USA22%
Canada12%
Others46%
France4% China
6%
Germany10%
Particleboard production by Major Producer in the period 2002-2006
40.0
60.0
80.0
120.0
Mill
ion
M3
0.0
20.0
2002 2003 2004 2005 2006Year
Others
100.0France
China
Germany
Canada
USA
17
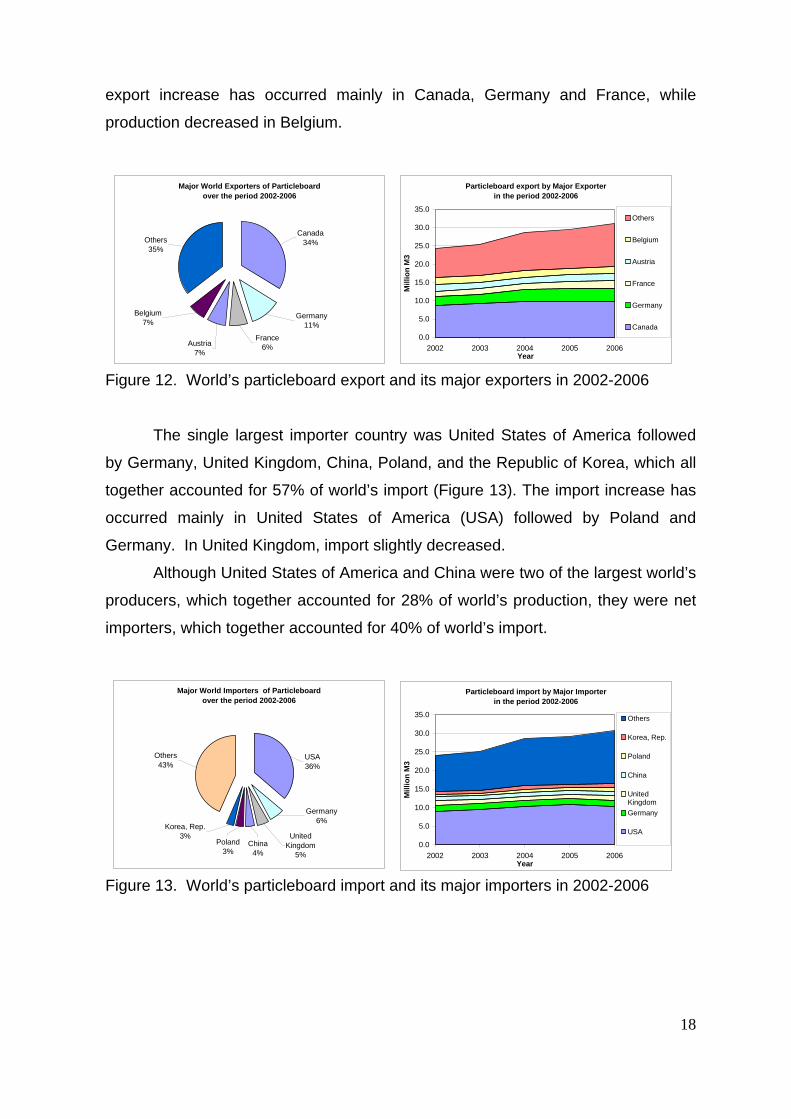
export increase has occurred mainly in Canada, Germany and France, while
production decreased in Belgium.
Figure 12. World’s particleboard export and its major exporters in 2002-2006
The single largest importer country was United States of America followed
by Germany, United Kingdom, China, Poland, and the Republic of Korea, which all
together accounted for 57% of world’s import (Figure 13). The import increase has
occurred mainly in United States of America (USA) followed by Poland and
Germany. In United Kingdom, import slightly decreased.
Although United States of America and China were two of the largest world’s
producers, which together accounted for 28% of world’s production, they were net
importers, which together accounted for 40% of world’s import.
Figure 13. World’s particleboard import and its major importers in 2002-2006
Major World Exporters of Particleboardover the period 2002-2006
Canada34%
Germany11%
Others35%
Belgium7%
Austria7%
France6%
Particleboard export by Major Exporter in the period 2002-2006
0.0
5.0
10.0
15.0
20.0
25.0
30.0
35.0
2002 2003 2004 2005 2006Year
Mill
ion
M3
Others
Belgium
Austria
France
Germany
Canada
Major World Importers of Particleboardover the period 2002-2006
USA36%
Germany6%
Others43%
Korea, Rep.3%
Poland3%
China4%
United Kingdom
5%
Particleboard import by Major Importer in the period 2002-2006
0.0
5.0
10.0
15.0
20.0
25.0
30.0
35.0
2002 2003 2004 2005 2006Year
Mill
ion
M3
Others
Korea, Rep.
Poland
China
UnitedKingdomGermany
USA
18

4.2. ITTO CounParticleboard production from ITTO countries increased slightly from 3.80
illion m3 in 2002 to 3.86 million m3 in 2006, an increase of 1.5% (Table 12). Over
bout 18.96 million m3 of particleboard were produced which accounted
for 3.9% of the world’s
e period 2002-2006, whereas in Asia-Pacific region, production decreased by
tries
m
this period, a
production of particleboard. Of this 13.14 million m3 (69.3%)
was provided by the Latin America region, 5.57 million m3 (29.4%) by Asia-Pacific,
and 0.24 million m3 (1.3%) by Africa. The largest single producer was Brazil, which
alone accounted for 59.0% of ITTO production. Other important producers were
Thailand (14.25), Malaysia (8.4%), and Indonesia (6.0%).
Table 12. Production, exports, change, country and regional shares of particleboard in the period 2002-2006
Production (million CUM) Exports (million CUM)
Country/Region 2002 2006 Change 2002-2006
Total 2002-2006
Total shares (%) 2002 2006 Change
2002-2006Total
2002-2006Total shares
(%)Cameroon 0.00 0.00 0.00 0.00 0.0% 0.00 0.00 0.00 0.00 0.0%Central African Republic 0.00 0.00 0.00 0.00 0.0% 0.00 0.00 0.00 0.00 0.0%Congo, Dem Republic of 0.00 0.00 0.00 0.00 0.0% 0.00 0.00 0.00 0.00 0.0%Congo, Republic of 0.00 0.00 0.00 0.00 0.0% 0.00 0.00 0.00 0.00 0.0%Côte d'Ivoire 0.00Gabon 0.00
0.00 0.00 0.00 0.0% 0.00 0.00 0.00 0.00 0.0%0.00 0.00 0.00 0.0% 0.00 0.00 0.00 0.00 0.0%
hana 0.01 0.01 0.00 0.04 0.2% 0.00 0.00 0.00 0.00 0.0%beria 0.00 0.00 0.00 0.00 0.0% 0.00 0.00 0.00 0.00 0.0%igeria 0.04 0.04 0.00 0.20 1.1% 0.00 0.00 0.00 0.00 0.0%
Togo
0.00 0.0%0.00 0.0%
Thailand 0.54 0.54 0.00 2.69 14.2% 0.38 1.69 1.31 4.58 50.9%Vanuatu 0.00 0.00 0.00 0.00 0.0% 0.00 0.00 0.00 0.00 0.0%
Asia Pacific 1.39 0.91 -0.48 5.57 29.4% 0.92 2.39 1.46 7.35 81.7%Bolivia 0.00 0.00 0.00 0.00 0.0% 0.00 0.00 0.00 0.00 0.0%Brazil 1.94 2.50 0.56 11.18 59.0% 0.02 0.20 0.18 0.30 3.3%Colombia 0.13 0.18 0.05 0.79 4.1% 0.03 0.02 -0.01 0.19 2.1%Ecuador 0.09 0.09 0.00 0.47 2.5% 0.06 0.04 -0.02 0.27 3.0%Guatemala 0.00 0.01 0.00 0.03 0.1% 0.00 0.00 0.00 0.02 0.2%Guyana 0.00 0.00 0.00 0.00 0.0% 0.00 0.00 0.00 0.00 0.0%Honduras 0.00 0.00 0.00 0.00 0.0% 0.00 0.00 0.00 0.00 0.0%Mexico 0.13 0.10 -0.03 0.53 2.8% 0.02 0.21 0.20 0.72 8.0%Panama 0.00 0.00 0.00 0.02 0.1% 0.00 0.00 0.00 0.00 0.0%Peru 0.00 0.00 0.00 0.00 0.0% 0.00 0.00 0.00 0.00 0.0%Suriname 0.00 0.00 0.00 0.00 0.0% 0.00 0.00 0.00 0.00 0.0%Trinidad and Tobago 0.00 0.00 0.00 0.00 0.0% 0.00 0.00 0.00 0.00 0.0%Venezuela,Bolivar Rep of 0.06 0.02 -0.04 0.13 0.7% 0.02 0.01 -0.01 0.15 1.7%
Latin America 2.36 2.90 0.53 13.14 69.3% 0.14 0.48 0.34 1.64 18.3%Total ITTO Producers 3.80 3.86 0.06 18.96 100.0% 1.07 2.87 1.80 9.00 100.0%
World 85.81 104.13 18.32 481.78 24.32 30.30 5.99 138.21
GLiN
0.00 0.00 0.00 0.00 0.0% 0.00 0.00 0.00 0.00 0.0%Africa 0.05 0.05 0.00 0.24 1.3% 0.00 0.00 0.00 0.00 0.0%
Cambodia 0.00 0.00 0.00 0.00 0.0% 0.00 0.00 0.00 0.00 0.0%Fiji Islands 0.00 0.00 0.00 0.00 0.0% 0.00 0.00 0.00 0.00 0.0%India 0.03 0.02 0.00 0.12 0.6% 0.00 0.00 0.00 0.02 0.2%Indonesia 0.30 0.13 -0.17 1.14 6.0% 0.17 0.05 -0.12 0.55 6.1%Malaysia 0.52 0.22 -0.31 1.59 8.4% 0.37 0.64 0.27 2.20 24.4%Myanmar 0.00 0.00 0.00 0.00 0.0% 0.00 0.00 0.00 0.00 0.0%Papua New Guinea 0.00 0.00 0.00 0.00 0.0% 0.00 0.00 0.00Philippines 0.01 0.01 0.00 0.03 0.2% 0.00 0.00 0.00
Source: FAO (2008)
Production grew fastest in the Latin America region with growth of 22.6% in
th
19
34.5%
% of their production (Table 12). The largest
share came from the Asia-Pacific region with exports of 7.35 million m3 (81.7%).
roduction sharply decreased from 0.07 millions m3 in year 2003 to 0.03 millions
harply during that period, from 0.13 million m3 in ear 2003 to 0.01 million m3 in
year 2
board in 2003-2007
ports Quantity Million ton 0.13 0.05 0.03 0.01 0.01 -96% -54%ports Value US$ Million 25.84 11.63 5.38 4.62 2.43 -91% -45%
%
over that period. The production increase has occurred mainly in Brazil,
while the production decrease has occurred mainly in Malaysia and Indonesia.
From 2002 to 2006, ITTO producing countries exported about 9.00 million
m3 of particleboard or about 47.5
Latin America exported about 1.64 million m3 (18.3%). The main exporting
countries were Thailand and Malaysia, which together accounted for 75.3% of ITTO
particleboard exports. Another important, but smaller exporter were Mexico (8.0%)
and Indonesia (6.1%).
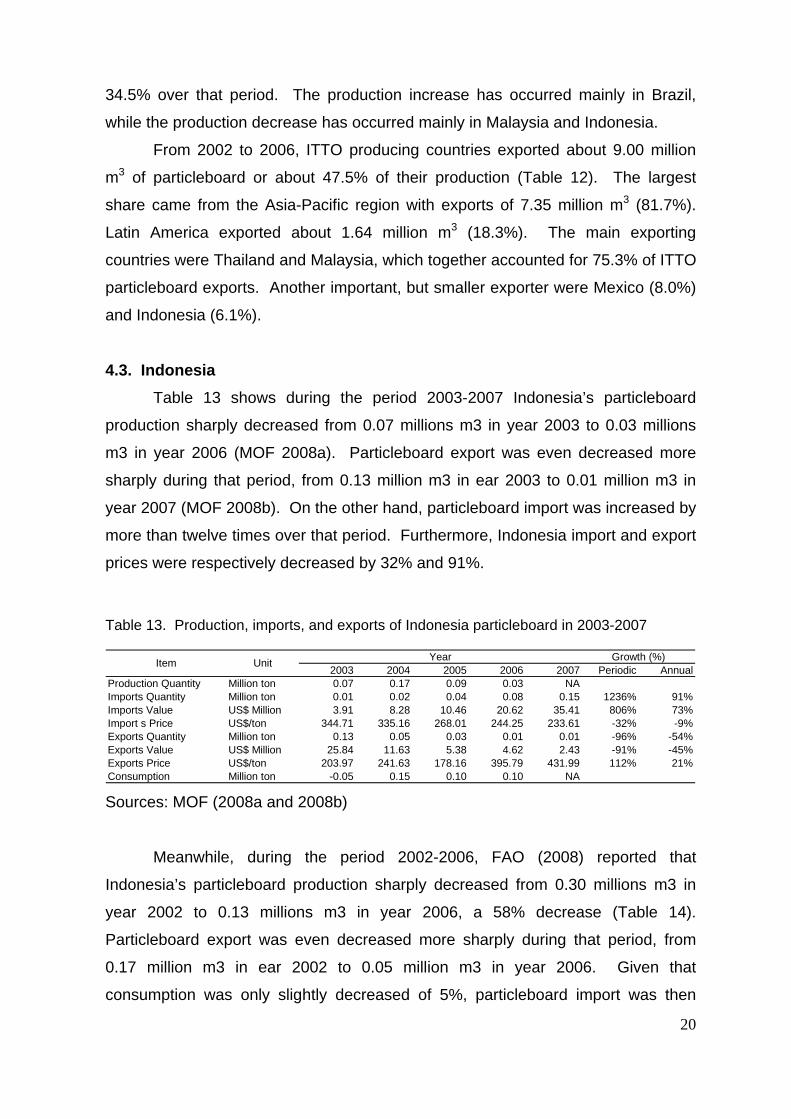
4.3. Indonesia Table 13 shows during the period 2003-2007 Indonesia’s particleboard
p
m3 in year 2006 (MOF 2008a). Particleboard export was even decreased more
s
007 (MOF 2008b). On the other hand, particleboard import was increased by
more than twelve times over that period. Furthermore, Indonesia import and export
prices were respectively decreased by 32% and 91%.
Table 13. Production, imports, and exports of Indonesia particle
2003 2004 2005 2006 2007 Periodic AnnualProduction Quantity Million ton 0.07 0.17 0.09 0.03 NAImports Quantity Million ton 0.01 0.02 0.04 0.08 0.15 1236% 91%Imports Value US$ Million 3.91 8.28 10.46 20.62
Year Growth (%)Item Unit
35.41 806% 73%Import s Price US$/ton 344.71 335.16 268.01 244.25 233.61 -32% -9%ExExExports Price US$/ton 203.97 241.63 178.16 395.79 431.99 112% 21Consumption Million ton -0.05 0.15 0.10 0.10 NA Sources: MOF (2008a and 2008b)
Meanwhile, during the period 2002-2006, FAO (2008) reported that
Indonesia’s particleboard production sharply decreased from 0.30 millions m3 in
year 2002 to 0.13 millions m3 in year 2006, a 58% decrease (Table 14).
Particleboard export was even decreased more sharply during that period, from
0.17 million m3 in ear 2002 to 0.05 million m3 in year 2006. Given that
consumption was only slightly decreased of 5%, particleboard import was then
20

almost triple over that period. Furthermore, Indonesia import and export prices
were respectively decreased by 10% and 18%.
Table 14. Production, imports, and exports of Indonesia particleboard in 2002-2006
ported over the period 2003-2007, major importer countries
were T
Source: FAO (2008)
MOF (2008b) re
he Republic of Korea, Taiwan, Viet Nam, Hongkong and China, which
together accounted for 90% of Indonesia’s particleboard exports (Figure 14).
Moreover, during that period Indonesia’s particleboard exports to those countries
were also declining sharply
Korea, Republic of28%China
10%
Taiwan, Province of China18%
Viet Nam17%
Hongkong17%
Other Countries10%
Major importers of Indonesia's particleboard export over the period 2003-2007
Figure 14. Major importers of Indonesia's particleboard over the period 2003-2007
-2%%
ports Value US$ Million 24.12 25.84 11.63 5.38 5.38 -78% -31%ports Price US$/M3 141.23 133.29 134.17 116.48 116.48 -18% -5%nsumption Million M3 0.15 0.12 0.25 0.14 0.14 -5% -1%
Item UnitYear Growth (%)
2002 2003 2004 2005 2006 Periodic AnnualProduction Quantity Million M3 0.30 0.30 0.30 0.13 0.13 -58% -19%Imports Quantity Million M3 0.02 0.02 0.04 0.06 0.06 192% 31%Imports Value US$ Million 3.96 3.91 8.28 10.46 10.46 164% 27%Imports Price US$/M3 192.65 224.05 217.84 174.32 174.32 -10%Exports Quantity Million M3 0.17 0.19 0.09 0.05 0.05 -73% -28ExExCo
21
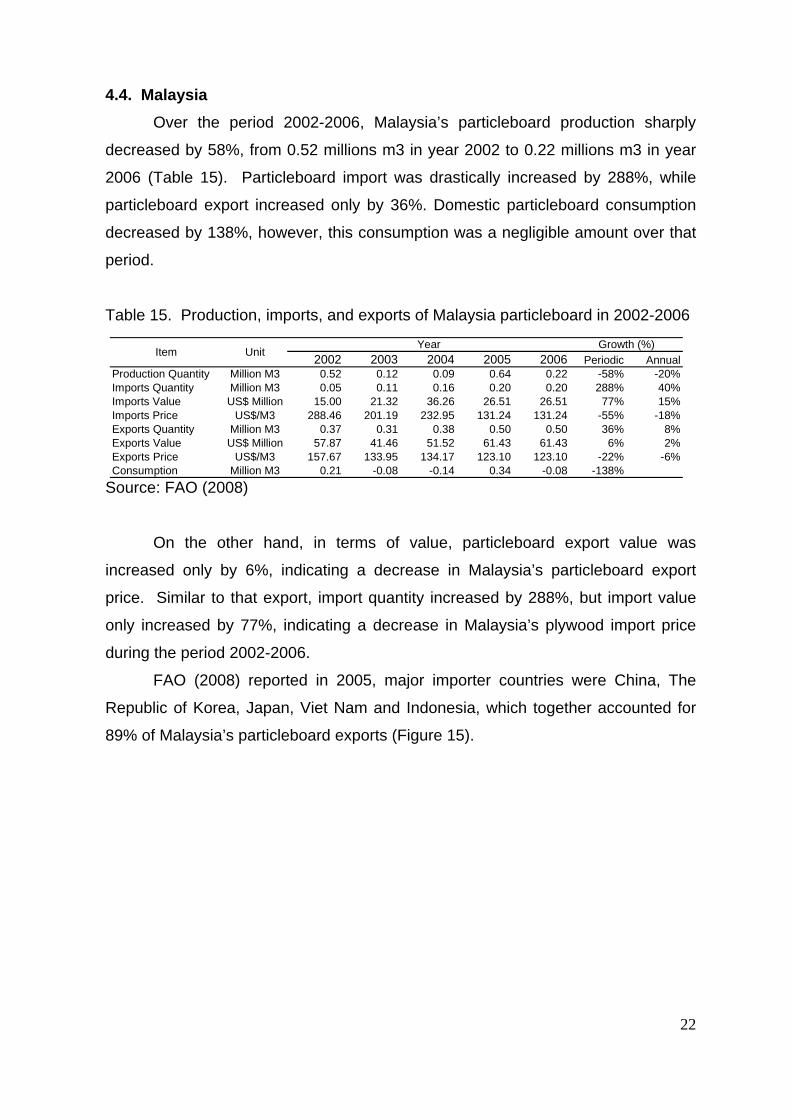
4.4. Malaysia Over the period 2002-2006, Malaysia’s particleboard production sharply
decreased by 58%, from 0.52 millions m3 in year 2002 to 0.22 millions m3 in year
2006 (Table 15). Particleboard import was drastically increased by 288%, while
particleboard export increased only by 36%. Domestic particleboard consumption
decreased by 138%, however, this consumption was a negligible amount over that
period.
Table 15. Production, imports, and exports of Malaysia particleboard in 2002-2006
Source: FAO (2008)
hand, in terms of value, particleboard export value was
creased only by 6%, indicating a decrease in Malaysia’s particleboard export
price.
The
Repub
2002 2003 2004 2005 2006 Periodic AnnualProduction Quantity Million M3 0.52 0.12 0.09 0.64 0.22 -58% -20%Imports Quantity Million M3 0.05 0.11 0.16 0.20 0.20 288% 40%Imports Value US$ Million 15.00 21.32 36.26 26.51 26.51 77% 15%Imports Price US$/M3 288.46 201.19 232.95 131.24 131.24 -55% -18%Exports Quantity Million M3 0.37 0.31 0.38 0.50 0.50 36% 8%Exports Value US$ Million 57.87 41.46 51.52 61.43 61.43 6% 2%Exports Price US$/M3 157.67 133.95 134.17 123.10 123.10 -22% -6%Consumption Million M3 0.21 -0.08 -0.14 0.34 -0.08 -138%
Item UnitYear Growth (%)
On the other
in
Similar to that export, import quantity increased by 288%, but import value
only increased by 77%, indicating a decrease in Malaysia’s plywood import price
during the period 2002-2006.
FAO (2008) reported in 2005, major importer countries were China,
lic of Korea, Japan, Viet Nam and Indonesia, which together accounted for
89% of Malaysia’s particleboard exports (Figure 15).
22

Major importer of Malaysia particleboard in 2005
China
Others11%Indonesia
7% 31%
Korea, Republic of
26%Japan17%
Viet Nam8%
Figure 15. Major importers of Malaysia's particleboard in 2005
.5. Papua New Guinea
4During the period 2002-2006, FAOSTAT database did not report statistics
data on fiberboard.
23
V. MARKET AND TRADE OF FIBERBOARD
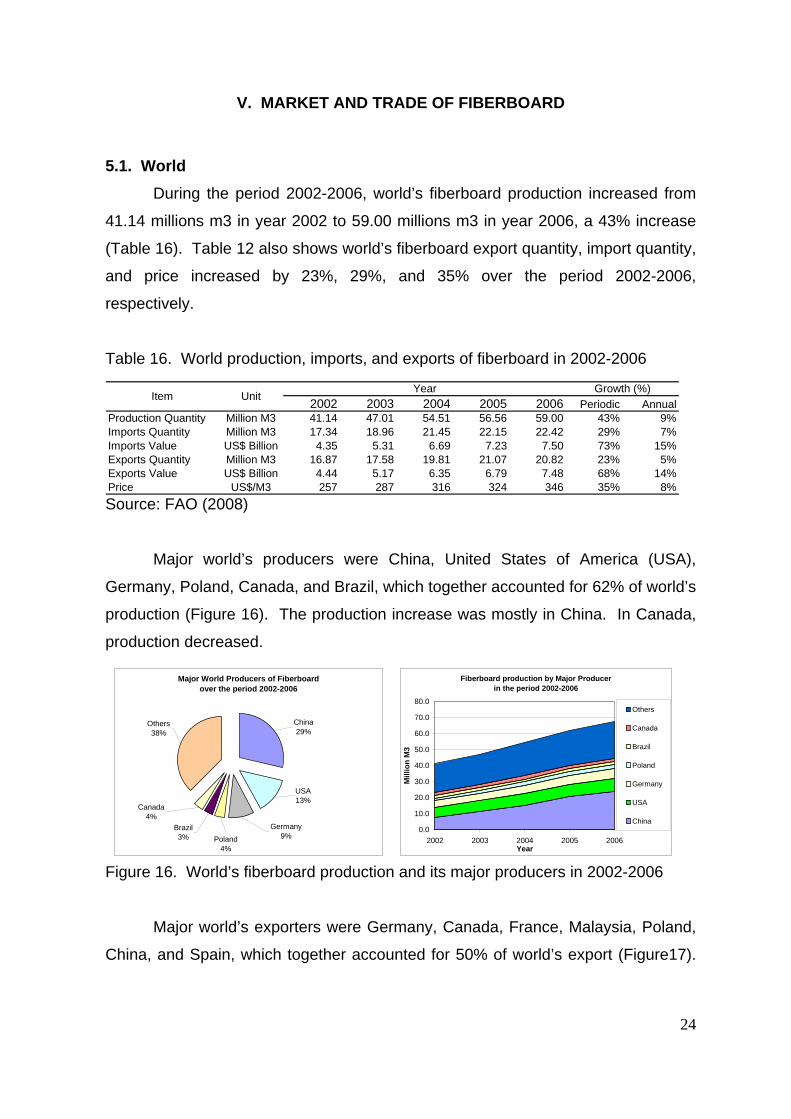
5.1. World During the period 2002-2006, world’s fiberboard production increased from
41.14 millions m3 in year 2002 to 59.00 millions m3 in year 2006, a 43% increase
able 16). Table 12 also shows world’s fiberboard export quantity, import quantity,
and price increased by 23%, 29%, and 35% over the period 2002-2006,
respectively.
Table 16. World production, imports, and exports of fiberboard in 2002-2006
Source: FAO (2008)
Major world’s producers were China, United States of America (USA),
roduction (Figure 16). The production increase was mostly in China. In Canada,
(T
2002 2003 2004 2005 2006 Periodic AnnualProduction Quantity Million M3 41.14 47.01 54.51 56.56 59.00 43% 9%Imports Quantity Million M3 17.34 18.96 21.45 22.15 22.42 29% 7%Imports Value US$ Billion 4.35 5.31 6.69 7.23 7.50 73% 15%Exports Quantity Million M3 16.87 17.58 19.81 21.07 20.82 23% 5%Exports Value US$ Billion 4.44 5.17 6.35 6.79 7.48 68% 14%Price US$/M3 257 287 316 324 346 35% 8%
Item UnitYear Growth (%)
Germany, Poland, Canada, and Brazil, which together accounted for 62% of world’s
p
production decreased.
Figure 16. World’s fiberboard production and its major producers in 2002-2006
Major world’s exporters were Germany, Canada, France, Malaysia, Poland,
China, and Spain, which together accounted for 50% of world’s export (Figure17).
Major World Producers of Fiberboardover the period 2002-2006
Germany9%Poland
4%
Brazil3%
Canada4%
Others38%
USA13%
China29%
Fiberboard production by Major Producer in the period 2002-2006
20.0
30.0
40.0
50.0
60.0
70.0
80.0
Mill
ion
M3
0.0
10.0
2002 2003 2004 2005 2006Year
Others
Canada
Brazil
Poland
Germany
USA
China
24

The export increase has occurred mainly in China, Germany, Poland and Malaysia,
hile production decreased in Poland.
Figure 17. World’s fiberboard export and its major exporters in 2002-2006
In order of importance, major world’s importers were United States of
merica (USA), China, Germany, United Kingdom, Belgium, and the Republic of
orea, which together accounted for 43% of world’s import (Figure 18). The import
crease has occurred mainly in United States of America (USA) followed by
elgium. In China, Germany, United Kingdom, and the Republic of Korea, import
ecreased.
Although United States of America and China were two of the largest world’s
Figure 18. World’s fiberboard export and its major exporters in 2002-2006
w
Major World Exporters of Fiberboardover the period 2002-2006
Others
Germany17%
China4%
Fra
A
K
in
B
d
producers, which together accounted for 42% of world’s production, they were net
importers, which together accounted for 26% of world’s import.
50%nce
Spain4%
Poland5%
Malaysia6%
Canada8%
6%
Fiberboard export by Major Exporter in the period 2002-2006
20.0
25.0
0.0
5.0
10.0
2002 2003
Mill
io
15.0
2004 2005 2006Year
n M
3
Others
Spain
Poland
Malaysia
Canada
France
China
Germany
Major World Importers of Fiberboardover the period 2002-2006
Belgium4%
Germany6%
United Kingdom
5%
Korea, Rep.2%
Others57%
China11%
USA15%
Fiberboard import by Major Importer in the period 2002-2006
0.0
5.0
10.0
15.0
20.0
25.0
2002 2003 2004 2005 2006
Mill
ion
M3
Others
Korea, Rep.
UnitedKingdomGermany
Belgium
China
USA
Year
25

5.2. ITduction from ITTO producer countries increased sharply from
4.26 million m3 in 2002 to 5.94 million m3 in 2006, an increase of 39.5% (Table 17).
Over this period, about 24.51 million m3 of fiberboard were produced which
accounted for 9.5% of the world’s production of fiberboard. Of this 13.15 million m3
(53.7%) was provided by the Asia-Pacific region, 11.20 million m3 (45.7%) by Latin
America, and 0.15 million m3 (0.6%) by Africa. The main producers were Brazil
(37.0%), Malaysia (27.7%) and Thailand (14.8%), which together accounted for
79.5% of ITTO production. Other important producers were Indonesia (8.7%),
Venezuela (5.6%) and India (2.5%).
Table 17. Production, exports, change, country and regional shares of fibreboard in the period 2002-2006
Source: FAO (2008)
TO Countries Fiberboard pro
Production (million CUM) Exports (million CUM)
Country/Region 2002 2006 Change 2002-2006
Total 2002-2006
Total shares (%) 2002 2006 Change
2002-2006Total
2002-2006Total shares
(%)Cameroon 0.00 0.00 0.00 0.00 0.0% 0.00 0.00 0.00 0.00 0.0%Central African Republic 0.00 0.00 0.00 0.00 0.0% 0.00 0.00 0.00 0.00 0.0%Congo, Dem Republic of 0.00 0.00 0.00 0.00 0.0% 0.00 0.00 0.00 0.00 0.0%Congo, Republic of 0.00 0.00 0.00 0.00 0.0% 0.00 0.00 0.00 0.00 0.0%Côte d'Ivoire 0.00 0.00 0.00 0.00 0.0% 0.00 0.00 0.00 0.00 0.0%Gabon 0.00 0.00 0.00 0.00 0.0% 0.00 0.00 0.00 0.00 0.0%Ghana 0.00 0.00 0.00 0.00 0.0% 0.00 0.00 0.00 0.00 0.0%Liberia 0.03 0.03 0.00 0.15 0.6% 0.00 0.00 0.00 0.00 0.0%Nigeria 0.00 0.00 0.00 0.00 0.0% 0.00 0.00 0.00 0.00 0.0%Togo 0.00 0.00 0.00 0.00 0.0% 0.00 0.00 0.00 0.00 0.0%
Africa 0.03 0.03 0.00 0.15 0.6% 0.00 0.00 0.00 0.00 0.0%Cambodia 0.00 0.00 0.00 0.00 0.0% 0.00 0.00 0.00 0.00 0.0%Fiji Islands 0.00 0.00 0.00 0.00 0.0% 0.00 0.00 0.00 0.00 0.0%India 0.11 0.13 0.02 0.61 2.5% 0.01 0.01 0.00 0.07 0.5%Indonesia 0.43 0.43 0.00 2.14 8.7% 0.25 0.44 0.19 1.69 11.8%Malaysia 1.22 1.50 0.28 6.78 27.7% 1.06 1.28 0.22 5.67 39.4%Myanmar 0.00 0.00 0.00 0.00 0.0% 0.00 0.00 0.00 0.00 0.0%Papua New Guinea 0.00 0.00 0.00 0.00 0.0% 0.00 0.00 0.00 0.00 0.0%Philippines 0.00 0.00 0.00 0.00 0.0% 0.00 0.03 0.03 0.08 0.6%Thailand 0.73 0.72 -0.01 3.63 14.8% 0.60 1.06 0.46 3.68 25.6%Vanuatu 0.00 0.00 0.00 0.00 0.0% 0.00 0.00 0.00 0.00 0.0%
Asia Pacific 2.49 2.78 0.29 13.15 53.7% 1.91 2.81 0.90 11.19 77.8%Bolivia 0.01 0.02 0.02 0.07 0.3% 0.01 0.01 0.00 0.06 0.4%Brazil 1.41 2.30 0.89 9.06 37.0% 0.40 0.51 0.11 2.45 17.0%Colombia 0.02 0.02 0.01 0.10 0.4% 0.01 0.01 0.00 0.05 0.3%Ecuador 0.02 0.02 0.00 0.09 0.4% 0.04 0.04 0.00 0.22 1.5%Guatemala 0.00 0.00 0.00 0.00 0.0% 0.01 0.00 -0.01 0.01 0.1%Guyana 0.00 0.00 0.00 0.00 0.0% 0.00 0.00 0.00 0.00 0.0%Honduras 0.00 0.00 0.00 0.00 0.0% 0.00 0.00 0.00 0.00 0.0%Mexico 0.10 0.11 0.01 0.49 2.0% 0.01 0.00 -0.01 0.02 0.2%Panama 0.00 0.00 0.00 0.02 0.1% 0.00 0.00 0.00 0.00 0.0%Peru 0.00 0.00 0.00 0.00 0.0% 0.00 0.00 0.00 0.00 0.0%Suriname 0.00 0.00 0.00 0.00 0.0% 0.00 0.00 0.00 0.01 0.1%Trinidad and Tobago 0.00 0.00 0.00 0.00 0.0% 0.00 0.00 0.00 0.00 0.0%Venezuela,Bolivar Rep of 0.18 0.65 0.47 1.37 5.6% 0.03 0.05 0.02 0.38 2.6%
Latin America 1.74 3.13 1.39 11.20 45.7% 0.50 0.63 0.12 3.19 22.2%Total ITTO Producers 4.26 5.94 1.68 24.51 100.0% 2.42 3.44 1.03 14.39 100.0%
World 41.14 59.00 17.86 258.23 16.87 20.82 3.95 96.15
26

Production d by Asia-Pacific
region. The production increase has occurred mainly in Brazil, Venezuela and
on decreased in Thailand.
2002 to 2006, ITTO producing countries exported about 14.39 million
m3 of fiberboard or about 58.7%
period 2003-2007.
Table
grew fastest in the Latin America region followe
Malaysia, while producti
From
of their production (Table 17). The largest share
came from the Asia-Pacific region with exports of 11.19 million m3 (77.8%) followed
by Latin America of 3.19 million m3 (22.2%). In order of importance, the main
exporting countries were Malaysia, Thailand, Brazil and Indonesia, which together
accounted for 93.8% of ITTO fiberboard exports.
5.3. Indonesia During the period 2003-2007, Ministry of Forestry of the Republic of
Indonesia did not report Indonesia’s fiberboard production, but it did report exports
and imports of fiberboard as shown in Table 18, which shows that export quantities
were higher than import quantities even though export growth was slower that
import growth over the
18. Production, imports, and exports of Indonesia fiberboard in 2003-2007
2003 2004 2005 2006 2007 Periodic AnnualProduction Quantity Million ton NA NA NA NA NAImports Quantity Million ton 0.03 0.05 0.06 0.06 0.06 95% 18%
Item Unit Year Growth (%)
Imports Value US$ Million 10.20 17.30 20.32 20.79 23.61 132% 23%Import s Price US$/ton 317.75 324.09 313.78 328.92 377.73 19% 4%Exports Quantity Million ton 0.17 0.20 0.23 0.20 0.21 26% 6%Exports Value US$ Million 34.55 47.22 55.09 49.35 70.80 105% 20%Exports Price US$/ton 202.22 235.30 234.65 240.80 329.46 63% 13%Consumption Million ton
pled with import quantity that was doubled over that period,
ort
alue increased only by 25%, indicating a decrease in Indonesia fiberboard export
prices.
Source: MOF (2008b)
Meanwhile, during the period 2002-2006, FAO (2008) reported that
Indonesia’s fiberboard production was relatively unchanged (Table 19).
Meanwhile, fiberboard consumption and import price were decreased by 24% and
22%, respectively. Cou
Indonesia fiberboard export quantity was increased by 57%. However, exp
v
27

Table 19. Production, imports, and exports of Indonesia fiberboard in 2002-2006
Source: FAO (2008)
MOF (2008b) reported over the period 2003-2007, major importer countries
were China, Saudi Arabia, the Republic of Korea, Taiwan and Syria Arab Republic,
hich together accounted for 66% of Indonesia’s fiberboard exports (Figure 19).
More bia,
nd Syria Arab Republic increased, while to the Republic of Korea and Taiwan
decrea
w
over, during that period Indonesia’s fiberboard exports to China, Saudi Ara
a
sed.
China
Major importers of Indonesia's fiberboard over the period 2003-2007
30%
Saudi Arabia15%
Korea, Republic
Taiwan, Province of China
6%
Other Countries34%
of9%
Syria Arab Republic
6%
Figure 19. Major importers of Indonesia's fiberboard over the period 2002-2006
5.4. Malaysia Over the period 2002-2006, Malaysia’s fiberboard production sharply
increased by 23%, from 1.22 millions m3 in year 2002 to 1.50 millions m3 in year
2006 (Table 20). Fiberboard import quantity was drastically increased by 77%,
2002 2003 2004 2005 2006 Periodic AnnualProduction Quantity Million M3 0.43 0.43 0.43 0.43 0.43 0% 0%
Item UnitYear Growth (%)
Imports Quantity Million M3 0.08 0.05 0.11 0.16 0.16 102% 19%Imports Value US$ Million 12.95 10.20 17.54 20.32 20.32 57% 12%Imports Price US$/M3 166.66 188.23 161.21 129.61 129.61 -22% -6%Exports Quantity Million M3 0.25 0.22 0.35 0.39 0.39 57% 12%Exports Value US$ Million 44.14 34.87 47.52 55.09 55.09 25% 6%Exports Price US$/M3 178.51 160.90 137.27 141.47 141.47 -21% -6%Consumption Million M3 0.26 0.26 0.19 0.19 0.19 -24% -7%
28
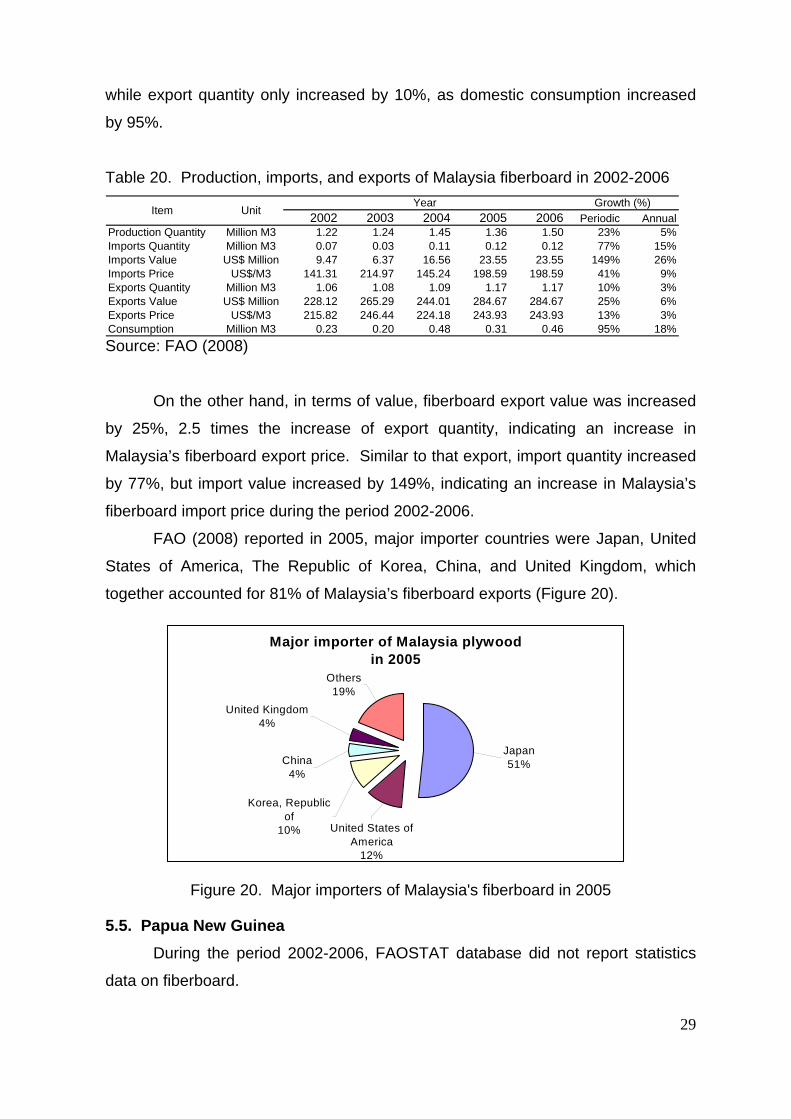
while export quantity only increased by 10%, as domestic consumption increased
by 95%.
Table 20. Production, imports, and exports of Malaysia fiberboard in 2002-2006
ource: FAO (2008)
Figure 20. Major importers of Malaysia's fiberboard in 2005
5.5. Papua New Guinea During the period 2002-2006, FAOSTAT database did not report statistics
data on fiberboard.
S
2002 2003 2004 2005 2006 Periodic AnnualProduction Quantity Million M3 1.22 1.24 1.45 1.36 1.50 23% 5%Imports Quantity Million M3 0.07 0.03 0.11 0.12 0.12 77% 15%Imports Value US$ Million 9.47 6.37 16.56 23.55 23.55 149% 26%Imports Price US$/M3 141.31 214.97 145.24 198.59 198.59 41% 9%ExportExpor
ports Price US$/M3 215.82 246.44 224.18 243.93 243.93 13% 3%onsumption Million M3 0.23 0.20 0.48 0.31 0.46 95% 18%
Item UnitYear Growth (%)
s Quantity Million M3 1.06 1.08 1.09 1.17 1.17 10% 3%ts Value US$ Million 228.12 265.29 244.01 284.67 284.67 25% 6%
ExC
On the other hand, in terms of value, fiberboard export value was increased
by 25%, 2.5 times the increase of export quantity, indicating an increase in
Malaysia’s fiberboard export price. Similar to that export, import quantity increased
by 77%, but import value increased by 149%, indicating an increase in Malaysia’s
fiberboard import price during the period 2002-2006.
FAO (2008) reported in 2005, major importer countries were Japan, United
States of America, The Republic of Korea, China, and United Kingdom, which
together accounted for 81% of Malaysia’s fiberboard exports (Figure 20).
Major importer of Malaysia plywood in 2005
United Kingdom4%
Others19%
China4%
Korea, Republic of
10% United States of America
12%
Japan51%
29

VI. SUMMARY
Plywood production from ITTO producer countries decreased by 7.0% over
the period 2002-2006. Over that period, about 84.32 million m3 of plywood were
produced which accounted for 25% of the world’s production of plywood. The Asia-
Pacific region provided 74.9%, the Latin America region 22.9%, and the Africa
region 2.2%. The largest single producer was Indonesia, which alone accounted
for 31.5% of ITTO producer countries production. Other important producers were
Malaysia (28.8%), Brazil (20.3%) and India (11.3%). Major tropical plywood
importers in 2006 were Japan, United States of America, The Republic of Korea,
Taiwan and China. A few Western European countries were also important
importers, though smaller.
Veneer sheet production from ITTO producer countries increased sharply by
33.6% during the period 2002-2006. Over this period, about 15.78 million m3 of
veneer sheet were produced which accounted for one third of the world’s
production of veneer sheets. Of this 54.3% was provided by the Asia-Pacific
Latin America region, and 21.4% by the Africa region. Main
roducers were Malaysia, Brazil, Indonesia, Ghana, India, the Philippines, and
Côte d
veneer
import
ingle producer was Brazil, which
lone accounted for 59.0% of ITTO production. Other important producers were
Malaysia (8.4%), and Indonesia (6.0%).
O
fiberboard. Of this 53.7% was provided by the Asia-Pacific region, 45.7% by the
region, 24.3% by the
p
'Ivoire, which together accounted for 87.2% of ITTO producer countries
production. Major tropical veneer sheet importers in 2006 were The Republic of
Korea, Taiwan, French, China and Italy. Japan, formerly a major tropical
er, became less significant with imports continuing to decline.
Particleboard production from ITTO producer countries increased slightly
by1.5% during the period 2002-2006. Over this period, about 18.96 million m3 of
particleboard were produced which accounted for 3.9% of the world’s production of
particleboard. The Latin America region provided 69.3%, the Asia-Pacific region
29.4%, and the Africa region 1.3%. The largest s
a
Thailand (14.25),
ver the period 2002-2006, fiberboard production from ITTO producer
countries increased sharply by 39.5%. Over this period, about 24.51 million m3 of
fiberboard were produced which accounted for 9.5% of the world’s production of
30

Latin America region, and 0.6% by the Africa region. The main producers were
Brazil (37.0%), Malaysia (27.7%) and Thailand (14.8%), which together accounted
r 79.5% of ITTO production. Other important producers were Indonesia (8.7%),
fo
Venezuela (5.6%) and India (2.5%).
31
REFERENCES
BPS. 2003. Economic Indicators. Various months. BPS-Statistics of Indonesia. Jakarta
FAO. 2008. FAOSTAT Database home page (http://www.fao.org/). Food And Agriculture Organization of the United Nations, Rome.
ITTO. 2007. Annual Review and Assessment of the World Timber Situation 2007. Division of Economic Information and Market Intelligence, ITTO. Yokohama, Japan.
ITTO. 2006. Annual Review and Assessment of the World Timber Situation 2007. Division of Economic Information and Market Intelligence, ITTO. Yokohama, Japan.
MOF. Various years. Strategic forestry data: An executive report. Forest Planning Agency, Ministry of Forestry of the Republic of Indonesia. Jakarta.
MOF. 2008a. Forestry statistics of Indonesia. Ministry of Forestry of the Republic of Indonesia. Jakarta.
MOF. 2008b. Export and Import of Forest Commodities. Ministry of Forestry of
UNECE/FAO. 2007. Forest Products Annual Market Review, 2006-2007. Geneva Timber and Forest Study Paper 22. United Nations. New York and Geneva.
006. Forest Products Annual Market Review, 2005-2006. Geneva Tim
AO. 2003. Forest Products Annual Market Analysis, 2002-2004. Timber Bulletin-Volume LVI (2003), No.3. United Nations. Geneva.
Tissari, J., A. Schuler and C. Adair. 2003. Value-Added Products Market, 2001-2003. Geneva Timber and Discussion Paper 36. UNECE/FAO-United Nations.
the Republic of Indonesia. Jakarta.
UNECE/FAO. 2ber and Forest Study Paper 21. United Nations. New York and Geneva.
UNECE/FAO. 2005. Forest Products Annual Market Review, 2004-2005. Timber Bulletin-Volume LVIII (2005). United Nations. Geneva.
UNECE/FAO. 2004. Forest Products Annual Market Review, 2003-2004. Timber Bulletin-Volume LVII (2004), No.3. United Nations. Geneva.
UNECE/F
Geneva.
32