Market Analysis Handbook - National Association of ... Analysis Handbook 2005 Supported by: Market...
96
Market Analysis Handbook 2005 Supported by: Market Analysis Working Group (MAWG) National Association Of Insurance Commissioners
-
Upload
nguyenthien -
Category
Documents
-
view
215 -
download
0
Transcript of Market Analysis Handbook - National Association of ... Analysis Handbook 2005 Supported by: Market...

Market Analysis
Handbook
2005
Supported by: Market Analysis Working Group (MAWG)
National Association Of Insurance Commissioners

© 2004-2005 National Association of Insurance Commissioners All rights reserved.
National Association of Insurance Commissioners Insurance Products & Services Division
816-783-8300 Fax 816-460-7593
www.naic.org/insprod [email protected]
Printed in the United States of America
No part of this book may be reproduced, stored in a retrieval system, or transmitted in any form or by any means, electronic or mechanical, including photocopying, recording, or any storage or retrieval system, without written permission from the NAIC.
Executive Headquarters Securities Valuation Office Government Relations 2301 McGee Street, Suite 800 48 Wall Street, 6th Floor Hall of States Bldg. Kansas City, MO 64108-2662 New York, NY 10005-2906 444 North Capitol NW, Suite 701 816-842-3600 212-398-9000 Washington, DC 20001-1509 202-624-7790

Table of Contents EXECUTIVE SUMMARY...........................................................................................................................................................................................1
MARKET ANALYSTS CHECKLIST.................................................................................................................................................................................2 INTRODUCTION.........................................................................................................................................................................................................3
A. PURPOSE OF THIS HANDBOOK.................................................................................................................................................................................3 B. WHAT IS MARKET ANALYSIS? ...............................................................................................................................................................................5 C. ROLE OF THE NAIC MARKET ANALYSIS WORKING GROUP (MAWG).................................................................................................................5
BASIC ANALYTICAL TOOLS..................................................................................................................................................................................7 A. MARKET CONDUCT INDICATORS AND PRIORITIES.................................................................................................................................................7 B. THE NAIC’S I-SITE APPLICATION.........................................................................................................................................................................8 C. USE OF COMPLAINT DATA IN MARKET ANALYSIS ................................................................................................................................................8 D. USE OF ANNUAL STATEMENT DATA IN MARKET ANALYSIS...............................................................................................................................10 E. ISSUES SPECIFIC TO PARTICULAR TYPES OF COMPANIES ....................................................................................................................................12 F. OTHER USEFUL INFORMATION..............................................................................................................................................................................13
PUTTING IT ALL TOGETHER: MARKET ANALYSIS ....................................................................................................................................18 A. DEVELOPING A MARKET ANALYSIS PROGRAM ...................................................................................................................................................18 B. IDENTIFYING MARKETS AND COMPANIES FOR BASELINE ANALYSIS..................................................................................................................20 C. HOW TO ANALYZE CONSUMER COMPLAINT DATA .............................................................................................................................................21 D. HOW TO ANALYZE STATE PAGE DATA ................................................................................................................................................................26 E. COORDINATION WITH THE MARKET ANALYSIS WORKING GROUP......................................................................................................................29
ENHANCING STATE MARKET ANALYSIS .......................................................................................................................................................32 A. IMPROVING CONSUMER COMPLAINT ANALYSIS..................................................................................................................................................32
1. Key Elements of Best Practices ..................................................................................................................................................................32 2. More Detailed Information on Complaints and Regulatory Actions.........................................................................................................34 3. Calculating Complaint Ratios by Number of Policies ...............................................................................................................................34 4. Improving Complaint Analysis Through Use of the CDS ..........................................................................................................................35 5. Publishing Complaint Information.............................................................................................................................................................36 6. Confirmed Complaints................................................................................................................................................................................36
B. USE OF IRIS RATIOS IN MARKET ANALYSIS........................................................................................................................................................37 C. THE USE OF UNDERWRITING GUIDELINES IN MARKET ANALYSIS: .....................................................................................................................39 D. MODES OF ANALYSIS ...........................................................................................................................................................................................44
1. Analysis of General Market Conditions .....................................................................................................................................................44 2. Individual Company Concerns...................................................................................................................................................................44 3. Global Objectives .......................................................................................................................................................................................45
E. EXAMPLES – THE MISSOURI EXPERIENCE ............................................................................................................................................................46 F. EXAMPLES – THE PENNSYLVANIA EXPERIENCE...................................................................................................................................................48 G. EXAMPLES – THE ARIZONA EXPERIENCE.............................................................................................................................................................49 H. EXAMPLES – THE OREGON EXPERIENCE..............................................................................................................................................................52 I. EXAMPLES – THE MAINE EXPERIENCE ..................................................................................................................................................................52
RESPONDING TO MARKET CONDUCT PROBLEMS .....................................................................................................................................54 A. EDUCATION...........................................................................................................................................................................................................54
1. Proactive Outreach....................................................................................................................................................................................54 2. Department Communications....................................................................................................................................................................54
B. OFFICE-BASED INFORMATION GATHERING .........................................................................................................................................................54 1. Interview with Company............................................................................................................................................................................54 2. Targeted Information Gathering ...............................................................................................................................................................54 3. Policy and Procedure Reviews..................................................................................................................................................................54 4. Interrogatories...........................................................................................................................................................................................55 5. Desk Audits ................................................................................................................................................................................................55 6. Self-Audits..................................................................................................................................................................................................55 7. Voluntary Compliance Programs..............................................................................................................................................................55
C. ON-SITE AUDITS ...................................................................................................................................................................................................55 1. Priority Listing...........................................................................................................................................................................................55 2. Investigation ..............................................................................................................................................................................................55 3. Targeted Exams ..........................................................................................................................................................................................55 4. Comprehensive Exams................................................................................................................................................................................56 5. Collaborative Examinations.......................................................................................................................................................................56 6. Compliance Programs................................................................................................................................................................................56 7. Enforcement Actions...................................................................................................................................................................................56

D. NEW STATUTES OR REGULATIONS.......................................................................................................................................................................56 APPENDIX A: CATALOG OF MARKET ANALYSIS RESOURCES...............................................................................................................58
A. RESOURCES WITHIN YOUR DEPARTMENT ...........................................................................................................................................................58 B. NAIC DATABASES, I-SITE REPORTS AND OTHER RESOURCES..........................................................................................................................58
1. Market Analysis and Compliance Summary Reports.................................................................................................................................58 2. State Page Summary Reports .....................................................................................................................................................................60 3. Financial Analysis Summary Reports ........................................................................................................................................................61 4. Company Financial Reports.......................................................................................................................................................................62 5. Market Analysis Profile Reports ................................................................................................................................................................63 6. Other NAIC Resources ...............................................................................................................................................................................64
C. OTHER REGULATORY SOURCES ...........................................................................................................................................................................67 1. Federal Regulators and Databases............................................................................................................................................................67 2. Other States ................................................................................................................................................................................................67 3. Regulatory Meetings...................................................................................................................................................................................67 4. Other Regulatory Agencies Within Your State...........................................................................................................................................67
D. THE WORLD WIDE WEB.......................................................................................................................................................................................67 E. INDUSTRY SOURCES..............................................................................................................................................................................................68
1. Financial Rating Agencies .........................................................................................................................................................................68 2. Company Self-Audits ..................................................................................................................................................................................69
F. PUBLIC INFORMATION SOURCES...........................................................................................................................................................................69 1. CEJ Data Guide..........................................................................................................................................................................................69 2. Legal Actions ..............................................................................................................................................................................................69 3. Consumer and Community Groups ............................................................................................................................................................69 4. Trade Press/Research Papers ....................................................................................................................................................................69
APPENDIX B: NAVIGATING I-SITE ....................................................................................................................................................................70 EXAMPLE 1: COMPLAINT INDEX SUMMARY .............................................................................................................................................................71 EXAMPLE 2: FINANCIAL STATEMENT DATA.............................................................................................................................................................73 EXAMPLE 3: MARKET ANALYSIS PROFILE REPORTS................................................................................................................................................80
Using the Market Firm Search .......................................................................................................................................................................80 Using the Financial Company Search............................................................................................................................................................82
APPENDIX C: NAIC STANDARD CLOSED COMPLAINT FILING SUBMISSION FORM .......................................................................84 NEW CLOSED CONSUMER COMPLAINT FIELDS.........................................................................................................................................................84 CLOSED CONSUMER COMPLAINT STATE SUBMISSION FORM...................................................................................................................................86
APPENDIX D: REGULATORY ACTION SUBMISSION FORM ......................................................................................................................90 NEW REGULATORY ACTION FIELDS .........................................................................................................................................................................90 RIRS SUBMISSION FORM ..........................................................................................................................................................................................91
Editor’s Note: Much of the access to information contained in this handbook is limited to state regulators, such as access to the NAIC’s I-SITE application.

Executive Summary _________________________________________________________________________________
As recognized in the Market Conduct Surveillance Model Law that was jointly adopted in 2004 by the National Association of Insurance Commissioners and the National Conference of Insurance Legislators, market analysis is the foundation of an effective, efficient market regulation program. The NAIC has developed this Market Analysis Handbook in order to assist states in developing, implementing, and coordinating market analysis programs. Analysts whose interest centers on practices and procedures should focus on the baseline analysis summarized in the checklist on the next page and explained in more detail in Section IV. The NAIC and the states have worked hard to fulfill the initial goal of having a market analysis program that incorporates these procedures in place in every state in 2004.
Section II provides an overview of the elements and objectives of market analysis and the role of the NAIC’s Market Analysis Working Group (MAWG). Section III then provides background information on the basic analytical tools, beginning with an explanation of the NAIC’s I-SITE system, an essential information resource for state regulators. It then discusses a few key items of information that are most likely to be indicators of market conduct problems: consumer complaint data, and the state-by-state transaction data from insurers’ financial statements, and closes with a brief discussion of other significant sources of available data.
As noted above, the heart of this handbook is section IV, which outlines a baseline market analysis framework for every state to implement and provides a tool kit for organizing a market analysis program and conducting basic market analysis in three core areas: consumer complaint data, state page data and market share data.
States are encouraged to conduct a more in-depth analysis as resources permit, and it is anticipated that the scope of the baseline analysis will be expanded and refined in years to come. There are a variety of possible improvements to explore, including improving the quality of the techniques in use, analyzing more issues and enhancing coordination with other states. Section V provides some suggestions for possible improvements, more in-depth discussions of some of the issues raised in earlier sections of the handbook and reports from several states that have already implemented programs in market analysis and related issues.
Finally, since the goal of market analysis is informed action, not just knowledge for its own sake, section VI summarizes the continuum of regulatory responses to consider once an issue has been identified. These responses range from education, informal discussions, and office-based reviews to on-site examinations and investigations, or, where the problem is more global in nature, global efforts at solutions, such as changes in the relevant laws.
An outline of many of the data sources regulators have found useful has been included as an appendix, along with an illustrated guide for getting started in I-SITE and copies of the NAIC’s reporting forms for complaints and regulatory action.
This is the second edition of the handbook, which will be updated periodically as regulators build on their shared experiences and new tools and techniques evolve.

Market Analysts Checklist Designate a Market Analysis Coordinator
• Principal liaison with MAWG • Responsible for communication with other work units within the department • Responsible for baseline analysis of key lines of business
Establish systematic interdivisional communication program, surveying other work units on at least a quarterly basis.
Identify key lines of business for systematic review—these should include the major lines (group and individual health (including HMOs); homeowners; personal auto; individual life (including annuities) and also any other lines identified as being of significant consumer or regulatory concern.
Identify companies with significant market activity in each of these lines—at a minimum, companies with either one percent or greater market share, $100,000 or more in premium or five or more complaints.
Calculate and compile complaint indices for the companies identified above.
Review state page data for these companies, with particular attention to premium volume, loss ratio and where applicable, reserves and defense costs.
Identify priority companies for further analysis based on:
• Complaint activity • Referrals from MAWG, other states or other work units • Significant changes in premium volume or market share • Significant changes or anomalies in reserves • Significant changes or anomalies in defense costs • Loss ratios unusually high or low relative to overall market • Major participant in noncompetitive or undercompetitive market sector
Report all significant findings to MAWG and follow up with MAWG as appropriate.
Consult with MAWG and other states to see what problems they have identified that may involve local market or domestic companies.
Specifically apprise MAWG of concerns with any nationally significant companies:
• $50 million premium and activity in five states in one of last three years • or p/c company with $30 million premium and activity in 17 states
Follow up with company as early as possible to ensure that concerns are adequately addressed before small problems become large problems.
• Regulatory response should be commensurate with the nature and extent of the questions or problems, as discussed in section VI of this handbook.
Coordinate through MAWG or with other affected states to establish a single contact point for issues of multistate concern.

3
Introduction _________________________________________________________________________________
A. Purpose of this handbook The NAIC has developed this handbook to assist states in developing, implementing and coordinating market analysis programs. It includes an outline of the elements and objectives of market analysis, and guidance to be followed by state market analysis staff as they establish and implement market analysis programs. The Market Conduct Surveillance Model Law, which was jointly adopted in 2004 by the NAIC and NCOIL, contemplates that states will use this Handbook as a resource for developing a baseline understanding of the insurance marketplace which will serve as the underpinning for further market surveillance activities.
Broadly speaking, the purpose of a state’s market regulation program is to assess how well the market as a whole, and the individual companies that make up that market, are meeting consumers’ needs, and then to take appropriate action if problems are identified. As insurance departments evaluate market conditions and companies’ performance, they have three basic mechanisms for gathering information: examinations and investigations of specific companies; surveys and periodic reporting requirements designed to gather market conduct data; and the analysis of existing information that departments already collect for other purposes.
In order to obtain a complete and accurate picture of the marketplace, it is essential to approach the problem from all three perspectives. The focus of this initial version of the Market Analysis Handbook is the third set of tools: making the best use of currently existing information, including information collected by the department, information collected by the NAIC, data compilations prepared by the NAIC and made available to states online, and a variety of other sources in both the public and private sectors, both within and outside the insurance industry. In particular, consumer complaint data and financial statement data—especially the state-by-state “Page 14” and “Page 15” reports—form a core data set which is generally available to all states and provides a solid common foundation which can serve as a starting point for all market analysis programs. This is an evolving process—for example, few states currently require market conduct annual statements, so these are not widely available at this time as “current data,” but the scope of the information reviewed may change in the future as regulatory practices develop.1 In particular, the Market Conduct Annual Statement Pilot Project has shown considerable promise. Several additional states have now joined the pilot project, and MAWG has recommended that it be transitioned to a permanent program.
The purpose of this handbook is to assist states in optimizing the use of department resources, eliminating duplicative inquiries and investigations and coordinating efforts with other states. Examinations are valuable in identifying problems after they appear so that they can be remedied, but prevention is even more valuable. Coordination is essential not only to make market regulation more efficient, but also because market regulation by nature is different from financial regulation and cannot be conducted in isolation by a single state. For financial regulation, the other states where the company does business can defer to the domiciliary state, as long as a company’s domiciliary regulator is conducting effective solvency oversight, because a company’s financial condition is a property of the company as a whole. The company is either solvent or insolvent; it either does or does not have the surplus required by law. If one line of business or one state or region, is profitable while another is not, such variations are only relevant to financial regulation to the extent that they provide insight into the company’s present and future financial condition.
1 For example, some regulators have the capability in place to monitor underwriting guidelines, detailed geographic market performance data, surveys of market participants, reviews of recent insurance litigation, and marketplace testing programs.

By contrast, compliance is not an all-or-nothing proposition like solvency. There is no bottom line. If a company’s financial condition is like water, flowing until it reaches the same uniform level, compliance with its legal obligations and responsible business practices is like the landscape and possibly featuring significant peaks and valleys. Both the company’s own operations and the legal and market environment in which it operates may vary considerably from state to state. If a company’s compliance is inadequate in a particular place or a particular line of business, it does not matter how strong the company’s performance is in its other operations. Money the company earns in other states is available to pay claims in an individual’s state, but a good record of timely payment in other states is no consolation to consumers in an individual’s state if their own experiences with the company are not so good.
However, it would be a mistake to overemphasize the notion that “all market conduct is local.” Although the impact of a company’s market conduct is felt one customer at a time, that impact is hardly a matter of pure chance. A company’s compliance or noncompliance is largely the systematic result of decisions and policies made at a national or regional level. A company that has demonstrated an outstanding or outrageous record of customer service in one market will likely have a comparable record in other markets where it does business. The company as a whole is accountable for its actions and the managers of a well-run organization take that principle to heart. And even where variations between states do exist, these variations make it all the more important for states to work together in order to conduct effective market regulation, especially when it comes to quantitative market analysis, since many trends and patterns can only be identified by combining or comparing information from the various states in which the company does business.
This handbook contains basic steps that each state can use, in a consistent manner with other states, as a starting point to develop a baseline understanding of its marketplace and to target companies likely to experience impending or long term market conduct/compliance problems. The approaches described in this handbook, with a primary focus on consumer complaint and State page data, are designed to keep state market regulators from feeling overwhelmed by the large numbers of licensed insurers and the massive volume of information that is available and enable regulators to screen insurers effectively and focus their attention and resources on those most in need of regulatory attention. This handbook is an evolving document and it is expected that discussion of additional types and sources of data will be incorporated on a routine basis. In this way, the market analysis capabilities of regulators can become more effective at focusing examination and enforcement activities on the most serious marketplace problems.
It is essential, however, to keep in mind that the information and indicators described in this handbook cannot provide an automatic trigger for any regulatory action. If used correctly and uniformly, they can assist a state in identifying possible predictors of potential problems, in using its resources better and in developing a more detailed understanding of its marketplace. The benefits of conducting market analysis in accordance with this handbook include:
• This initial version of the handbook is based on information insurance companies already report to the departments and information regulators can readily access.
• The handbook provides the fundamental elements of a system for market analysis for all companies and all lines of business.
• The indicators that result from the analysis suggested in this handbook should provide a basis for regulators to initially screen and follow-up with insurers whose results are out of the norm and help focus resources on insurers with potential market conduct problems.
• This handbook provides a good approach for monitoring the performance of a newly formed or newly licensed company.

5
B. What is Market Analysis? A market analysis program is a system of collection and analysis of data and other information that enables a regulator to do the following:
• Identify general market disruptions and important market conduct problems as early as possible and to eliminate or at least limit, the harm to consumers;
• Better prioritize and coordinate the various market regulation functions of the department and establish an integrated system of proportional responses to market problems; and
• Provide a framework for collaboration among the states and with federal regulators regarding identification of market conduct issues and market regulation.
As the General Accounting Office explains in its recently released report on state market regulation:2
Among other things, market analysis can provide information on insurance companies’ compliance with applicable laws and regulations, highlight practices that could have a negative effect on consumers and help identify problem companies for examination. NAIC and some states recognize that market analysis can be a significant regulatory tool and all of the states we visited performed some type of market analysis, but in most cases these efforts were fragmented and lacked a systematic organization and framework. We found that in many states, market analysis consisted largely of monitoring complaints and complaint trends and reacting to significant market issues. Analyzing complaints and complaint trends does provide regulators with useful and important information and should be part of any market analysis program. However, other types of information can also help regulators identify and deal with market conduct issues, including data from financial reports, rate and form filings and other company filings, routine and special requests for company data and information from other federal and state regulators. All this information, consistently and routinely evaluated by well-trained analysts, can help regulators identify companies that examiners need to look at more closely or that merit regulatory actions.
This handbook should assist a state in its review of existing data. As more techniques are developed and refined by the states and as more states participate in market analysis and other market oversight activities, the handbook will be updated so that states are constantly learning from each other and relying upon the resources of all of the states. The more states that move to consistency in their consumer complaint reporting as suggested in this handbook, the more useful and meaningful market analysis will become on a countrywide basis. As explained earlier, analysis of existing data is only one component of an effective market regulation program and all of the components must work together. Insights gained from data analysis must be shared and used to improve both the examination and data reporting processes and likewise, insights from market conduct examinations and reports will improve our understanding of the significance for market analysis of complaint data, financial data and other external information.
C. Role of the NAIC Market Analysis Working Group (MAWG) The NAIC Market Analysis Working Group (MAWG) is the national forum for states to share and coordinate the results of their market analysis programs and market conduct examinations. States can explore, for example, whether they are targeting the same companies, nationally or regionally. The more states that follow this handbook, the better MAWG will be able to function and the more effective their market oversight will become.
2 Insurance Regulation: Common Standards and Improved Coordination Needed to Strengthen Market Regulation. No. GAO-03-433, September 30, 2003.

MAWG reviews and coordinates state market analysis programs and also analyzes those nationally significant insurers that exhibit characteristics that might indicate current or potential future market regulatory issues that impact multiple jurisdictions. An insurer is considered “nationally significant” if, during at least one of the last three years, its gross premium volume was at least $50 million and the company was licensed or did business in at least five states.3 If concerns with a nationally significant insurer are identified, the domiciliary regulator is notified and develops a response plan in consultation with MAWG. MAWG then serves as a forum for coordination and periodic reporting, in which the domiciliary state, other affected states and MAWG members and staff can share their insights and expertise until the problems are addressed. In the coming year, under the auspices of MAWG, the NAIC will also be developing a system of standardized market regulatory data profiles for each nationally significant insurer.
3 A property/casualty insurer is also considered nationally significant if it wrote gross premium of $30 million and was licensed or did business in at least 17 states.

7
Basic Analytical Tools _________________________________________________________________________________
A. Market Conduct Indicators and Priorities The common denominator of this handbook is change. When there are changes in laws or regulations or in the marketplace, they affect processes and procedures within insurance companies and can increase the risk of market conduct or compliance problems during a period of adjustment. Similar problems can result from internal changes in a company, such as where, how and what it writes. Conversely, disruptions in a market sector or stresses or irregularities in a particular company’s operations will also leave their mark in the statistics.
Needless to say, the problem is not change in and of itself. Many changes are positive and a market with no signs of change would be troubling. Nevertheless, significant signs of change deserve careful regulatory attention, at least until their causes and effects are better understood. Even when the change is undeniably for the better, it may still highlight areas where some companies have not adapted as well as others to the evolving marketplace.
In order to assess the nature and extent of the changes it is essential to have meaningful baseline data. This section of the handbook explains the use of the NAIC’s I-SITE system, an essential information resource for state regulators and then discusses a few key items of information that are most likely to be indicators of market conduct problems; consumer complaint data and the state-by-state data from insurers’ financial statements. Other significant sources of available data are also discussed briefly.
The importance of the data described in this section begins at the very earliest stages of the process. Because state resources are finite, one of the most critical market analysis functions is setting priorities for review. Almost all states have over 1000 insurers licensed to do business so without a good sense of priorities, it can be daunting to identify which companies to look at and what to look for. Because companies with a larger market share will impact the greatest number of consumers, an effective regulatory review program must include the companies with the largest market shares, while at the same time being careful not to overlook concerns that may arise with smaller companies. As discussed in Part B of this section, market share reports are among the wealth of data compilations that the NAIC makes available to the states on I-SITE. For example, if a single company writes 25 percent of a significant line of insurance in your state, this company is a market leader to which regulators should pay attention for that reason alone. However, the same companies are likely to be targeted in other states, which makes multi-state coordination imperative, not only to avoid imposing unnecessary regulatory burdens upon insurers, but also to facilitate a deeper and more coherent analysis by the various regulators so as to address as efficiently and consistently as possible the company’s activities in all states where it does business.
Other factors to consider when setting priorities include consumer complaint activity, as discussed below in Part C and the lines of insurance transacted—some lines of insurance are more prone than others to particular types of market conduct problems and a more proactive market regulation program is generally better suited to personal lines than to commercial lines and generally better suited to small business markets than to other commercial lines markets. However, none of these criteria should be applied too rigidly. There is no foolproof way to predict which market issues will rise to the forefront, as demonstrated, for example, by the impact on the health care market of the problems many states have been experiencing with their medical malpractice insurance markets and by the broad-ranging consequences of the property insurance market’s response to September 11.

B. The NAIC’s I-SITE Application To avoid reinventing the wheel, regulators should familiarize themselves with I-SITE, a secure area within the NAIC Web site providing access to NAIC databases and a wide variety of reports prepared from those databases. Of particular importance to market analysis, as discussed in more detail in Parts C and D below, are the complaint information and the annual statement information.
To take advantage of the fastest, most responsive I-SITE connection, you should access I-SITE at http://i-site-state.naic.org. However, this address is only accessible from state insurance department computer systems. I-SITE can also be accessed on the World Wide Web, through the “Members” tab on the NAIC home page or directly at http://i-site.naic.org. The I-SITE information in this handbook is based on Release 11.1 (May 2004), the current version as of this writing. Step-by-step navigation instructions with illustrations are attached to this handbook as Appendix B. You will need an NAIC Oracle account and a password. If you are a regulator and do not have an account yet or do not remember your User ID and password, see your department’s information systems coordinator.
The I-SITE summary reports range from the high-level overview found in the “Aggregate Market Share and Loss Ratio” report, which compares market aggregate data for different lines of business, to company-by-company comparisons of complaint information and financial information and which can be customized by selecting one or more states, one or more lines of business and a particular time period. In particular, there are five sets of market conduct summary reports compiled from the Complaint Database System, the Examination Tracking System, the Special Activities Database and (two sets, one for firms and one for individuals) the Regulatory Information Retrieval System (enforcement actions).
A regulator can also select one or more companies or a list of companies matching particular search criteria and drill down to obtain detailed information, including direct access to the electronic annual and quarterly financial statements. In May 2003, I-SITE added the market analysis profile reports, which provide five-year reports for the select company on state-specific premium volume written, a modified financial summary profile and a complaint index report. By May 2004, there I-SITE contains a total of ten market analysis profile reports that also include reports that review Special Activities, RIRS, Complaints and other financial analysis reports. For a more comprehensive listing of the resources available on I-SITE, see the resource catalog in Appendix A. See also the discussions of particular I-SITE reports in Parts C and D below.
In the coming year, under the auspices of MAWG, the NAIC will also be developing automated programs that will generate standardized market regulatory profiles, which will include the following 5-year information for each “nationally significant” company: (1) state specific premium volume written, (2) modified financial summary profile, (3) complaints index report, (4) regulatory actions report, (5) special activities report, (6) closed complaints report, (7) exam tracking systems summary, (8) modified IRIS ratios, (9) defense costs against reserves information and (10) Schedule T information. This will be accompanied by benchmarks or checklists to identify key data. The prioritization process has not yet been finalized, but the reports will probably be rolled out beginning with the largest writers in the marketplace.
C. Use of Complaint Data in Market Analysis One of the primary missions of state insurance departments is to serve and protect the insurance consumer. To fulfill that mission, state insurance departments provide the valuable service of working with consumers and insurers to address consumer complaints. For lines of business where the department has an active complaint resolution program, such as automobile, homeowners and health, consumer complaints should be a key starting point both to identify emerging issues and to screen insurers for potential market conduct or compliance problems. Of all the types of information that departments initially collect for other purposes, consumer complaints have the most obvious relevance

9
to market conduct. The goal here is to take the information we learn when doing complaint resolution and put it to work for complaint prevention.
The efficient use of a complaint analysis system allows a department to create an effective and immediate surveillance program by detecting potential problems on both individual company and industry wide levels. This complaint information is used by the states as an early warning system to detect problems and to provide a basis for further market conduct review. However, despite the obvious correlations between consumer complaints and market conduct concerns, regulators must be careful not to jump to conclusions purely on the basis of complaint data, nor should they conclude that the absence of complaints means an absence of market problems. There are a number of reasons why an exclusive focus on consumer complaints cannot be used as a substitute for a more thorough inquiry into the company’s activities including:
1. Complaints are to some degree anecdotal and often are not documented in sufficient numbers to be fully credible statistically. Although this deficiency can be mitigated to some degree by using multistate data, inconsistencies between different state approaches raise other concerns.
2. One reason for the small sample size is that not every problem gives rise to a documented complaint. States need to gauge how informed their consumers are about how they can voice their concerns or complaints regarding insurance in your state.
3. Conversely, the customer might not always be right. The presence of a complaint points to the existence of a conflict, but not the nature or the cause. A complaint could be the result of an insurer failing to live up to its obligations or the result of a breakdown in communications, but it could also be the result of unrealistic expectations on the part of the consumer. To address this concern, “confirmed” complaints should be distinguished from other consumer complaints. The benefits and limitations of this approach are discussed further in section V of this handbook.
4. There are some lines of insurance for which there are no useful complaint records, either because the nature of the business makes it unlikely that consumers will file complaints or because the department does not have an active complaint resolution program, as is the case in many states with most or all commercial lines. For example, violations of disclosure requirements might never generate complaints because in the absence of disclosure, the consumers do not know their rights have been violated. Similar problems also arise when premiums or benefits involve complex calculations because of the nature of the product.
5. Some markets are inherently more prone to complaints than others. For example, this is likely to be true for the high-risk sector within any line of insurance and such differences must be taken into account before trying to compare the performance of different companies serving different markets. When problems appear with life insurance by contrast, they are less likely to become visible through the consumer complaint process. Similarly, complaints are more likely in lines of business where consumers have more frequent interactions with their insurer such as health or personal auto, irrespective of how serious the potential problems might be.
Nevertheless, these limitations should not be overstated. Complaint information is still the single most useful source of currently available data for market analysis. Complaints provide a great deal of information about the industry, individual insurers and real-time consumer concerns, including emerging issues in the marketplace.
Complaint information is one factor that should be considered in the selection of companies for further review and in the determination of the nature and scope of that review. Identifying companies with consistently high levels of complaint activity can be a first step towards corrective action. Once the department has determined that a problematic complaint trend is occurring, the complaint data may be helpful in resolving issues for consumers in a number of different ways. Department staff may want to

meet with the company to review adverse trends and require the company to establish a compliance plan, which may include self-audits and refunds to consumers.
Even in cases where the company turns out to have done nothing wrong, complaints serve as a compass pointing towards those issues where consumers need enhanced knowledge and awareness, allowing regulators to target efforts such as publishing brochures, speaking to schools and community groups and public service announcements in the media.
Therefore, the centerpiece of a basic market analysis program should be the development and use of reports compiling, summarizing and comparing complaint information about the companies in your market. A step-by-step outline of the process is provided in section IV of this handbook and section V includes further discussions of the issues raised and potential areas for improving and enhancing complaint analysis.
Although the focus of this handbook is on patterns and trends, it should also be kept in mind that some individual complaints by their nature will raise serious questions about an insurer’s conduct which call for follow-up even if the company’s complaint index and complaint trends are otherwise unremarkable. This underscores the need for effective communication between divisions. Insurance departments should establish criteria for their complaint analysts to use in identifying complaints which should be called to the attention of their market conduct and/or enforcement staff for further review. Inquiries from producers, consumers or health care providers about particular business practices may also warrant the attention of market regulators.
D. Use of Annual Statement Data in Market Analysis Needless to say, however, complaint analysis is only the beginning of a thorough market analysis program. Other data sources not only provide a more complete picture, but also help analysts interpret the significance of the complaint data. By far the most comprehensive source of data on the financial aspects of insurers’ activity in the marketplace is the annual (and quarterly) financial statements, which all nationally significant insurers must file with the states and with the NAIC. The statements include specific schedules and interrogatories that provide very detailed information such as premium volume, losses and changes in business. As discussed earlier, the NAIC compiles a wide variety of reports from this database and makes them available to regulators through I-SITE. Financial statement data has value for market analysis on several levels and sometimes will allow regulators to identify companies with an increased risk of future compliance problems, allowing them to respond proactively before serious problems occur.
• Most directly, financial information is meaningful to market regulators because market activity takes place through financial transactions. Although the dollars and cents, especially when aggregated at the statewide or nationwide level, do not by any means tell the whole story of a company’s underwriting, sales, rating, risk classification and claims handling practice, the underlying financial information is systematically collected and quantified in a consistent manner and suitable for use as a starting point for further analysis.
• Certain types of consumer problems tend to be accompanied by characteristic patterns in company specific or aggregate financial data.
• Indicators of financial stress should also be of concern to market analysts, because financial problems are often accompanied by market conduct problems, such as delayed claims payments and neglect of customer service. Furthermore, the failure, retrenchment or reorganization of a major market presence will have disruptive effect on the market as a whole.

11
In particular, every insurer, as part of its annual statement, files a State page in each state in which it is licensed. The financial data of greatest general interest to market analysts can be found there, with the caveat that State pages do not capture potentially significant information on geographic units within the state. For Property and Casualty insurers (which file on the yellow statement blank), this page is referred to for historical reasons as “Statutory Page 14,” although it is currently (as of the 2003 statement) located at Page 26. On the Life and Accident and Health (blue) statement, the analogous state page is commonly referred to as “Page 15” and currently located at Page 30 and on the Health (orange) statement, it is currently located at Page 35. On this page, the company reports statewide earned and written premiums, incurred and paid losses and other key information, broken down by line of business. The reporting format will vary depending on the type of annual statement the company files, as will the additional information requested. For example, the property and casualty blank includes entries for defense costs, commissions and taxes, while the health blank reports ambulatory patient encounters, hospital admissions and inpatient days.
Claims-related information is of particular relevance to market performance, so one of the key items of financial data for market analysts is claim reserves, which are itemized on the Property and Casualty blank as “Direct Losses Unpaid” and “Direct Defense and Cost Containment Expense Unpaid.”4 A spike in reserves can occur for a number of reasons, some of which might signal market conduct problems. If losses and reserves are both moving in the same direction, there is less concern. A spike in reserves without a corresponding change in losses paid should be investigated. Perhaps a major lawsuit was filed against one of the company’s insureds. It could be a correction of reserves on pending claims. The insurance regulator should investigate the reason and also check the complaints made against the insurer, trends over time and reserve activity for comparable companies in the market.
For liability insurers, significant changes in defense costs may be an indicator of market conduct problems if it shows that a disproportionate share of claims are going into litigation. This information, like changes in reserves, must be looked at in its proper context in order for it to be used effectively as a market indicator. If the increase in defense costs correlates with increases in premium volume and losses, there is less concern. An inquiry should be made when defense costs are rising disproportionately to direct losses. Although less common, similar concerns may also be raised by unusual loss adjustment expense activity in other lines of business.
The premium information enables the calculation of the company’s market share for each line of business or for the market as a whole, by dividing the company’s premium by the market aggregate. As discussed in the introduction to this section, market share information allows regulators to quickly identify the companies with the most impact on the market—bearing in mind that these companies are by no means the entire market and smaller companies and their consumers cannot be ignored. In addition, comparing market share information over time allows regulators to identify companies whose operations in the state are expanding or contracting and to inquire further into the reasons for the change and whether the company has the resources to deal effectively with rapid growth or with lost business. States should analyze at least three to five years of historical data to put the information most recently reported in its proper context; California publishes a 10-year history on its Web site for insurers doing business there.
Financial statement data also allows the calculation of “reverse market share” information—since companies report premium written by state, it is apparent how a state fits into the company’s overall
4 Although this information may also be of value when studying accident and health insurers, particularly in lines like long term disability and long term care, there is no analogous line item on the Health or Life and Health state pages. Because calendar year paid loss data aggregates layers of the losses incurred in many different years, unpaid losses cannot be backed out by comparing calendar year paid and incurred loss data.

operations, what the rest of its market looks like and how that pattern compares to other companies doing business in your state.
For property and casualty companies, market share information is readily available on I-SITE through the NAIC’s financial summary report entitled “Detail—Market Share and Loss Ratio,” which can be calculated for any line of business as reported on the annual statement blank or for any combination of up to 10 lines. This report indicates the market share by line of business, by company and also shows the each company’s incurred loss ratio (incurred losses to earned premium),5 calculated excluding all loss adjustment expenses. The loss ratio information will help identify companies with greater contact with consumers through the claims settlement process and significant deviations from the norm could indicate financial stress, if the loss ratio is too high or the potential for concerns about claims handling or underwriting practices, if the loss ratio is unusually low. It must be kept in mind, however, that what is a “normal” loss ratio, consistent with profitable operations and may vary significantly depending on the line of business and, especially for “long-tail” lines of business, on changes in general economic conditions.
For life and health companies, there is less detail available in the standard summary reports. There are four market share reports on I-SITE, entitled “Market Share—Life & Annuity”; “Market Share—Credit Life”; “Market Share—A & H”; and “Market Share—Credit A & H.” The latter two reports can be configured to combine companies filing the life and health annual statement with companies filing the property and casualty annual statement; unfortunately, at this writing these reports do not yet encompass companies filing the health organization annual statement (orange blank).
One other tool based on financial statement data should also be noted. Although the Insurance Regulatory Information System (IRIS) ratios were developed to assist solvency regulators, they also capture some information that can be useful to market analysts. Section V of this handbook includes a brief discussion of the most relevant IRIS ratios.
Editor’s Note: The I-SITE 11.0 Release in February 2004 included the release of 10 new reports especially designed for market analysis. These reports take the information from other areas within I-SITE, including the annual statements, closed consumer complaints and regulatory actions and simplify the data into comprehensive reports. This handbook displays both options of searching manually through the annual statements and then also using the newly created market analysis profile reports.
E. Issues Specific to Particular Types of Companies As we have seen in the discussion of financial information, different types of insurers engage in different activities, which makes different types of information relevant. The most pronounced differences are reflected in the distinctions between the three major annual statement formats—Property and Casualty, Health Organization and Life and Health—but there are also issues specific to particular lines of business that regulators need to take into consideration. For example:
Health Insurance: In many departments, there are consumer assistance resources dedicated specifically to health insurance. There might be more extensive complaint information and the complaint information in most states will be supplemented by external review information. At the same time, however, the relevant financial statement information will be more fragmented, because this market uniquely comprises companies filing on all three types of annual statement blank. In addition, self-insured employers that are exempt from state regulation provide a substantial proportion of health coverage and consumers are not always aware that this coverage is not insurance. Federal law (Health
5 The paid loss ratio—paid losses to written premiums—is another loss ratio measure in common usage. Each has its advantages and disadvantages. The incurred loss ratio is a more meaningful measure of profitability as long as the underlying data are accurate, but incurred loss estimates are inherently subjective. Paid loss information is precise and objective, but the paid loss and written premium reports for a given year reflect different blocks of policies.

13
Insurance Portability Availability Act (HIPAA) and Employee Retirement Income Security Act (ERISA) plays a unique role in this area of coverage and there are also significant state-to-state variations in laws regulating access to individual coverage, mandated benefits and individual and small group rating practices.
Property and Casualty Insurance: Personal lines property and casualty coverage is another key focus of consumer assistance and complaint resolution programs. A high proportion of consumer concerns in these lines relate to claims and to policy termination; often the two go together. This is a dynamic market with many emerging issues, such as the use of credit scoring in underwriting and rating. Other issues include concerns raised by consumer advocates that some companies may be using underwriting guidelines that have the effect of limiting the availability or quality of insurance to certain groups. There are significant state-to-state variations. Many of the variations in the liability insurance markets reflect variations in the underlying substantive laws giving rise to the liability exposure. This is especially true for automobile insurance, where several states have modified the traditional tort law for automobile collisions with some form of “no fault coverage.”
Life insurance: The coverage structure and company finances are notably different from other types of insurance. Proportionately, market conduct problems with life companies are more likely to arise on the sales side and less likely to arise on the claims side, than in other lines of insurance. There is significantly less interaction between the company and the consumer over the course of a customer relationship than with other lines of insurance and when market conduct problems do occur, they are often less likely to surface promptly in the form of consumer complaints.
Workers’ compensation insurance: In this line, market conduct issues may involve either the insured (the employer) or the claimant (the employee). This is true to a lesser degree for other third party coverage, particularly auto insurance in tort states, but workers’ compensation insurers in most states have statutory obligations to claimants that liability insurers do not have. The experience rating system gives the employer a more direct interest in claims practices and there are unique jurisdictional issues in states where workers’ compensation claims handling is the primary or exclusive responsibility of the workers’ compensation agency rather than the insurance department.
F. Other Useful Information While complaint records and financial statements may be the most comprehensive and concentrated sources of data on market activity, there are many additional sources that should be reviewed in order to obtain the rest of the story. For example, a high proportion of the activity in the insurance marketplace involves licensed insurance producers. Records of disciplinary actions or appointment terminations may reveal patterns of questionable practice in certain market sectors or implicating certain companies. Even routine activities, such as increases or decreases in new licenses or appointments or changes in lines of authority, can be indicative of market trends which might warrant further inquiry to evaluate whether the effects are positive, negative or mixed. The information contained in this section provides additional resources for assisting with the analysis of a company. The information about Matched Pair Testing, Rating Territories and Underwriting Guidelines within this section may be helpful if the initial baseline analysis has indicated a potential area of concern.
Financial Reporting (Public and Private Sector): Statutory annual and quarterly statements are the principal source of financial information on insurers, but they are not the only source. If the insurer is publicly traded, it will also be filing with the Securities and Exchange Commission (SEC) and there are a variety of private-sector sources that compile and evaluate financial information, such as rating agencies, statistical and ratemaking advisory organizations, trade associations, securities analysts and academic and nonprofit research institutions. Some of their data compilations are directed towards specialized information, such as claims activity, that is also of particular interest to market regulators. Surveys and reports on particular topics by research institutions, consumer groups and trade organizations may also yield valuable data.

Rating Agencies: In particular, there are five principal rating firms that measure insurance companies’ financial strength: A.M. Best Company, Weiss Ratings, Moody’s Investor Service, Fitch Ratings and Standard & Poor’s. It is common for a company’s compliance or marketing strategies to change when there is a rating decrease by one or more of these rating agencies. Market analysts should review a company’s financial rating from each of main financial rating firms to determine if there is a possible correlation between a downgraded rating and market regulatory practices. It is important to note that ratings should be reviewed independently for each rating organization. For instance, a company may receive an A rating by Standard & Poor’s or Fitch but fail to receive a B rating from Weiss. There are also variances in the areas rated by each rating firm and analysts should consider the areas of review completed by each of the rating organizations. Market analysts are encouraged to review rating changes over a period of five years for substantive changes. This does not necessarily require subscriber access, since many of the rating changes may be documented through industry and news periodicals.
Informational Filings: All insurers are subject to state licensing and holding company regulation. Under these laws, state insurance departments will receive notice of changes in corporate officers and directors, changes in the domicile of insurers in the holding company group and reports on significant transactions among an insurer and its affiliates. These changes are rarely, if ever, indicators of market conduct problems by themselves and material transactions in most cases have already been subject to regulatory review. However, when other indicators show warning signs, it is often useful to take a second look at holding company regulation statements and company licensing information such as updates of director and officer information to see if certain information that did not seem noteworthy at the time takes on a new meaning in hindsight. If your department collects or reviews them, companies’ underwriting and claims manuals may contain useful information, though it must be kept in mind that such manuals are generally regarded as proprietary and as such should be protected from public disclosure. Attention should be paid to changes in underwriting guidelines since this provides real-time information on market practices the companies themselves have identified as important.
Communication Between Work Units: As mentioned above in the discussion of complaint information, anecdotal information of various kinds can also be valuable even when it cannot be measured and reduced to numbers. The rewards of quantitative analysis can bring with them the risk of not seeing the trees for the forest. Thus, a continuous dialogue with regulators in other areas is essential since their problems may be mirrored by related problems consumers are having with the same companies or markets. For lines of business that are subject to form or rate review or certification, incidents where a company has been observed using unapproved or improperly certified rates or forms, should trigger further inquiry, since such incidents often are part of a wider pattern.
Enforcement Actions: In particular, significant enforcement actions against a licensed insurer or examination reports with findings of violations (keeping in mind that these could be from financial examinations, not just from market conduct examinations), are clearly of major interest from a market analysis perspective whether they arise in your state or in another state where the company does business. A consumer complaint or even a pending regulatory proceeding is of interest, especially on a cumulative basis, but in-and-of-itself does not necessarily mean the company has done anything wrong. But a disciplinary order or a finding of violations is a more serious matter, even though it may be based on different laws or market conditions. Likewise, a record that a company has been or is being investigated by several different states for similar reasons raises questions every bit as serious as the questions raised by a high complaint index.
RIRS: The NAIC’s Regulatory Information Retrieval System (RIRS) tracks adjudicated regulatory actions for companies, producers and agencies. The origin, reason and disposition of the regulatory action are recorded, along with additional detail, as shown in the copy of the RIRS submission form which is attached to this handbook as Appendix D. RIRS is an essential resource for market regulators and states should ensure its high quality by taking care to report all actions. It should be kept in mind,

15
however, because enforcement actions are considerably less frequent than consumer complaints, they do not lend themselves well to ratios or other quantitative techniques. For most companies in most years, the percentage of premiums paid out as fines or restitution will be zero and simply tracking the number of enforcement actions will give too much weight to minor violations such as isolated cases of late reporting.
Examination Information: Examination information may be quickly obtained on I-SITE through the ETS Summary Report, which provides a history of examinations matching specified criteria. For example, you may run a report showing all market conduct examinations called in a specified state for a specified date range. Again, the NAIC compiles summary reports and makes them available on I-SITE. Since enforcement actions may arise from other sources besides market conduct examinations, this is not a substitute for consulting RIRS.
Self Audits and “Best Practices” Reviews: Reports from voluntary examinations of companies provide another potential source of useful market analysis information at any stage of the analysis process. In addition to self-audits conducted by companies, evaluations are also prepared when insurers apply for membership or accreditation to “best practices organizations” or independent standard-setting organizations and when those organizations conduct periodic reviews.6 It must be kept in mind, however, that such evaluations are a supplement to regulatory analysis and not a substitute, and that an organization might not set comprehensive standards for “Best Practices” across the entire field of operations, focusing instead on particular areas such as marketing and advertising. Market conduct analysts and examiners should be conversant with the standards required to qualify for membership in organizations such as IMSA for life insurers and NCQA and URAC for health insurance carriers. State insurance departments should review these standards to evaluate the extent to which compliance with the standards can be considered as one relevant indicator of compliance with related state statutes and regulations to refine the market analysis. States are encouraged to direct analysts and examiners to request information associated with these organizations’ assessment activities to determine how such information might be used to gauge the appropriate nature and scope of further market conduct review that may be indicated. Some “best practices organizations” have developed standardized reporting formats (such as IMSA’s Supplemental Report) which are designed to provide market conduct analysts and examiners with a comprehensive summary of the testing and review activities that took place during the company's self audit and/or independent review process. Market conduct analysts and examiners are encouraged to become conversant with the specific review standards applicable to the independent analysis. Work papers retained by the company or its independent reviewer may provide additional useful information for market analysis purposes. Regulators must be sensitive, however, to the confidentiality concerns raised by these materials, as discussed in the NAIC white paper Regulatory Access to Insurer Information: The Issues of Confidentiality. Personnel who work with confidential material should be specifically trained in the applicable laws and in the agency’s procedures for protecting confidential or privileged information from public disclosure, whether it is maintained in paper or electronic form. In some states, self-evaluative privilege statutes provide specific guidance on the regulators’ access rights and confidentiality obligations, whereas regulators in other states must consider a variety of issues related to the protection of proprietary information, attorney work product, trade secrets, and other privileged information. Addressing these concerns and working with companies’ voluntary review activities is important because a full understanding of a company’s market activities encompasses both the company’s policies and the practices by which they are implemented—an active compliance program at a company often reflects a corporate culture that places a high value on compliance. Since “bottom-up” information on a company’s market practices is
6 Market Analysts should refer to the NAIC White Paper on Best Practice Organizations for additional guidance related to the application of such evaluations and standards.

more accessible to regulators, the “top-down” policy focus often found in insurer peer reviews can be a useful complement to the information that is otherwise available.
Consumer Dispute Resolution Processes: For some lines of insurance, statutory dispute resolution processes provide another useful source of market information. In particular, most states now have some sort of external review framework for health insurance claims disputes; regulators should review the records of external review requests, their disposition and companies’ responses over time. Similarly, records of administrative hearings on cancellations or nonrenewals of property insurance and automobile insurance policies (in states where these activities are subject to regulatory review) may shed some light on market practices in those lines of insurance.
Matched Pair Testing: For homeowners’ insurance, market conduct analysts should consider the use of matched pair testing to evaluate whether or not geographic areas with a relatively high percentage of persons in protected classes are receiving the same level of service and availability and quality of product as residents of nearby geographic areas which have different racial or ethnic characteristics. The number of matched pair tests conducted for this purpose does not need to be statistically significant, as the tests are designed to be a snapshot of the way in which a specific company is operating at a specific moment, and not an evaluation of the marketplace as a whole. In matched pair testing for homeowner’s insurance purposes, two houses of similar age, construction type and style, and maintenance level, but in different racially identifiable neighborhoods, are used as the basis for the test. Trained testers whose race matches that of each neighborhood call an agent just as a bona fide homeowner would, and identify themselves as a homeowner or buyer. They request information and quotes about homeowner’s insurance, track the responses, and fill out a report which is submitted to the person coordinating the test along with any written materials subsequently received from the insurer. That person reviews the results of both contacts and compares the treatment in each case to determine whether both callers were treated equally. (The same general concept of comparative treatment applies to auto insurance, and can be executed using testers with similar driving records calling about similar cars). While the concept is simple and straightforward, quality of execution is important, and market conduct analysts should consider contracting with an entity experienced in the conduct of insurance testing, such as the National Fair Housing Alliance (NFHA). They may also use their own staff or contract testers. Training in how to conduct such tests should be sought from NFHA or other qualified organizations.
Rating Territories: An evaluation of the way in which the market is being served for homeowner’s and auto insurance should include overlaying rating territories with census maps, to determine whether or not the rating territories have been designed in such a way that makes it likely that persons in protected classes will pay higher prices than residents of majority white or higher income areas. If that appears to be the case, information on loss data should be gathered to determine whether or not the higher costs are justified.
Miscellaneous: Anecdotal information of useful interest may even be found in such unexpected sources as your human resources division, which might have useful information since an influx of résumés from a particular company could be a sign of stress. At the same time, regulators in other areas need your input. For example, claim delays or disputes could be a symptom of financial stress and repeated consumer complaints relating to particular policy language may suggest that your department reconsider its approval of such clauses.
Other information collected by some regulators, though not necessarily available in all states, includes underwriting guidelines (as discussed above) detailed geographic market performance data, surveys of market participants and marketplace testing. Detailed geographic data—such as ZIP code data by company and type coverage—has been used by some regulators to identify underserved markets and investigate redlining allegations. Surveys of market participants—including agents, realtors and consumers—are another source of real-time market performance information. Testing—sending

17
people to purchase insurance who have similar risk characteristics but different races or other characteristics that may make them targets of unfair discrimination—adapts a tool that has long been used in the fields of housing, lending and employment to verify compliance with fair practices. In addition, a review of recent insurance-related lawsuits can provide insight into consumer perceptions of market abuses and this information is publicly available.
Needless to say, market regulators should keep their eyes and ears open outside the office as well. Valuable information can arrive in structured formats such as regulatory meetings, continuing education programs, e-mail discussion groups and clipping digests and also in less structured environments ranging from stories about lawsuits to interesting names in the news and chance remarks by acquaintances. The more you know, the better equipped you are to ask the next question.

Putting It All Together: Market Analysis _________________________________________________________________________________
As we have seen, state insurance departments already have at their disposal the information they need to develop some key baseline indicators of market conduct concerns. Now that we have the information and a market analysis infrastructure to process it, what do we do with it? This section of the handbook will provide a step-by-step outline for establishing a market analysis program, a page checklist outlining the essential elements of the basic market review and guidelines for conducting basic market analysis in three core areas: consumer complaint data, State page data and market share data.
A. Developing a Market Analysis Program Effective market regulation and consumer education requires an organized market analysis program. Departments seeking to establish a new program or upgrade an existing program should take the following steps:
Step 1 – Appoint a Market Analysis Coordinator: Unlike financial information, market conduct information can come into the department at different times to different staff persons or functions and for a variety of reasons. For example, statutory page 14 information is submitted with the annual statement in March. Holding company and licensing changes are reported as they occur. Consumer complaints can flow in all the time, while complaint ratios are generally calculated at specific times. Each insurance department needs a clearly identified person to whom all other department staff should report indicators of market conduct problems and who will also coordinate information sharing with other departments through the NAIC’s Market Analysis Working Group and oversee the department’s baseline analysis. Organizing these processes is a crucial administrative function. How the market analysis function will be organized within the department will depend on the size of the department and its broader organizational framework, but it is essential to have some method of clearly delineating market analysis responsibilities. It is essential, of course, to have open lines of communication among all areas of the department, running in both directions. Staff personnel responsible for market analysis must have access to the information they need, but must also be able to share their knowledge with other areas as needed, particularly for the reasons discussed in section III of this handbook with consumer relations and financial staff.
Step 2– Establish a systematic procedure for interdivisional communication: Market conduct problems do not occur in a vacuum. Complaint activity, legal issues, financial concerns or irregularities in rate and form filings often accompany them. At the same time, market conduct problems may be an early warning sign of other problems with a company, so it is essential for information to be shared and discussed between the market analysis coordinator and other department staff. This should be done on a systematic basis, including at a minimum a quarterly questionnaire requesting other work areas within the department to report unusual activity that may be of interest to the market analysis coordinator such as patterns of adverse financial data, consumer complaints, policy termination activity, producer misconduct or use of noncompliant forms or rates.
Step 3 – Identify Warning Signs that All Staff Should Share with the Market Analysis Coordinator: In particular, all department staff should report any of these indicators to the market analysis coordinator when the information is received in the department (e.g., annual statements, holding company reports, license transactions):
1. Significant changes in the ratio of consumer complaints against the insurer or significant numbers of complaints in a relatively short period of time;
2. Dramatic growth (> +33%) or decline (< -10%) in one or more lines of business;

19
3. Significant changes in the company’s book of business;
4. Rapid expansion into new states and significant premium volume in new states;
5. Significant concentrations of risk—geographically, by line of business or exposure—or significant changes in the concentrations of risk;
6. Significant changes in expense levels (such as defense costs or commissions);
7. Recent change of the state of domicile of a major writer in an insurer group;
8. Recent changes in ownership or senior management;
9. A high degree of reliance on third parties to perform company functions, such as MGAs or TPAs; and
10. Significant problems with electronic data processing systems such that the integrity of data underlying claims, underwriting and financial systems is questionable.
Note: The presence of one or more of the above does not necessarily indicate that a problem exists, but rather that further analysis or investigation may be warranted.
Step 4 – Develop and Instruct Complaint Analysts in Key Indicators in Complaint Data: Complaint analysts in the insurance department should report the following types of information to the market analysis coordinator at the time the department receives this information:
• Specific complaints so critical that one complaint merits reporting (e.g., antitrust);
• Spikes in complaints against the same company on the same product/practice during a specific time interval (e.g., 10 new complaints in a week); and
• Any of the other indicators listed above in Step 3.
Step 5 – Identify Potential Problems from Complaint Ratios: Complaint ratios should be calculated annually at a regular time and the market analysis coordinator should use information generated on insurers with ratios outside of the norms, along with other information about those companies available in the department, to determine whether any further review is necessary. Through the use of complaint ratios, regulators are able to properly gauge not only long term trends, but more importantly, to monitor frequent problems or developing areas of concern so as to determine whether an inquiry should be generated or if prompt regulatory action is required. After compiling the complaint ratios for the individual insurers, the department can compare these ratios to determine which companies lie outside the average in a given year and to compare an individual insurer’s ratio with the previous year. For example, an increase in the number of complaints can indicate a change in claims practice.
Step 6 – Annual Statement State page and Other Financial Indicators Should Routinely Be Shared with the Market Analysis Coordinator: Every insurer—foreign as well as domestic—is required to file a State page with each state in which it is licensed, to show changes in the company’s business in the state. In most insurance departments, a significant amount of staff resources at that time are devoted to review and analysis of the financial statements. While such financial analysis should be primary, at some point after the Blanks are received, the market analysis coordinator should be routinely advised of:
• Significant increases or decreases in premium volume;
• Significant increases in reserves without corresponding changes in direct losses paid;
• Significant changes in loss ratio or significant deviations from market norms; and
• Significant increases in defense costs without corresponding changes in direct losses. (for liability insurers)

Step 7 – Establish a Baseline Market Analysis Program on a Coordinated Schedule: States should conduct the baseline analysis, which, is outlined below and summarized in the checklist at the beginning of this handbook. All states should analyze the various data elements and indicators within the same general timeframe, so that if one or more of the states has an issue with a particular company, then they can discuss it first within the framework of MAWG before any one state strikes out on its own. Results should be compiled and reviewed on a quarterly schedule. For example, a state should complete a complaint ratio on last year’s complaint data during the second quarter of the following year (April–June). In this way, the MAWG meeting in June could be used to discuss each state’s second-quarter results and whether there is any need to follow up with problematic companies on a coordinated basis.
Step 8 – Coordinate Results with the NAIC Market Analysis Working Group: In addition to reporting plans for examinations and investigations, all noteworthy market analysis results should be communicated to MAWG, whether or not current regulatory action has been triggered, to enable meaningful evaluation of state market analysis efforts and to ensure that meaningful big-picture market analysis can be conducted and patterns or trends which cross state lines can be identified. Concerns with nationally significant companies should be specifically noted when reporting to MAWG and issues that appear to focus on a small number of other states should be brought to those states’ attention.
B. Identifying Markets and Companies for Baseline Analysis The department’s periodic baseline review should begin by identifying which lines of business will be surveyed. These should include all of the major lines: group health (including HMOs), individual health (including HMOs), homeowners, personal auto and individual life (including annuities). This list should be supplemented as resources permit, with highest priority given to any other lines identified as being of significant consumer or regulatory concern in your state. These may include, for example, medical malpractice, credit life and health, workers’ compensation, disability or long term care.
Once the lines of business have been selected, the next step is to identify companies with any appreciable market activity in each of these lines—at a minimum, those with either one percent or greater market share, $100,000 or more in premium or five or more complaints. The relevant market share information should be readily available in the insurance department or from the NAIC. If it is not currently maintained in the department in a useful form conducive to market analysis, the department should update its data management procedures. This screening process does not mean that you should neglect market conduct problems with companies that have negligible activity in your state, only that the numerical indicators (quantitative analysis) are unlikely to be meaningful in cases where, for example, a single complaint can move the company from the top of the complaint index chart to the bottom. Therefore, problems with such companies, if they arise, can usually only be identified through other case-by-case (qualitative) methods such as incident reports and MAWG referrals.
Additional Uses for Market Share Information
While an insurer’s market share is not an indicator of its market conduct, state regulators need information on changes and trends in the composition of the state marketplace in order to have a meaningful picture of market activity. In addition to its use in the initial screening process, market share data has three principal uses in market analysis:
• Providing a lineup of the current market participants and their relative impact;
• Identifying changes and trends in market participation; and
• Evaluating the degree of competition in the marketplace.
To put this information in its proper context, it is necessary to view it from a historical perspective. For example, in looking at current increases in premium volume from State page data, one may see a different picture if at least three to five years of historical data are used as the overlay for the review of

21
current data. For example, does historical state data show an increase or decrease in concentration of insurers writing a particular line of business in the state? Which companies have undergone a significant change in their market position?
States implementing the baseline market analysis in the handbook for the first time may well not have the benefit of market share data initially. In implementing a historical review approach, states need to give consideration to what historical data they want to track and in what format. For example, on its Web site, California publishes a 10-year aggregate history for each annual statement line of business: the number of licensed companies writing the lines; total premiums written; total earned premiums; total losses incurred; and the annual loss ratio for the line. These reports can be found at http://www.insurance.ca.gov/docs/FS-MarketShare.htm. Another example is Missouri, whose reports, published at http://insurance.mo.gov/ Select the link for Reports and then the Market Share link and the Market Share Report will display. This report is discussed in more detail below in section V of this handbook.
Finally, market share information can be used to evaluate the degree of competition in a market sector. For example, the NAIC has a Commercial Lines Competition Database and publishes an annual survey for 10 commercial lines: Commercial Auto Liability, Commercial Auto Physical Damage, Commercial Auto Total, Commercial Multiple Peril, Fire, Allied Lines, Inland Marine, Medical Malpractice, Other Liability and Workers’ Compensation. In each state, for each of the 10 lines and for the aggregate statewide market, the report shows the total premiums written, the combined market share of the four largest groups, the Herfindahl-Hirschman Index for the market (the HHI is a formula used to measure market concentration which is widely used in antitrust analysis), the number of groups participating in the market, the numbers of entries and exits during the last five years, the market growth in the last three years and last 10 years, the residual market share in the past year and averaged over the past five years, the surplus lines market share in the past year and averaged over the past five years and the 10-year mean return on net worth.
C. How to Analyze Consumer Complaint Data In order to conduct a systematic and focused analysis, it is necessary to develop meaningful numerical indicators which will allow regulators to make comparisons between companies and track the activities over time of each company and of market averages. Outliers—companies whose complaint activity significantly exceed industry norms, historical conditions or established best practice guidelines—can be singled out for individualized attention.7
The total number and frequency of complaints should be used as the basic indicator. Departments should also look at numbers of complaints by line of business so that potential problems in one area are not lost in total numbers and that reasonable comparisons are made between insurers selling like kinds of policies. Complaints should also be reviewed by company and not merely by insurer group, as companies in the same holding company group may write different types of business and, even when they write the same type of business, they may represent different market tiers and different approaches to consumer relations. Finally, an insurer’s complaint numbers should be compared to their overall premium volume, and also, where appropriate, to the number of policies or policyholders.
7 Of course, the identification of a company as an outlier may be the result of factors entirely unrelated to the company’s actual performance in the market. For example, a recent report identified one company as having a complaint index of 2,189,763.36730 – that is, a complaint frequency more than two million times higher than “expected,” based on the company’s premium volume. However, this statistic was based on $1 in reported premium and a single consumer complaint.

Basic Complaint Ratio Analysis
Having selected the relevant markets and companies in accordance with the procedures outlined above, each state should then, at a minimum, conduct a basic complaint ratio analysis on the selected companies:
• Identify “confirmed” complaints
• Calculate “complaint indices:” complaint ratios relative to market average
1. “Confirmed” complaints: Although total complaints are useful for many purposes, the baseline complaint index should be based on confirmed complaints, both because these are a more meaningful indicator of company specific shortcomings and because this enables consistent comparisons from state to state and between states and the NAIC’s Consumer Information Source (CIS).
States should be tracking their complaints in a format consistent with the NAIC’s Complaint Database System (CDS) format and reporting them to the CDS. This provides a consistent definition of “confirmed complaint”—a complaint that was not resolved within any of the following CDS disposition codes:
• 1223: Unable to Assist (“The state lacked the necessary power, authority or means to resolve the complaint.”)
• 1227: Cancellation Upheld (“The annulment or invalidation of a policy was within state guidelines.”)
• 1228: Nonrenewal Upheld (“The insurer’s election not to renew a policy was within state guidelines.”)
• 1235: No Action Requested/Required (“Handling was satisfactory.”)
• 1240: Referred to Proper Agency (“Due to the subject of the complaint, the resolution required referral to another agency or section.”)
• 1293: Company In Compliance (“The company’s tendencies complied with the state insurance regulations.”)
• 1295: Company Position Upheld (“The party complained against had a valid basis for not yielding to the complainant’s request, demand or claim, whether the State Department of Insurance agrees or disagrees.”)
• 1300: No Jurisdiction (“The State Department of Insurance lacked statutory authority to resolve the complaint.”)
• 1305: Insufficient Information (“No evidence to substantiate complaint was provided to the State. The correspondent failed to provide the information or documentation requested which is required for determining appropriate action.”)
2. Complaint ratios: A company’s complaint ratio is defined as:
(number of confirmed complaints) (gross premium written [in thousands of dollars])
It is important, of course, that these figures be comparable—for the same line of business, for the same period of time and for the same state or geographic region. Gross premium is used, rather than net premium, because what is important is the company’s level of activity in the market in question. The use of complaints per $1000 is recommended for consistency with other states and because the

23
numbers that result are easier to follow and to work with than the complaint ratios per $1 with all the leading zeros left in.
Example: Consider three hypothetical companies. Insurer A wrote $50 million in annual premium volume in an individual state, while Insurer B wrote $10 million and Insurer C wrote $1 million. Insurer A had 500 confirmed complaints in your state last year, Insurer B had 150 confirmed complaints and Insurer C had 10 confirmed complaints. Their ratios of complaints per $1000 of premium are:
Insurer A 500 complaints/$50 million in premium 500/50000 = 0.010 Insurer B 150 complaints/$10 million in premium: 150/10000 = 0.015 Insurer C 20 complaints/$1 million in premium: 20/1000 = 0.020
3. Complaint indices: It is important to distinguish between the complaint ratio and the complaint index—a company’s complaint ratio is based entirely on company specific information, while a company’s complaint index measures the performance relative to other companies in the same market. The purpose of the complaint index is to make the complaint information more meaningful by expressing it in comparative terms. As discussed above, it is also important to use an appropriate basis of comparison, which generally means companies in the same line of business.
The complaint index is defined as:
(complaint ratio for the company) (complaint ratio for the aggregate market)
Thus, a company with a complaint index of 2.35 has a complaint ratio that is more than twice as high as the market average, while a company with a complaint index of 0.48 has a complaint ratio slightly less than half the average. Some states multiply this complaint index by 100 to express it as a percentage, in which case the above indices would be 235 and 48 respectively. However, this is not recommended because it can be confusing to try to compare figures based on different scales. When looking at complaint indices published by other sources, it is essential to be aware whether your source uses 1 or 100 to describe the performance of the “average company.”
When calculating a complaint index, the complaint ratio for the aggregate market is calculated in the same manner as for individual companies—divide the aggregate number of confirmed complaints for all companies (in the relevant time period, state(s) and line(s) of business) by the comparable aggregate premium volume.
It should be noted that the formula above is mathematically equivalent to defining the complaint index as:
(company’s complaint share) (company’s market share)
The “complaint share” is defined in the same manner as a company’s market share, by dividing the company’s complaints by the aggregate number of complaints in the relevant market.8 This is the
8 This formula demonstrates why the complaint index will be the same whether the original complaint ratios are expressed in terms of complaints per dollar, complaints per thousand dollars or complaints per million dollars.

format in which the NAIC CDS compilations are presented on I-SITE.9 When doing the actual numerical calculations, in order to minimize roundoff error, the relevant data should be input directly, so that the complaint ratio is calculated as:
(number of complaints against company) × (market aggregate written premium) (market aggregate complaints) × (company written premium)
Note that a “typical” complaint ratio will depend on the line of business involved and on a number of other factors, including prices in the relevant market at the relevant time. By contrast, the average complaint index will always be 1.00, regardless of the scale used for the underlying complaint ratios.
Example: Supposing for simplicity that Insurers A, B and C from the previous example represented the entire market for that line of insurance in the state, the aggregate complaint ratio for the entire market (rounded to two significant figures) would then be:
670 confirmed complaints/$61 million in premium:670/61000 = 0.011
This corresponds to complaint indices for the three insurers (rounded to two decimal places)10 of:
Insurer A: 0.010/0.011: 0.91
Insurer B: 0.015/0.011: 1.3711
Insurer C: 0.020/0.011: 1.82
Complaint indices may be calculated relative to both state and national markets and perhaps also for a multistate region, giving the department both a local and a global view of potential consumer issues. The CDS, as discussed in more detail below, provides complaint index reports for 10 different lines of insurance: by state, nationally, by NAIC zone or for any selected list of states.
Although the complaint index is one of the most valuable tools for evaluating market performance, regulators do need to keep in mind its limitations which include:
• Although complaint indices should be calculated by line of business if possible, their accuracy depends on the availability (and the use) of accurate confirmed complaint counts by line of business. Complaint ratios and complaint indices draw a misleading picture if the complaint count and the gross premium figure are based on different sets of policies.
• Premium volume may not be the best measure of market activity in many lines of business, particularly annuities and life insurance. As discussed at more length in section V of this handbook, states should give strong consideration to supplementing their basic complaint analysis with an alternative complaint index calculation based on policy count, when that information is readily available. For life insurers, the number of policies and group certificates in force is reported on the State page, itemized by the type of coverage.
9 However, at this writing, those reports are based on raw complaint data, not confirmed complaints. The NAIC is developing a report framework based on confirmed complaints.
10 Additional precision, although readily available, is inappropriate because it would not reflect any meaningful distinction between companies. Indeed, even the two-decimal-place calculation will generally overstate the significance of the underlying data.
11 The careful reader might note that the approximation 15/11 actually rounds to 1.36. See supra note 10.

25
• Complaint indices can be misleading for companies with small market presence. In particular, it is not appropriate for published tables or rankings to include (at least without a conspicuous disclaimer) companies whose complaint indices would be significantly different with one or two more or fewer confirmed complaints.12
• Using more states and/or more years provides a larger sample size, but this will only give more accurate results if the information from other states or earlier years is comparable. Inaccuracies may result from changes in company behavior over time, different company practices or market conditions in other states or inconsistencies in the ways different states gather or report complaint data. For example, all other things being equal, if the average policy in your state is half as expensive as in a neighboring state, then complaint ratios, calculated by premium volume, will be twice as high in your state as the same level of complaint activity would generate in the neighboring state.
• The NAIC CDS Summary Complaint Index Report can be presented using complaint information from one year and premium information from a different year, allowing multiple complaint years to be compared to a common baseline. This corrects for the effects of general economic conditions such as inflation on premium growth, but will create other distortions when premium volume changes for other reasons.
Reports from the NAIC Complaint Database System (CDS)
Complaint index reports are among the most important market analysis resources that the NAIC makes available to the states on I-SITE. These reports are compiled from the NAIC’s Complaint Database System (CDS), which collects complaint information from participating states in standardized form, as laid out in the copy of the CDS submission form which is attached to this handbook as Appendix C. The CDS also assists the states in complying with the provisions of the Omnibus Budget Reconciliation Act of 1990 (OBRA) requiring states to report Medicare Supplement complaint information to the Centers for Medicare & Medicaid Services (CMS, formerly known as HCFA). The NAIC submits quarterly reports to CMS on behalf of all states that submit data to the CDS. The remaining states are required to comply with the OBRA requirements on their own.
The following standard CDS reports are available on I-SITE. In addition, states are able to run ad hoc queries against the database using their own spreadsheet software packages:
• CDS Summary Index Report – these complaint index reports (calculated with respect to written premium volume) are available for years beginning in 1997 for 10 lines of business: Private Passenger, Homeowner, All Property, Individual Life, Group Life, Individual Accident and Health, Group Accident and Health, Credit, Long Term Care and Medicare Supplement. They can be calculated for a single state (or territory), selected states, an NAIC zone or nationwide and a second state or region can be selected for comparison purposes. The report lists companies by name and NAIC code and for each company displays its complaint count, premium volume, complaint share, market share and complaint index.
• CDS Summary Closed Complaint Counts by Code – this report displays a list of all the complaints and the number of complaints, based on a variety of criteria. These reports allow regulators to see what types of complaints are most prevalent.
12 A company which returned more premium than it wrote will actually appear in computer-generated tables with a negative complaint ratio, which on its face is absurd and should be seen as a clear indication that the company had too little activity in that market to generate a credible report. On the other hand, if several complaints were filed against such a company, regulatory followup is clearly warranted.

• CDS Summary Closed Complaint Counts by State – this report displays a list of all the NAIC member jurisdictions and the number of complaints received from each jurisdiction, based on a variety of criteria. This report can only be viewed on a nationwide basis.
• CDS Summary Closed Complaint Trend Report – this report displays the number of complaints and the percent of change on both a monthly basis and an annual basis for a predetermined date range. A three-year period is shown on a month-by-month basis, beginning with the previous calendar month. A six-year period is shown on the year-by-year breakdown.
• CDS Closed Complaint Filing Status – this report lists, by state, the number of closed complaints entered in CDS, the earliest recorded closed date and the most recent recorded closed date.
The NAIC also publishes complaint index information for the general public through its Consumer Information Source (CIS). These reports calculate complaint indices on a nationwide basis, based only on confirmed complaints (i.e., complaints with CDS disposition codes such as “Company Position Upheld” and “No Jurisdiction” are not used) and rebalanced so that a score of 1.00 represents the median company for a particular line of business13—half the companies in that line of business had better complaint ratios for that year, while the other half had worse—rather than the mean complaint ratio overall. To illustrate the difference, the median complaint index for group health insurers in 2002 was 1.28. This indicates that most companies in this line of business had complaint indices noticeably greater than 1.00—mathematically, the most likely explanation for such a result is that those companies with high complaint indices tended to be smaller companies (or companies for which group health was not a major line of business), while the larger group health writers tended, on average, to have fewer complaints relative to premium volume.14 This brings down the average, so that a company could have a better complaint record than most of its competitors but still have a complaint index of 1.1. Therefore, the CIS would report such a company’s complaint score as 1.1/1.28 = 0.86, highlighting its performance relative to other companies rather than its proportionate share of the nationwide complaint total.15
D. How to Analyze State Page Data Insurers file State pages in each state in which they are licensed, as part of the annual statement, which is available in electronic form from the NAIC and which is also filed in print form with the insurance departments. The company reports the following information by line of business for the state:
• Property-Casualty (yellow) (“Statutory Page 14”, currently located at page 26): premiums written and earned; losses paid, incurred and unpaid (reserves); defense costs paid, incurred and unpaid; dividends; unearned premium reserves; taxes and fees; and commissions.
13 The CIS report refers to the rebalanced complaint index as a “complaint ratio,” but that is different from the way that term is used in this Guide.
14 Another possibility would be a bimodal (“camel hump”) distribution curve in which there are really two distinct market sectors being compared here, the larger of which (on average) has measurably higher complaint ratios.
15 The underlying question is which figure can most fairly be called “normal” market behavior. The use of the median is based on the premise that the market wide complaint ratio (i.e., the mean complaint ratio) is disproportionately influenced by the behavior of a few large companies. Conversely, however, it can be argued that the median complaint ratio is disproportionately influenced by very small companies whose behavior affects relatively few consumers.

27
• Life-Health (blue) (“Page 15”, currently located at page 30): detailed information on premiums (and annuity considerations); benefits; dividends; benefits paid and incurred; and policies (and annuity contracts) in force.
• Health (orange) (currently located at page 35): premiums collected and earned; claims paid and incurred; membership by calendar quarter; current year member-months; ambulatory encounters (itemized between physician and non-physician); hospital patient days; and inpatient admissions.
This state-specific information can be used to track the company’s movement in the state and changes in key class of company operations from year to year. As discussed above in Part A (“Step 6”), there are four key State page indicators that should be used to screen insurers for market analysis purposes: premium volume, changes in reserves (relative to losses), loss ratio and defense costs.
The market analysis unit in every insurance department should obtain this information annually, to the extent applicable to the insurer’s lines of business, for every insurer that is subject to baseline review. The market analysis coordinator should ensure that this information is available as soon as possible after the annual statement is filed each March so that the necessary market analysis can proceed in tandem with the company’s financial analysis.
1. Review data for significant change in premium volume: The list of licensed companies and changes in premium volume needs to be examined to find the companies with significant fluctuations in premium volume since the prior year. The initial analysis of premium volume should aim at focusing state resources on companies with the most significant changes. Every insurer’s premium volume changes every year, so the analyst should be looking for dramatic growth (33 percent or more) or decline (10 percent or more) in one or more lines of business in the state. Since most changes are increases, the normal range for increases is broader than the normal range for decreases.16 Schedule T, on all three types of statement blanks, provides a state-by-state breakdown of premium activity and it may be useful to check this schedule to compare activity in other states and identify regional or national trends.
Market analysis of the state page data when it is filed in March provides a good opportunity to double-check whether all state insurance department staff are aware of and are alerting the department’s market analysis coordinator of the “Step 3” warning signs in Part A above, since the March annual statement filings should rarely be the first notice that the department receives if an insurer has had significant premium fluctuations or other unusual financial results in the prior year. Usually, some preliminary indication was already present in the quarterly reports or some other source of current information.
When an insurer with unusual premium activity has been identified, the next step is to determine the cause of the increase or decrease:
• Does the change correlate with complaints filed against the insurer?
• How many rate, rule and form filings has the company made? Does the number, compared to the change in the company’s writings, suggest that the company is using a rate structure that is not filed or not approved, if required for that line of business?
• Is the increase in premium volume due largely to an increase in the number of risks assumed or due largely to rate increases?17
16 It should also be noted that when a company is one of the dominant insurers in the market, there is less room to grow in the normal course of business, so a lower threshold for “significant” premium growth should be considered for those companies.
17 In lines where rates are not filed, this will be more difficult to ascertain.

• If there are significant rate increases, do they reflect trends in the overall market or is the company an outlier?
• If the company’s writings have changed, have the numbers of agents changed accordingly?
• How many agent appointments and terminations has the company made?
• For what lines are they licensed?
• If the company’s writings have changed, have the number of adjusters changed? (If relevant to the line of business in question and your state requires a license for adjusters or this information is otherwise available.)
Did the premium volume increase primarily because of large rate increases? If this appears to be the case, then the market analyst needs to work with other department staff to determine whether there is a potential market conduct problem that would warrant further follow-up with the insurer. Even premium decreases may signal market conduct problems—decreases often reflect increased competition in the market place and some companies may respond to the pressure by cutting services or by aggressive claims practices.
If the significant change in premium volume is due to expansion and new business, then the market analyst needs to work with others in the department who can provide assistance in determining the following:
• How much experience does the company have in the line in which there is a significant increase?
• Does the company have the resources to deal effectively with rapid growth? (Or with lost business, in the case of a decrease in volume?)
• Is the company relying extensively on managing general agents and/or fronting arrangements?
• Have there been any recent management changes in the company?
• Has the company entered a new line of business?
• Is it a new licensee in the state?
• Has it made a quick entrance and exit from the state? If so, why?
Recall that rapid expansion into new states, coupled with significant premium volume in the new states, is one of the “Step 3” indicators of material change in market position, as is significant changes in a company’s book of business.
To complete the analysis in this area, the analyst should look at the insurer’s complaint data to determine if the changes in the company have been the source of complaints filed against the insurer and whether those were confirmed complaints.
2. Review data for changes in reserves: The Statutory Page 14 data must also be reviewed to focus on the companies that have had a recent spike in reserves. Once such a company is identified, the market analyst must determine the reason for change.
The basic analysis should compare changes in losses and changes in reserves. If both are moving in the same direction at a similar rate, this is less likely to indicate a market conduct issue; if there is a problem, it is more likely financial. When the market analyst finds that a spike in reserves occurs without a corresponding increase in losses paid, however, the market analyst should work with the financial analysis unit to determine the cause. It may well be that a major lawsuit was filed against the
29
insurer at year’s end. If so, what is the nature of that lawsuit—does it relate to the company’s marketplace behavior? Or was the spike simply due to a correction of reserves on pending claims? If so, this is likely a financial matter and not necessarily an indication of a market conduct problem.
It should be noted, however, that adverse loss experience may trigger changes in a company’s claims practices. Again, this would be a good time to cross-check complaints filed against the insurer.
3. Review loss ratio data: Incurred loss ratios (incurred losses as a percentage of earned premium) are readily available for property and casualty insurers on I-SITE using the financial summary report entitled “Detail—Market Share and Loss Ratio.” There is no one-size-fits-all numerical guideline that can be applied, since “normal” loss ratios can vary significantly not only between lines of business but also from year to year within the same line of business. Instead, analysts should identify companies with loss ratios that are significantly higher or lower than those of comparable companies and also companies with unusual trends or year-to-year variations. Companies with unusually high loss ratios compared to their competitors might be financially stressed. Conversely, if the loss ratio is unusually low, regulators should verify that this is the result of successful business operations and not irregularities in reporting or in underwriting or claims practices.
Variations affecting an entire line of business rather than particular companies may reflect the impact of a specific catastrophic event or the effects of the business cycle. Although these types of variations cannot be used to identify specific problem companies, regulators do need to be aware when a market is experiencing extreme “hard market” or “soft market” conditions, since either extreme can have an adverse impact on consumers.
4. Review data on defense costs: For casualty insurers, Statutory Page 14 data needs to be reviewed to identify insurers with significant changes in defense costs. Recall that significant changes in expenses have been identified as one of the primary “Step 3” indicators of potential problems and defense costs should be a particular focus for market analysis purposes. Once the companies with significant changes in their defense costs from the previous year have been identified from their Page 14 data, the market analyst should determine the cause for this change. Changes in defense costs can be an indicator of problems if a disproportionate share of claims is going into litigation. If defense costs are rising relative to increases in premium volume and losses, the change in defense costs does not itself indicate potential market conduct problems, but follow-up with the company is called for when defense costs are rising disproportionately to direct losses. This should include a cross-check on consumer complaints, particularly complaints about claims practices.
E. Coordination with the Market Analysis Working Group Once concerns are identified with particular companies, based on either a systematic quantitative analysis of baseline data or a qualitative inquiry triggered by particular issues or events, it is essential to conduct further review and follow up with the company as appropriate. As discussed in more detail in section VI of this handbook, the appropriate regulatory response could be a determination that no actual problem exists, an enforcement action or a wide range of intermediate measures.
As outlined in “Step 8” in section A, the results of both the baseline market analysis and any follow-up activities should also be shared with MAWG and MAWG should also be consulted regularly to ascertain whether they are aware of any issues affecting your domestic insurers or the market in your state. Similarly, regulators in other states should be consulted when there are significant issues at a regional level or with a particular impact on one or more specific states.
The reason for sharing market analysis results with MAWG is twofold. First, MAWG is the forum for coordinating state market analysis programs and for evaluating the effectiveness of market analysis on an ongoing basis. And second, MAWG is the forum for identifying and addressing issues of multistate concern. In particular, therefore, MAWG should be kept apprised of any concerns your state has identified with nationally significant insurers. A property/casualty insurer is considered “nationally

significant” if, during any of the past three years, it has either (i) been licensed or written business in at least 17 states and had gross premium written of at least $30 million; or (ii) been licensed or written business in at least five states and had gross premium written of at least $50 million. A life/health insurer is considered “nationally significant” if, during any of the past three years, it has been licensed or written business in at least five states and had written or assumed at least $50 million in gross premium.
MAWG has developed the following Procedures for Coordination of State Collaborative Efforts when a nationally significant insurer has been identified as exhibiting characteristics that might indicate current or potential future market regulatory issues that impact multiple jurisdictions.
MAWG will send a formal letter of correspondence to the state of domicile for each specific insurer for which a significant concern that impacts multiple jurisdictions is identified. For issues of less significance, a phone call will be made by NAIC staff requesting that the domestic state report to MAWG on the issue. MAWG will determine the method of communication used in each instance. A response time of 30 calendar days is given to the state of domicile to address the issues of concern outlined in the letter. At a minimum, the domestic state’s response should disclose the following:
• The state is aware of the nature and extent of the problem enumerated;
• The state concurs with the working group’s identified issues of concern or provides specific information to rebut or redefine the issues of concern;
• The state is monitoring the situation;
• The state or the company has a corrective plan of action for all states impacted by the issue;
• The state is monitoring the corrective plan of action; and
• The state has effectively communicated concerns and any regulatory actions to other states that might be at risk.
If MAWG concludes that the response has open issues remaining, a request may be made to the state of domicile to make a written and oral presentation to MAWG at one of its meetings during NAIC national meetings. A formal collaborative regulatory action may be initiated subsequent to this presentation. All such collaborative actions should adhere to the following guidelines:
• A company’s domestic regulator, in collaboration with additional lead states, will assume the lead for the collaborative regulatory effort or delegate that responsibility to an appropriate alternative primary state;
• The domestic regulator will identify additional states to help lead the regulatory effort and provide a presentation to MAWG outlining the general scope of the regulatory effort prior to the initiation of the effort;
• Selection criteria for the other lead states should include the following: (1) a domestic state for a company within a group being examined and (2) a state in which the company has a significant premium volume;
• The domestic regulator, in collaboration with the other lead states of the regulatory effort, will request all states to participate in the regulatory effort;
• Participating states shall agree to accept the findings of the collaborative regulatory effort and to forego examining the identified company unless the state has specific reason that requires a separate regulatory effort to be initiated;
31
• All participating states will have access to confidential and privileged information as long as they have signed the NAIC’s Information Sharing and Confidentiality Agreement;
• The domestic regulator, in collaboration with the other lead states, will provide periodic written and oral updates about the regulatory effort under a timeframe mutually agreed upon by the domestic regulator and MAWG;
• The domestic regulator, in collaboration with the other lead states, will provide a written and oral presentation to MAWG summarizing the examination findings and proposed settlement prior to the formal issuance of any regulatory report to the company;
• After 20 calendar days for advisory comment by MAWG, the domestic regulator, who will retain final authority over the examination findings and settlement in collaboration with the other lead states, will consider these comments and present the final examination report and proposed settlement to the company; and
• The domestic regulator, in collaboration with the other lead states, will communicate additional changes to the examination report and proposed settlement to MAWG.

Enhancing State Market Analysis _________________________________________________________________________________
As states proceed with implementing market analysis programs and evaluating their effectiveness, the next phase is to figure out how these programs can be improved, both internally and through enhanced coordination with other states. A wide range of enhancements can be considered; depending on which goals the department sees as its most immediate priorities. There are many directions in which states can look and then share their insights with other states that have followed different paths, such as:
• Improving the quality of the techniques already in use;
• Adding a new range of issues to consider;
• Coordinating better with other states;
• More efficiently focusing on just the problem companies or markets;
• Monitoring more companies;
• Improving the follow-up after companies are identified; and
Below are some examples of possible approaches.
A. Improving Consumer Complaint Analysis Over the last two decades, the NAIC has analyzed the insurance consumer complaint process and the value that process affords regulators in understanding the insurance marketplace in each state. In 2000, the NAIC adopted a white paper outlining best practices for handling consumer complaints, recognizing the need to maintain uniform complaint information and the critical value of accurate complaint information to insurance consumers as well as to regulators. All market analysts and coordinators should review this white paper.
As we have seen in section III, the national Complaint Database System is one of the key resources for market analysts, but it can only be as good as the information it receives from participating states. Meaningful comparison of complaint data from state to state requires nationwide uniformity in state insurance departments’ treatment of complaints. If an insurance department fails to code complaints properly or if departments use conflicting coding systems, other states will receive an inaccurate picture of general business practices, emerging issues and market changes. In particular, the distinction between “complaints” and “inquiries” must be drawn in a consistent manner. States that call on insurers to self-report complaints and other consumer actions should be particularly vigilant in this regard, to ensure that companies that give themselves the benefit of the doubt do not have an unfair advantage over companies that bend over backwards to provide full disclosure.
Having uniform definitions and standards applicable in all states results in an accurate exchange of information, allows for the systematic analysis of that information, allows complaint information to be used effectively in the market surveillance process and allows accurate complaint summaries to be compiled for public distribution. As noted in section IV, so readers do not have to switch gears unnecessarily, there is value in standardization even for nonsubstantive formatting conventions such as whether complaint indices are expressed as percentages, with 100 as the norm or as ratios, with 1.00 as the norm.
1. Key Elements of Best Practices The basic goals of complaint analysis are to obtain (1) a complaint ratio to evaluate the relative activity of each insurer in the marketplace; and (2) further data analysis to be conducted by each state as to emerging marketplace issues and activities of individual insurers or of the industry at large.

33
To that end, each state insurance department needs to adopt, in conjunction with the other states, a uniform system for measuring consumer complaints and complaint ratios for each company by state. This should begin with a uniform definition of a “complaint” (as distinguished from an inquiry) as recommended in the NAIC’s Consumer Complaint White Paper:
A complaint is an expression of dissatisfaction.18
States should not track only those expressions of dissatisfaction that are received in writing, but should also monitor and report complaints received by fax, through electronic transmissions, by phone or in person. Written complaints (on paper or electronic) should be signed in some manner that identifies the complainant and oral complaints should eventually be reduced to writing and signed. There need to be standards for determining when there is enough specificity to warrant follow-up with the insurer. For example, although a consumer expressing dissatisfaction regarding a state’s mandatory auto insurance law is expressing a grievance that the department should record and track, such a grievance is not a complaint against a specific insurance entity and cannot be included in insurer complaint data. However, a consumer need not allege a violation of the insurance laws in order for his or her expression of dissatisfaction to qualify as a complaint.
Since the same complaint can be reviewed by different personnel in different formats, care must be taken to prevent duplication of complaint records. Whether or not a complaint is “confirmed,” it should still be recorded, properly coded and reported to the CDS, because the broad universe of all types of complaints is the foundation on which more detailed analyses rest and because even complaints in which the company is found to be acting within its rights highlight areas of concern to regulators. On the other hand, care must also be taken to ensure that meritorious complaints are not lost due to improper coding. For example, a complaint may be coded as “1240: Due to the subject of the complaint, the resolution required referral to another agency or section,” and thus tracked as “unconfirmed” even though the referral was to another section of the same department which found that the company was in violation. Or a complaint may raise two separate issues and on one issue the company is found to be in violation but the entire complaint is tracked as “unconfirmed” because other issue resulted in a secondary code of “1295: Company Position Upheld.”
Complaints should be tallied on an aggregate basis, regardless of who filed the complaint. However, the nature of the complaint and the nature of the complainant are important factors both for the eventual resolution of the complaint and for further market analysis. Therefore, the department should track who generated the complaint according to the following categories:
• Insured
• Service Provider
• Other
In addition, the following three categories are recommended for state complaints databases, even though the NAIC doesn’t currently use these categories for the closed complaint database.
• Third-Party Claimant
• Counsel
• Public Adjuster
18 Similarly, the 1974 NAIC Model Regulation for Complaint Records to be Maintained Pursuant to the NAIC Unfair Trade Practices Act provides that “‘Complaint’ shall mean a written communication primarily expressing a grievance.”

As noted, “the expression of a grievance” is what distinguishes inquires from complaints, but departments should track both types of communication. For example, a consumer inquiring about rates or coverage for a specific line of business should not be classified as a consumer complaint. However, separately monitoring and tracking the types of inquiries made by consumers offer valuable information in making a professional determination if further department action is needed or if common issues of inquiry might suggest a need for better consumer education and outreach programs.
2. More Detailed Information on Complaints and Regulatory Actions The number of complaints, of course, does not tell the whole story. In particular, it is also important to know, both for specific companies and for market sectors in the aggregate, what consumers are complaining about. Rates? Claim payments? Sales practices? The NAIC CDS captures the following complaint data elements:
• Entity Complained Against
• Complainant Information
• Type of Coverage (Auto, Life/Annuity, Accident/Health, Homeowners, Liability)
• Reason for Complaint (Underwriting, Policyholder Service, Claim Handling, Marketing)
• Disposition
States may also collect additional information, such as the geographic region within the state or subcategories within the broader lines of business. In addition, now that several years of systematic complaint information are available, it is possible to complement our snapshots of current complaint data with a dynamic view of complaint trends over time.
However, in order for this information to be really useful, states need to be diligent about ensuring that there is consistency from state to state in how complaints are defined and characterized. For example, a state may decide to break down a category in the NAIC CDS into more detailed subcategories, but should not be replaced with a framework that draws the lines between categories in a totally different way.
3. Calculating Complaint Ratios by Number of Policies As discussed briefly in section IV, another refinement states may consider for complaint analysis is to compare complaint ratios calculated in the standard manner, based on premium volume, to some alternative baseline such as the number of transactions. Premium data is more easily obtained and within a particular product line is often a reasonable surrogate for policy count, but if an appropriate measure is available of the number of policies, policyholders or covered lives (or some other measure specific to a particular line of business such as car-years), it may provide a more meaningful measurement, depending on whether the level of activity on a policy is likely to increase as the premium increases. Annuity business, in particular, is a line where the dollars involved can vary so much from transaction to transaction that “premium” volume is a poor measure of the level of market activity. Similar concerns apply to life insurance as well—the race-based premium scandal, for example, affected many more consumers than their share of the overall life insurance premium volume would indicate. Although mishandling a single “large case” policy has a significant impact and should not be taken lightly, the complaint analysis system should not encourage giving disproportionate attention to accounts with tens of thousands of dollars or more in annual premium at the expense of all the other consumers.
Example (complaint ratio by number of policies): The complaint data for the three hypothetical insurers used in section IV to illustrate the definition of “complaint ratio” takes on a different cast when complaint ratios are calculated on the basis of policy count rather than premium volume. Recall that hypothetical Insurers A, B and C had 500, 150 and 10 complaints respectively, on premium volumes of

35
$50 million, $10 million and $1 million, for complaint ratios [based on premium volume] of 0.010 for Insurer A, 0.015 for Insurer B and 0.020 for Insurer C. Now, however, suppose Insurers A and B write individual health coverage with an average premium of $10,000, so that A’s $50 million in premium represented 5000 policies and B’s $10 million represented 1000 policies, while Insurer C specializes in high-deductible policies and writes 500 policies with average premium of $2000. Their ratios of complaints per policy are:
Insurer A: 500 complaints/5000 policies: 0.10
Insurer B: 150 complaints/1000 policies: 0.15
Insurer C: 20 complaints/500 policies: 0.04
Example (complaint index by number of policies): Any alternative basis for calculating complaint ratios can also be used to develop complaint indices. In the example above, the aggregate complaint ratio is
670 complaints/6500 policies: 0.103
and the complaint indices for the three insurers are therefore:
Insurer A: 0.100/0.103: 0.97
Insurer B: 0.15/0.103: 1.46
Insurer C: 0.04/0.103: 0.39
This example also highlights why it may be useful, when feasible, to distinguish between market sectors within a line of business. The differences between high deductible indemnity coverage and HMO coverage or the differences between preferred and substandard or urban and rural automobile coverage may be more significant than a simple conversion between premium volume and policy count would be able to capture.
4. Improving Complaint Analysis Through Use of the CDS Complaint trending is currently the most prevalent technique states employ to identify potential market problems. The CDS makes it possible to analyze complaint trends at the state, regional and national levels. The value of CDS will be enhanced as all states move to full participation, definitions are uniform and standard coding protocols are adopted. A complaint tracking system should be able to compile and measure complaints by type, reason and company, so that an index can be established for each company.
It is important for departments to establish a database to track key elements of the complaint process. The analysis of complaint data can identify potential company or industry trends or concerns including non-complying general business practices or acts that may adversely affect consumers. For instance, a large influx of complaints about premiums within a specific geographic area may be reflective of a rate increase by carriers or possibly indicate a lack of affordable coverage in the area. The trends identified from analysis of the database can be used to trigger a simple inquiry or generate a referral to the examination or enforcement area. The database might track the number of complaints against particular companies or producers for the improper cancellation or denial of coverage. When the number of such complaints reaches a certain level, other divisions of the department should be notified.

The CDS provides a central repository for complaint information in a standardized format that is electronically retrievable. This format is based on a uniform complaint recording form with data fields that identify and categorize the complainant, the entity against whom the complaint is filed, the type of coverage, the reason for the complaint and the final disposition of the complaint. The computerized data collection system and the compilation of standardized reports provide states with a resource for in-depth analysis of complaint information. Data can be analyzed by geographical area, by line of business, by company or by any other standardized data element. Therefore, it is imperative that states adopt the uniform data standards used for the CDS when establishing their internal complaint tracking systems.
5. Publishing Complaint Information Most states publish aggregate data in some format, either in an annual report, consumer brochure or on its department’s Web site. While not all states affirmatively disseminate aggregate complaint information, many states now publish complaint index ratios, at least for personal lines in the property-casualty industry.
Because complaint ratios can have an impact on the general public’s perception of the company and on a department’s decision whether to pursue regulatory action, it is vitally important that complaint indices be based on reliable data and that all categories and terms be adequately defined. Internal quality control measures to assure data integrity should be implemented. Routine audits or studies should be conducted to determine that proper codes are in place and are being used consistently. States should also review their codes to determine if new or amended codes are necessary to address evolving market issues. However, states must be cognizant that any change in internal code structures will impact reporting to the NAIC CDS, so all code changes should be coordinated through the NAIC.
The complaint index should be adequately footnoted to clearly specify how it was calculated and how the relevant terminology is defined, including “complaint.” There should also be an explanation of whether the index is based on unscreened complaints or confirmed complaints and, if it is based on confirmed complaints, what criteria and processes are used for identifying which complaints are considered confirmed. Most complaint index ratios are based upon premium volume—information made available by all insurers in a common format. If some other measure of market activity is used as the baseline for comparison, this should be clearly indicated. These alternative measures should be used only as a supplement to complaint ratios based on premium volume, not as a replacement, because premium volume is the only standard that is in consistent use within the states and by the NAIC.
Finally, we must keep in mind that as with all consumer outreach programs, the value and effectiveness of the department’s complaint index reports and any other market analysis publications the department might make available, is measured by what the program does for consumers. To close the circle of communication, departments must conduct ongoing assessments of consumer reactions and consumer awareness.
6. Confirmed Complaints A complaint, we may recall, is simply an expression of dissatisfaction and dissatisfaction may have many causes. For this reason, many departments consider it important to distinguish between “confirmed” and “unconfirmed” complaints, especially when compiling information for publication. Other terms in common use are “substantiated” and “justified.” Since a high complaint index reflects adversely on a company, these departments feel that it is fairer to base complaint indices purely on complaints where a screening process has led to a finding that the company was in the wrong or at least to leave complaints out of the index when there has been a finding that the company was in the right. Criteria for confirmed complaint status vary from state to state and may include, for example, whether the insurer violated a law, whether the complaint was resolved in favor of the consumer or whether the complaint analyst determined that the complaint was valid.

37
Other departments, however, continue to use unscreened complaints and some departments have discontinued screening programs that were formerly in place. One reason is a view that what complaint data measures is consumer satisfaction, not regulatory compliance and that accordingly, all expressions of dissatisfaction should be counted equally. Some departments also believe that unscreened complaint indices track confirmed complaint indices closely enough that the costs of screening programs outweigh the perceived benefits. Those costs can be substantial, because if due process is perceived to require the regulator to determine whether a complaint is confirmed, then due process would also require the regulator to give the company an opportunity to contest the finding. This has the potential of turning every complaint into a mini disciplinary proceeding. Another concern is that if a favorable resolution for the consumer results in a black mark against the insurer, the insurer is given a perverse incentive to be uncooperative. Paradoxically, it is even possible that unscreened complaint indices may in many cases actually produce a more accurate picture of company behavior than confirmed complaint indices, because restriction to confirmed complaints makes a relatively small sample even smaller and any inconsistencies in the screening process and insurers’ responses can have a serious impact on the accuracy of the data.
Therefore, whether to screen remains an open question. Some states have effective screening programs, which allow additional layers of analysis, while others rely on unscreened complaints. The two systems can work in harmony as long as states with screening programs also continue to report all complaints to the CDS, whether or not they are confirmed, in the same manner as other participating states. “Confirmed complaint” states can assist other states by testing the degree of consistency between confirmed and unscreened complaint indices. They may also choose to develop collaborative programs to evaluate confirmed complaint data on a multistate basis, but should be cautious about whether they are really working with consistent data, since both the criteria for confirmation and how those criteria are applied will vary significantly from state to state.
B. Use of IRIS Ratios in Market Analysis As discussed more fully on the NAIC Web site, the Insurance Regulatory Information System (IRIS) is a tool designed to assist state insurance departments in monitoring the industry’s financial condition. A key component of IRIS is a series of financial ratios based on annual statement information, developed for the purpose of identifying companies with potential financial difficulties. There are separate series of IRIS ratios for Property and Casualty companies and for Life and Health companies, with 12 ratios in each series.19 It must be emphasized that IRIS ratios are a preliminary screening tool and IRIS ratios outside the pre-established norm do not necessarily indicate an adverse financial condition, let alone constitute evidence of market conduct problems. The IRIS ratio merely provides a signal for the regulator to follow-up to determine the cause of the changes in the company measured by the ratio or ratios in question.
Bearing in mind these limitations, the six IRIS ratios that are most likely to be of value as market conduct indicators are Property/Casualty Ratios 1, 2, 3 and 8 and Life/Health Ratios 11 and 12:
• Property/Casualty, Ratio 1: Gross Premium to Surplus
This ratio tests the adequacy of the company’s surplus, without the effects of reinsurance. The higher the ratio, the more risk the company bears in relation to the surplus available to absorb loss variations, without the benefit of reinsurance.
Guidelines – Normal results for this ratio may be as high as 900 percent, but what is “normal” will depend on the line of business, since lines with more variability in losses such as liability
19 Although the Life and Health series is numbered from 1 to 13, Ratio 4 has been discontinued.

and workers’ compensation will require more surplus, other factors being equal, to sustain the same premium volume.
• Property/Casualty, Ratio 2: Net Premium to Surplus
This ratio is similar to Ratio 1, but considers the effects of reinsurance. The higher this ratio the more risk the company retains in relation to available surplus.
Guidelines – Again, normal results for this ratio will vary by line of business, but are generally less than 300 percent. It is important to compare this ratio to the Gross Premium to Surplus ratio above. If the disparity between the two ratios is large, the company may be relying heavily on reinsurance. To the extent that the reinsurers are financially sound and make prompt payments to the company, this may not be a problem. However, if analysis of the company’s reinsurers finds deficiencies in this area, the percentage of gross premiums written to policyholders’ surplus becomes more telling. Special consideration should be given to reinsurance transactions between affiliates that are not part of an established intercompany pooling arrangement.
• Property/Casualty, Ratio 3: Change In Net Writings
Major increases or decreases in net premium written can indicate a lack of stability in the company’s operations. A major increase in premium may signal abrupt entry into new lines of business or states or territories—this could have market conduct implications even if the new business is profitable financially. In addition, a company that is attempting to increase cash flow in order to make loss payments may do this by taking on risky or unprofitable business. Companies writing questionable business in aggressive pursuit of market share or cash flow may seek to disguise this by understating their incurred losses. The analyst should review the cash flow statement for significant increases in benefit payments and should consider whether there may be an existing operating problem such as an inadequately priced product or poor underwriting results.
Guidelines – the usual range for this ratio is between –33 percent and +33 percent. Ratios that fall outside the norm frequently indicate a lack of stability in the company’s operations and management. Other evidence of instability may include dramatic shifts in product mix, marketing areas, underwriting and similar factors. Further analysis, as always, will be required.
• Property/Casualty, Ratio 8 - Liabilities to Liquid Assets
This ratio is a measure of the company’s ability to meet the financial demands that may be placed upon it. If the company’s ratio is out of the norm in this area, there may be problems with its ability to pay claims.
Guidelines – the usual range is below 105 percent. Analysis of insolvent companies has shown that many insurers that later became insolvent had increasing ratios of total liabilities to liquid assets in their final years. Thus, when looking at this ratio it is important to consider the trend, not just the current year.
• Life/Health, Ratio 10 – Change in Premium
This ratio represents the percentage change in premium from the prior year to the current year. This ratio is not calculated for a newly formed company because of the lack of prior year data. The calculation is the change in total premiums, deposit-type contract fund considerations and other considerations from the prior year to the current year, divided by total premiums, deposit-type fund considerations and other considerations for the prior year.

39
Guidelines – This ratio is usually less than 50 percent and greater than negative 10 percent. Any number that is significantly outside this range should be investigated further to determine the reason. The issues presented are similar to those raised by sudden changes in property and casualty premium activity, as discussed above.
• Life/Health, Ratio 11 – Change in Product Mix
The change in product mix ratio represents the average change in the percentage of total premium from each product line during the year. The calculation of this ratio begins by determining the percentage of premium from each product line for the current and prior years. Next, the change in the percentage of premium between the two years is determined for each product line and expressed as a positive number whether it is an increase or a decrease. Finally, these differences are averaged by adding them up (without regard to sign) and dividing by the number of product lines. Lines for which total premiums for either year are zero or negative are excluded.
Guidelines – This ratio is usually less than five percent. Anything materially higher should be investigated further with the Financial Services section of the state insurance department. Does the company have a business plan? What is management’s expertise in product pricing, underwriting, claims and reserving in new lines of business? Why is the company changing product lines? Are there changes in the marketplace that impact a company's decision to shift direction? Are there changes in company ownership or management that have resulted in shifts in product mix or entrance into new geographic areas?
Your department’s financial analysts should be identifying the companies doing business in your state with IRIS ratios outside the norm, should be sharing that information with you and may have already completed their inquiry into the reasons for the result and whether there is any real cause for concern. In addition, the NAIC makes IRIS ratio information directly accessible to regulators through I-SITE.
Since IRIS ratios were originally developed for financial purposes, market analysts must keep in mind the similarities and differences between market analysis and financial analysis and how these affect the use of IRIS ratios. As noted before, unusual IRIS scores do not necessarily indicate financial problems, but they could still be of interest to market analysts. For example, a company could have the capital to venture safely into a new, untested line of business, but might not have the customer service resources in place—or vice versa. The IRIS score indicating a significant change in writings calls for follow-up by both financial and market analysts, but they could be following up in different ways.
For example, one key market indicator tracked by IRIS is the change in premium volume. (P/C Ratio 3 or L/H Ratio 10) As discussed in “How to Analyze state page Data” in section IV above, a significant change should suggest a series of inquiries for market analysts.
Again, however, it must be emphasized that the ratios and trends, though often helpful in identifying companies likely to experience financial difficulties, are not in themselves indicative of adverse financial condition. The ratios and range comparisons are mechanically produced. True financial condition can only be determined by knowledgeable people. Furthermore, financial problems do not necessarily indicate market conduct problems; let alone what those problems might be for a particular company. Therefore, IRIS ratios should only be used in conjunction with other indicators and any conclusions drawn from IRIS ratios should be validated through discussions with financial analysts.
C. The Use of Underwriting Guidelines in Market Analysis: Underwriting is the process by which an insurer determines whether it will accept or reject an application for coverage, or whether it will renew or nonrenew an existing policy. Underwriting also

includes the process of assigning policyholders (and prospective policyholders) to different risk classifications or rating tiers for purposes of determining the premium level the insurer will charge.
Underwriting guidelines are the standards by which the insurer makes these underwriting decisions – to accept or reject a consumer and to determine which rating tier, base rate, or “market” the insurer will assign the consumer if accepted. Insurers generally compile written underwriting guidelines to provide to insurance producers (or sales representatives for direct writers) or in-house underwriters. Underwriting guidelines range from very detailed and objective written rules (e.g., limitations on insuring homes under a specified value) to broad and subjective forms of guidance for the producer or underwriter. For some lines of insurance, underwriting has become an increasingly automated process over the past ten years. For these lines, insurers provide producers with software that incorporates the underwriting guidelines and accesses third-party data, such as credit information and claims history, as the producer gathers information from the consumer.
Although underwriting judgment is at the heart of insurers’ business practices in almost every area of insurance, there are a variety of reasons why underwriting practices differ for different lines of insurance. The more complex the risk insured, the more underwriting practices may differ from company to company and risk to risk. The primary focus of this discussion is personal lines property and casualty coverage, and therefore regulators must keep in mind that when considering other lines of insurance, not all of the concepts discussed here will apply. For example, annuities typically are not underwritten at all, life insurance is often written as a whole-life contract or as a term contract with guaranteed renewal at a set rate for an extended period of time, and many health insurance markets are subject to laws requiring guaranteed issue, guaranteed renewal, and limits on rate variation.
1. The Significance of Underwriting Guidelines
An insurer’s underwriting guidelines are one source of significant information on the insurer’s market strategies and factors affecting coverage. Often, a regulator can gain a better understanding of the overall marketplace by reviewing and comparing different insurers’ underwriting guidelines. Underwriting guidelines can be used by regulators to determine which risks insurers are accepting and which risks are being rejected. With this knowledge, regulators can better understand and react to those insurer decisions. In addition, a review of underwriting guidelines can help focus investigation and examination efforts.
Historically, underwriting decisions have been considered matters of business judgment for the marketplace to decide (subject to a few narrowly drawn antidiscrimination laws, such as prohibitions against the use of race as a factor) while rates for many lines of insurance (particularly for personal lines) have been subject to close regulatory oversight. Often, this freedom from regulation has applied to the criteria for tier placement, with those criteria being considered judgment calls rather than integral parts of the underlying rating plans. This has provided one of the incentives for some companies to develop highly evolved tier structures, in at least one case with more than 100 rating tiers. In some states, the introduction of credit scoring for rating purposes drew little notice when it was initially introduced because it was done through underwriting guidelines rather than through the filed rates. More recently, similar concerns have been surfacing over the use of claim history reports. A related issue is that the line between acceptance/rejection decisions and rating decisions is not always a bright line, since groups of affiliated companies under common management will often assign different tiers of policyholders to different companies within the group, with different rating plans.
A timely review of an insurer’s underwriting guidelines as they are amended may assist regulators in the early detection of practices that could be detrimental to insurance consumers. For example, in the case of homeowner’s insurance, a review of underwriting guidelines may provide information that will assist in determining whether or not certain market segments are underserved. In particular, underwriting guidelines that limit the availability of insurance, or of replacement cost insurance, on the basis of the age or value of the house or the ratio of value to replacement cost, may disproportionately

41
affect homeowners in minority or inner-city neighborhoods. Inner city neighborhoods tend to be older than suburban neighborhoods and undervalued, and frequently have a higher ratio of minority residents. For these reasons, some insurers have modified or eliminated such criteria from their underwriting guidelines.
2. Reviewing Underwriting Guidelines
Since few if any states routinely require the filing of underwriting guidelines, in order to conduct this review a state regulator will more than likely have to issue a special data call and request underwriting guidelines from insurers for specific lines of insurance. This request might include the following:
• Please provide a complete copy, either paper or electronic, of your current underwriting guidelines for any companies writing [specify the line of business] in [state]. If there are common underwriting guidelines for several companies, please submit only one copy of those common guidelines.
• Please provide a list of all changes to the underwriting guidelines for the last three years [or other specified time period].
• For the purpose of this request, underwriting guidelines are defined as the rules used to determine eligibility for coverage and the assignment of customers to specific rating tiers, risk classifications, or “markets.”
It should be noted that many underwriting guidelines are considered trade secret and/or proprietary in nature. A state must review its confidentiality laws before issuing this data request, and where applicable, take appropriate measures to ensure that information will be protected in accordance with those laws and nonpublic information will not be released to the public. One approach is to appoint a custodian for underwriting guidelines who has responsibility for maintaining the documents and tracking the how the information is accessed within the department.
After the initial submission and review of underwriting guidelines, a state may want to ask insurers to submit significant changes in underwriting guidelines for review shortly before the new underwriting guidelines become effective. This is relevant for several reasons: to ensure that the underwriting guidelines do not conflict with the insurer’s approved rating plan or other filings; to ensure that the information regulators are relying on is current; and because changes in companies’ underwriting guidelines could represent a market development of interest to regulators.
3. Use of information obtained from underwriting guidelines
Not all practices are either clearly discriminatory or non-discriminatory. For those practices that raise questions, a two-step analysis may be used. First, is the underwriting guideline prohibited by law or regulation? Are there any “red flags” such as a clear violation of broad public policy or a factor that is an obvious a proxy for some prohibited characteristic? Second, does the underwriting guideline serve a necessary underwriting purpose by identifying a characteristic of the consumer, vehicle, or property that is demonstrably related to risk of loss and does not duplicate some other factor that has already been taken into account? The second test typically requires insurance data sufficiently detailed to enable the analyst to perform a statistical or actuarial analysis to ascertain that the underwriting or rating factor in question does correlate with the risk of loss and to identify its unique contribution to the risk analysis. Such an analysis assists the analyst in determining whether the practice might violate the law by unfairly discriminating against consumers who do not satisfy the underwriting guideline.
It is important to remember that underwriting guidelines should not be analyzed in a vacuum. A second type of analysis that can be performed is to review these guidelines in the context of actual policies issued or declined by the company. The following are examples of the types of questions that can be asked when reviewing a policy. Did the company:

• refuse to sell a policy ?
• charge a higher premium for the same coverage?
• offer different payment plans to different policyholders?
• refuse to sell a replacement value policy?
• require higher deductibles?
• exclude specific coverages?
• offer different benefits for the same price?
In addition, different companies’ underwriting guidelines may be compared to develop an overview of some of the significant features of the market as a whole. The table below shows one way that a state may compile the information in underwriting guidelines for initial analysis. The table allows the state to quickly see what guidelines are being used by which companies constituting what share of the market:
Example of Compilation of Underwriting Guidelines for Private Passenger Auto
Company A B C D E Group AA AA AA BB BB Market Share 4.30% 2.40% 0.70% 3.30% 1.10%
Claims History No At Fault Claims 3 Years × 5 Years 7 Years × One At Fault Claim 3 Years × 5 Years × 7 Years Two At Fault Claims 3 Years × 5 Years 7 Years No Not At Fault
Claim 3 Years ×
5 Years × 1 Not At Fault Claim 3 Years × × × 5 Years 2 Not At Fault
Claims 3 Years
5 Years
Prior Insurance No Prior Insurance × × × Prior Non Standard × Prior Liability Limits 25/50 × 50/100 × 100/300 ×
Another illustration is the following historical compilation of the use of underwriting guidelines for personal auto and homeowners coverage in Texas, compiled by that state’s Office of Public Insurance Counsel and available on its website at http://www.opic.state.tx.us.

43
A U T O M O B I L E I N S U R A N C E U N D E R W R I T I N G G U I D E L I N E S
Changes in the Rate Regulated Market
Underwriting Guidelines 1994 1996 1999
Canceled by another company. Applicants are asked whether or not their insurance was canceled by another insurer. During the time period covered by the guidelines reviewed for 1996, a new rule made it illegal to base underwriting decisions on this information although it was still legal to ask an applicant. It is unknown how this information was used. The rule prohibiting use of this guideline has been overturned by the Texas Supreme Ct.
71% 65% 60%
No prior insurance. Insurer will not offer coverage to an applicant who is not currently insured or has not maintained continuous coverage for a specified period. Rules prohibit use of this guideline if applicant was uninsured for 30 days or less during the last year.
71% 46% 83%
Age. Applicants are denied based on their age, even though the rates set by the state allow for rating classification by age. Generally, these guidelines refuse coverage to young drivers, with some exceptions for those who are covered on their parents’ policy, and to older drivers.
91% 93% 84%
Occupation. Applicants are denied because of their occupation. Some guidelines allow certain occupations or professions to have more blemishes on their driving/claim record.
56% 65% 56%
Residential stability. Applicants are denied if they have not lived at the same address for a specified period of time, usually 2-3 years, or is a homeowner.
67% 85% 77%
Employment stability. Applicants are denied if they have not worked for the same employer for a specified period of time, usually 2-3 years.
51% 47% 34%
Not-at-fault accidents and claims. Applicants are denied because they have made a claim for, or been involved in, an accident or accidents in which the applicant was not at fault.
52% 21% 41%
Foreign Nationals. Applicants are denied because they do not meet the insurer’s residency requirements and/or requirements that the applicant have driving experience in the United States for a required period of time, usually several years.
58% 44% 64%
Marital Status. Insurer considers the applicant’s marital status. Many of the guidelines ask for specific information such as widowed, divorced, separated, although the rating manual only distinguishes between married or not married for certain young driver categories.
48% 45% 1%
Other coverage. Applicants are denied the minimum liability coverage required by law unless they agree to buy other coverage. While legal for the 1994 report, this guideline was illegal during the period covered by the 1996 guidelines. The department of insurance rules prohibiting its use is still in effect.
38% 2% 54%
Previous insurer nonstandard. Insurer refuses to sell to those who have been insured in the nonstandard market (county mutual or assigned risk plan). While legal for the 1994 report, this guideline was illegal during the period covered by the 1996 guidelines. The rule prohibiting use of this guideline has been overturned by the Texas Supreme Court.
15% 4% 40%
Credit history. Applicants are denied coverage because of their credit history. Insurers often use "risk scores" which combine credit information with demographic data.
25% 58% 46%
Driving experience. Applicants are denied if they do not have at least 3 years of driving experience. The number of years of experience required varies by insurer up to a maximum of 14 years.
43% 25% 71%
H O M E O W N E R S I N S U R A N C E U N D E R W R I T I N G G U I D E L I N E S
Changes in the Market
Underwriting Guideline 1994 1996 1999
Credit. Applicants are denied coverage or non-renewed by insurance companies because of their credit history or credit/insurance risk score.
22% 34% 32%
Claims. Applicants are denied coverage, non-renewed and surcharged by insurance companies because of the number and/or type of claims they have filed. It is illegal to non-renew a policy for claims unless the insured has filed three or more non-weather related claims in any three-year period.
91% 92% 90%
Minimum Coverage. Applicants are denied a policy because they request or require an amount of insurance coverage below the minimum set by the company.
91% 77% 82%
Age of Home. Applicants are denied coverage, placed in a higher-priced company or non-renewed by insurance companies because their home is too old.
88% 75% 53%
Location of Home. Applicants are denied coverage and non-renewed by insurance companies because their home is located near substandard or commercial property or in a neighborhood with high crime and/or declining property values.
60% 62% 62%
Lifestyle. Applicants are denied coverage and non-renewed by insurance companies because of their living arrangements and/or "morals."
29% 15% 57%

Territorial Restrictions. Applicants are denied coverage or required to purchase higher deductibles if they live in certain hail prone areas, for instance the DFW area. Other requirements include not offering replacement cost coverage on roofs or charging a higher rate based on the type of roofing material.
N/A 84% 93%
Conclusion
A review of underwriting guidelines is important since their use impacts both the availability and affordability of insurance to consumers. Insurance data are critical in the review of underwriting guidelines because the data can show whether the underwriting guideline identifies a group of consumers for whom the costs of the coverage are higher or lower than expected, or impacts one group more than another. And a review of actual policies written or declined will show how the company is actually using these underwriting guidelines in the marketplace.
As more states begin to rely upon each other’s regulatory functions, the states will have to know which companies are writing what (the types of coverage, the use of endorsements); when (are certain companies writing more or less when the market is hard or soft?); where (are all markets being adequately served?); why (is a company suddenly writing a new line it has little expertise in?); and how (the various agent distribution methods, internet sales, etc.) A review of underwriting guidelines can assist a state with answering some of these questions.
D. Modes of Analysis Market analysis can be conducted at a variety of levels, using a variety of techniques, ranging from rigorous statistical modeling to more informal discussion and information sharing about how to address specific market problems. These can be categorized in various ways. For example, distinctions and comparisons can be drawn between quantitative (data-driven) and qualitative (event-driven) techniques and between macro (entire markets) and micro (specific companies or issues) techniques. Below are brief overviews of a few of these approaches.
1. Analysis of General Market Conditions Analysis of general market conditions is important in fast-changing markets, such as the health marketplace with its shifting mix of delivery systems; in markets with unique characteristics, such as reverse competition dynamics in the credit and title industries; and in markets with a history of availability problems, such as certain liability lines or homeowners insurance in some regions. Key factors to look for include:
Competitive pricing and availability of products. These are the traditional core concerns of “macro analysis,” since it is always essential to identify underserved markets and population sectors and evaluate how the industry and the state can best work together to correct the situation.
New laws. Implementation of new laws, such as prompt pay and patient protection laws, deserves special attention since passage of such laws generally indicates an important consumer protection priority.
Emerging issues. Market changes, such as the expanding use of credit reports and genetic testing in underwriting and rating, often raise new consumer protection concerns.
2. Individual Company Concerns At the individual company level, the “Step 3” analysis can be broadened to include a number of other factors that may serve as potential warning signs warranting further inquiry. Although some of these are unlikely to surface in any systematic way outside of an examination, others will be readily available from reported data or common knowledge in the marketplace. Indicators that have been identified include:
1. Company showing rapid market share growth.

45
2. Low premium for coverage in comparison to competitors.
3. Company making requests for rapid rate increases (in lines of business subject to rate regulation).
4. Company implementing severe underwriting restrictions.
5. Company implementing new claim payment rules.
6. Company experiencing rapid growth in number of producers.
7. Company hiring agents with questionable reputation or prior disciplinary history.
8. Increase in consumer complaints.
9. Agents targeting a specific demographic group.
10. Unusual number or occurrences of replacements.
11. Major reallocation of agent sales force.
12. Company moving from one area of the state to another.
13. Introduction of new policy types.
14. Company submitting and/or using unusual policy language.
15. Excessive prerequisite conditions for claim payment.
16. Company getting into long-tail business hoping to build assets while waiting for lag in claims.
17. Company increasingly dependent upon one producer or MGA.
18. Agencies emphasizing production of business at the expense of sound underwriting.
19. Life or health company affiliated with questionable associations or trusts.
20. Company not cooperating with states on examinations or other regulatory review activities.
21. Company writing new business funded by old business.
3. Global Objectives Although the goal of a market conduct program is often perceived narrowly as identifying issues centered on specific companies and bringing those companies into compliance, market analysis can also be an important tool in programs directed towards broader market conditions. Some examples include:
Identify underserved and noncompetitive markets: Markets are typically defined by line and by geographic location, perhaps the state or perhaps a more local unit. It is important to recognize that market operation can also be impacted by demographic factors such as level of urbanization and income. For example, automobile insurance costs are significantly higher in high-density, low-income areas, especially when these factors are accompanied by inferior transportation infrastructures and elevated crime rates. Consequently, insurers may find such markets less attractive. Particularly for private passenger automobile and homeowners insurance, data should be collected in sufficient detail to enable regulators to adequately identify underserved or noncompetitive markets. Data should include exposure, premium and loss fields and also fields permitting identification of complainant and producer location, which can prove useful in identifying areas with a shortage of distribution channels. States may also want to monitor health coverage by geographic location, tracking both the number of insureds and the availability medical services within various regions. If data aggregated by ZIP code is available, it can easily be merged with other relevant data, such as the U.S. census and then aggregated upwards to other geographic levels, such as county or metropolitan area or by demographic

characteristics such as income. Relevant statewide data may also be compared to data from neighboring states and market share concentrations in different lines of business within the state can be compared in order to gain insight into the relative levels of competition in those markets. In some states, detailed territorial information may be subject to trade secret protection or the state of the law may be unsettled as to whether this information can be disclosed to the public. In jurisdictions where certain market analysis information is confidential, regulators who collect such information must be careful to use it in ways that disclose only aggregate, nonconfidential information to the public.
Monitor insurers’ use of territories, fire protection classifications or other geographic rating mechanisms: Although territorial rating is not inherently inappropriate for lines such as homeowners and automobile insurance, significant variations in rates are understandably controversial among the consumers who pay the higher rates. It is therefore essential to ensure that like risks are being treated alike and that territories that are used have actuarial validity. In theory, competitive markets will ensure that this is the case, but it is necessary to test whether the theory is borne out by actual market conditions. Few states now have the means to adequately monitor the actuarial adequacy and fairness of territories. Existing territories may lag considerably behind changing risk characteristics associated with geographic areas. In addition, territory structure may be driven more by marketing than by risk analysis. Appropriate statistical methodologies should be developed and territories, once approved, should be re-analyzed periodically.
Identify underwriting and rating variables that may have a significant disparate impact or are proxy variables for prohibited characteristics: Some variables may serve to disproportionately deny coverage to specific geographic markets and may also lack strong actuarial justification. Data could be collected in sufficient detail to monitor the impact of specific variables across geographic areas. In some cases, a special data call may be warranted if a reasonable cause for concern exists. Existing complaint data should also be monitored for “refusal to insure,” cancellations and “premium and rating” complaints. To the extent possible, specific data regarding the reasons for such actions should be collected.
Identify patterns of market behavior adversely impacting consumers, by line, company and geographic area: Where possible, data should be geographically coded (for example, if appropriate, at the ZIP code level), so that complaints can be normalized by the number of policies at specific locations. Complaints should be analyzed by category, for example, claims handling issues (denial of claim, unsatisfactory settlement) and premium and rating issues.
Monitor geographic areas and lines of business with significant business written through residual markets: By definition, residual market placement indicates the inability to find adequate coverage in the voluntary market, so unusual residual market concentrations are a clear indicator of availability problems. Once they are found, further inquiry needs to be made into the reasons.
Analyze known problem markets to evaluate likely causes: Identify indicators that would shed light on the sources of the problems and suggest promising approaches for corrective action.
Develop data sources and methodologies that serve as triggers for further market conduct review: The value of hindsight should not be overlooked. A key component of any analytical program is validating the results obtained and the communication between analysts and examiners needs to run both ways. Once problem companies have been identified, data collected on those companies should be compared with baseline data for the market to see what patterns can be observed and whether these patterns suggest the development of new indicators or second thoughts about indicators currently in use.
E. Examples – the Missouri Experience One example of what state market analysts can produce is the following set of reports compiled and published by the Missouri Department of Insurance, both in print form and on the department Web site, http://www.insurance.state.mo.us:

47
1. Complaint Index Report: Company performance is compared to the state’s industry average. Companies are categorized by line of business and type of complaint.
2. Market Share Report: Market data for the top 35 insurance carriers and groups, including historical trends, for each line of business.
3. Homeowners and Private Passenger Automobile Insurance Reports: ZIP code level premium and loss data for each line of insurance, presented by demographic groups and geographic regions for the past 10 years.
4. HMO Report: HMO data from the annual financial statements, such as premiums earned and costs incurred for health related services. This report also includes enrollment data, by ZIP code including enrollment for specified regions of the state.
5. Medical Malpractice Report: Aggregate claims for the three years prior to the report. Includes information on claim frequency, loss ratios by company and by type of insured, average dollar settlements, litigated claims, average time to close claims and other trends in medical malpractice.
6. Real Estate Malpractice Report: A 10-year summary by area of practice for filed claims, major activity responsible for alleged error or omission, most significant reasons for claims, years of real estate experience for the insured and relationship of insured to claimant.
7. Legal Malpractice Report: 10 years of data presented by area of law for the insured, major activity responsible for alleged error or omission, most significant reasons for claims, legal disposition of claims, number of years in practice by insured and relationship of insured to claimant.
8. Product Liability Report: Aggregate claims analysis incorporating three years of data. Included are indemnity paid per claim, average loss expense, average initial reserve, average time to close claims, business classification loss experience, product indemnity analysis and resolution and expense of litigated claims.
9. Mortgage Guaranty Insurance Report: Reports data from the most recent year and for more than two decades for both residential and commercial lines of mortgage guaranty insurance. The data includes earned premium by company, losses paid, outstanding claim reserves, IBNR reserves, contingency reserves, loaded loss ratios and true loss ratios.
10. Life, Accident & Health Supplement Data Report: Information on all life and non-HMO health insurers, health service corporations and fraternal companies licensed to operate in the state. The information includes detailed financial and premium information by company, by line of business, market share, life insurance in force and health benefits ratios. Companies file a Missouri supplement form that collects additional data beyond what is reported on the state page; in particular, the lines of business are broken up into greater detail.
11. Property & Casualty Supplement Data Report: Data on written premium, loss ratios and other information for all property and casualty insurers licensed in Missouri for all major lines of business.
F. Examples – the Pennsylvania Experience The Insurance Department’s first priority is to protect consumers through fair and efficient regulation of the insurance industry. Critical to fulfilling this mission are the investigative and monitoring activities conducted by the Bureau of Enforcement.
As the insurance industry becomes increasingly competitive and dynamic, the Bureau continues to endeavor to meet the challenges of the evolving marketplace. Developments such as increased deregulation, the emergency and growth of managed care and the use of the Internet as a sales and marketing tool made it necessary for the Bureau of become more proactive. As a result, the Bureau formed a new division, the Market Surveillance Division. The division is made up of three team members who have experience in insurance investigations; consumer services and market conduct examinations.
Created in 1997 by Commissioner Koken, the Market Surveillance Division takes a proactive approach to enforcement by monitoring the insurance industry and identifying problems before they rise to the level of an enforcement action. Educating both the insurance industry regarding compliance and the Insurance Department about marketplace trends is a key part of the division’s types of compliance reviews. The department’s surveillance initiatives may be issue-driven or product-centered. A review can involve interviewing agents or companies regarding their knowledge of a new law or regulation or about their business activities and practices. Reviews also can involve sampling an agent or company’s files to determine if they comply with a particular law or provision of a law.
Passages of new legislation or regulations, indications of non-compliance or a misunderstanding of the law and media reports, can trigger market surveillance reviews. Agents or companies can be chosen for the review in several ways. In some cases, companies are chosen based on the products they sell. In other cases, companies are selected based on their market share or companies may be chosen randomly.
Upon selecting a company for review, the division mails each agent or company an announcement letter informing them of the review. Announcement letters are directed to the attention of the President/CEO and request that the company designate a company representative. The representative’s responsibilities vary depending upon the review. In reviews that involve surveying the agent or company, the representative is usually the individual designated to respond to the survey. In reviews that involve sampling agents’ or companies’ files, the contact person is usually the person responsible for ensuring the information provided to the department is accurate and reported in a timely manner.
Following the selection of a coordinator, the division begins collecting information. In many cases, the division obtains information through telephone interviews. In other instances, the division requests the agent or company assemble the data and mail the information to the Market Surveillance division. After compiling information from each agent or company, the division sends the agent or company a letter and a summary of the findings to confirm the information collected is accurate and give the agent or company the opportunity to clarify the findings. Once the division confirms the information is accurate, the Division uses a software program to aggregate the information and conduct statistical analysis.
After analyzing the information, the division’s examiners draft a report summarizing their findings. Because the division is responsible for monitoring the industry and reporting marketplace trends, the Market Surveillance division’s reports include aggregate information rather than information pertaining to a specific company. We have found this allows agents and companies to be more forthcoming, therefore providing a better indication of what is occurring in the marketplace. Upon completing the report, the division presents its finding to the director, the Deputy Commissioner and in many cases to the Insurance Commissioner.
49
Depending on the purpose and type of the review, the division may pursue one of several education initiatives. If the review was intended to identify misunderstandings of the law or areas of non-compliance, the division may develop a PowerPoint presentation, which is available to consumers and the industry. The Division uses the PowerPoint presentation to present its findings to the industry, to educate it so it can better understand new laws or regulations and correct any non-compliance issues discovered during the division’s review. In an effort to reach a broader audience, the division has recently begun converting the presentations to fact sheets, which are posted on the department’s Internet site. Links to the series of fact sheets can be found at the Market Surveillance division page, http://www.ins.state.pa.us , click on the icon for Insurance Companies and then the link in the first paragraph “Office of Insurance Product Regulation and Market Enforcement.”
In cases where a review was initiated by the Insurance Commissioner to obtain information to make a policy decision on a particular issue, the division drafts a report and distributes it to appropriate staff within the department. If the review was conducted to answer questions or address issues raised by the General Assembly, the division drafts a report and distributes it to the General Assembly and other interested parties. Public reports are also posted on the department’s Internet site.
As Commissioner Koken noted upon the division’s creation, “Recent regulatory reforms have benefited both the industry and the consumer by making it easier for new products to get to the marketplace, but it also increases the importance of industry compliance.” The Market Surveillance division sends a clear and direct signal to the industry that we are diligently monitoring activity in the marketplace.
G. Examples – the Arizona Experience The Market Oversight Analysis section generates four complaint ratios: Personal Lines Complaint, Life & Health, HMO and P&C with Disability. The Ratios are developed using: a) data obtained from our annual market analysis surveys of all active direct writers in Arizona and b) the department’s complaint data obtained from Consumer Affairs division. By dividing a company’s consumer complaints by the number of exposures (and multiplying by 1,000), we arrive at the ratio of complaints, by company, per 1,000 Arizona policyholders.
As an example, the following outline of the Personal Lines In Force (PLIF) survey describes the procedures for: a) disseminating the surveys to the insurance industry, b) retrieving, compiling, analyzing the data, c) transmitting the data to the Public Information Office in the Director’s Office for publication and d) getting the final brochures printed and available to the public.
1. In November of each year, the analysis section creates a list of entities to survey. The list is generated by querying the AS-400 using SQL and includes insurers licensed to write property and casualty insurance (excluding reinsurers). Narrow the list by identifying only those insurers with written premium as reported in their annual statement for the previous year in the following lines of business, as identified by the annual statement state page Lines 4, 19.2 and 21.1. Also include any new P&C insurers admitted in Arizona during the current year. For each insurer identified as having any written premium in any of these lines, provide the following additional data:
a. Company NAIC number
b. Company name
c. Company contact (VP or Actuary contact)
d. Company mailing address (address, city, state, ZIP code)
2. The PLIF survey is created in either MS Word or Excel and the cover letter is created in Word.
3. The company information is then mail-merged into the cover letter and printed.
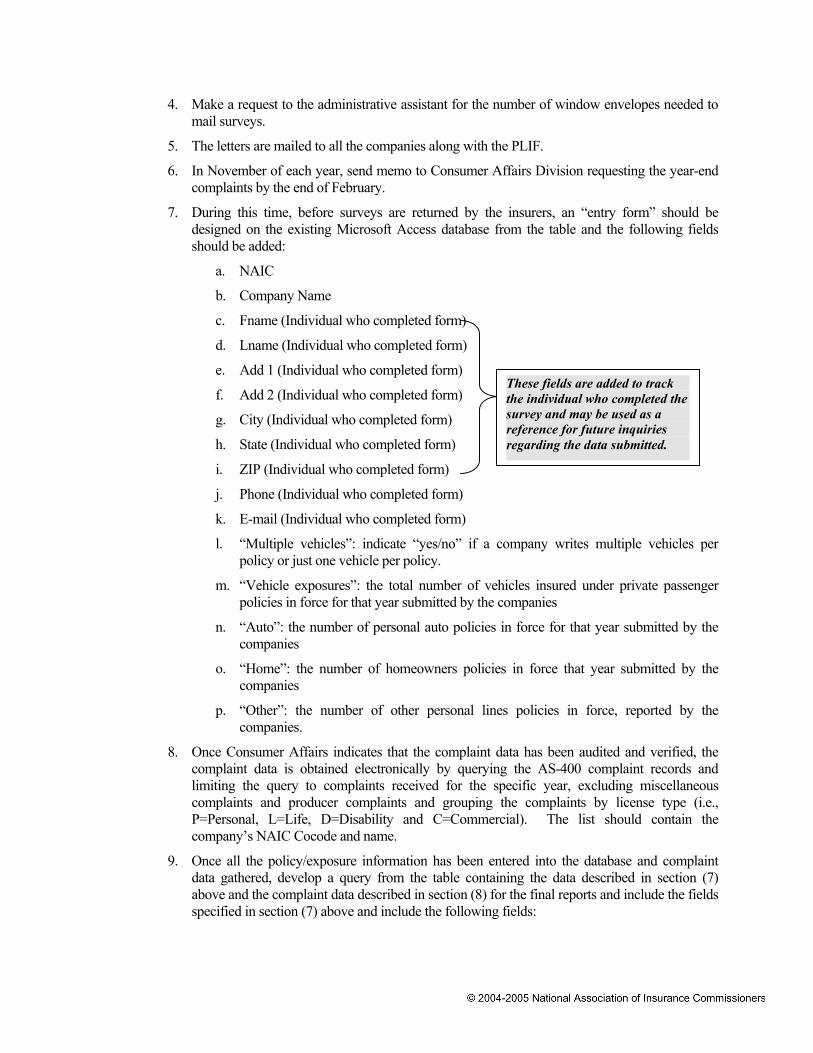
4. Make a request to the administrative assistant for the number of window envelopes needed to mail surveys.
5. The letters are mailed to all the companies along with the PLIF.
6. In November of each year, send memo to Consumer Affairs Division requesting the year-end complaints by the end of February.
7. During this time, before surveys are returned by the insurers, an “entry form” should be designed on the existing Microsoft Access database from the table and the following fields should be added:
a. NAIC
b. Company Name
c. Fname (Individual who completed form)
d. Lname (Individual who completed form)
e. Add 1 (Individual who completed form)
f. Add 2 (Individual who completed form)
g. City (Individual who completed form)
h. State (Individual who completed form)
i. ZIP (Individual who completed form)
j. Phone (Individual who completed form)
k. E-mail (Individual who completed form)
l. “Multiple vehicles”: indicate “yes/no” if a company writes multiple vehicles per policy or just one vehicle per policy.
m. “Vehicle exposures”: the total number of vehicles insured under private passenger policies in force for that year submitted by the companies
n. “Auto”: the number of personal auto policies in force for that year submitted by the companies
o. “Home”: the number of homeowners policies in force that year submitted by the companies
p. “Other”: the number of other personal lines policies in force, reported by the companies.
8. Once Consumer Affairs indicates that the complaint data has been audited and verified, the complaint data is obtained electronically by querying the AS-400 complaint records and limiting the query to complaints received for the specific year, excluding miscellaneous complaints and producer complaints and grouping the complaints by license type (i.e., P=Personal, L=Life, D=Disability and C=Commercial). The list should contain the company’s NAIC Cocode and name.
9. Once all the policy/exposure information has been entered into the database and complaint data gathered, develop a query from the table containing the data described in section (7) above and the complaint data described in section (8) for the final reports and include the fields specified in section (7) above and include the following fields:
These fields are added to track the individual who completed the survey and may be used as a reference for future inquiries regarding the data submitted.

51
a. “Complaints”: The number of complaints recorded by Consumer Affairs and Investigations. For purposes of the personal lines reports, the complaints should be limited to the P=Personal complaints.
b. “Ratio” { should be written as follows –
Ratio: ([Complaints]/[Total])*1000 }
c. “Total” { should be written as follows –
Total: If([Vehicle Exposures]>[Auto],
([Vehicle Exposures]+[Home]+[Other]), ],([Auto]+[Home]+[Other]) }
10. Add a criteria expression under the “Total” field section limiting the query to companies that wrote more than 4500 policies within the calendar year or have more than 4500 exposures. (>4500)
11. Run the query and generate a report and “format” into the final document that will become the published Personal Lines Complaint Ratio Brochure.
12. Double check figures for accuracy. Cross-check data reported by company against the following:
a. Premium Written as reported on company’s annual statement state page. Calculate the approximate amount a policy would cost by dividing the reported amount of private passenger written premium, by the number of auto policies reported; if the resulting figure is unusually high or low, question the policy count by contacting the company or check with Financial Affairs about the accuracy of the premium reported.
b. Prior years data reported and prior years premium. Check for significant increase or decrease that appears out of the ordinary. Contact the company to question any unusual results.
c. DOI Annual Motor Vehicle Liability Report (Compiled by Property and Casualty Division). Check to see that all companies reporting premium in MV Liability Report responded to the complaint ratio survey. Send a survey to any company that was not in the original mailing but reported premium to P&C. Research other anomalies such as why companies were not in our database “dump”, why not survey recipients, why not on complaint ratio brochure, etc.
d. Top 25 Automobile and Homeowners Lists (source is DOI Annual Report or Web site). Check to see if all companies in the lists are also on complaint ratio brochure; if not, research why not.
e. NAIC Financial Database. Look for companies with auto and homeowner premium (refer to (1) above for the annual statement premium lines) and identify any companies that did not receive or return a survey.
f. Consumer complaints need to be verified. If a company reports 0 policies and has complaints against it, contact Consumer Affairs and verify accuracy of complaints. Company may need to be contacted as well.
13. Work with Public Information Office and edit verbiage on brochure as needed to reflect new survey year and any other appropriate changes.
14. Translate verbiage into Spanish.
15. Create brochure in Adobe Acrobat format for Web site. Complete a System Service Request (SSR) form seeking modification of the Web site and forward to Public Information Officer.

Provide computer room administrator a copy of the new English and Spanish brochures to be posted on the department’s Web site (either provide the location on the J drive or provide a disk with the Adobe formatted versions).
16. Provide final of Personal Lines Complaint Ratio Brochure for printing to the public information officer in director’s office.
H. Examples – the Oregon Experience Oregon uses the Internet in several ways in our market analysis program. Sometimes we review the company's Web sites to see what information they are providing to consumers. Recently we looked at several P&C companies web sites to see if they were discouraging consumer to file small claims. We also obtain information regarding class action law suits and other legal information, identification of emerging issues and industry trends. In addition to the companies’ own Web sites, some of the Web sites we use are:
• www.naic.org
• www.insure.com
• www.sec.gov
• www.hoovers.com
• www.ambest.com
• www.standardandpoors.com
• www.weissratings.com
• www.census.gov
• www.findarticles.com
I. Examples – the Maine Experience In 2003, the Maine Bureau of Insurance began an in-depth study of the availability and affordability of homeowner’s insurance and small business commercial liability coverage. In October, Superintendent Iuppa held a series of public meetings at various locations across the state to gather first hand information from the public regarding their experience with these lines. To encourage attendance, the meetings were held in the evening, after work hours. The Bureau has posted an interactive survey questionnaire on its Web site at http://www.maineinsurancereg.org in order to obtain further input.
The meetings, attended by consumers, producers and legislators, were covered by local and statewide media and were preceded by a statewide publicity campaign. In a press release, Superintendent Iuppa explained: “Rates have increased substantially and the availability of coverage has become an issue both in Maine and countrywide. The information we receive from these meetings will help us determine recent developments in the homeowners and business insurance markets concerning pricing, changes made to coverage not requested by the policyholder, problems trying to buy policies and any other general problems that people may have with these types of insurance. The feedback received from these forums and the survey results will be submitted in a report from the Bureau of Insurance to the legislature by Jan.5, 2004. In addition to the public forums, the bureau has conducted a number of surveys to agents, insurance companies, small businesses and consumers to further examine the dynamics of the marketplace. Once the report is complete, we expect it to be one of the most comprehensive studies done by any state on this issue.”

53

Responding To Market Conduct Problems _________________________________________________________________________________________The ultimate purpose of the market analysis program is to provide regulators with the basis for timely, appropriate and effective action. Once the information has been evaluated, the range of regulatory responses to consider has been summarized in an outline developed by the NAIC Market Conduct and Consumer Affairs (D) Committee, which describes the following continuum of steps to address any market conduct problems that may have been identified:
A. Education These options will generally have the least impact on department and company resources. They will generally work best where the goal is to anticipate and avoid problems, such as those that often accompany the implementation of new laws or to correct minor problems before they become significant compliance issues.
1. Proactive Outreach States have used a variety of outreach strategies to educate industry and consumer audiences about emerging problems, including PowerPoint presentations, consumer brochures, outreach programs, speaker bureaus, seminars and individual meetings with companies.
2. Department Communications States have used bulletins, newsletters and Web site postings to notify industry and consumer audiences of regulatory developments and potential problem areas. Some states routinely publish, for example, their priorities for market analysis or market conduct exams. Some states publish a list of the most common or the most serious violations they have found in recent exams. Receiving this kind of information from state insurance departments promotes industry compliance. The growth of the Web is making this strategy increasingly useful, though stakeholders vary in their access to and reliance on the Web for information.
B. Office-Based Information Gathering These options are more intensive than the educational options and generally will work best when the goal is to get specific information about a compliance problem or emerging regulatory concern.
1. Interview with Company Meeting with companies to review specific allegations is often an important part of getting a full picture of the problem. The department may want to meet with the company to review adverse trends and to require that the company establish a compliance plan. Because one goal of such meetings is to build common understanding, it often will be helpful to include a review of the relevant laws and regulatory perspectives on the situation.
2. Targeted Information Gathering States may address problems by gathering information through surveys or similar instruments. This may be most useful where regulators are uncertain about the exact nature and/or scope of a problem and want information from a number of companies.
3. Policy and Procedure Reviews States may review a company’s policies and procedures to determine if the company has mechanisms in place designed to ensure the fair treatment of policyholders and proper compliance with state laws. Such review may be targeted at a particular company because of specific problems or at all companies

55
subject to a new statute or regulation to determine who is and isn’t developing the necessary compliance infrastructure.
4. Interrogatories States may send interrogatories to a company in order to obtain specific information about the particular functions of a company or to determine if a company has corrected a previously identified problem.
5. Desk Audits States may conduct a more in-depth review of specific company files off-site. For example, marketing and sales materials may be reviewed through a desk audit.
6. Self-Audits States may monitor company self-audits. “Best practices” organizations or independent standard-setting organizations, such as IMSA in the life insurance industry, promote self-audits or self-evaluative activities and mandate corrective actions on the part of their members. Companies that have qualified for membership in these organizations may be willing to furnish copies of summary reports (such as IMSA’s Supplemental Report) prepared in connection with qualification in the best practices organization and periodic review. Market conduct analysts and examiners should review such information as part of their preliminary market analysis to determine how this information could be used to refine the nature and scope of further regulatory review.
7. Voluntary Compliance Programs A company may agree to undertake corrective action through a compliance program, which may include a self-audit component. States may monitor both whether the company is fulfilling the terms of the corrective action plan and whether the plan is producing the intended result.
C. On-Site Audits These options require the highest level of engagement for departments and companies and generally fit best either when the scope of the problem indicates that an in-depth, on-site review is needed or as part of a structured review program under which all companies in a particular market or companies selected through some sampling process, are periodically subject to examination.
1. Priority Listing When a particular company has been identified for priority attention, staff may be instructed to coordinate all regulatory activity relating to that company through a single person or team. All complaints against a priority company may be assigned to a single analyst, to make it easier to identify whether there are trends or patterns warranting further review and to facilitate sharing information among all divisions of the department.
2. Investigation An investigation of a particular file or individual may require an on-site review of company information.
3. Targeted Exams An on-site targeted examination or a field investigation may be required to address a specific problem that cannot be resolved through an off-site option. The ultimate purpose of the market analysis program is to provide regulators with the basis for timely, appropriate and effective action. Once the information has been evaluated, the range of regulatory responses to consider has been summarized in an outline developed by the NAIC Market Conduct and Consumer

Affairs (D) Committee, which describes the following continuum of steps to address any market conduct problems that may have been identified.
4. Comprehensive Exams A comprehensive examination may be warranted based upon identified problems or may be called on a routine basis to ensure that there are no problems that have not been detected through the normal market analysis process.
5. Collaborative Examinations States may consider collaborative examinations with other state and federal regulators in order to leverage state and federal resources and resolve issues that cross state boundaries.
6. Compliance Programs A state may require a company to establish a compliance program to ensure that it corrects problems identified during an examination.
7. Enforcement Actions A state may wish to impose a fine order remediation or take other appropriate enforcement action, including the suspension or revocation of a company’s certificate of authority.
D. New Statutes or Regulations Some problems may be addressed on a broader basis through rulemaking, legislative changes and the development of NAIC model laws. This is particularly important when the law has not kept pace with changing market conditions or when a practice has been identified that is perfectly legal, but is causing harm to consumers or disrupting the marketplace. If the issue is approached correctly, these situations need not necessarily result in conflicts between insurers and regulators—insurers may be willing to change the practice in question as long as they can be assured of a level playing field.

57
Appendix A: Catalog of Market Analysis Resources _________________________________________________________________________________________Below is a partial listing of additional resources which may provide information that is useful to market analysts. These resources include information from within your own Insurance Department, from the NAIC, from other regulatory sources, from the World Wide Web, from the insurance industry and from information available to the general public.
A. Resources Within Your Department Many of these resources, such as your consumer complaint resolution unit, have already been discussed in detail in the body of this handbook. Other key resources include:
• Market Conduct and Financial Examinations
• Financial Analysis: Since financial reporting and analysis information is shared with the NAIC, which assembles a wide range of data compilations on an interstate basis, the underlying financial data is discussed in the next section. An individual’s department’s financial and examination staff can provide valuable assistance in interpreting this information.
• Rates and Forms Information: A transition to electronic systems for rates and forms review will make it easier to track problems in this area. Tools such as the System for Electronic Rate and Form Filing (SERFF) and the Web posting of review standards provide a wide range of new data in formats that are more readily comparable across state and regional lines. The value of these new databases will be enhanced as participation in them increases among companies and state regulators. These systems will aid in indicating market trends such as an overall increase in premiums or changes in benefits by the submission of filing exclusions.
• Organized Intra-Department Communication: State departments are organized differently, but all perform a range of market regulation functions, from consumer assistance to agent licensing to rate and form review to market conduct exams to investigations and enforcement. As discussed, all these functions, as well as the financial regulation functions, generate useful information about market problems. An effective market analysis program must include clear procedures for regularly sharing data and other information among the various divisions of an insurance department. Recommended methods of sharing internal information include holding a monthly update meeting or by emailing issues that may be of concern or interest to other sections.
B. NAIC Databases, I-SITE Reports and Other Resources The NAIC systems contain a variety of data related to companies and individuals operating in the insurance industry. Insurance department personnel and NAIC staff are granted access to the NAIC databases through I-SITE. A regulator can inquire about a company or individual and readily identify which applications contain information about that entity. The NAIC provides many sources market analysis information to state regulators. In particular, summary reports are standard reports that provide a variety of Financial and Market Conduct information. Most of these reports provide information related to a group of entities with similar attributes (e.g., companies that write business in a particular state) rather than individual entities.
1. Market Analysis and Compliance Summary Reports • CDS Summary Index Report: The Complaint Database System (CDS) has been operational
since 1991. Although the CDS database is only available to regulators, information compiled from the CDS is now made available to the public through the NAIC’s Consumer Information Source (CIS). The CDS records complaint information identifying the type, reason and ultimate

59
disposition of all closed consumer complaints submitted to the NAIC by member states and territories. The Summary Index Report gives regulators the option to choose a grouping of companies with a designated line of business for a specific state(s), premium year and complaint year and calculates complaint indices relative to that group, along with the underlying complaint and premium data used to calculate the complaint index and complaint ratio. You may choose a comparison grouping of states, if desired.
• ETS Summary Report: The NAIC’s Examination Tracking System (ETS) is a valuable tool for learning about past examination results and for coordinating schedules of upcoming exams. The value of ETS will be enhanced as all states move to full participation and standard coding protocols are adopted. Enforcement actions and fines/forfeitures are also recorded in this system. Additionally, states can now use Personalized Information Capture (PICS) reports that notify examiners of market conduct activities that have been entered into ETS. For more detail on the PICS applications, please refer to section 6 within this Appendix. ETS is available to regulators only and has been operational since 1985. Information is maintained for both current and closed examinations of all types including financial, market conduct and combined examinations. This system facilitates automated examinations calls and provides centralized examination results. The system contains examination information for the previous five years. If there are inquiries as to examinations conducted beyond the five-year period, contact the NAIC help desk ([email protected]) or the chief market conduct examiner of the specific state that conducted the examination. The I-SITE ETS Summary Report provides a history of examinations called that match specified criteria. For example, you may run a report showing all market conduct examinations called in a specified state for a specified date range.
• RIRS Summary – Firms: The NAIC’s Regulatory Information Retrieval System (RIRS) provides public information on regulatory actions against insurance companies, agencies and individuals. RIRS has been operational as an electronic database since 1985 with information available to both regulators and the public. This system tracks adjudicated regulatory actions for companies, producers and agencies and can allow you to see, for example, whether a company has been the subject of enforcement actions in multiple states. The origin, reason and disposition of the regulatory action are recorded. The RIRS Summary Report generates a list of firms that have common elements, such as the same action state, a common penalty amount range or date range.
• RIRS Summary – Individuals: Similar to the Firm summary, generates a list of individuals that have common elements, such as the same action state, penalty amount range or date range.
• SAD Summary Report: A related database, the Special Activities Database (SAD) provides regulators with early warnings about questionable practices of insurance companies, agencies and individuals. SAD is available to regulators only and has been operational since 1989. In contrast to RIRS, which is publicly accessible and tracks only final actions, SAD records information regarding suspicious or investigative activities related to individuals and companies in the insurance industry. The value of RIRS and SAD will be enhanced as all states move to full participation in them. The summary report generates a list of entities with one or more common SAD activity elements, such as the same activity code or the activity within the same state.
• Filing Submission Status Report: The Filing Submission Status report provides a listing of received, missing or extended/waived financial filings for all companies of a specified data year and statement type. Companies can be selected based either on whether the company is domiciled, licensed or writing business in a particular state. The “Missing” Report lists all companies that meet the selection criteria specified and for which the NAIC has not yet received an expected filing or submitted a filing but failed a minimum standard validation, which prevented the filing from loading to the database. The Missing report excludes companies that have been waived from filing or have been given an extension to file with the NAIC. The “Received” Report lists all companies

that meet the selection criteria and for which the NAIC has received a filing. In addition to the information included on the Missing report, the Received report lists the date the filing was received and the type of filing (original or refile). The “Extended/Waived” Report lists all companies that meet the selection criteria and that have been waived from filing or have been given an extension to file with the NAIC. These reports include the Group Code, Company Code, Company Name and State of Domicile for the companies displayed.
• Schedule T Exceptions: This report provides a list of those companies whose Schedule T (state-by-state premium breakdown) does not match the State’s Code list Licensed information.
2. State Page Summary Reports State page reports are predefined, standard summary reports based on data from the Schedule T, state page and Credit Life and Accident & Health Experience Exhibit. Detail reports display data by company. Aggregate reports display the totals for all companies for a line or lines of business.
• Aggregate - Business in the State: This report shows aggregate figures (that is, the sum of all companies) by column for each line of business on the state page. One cannot select individual lines of business or combine lines.
• Aggregate - Market Share and Loss Ratio: This report indicates the market share by line of business and the relative loss ratio. The report is based on three columns on the state page. One can select individual lines of business or combine lines. The loss ratio is calculated excluding all Loss Adjustment Expenses (LAE).
• Aggregate - Accident & Health Loss Ratio: This report shows aggregate figures (that is, the sum of all companies) for three columns on the state page for Accident & Health lines of business (including Credit Accident & Health). One cannot select individual lines of business or combine lines. The last column of the report, Loss Ratio, enables one to determine a state’s total losses incurred compared to premiums earned for each lines of business. The Loss Ratio is calculated excluding all Loss Adjustment Expenses (LAE). Data for property and life companies is included.
• Aggregate - Credit Accident & Health Loss Ratio: This report shows aggregate figures (that is, the sum of all companies) for all Credit Life and Accident & Health business as reported on the Credit Life and Accident and Health Experience Exhibit. (Even though credit life is not written by property companies, the aggregate amount for credit life is included in the report.)
• Detail – Lines of Business (LOB): This report provides a list of premium information for each company and each line of business premiums by line of business, by company.
• Detail - Unlicensed Premiums: This report lists Life or Property companies that write business in your state but are not licensed. The report is based on Direct Premiums Written on the Schedule T for a particular state.
• Detail - Market Share and Loss Ratio: This report indicates the market share by line of business, by company as well as the relative loss ratio. The report is based on three columns on the state page. One can select individual lines of business or combine lines. The loss ratio is calculated excluding all LAE.
• Detail Premium - Business in the State: This report displays the six columns of data that appear on the state page for the type of companies you request (licensed, domiciled, etc.). One can select individual lines of business and combine lines. The totals line is always displayed.
• Detail Premium - Life Summary: This report provides a summary of key data on the life state page by company. To obtain a line-of-business breakdown of the data, use other reports on the system.

61
• Detail Premium - Annuity Considerations: This report provides premium information for life and annuity business written by life companies. The data is based on the state page and the report format resembles the life state page format. Each line of business applicable to life and annuity business is displayed in each report separately or combined into one report showing life, annuity and miscellaneous (write-in) business.
• Detail Premium - Accident & Health Net Premiums: This report shows net premiums for accident and health lines of business for companies in your code list. The report is based on two columns on the state page. You can include property companies or property and life companies combined.
• Market Share - Life & Annuity: This report indicates the market share by line of business, by company. The report is based on Direct Premiums or Annuity Considerations on the state page for the line of business you choose. One can select individual lines of business or the total.
• Market Share - Credit Accident & Health: This report indicates the market share for Credit Accident and Health business, by company, as well as the relative loss ratio. The report is based on the data provided by the Credit Life and Accident & Health Experience Exhibit. One can include data for life companies only or both life and property companies. The Loss Ratio is calculated excluding all Loss Adjustment Expensed (LAE).
• Market Share - Accident & Health: This report indicates the market share for all Accident & Health business by company, as well as the relative loss ratio. The report is based on three columns on the state page. You cannot select individual lines of business or combines lines. One can include data for life companies only or for both life and property companies. The Loss Ratio is calculated excluding all Loss Adjustment Expense (LAE).
• Market Share - Credit Life: This report indicates the market share by line of business, by company, as well as the relative loss ratio. The report is based on the Credit Life and Accident & Health Experience Exhibit.
3. Financial Analysis Summary Reports • Analyst Team Report: The Analyst Team Report replaces the Exam Team Synopsis previously
available for Life, Property and Fraternal companies, beginning with the 1999 data year. The process of reviewing the company has changed from the old exam priority status to an automated statistical analysis using Financial Analysis and Solvency Tracking (FAST) ratios and Risk-Based Capital ratios. Instead of an exam priority, the company receives an automated level (Level A or Level B) that will be reviewed by the analyst to determine if the level should change or remain the same. These reports improve on the Exam Team Synopsis by providing a clearly defined prioritization system and incorporating regulator analysis.
• IRIS Summary Report: This report provides IRIS ratio results for all companies of a specified business type and data year and can be compiled on the basis of state of domicile, state of licensure or state writing business. This report is only accessible to users with specific permissions enabled.
• Financial Analysis Handbook Summary: This report provides a count of automated “Yes” responses for each section of the NAIC Financial Analysis Handbook. The handbook is both an educational tool and a working reference, combining a hard copy manual with electronic means for performing analysis. The hard copy manual includes introductory sections, a financial analysis framework section and analyst reference guides. Analysis checklists are available in both hardcopy and electronic form.
• Scoring: The NAIC’s company scoring system provides a set of weighted financial ratios that allow an analyst to prioritize companies based on solvency concern. Scoring reports are available

for individual companies and a Scoring Summary report is also available for a specified group of companies. A Scoring Worksheet is also available, which provides details of each Scoring Ratio component for a single company. Individual Scoring reports, Scoring Summary reports and the Scoring Worksheet are available based on both Annual and Quarterly Statement information.
4. Company Financial Reports • “Financial Company Search” Overview: The annual statements are housed at the NAIC
[electronically] as well as in the Financial Regulation section of each department. All companies licensed to do business in a state must file a statement on a quarterly and annual basis. These statements can provide the regulator with a general overview of the business a company is writing. In addition, there are specific schedules and interrogatories that will provide very detailed information, such as premium volume, losses and changes in business. As discussed in the body of the handbook, this includes in particular the Exhibit of Premiums and Loss (“state page” or “Page 14/15”). I-SITE’s Financial Company Search mode allows regulators to prepare a wide variety of both standardized and customized reports focusing on specific information from the financial statements of a selected company or group of companies.
• IRIS Worksheet Report: The IRIS Worksheet displays IRIS ratio results specific to a company for a given year. It contains company demographic information, summarized IRIS ratio results and key annual statement information. In addition, this worksheet provides detailed IRIS ratio information, including the values of the inputs to each ratio’s calculation.
• Analyst Notes: The Analyst Notes application provides access to information entered by the NAIC analyst assigned to each company. These notes can include any pertinent information about a filing that is not captured by other means, such as records from telephone conversations, electronic mail messages, summaries of conversations with state regulators regarding a company’s filing, compliance, financial data reporting issues, etc. Analyst Notes allows one to reference any applicable information for a given company immediately online.
• Audit Trail: The Audit Trail application provides access to all changes that have been made to a company’s financial data and demographics information housed in the NAIC database. This application provides detailed information about why, when and who made the edit, insert or delete to the database. It allows one to directly reference the history of changes that were made to the financial or company demographics data. In addition, this data can be used to trigger an event that sends a message via the Personalized Information Capture System (PICS) regarding data changes.
• Code list: Code list allows users to view and/or update the licensing records of companies operating in their state. States can maintain current records to ensure the accuracy of licensing data in reports referencing this information. Users can search for companies meeting basic criteria or search for a specific company or companies. Once companies are retrieved, users with the necessary system privileges can view or update the current licensing records.
• Company Demographics: Company Demographics includes information from the company master file, which is an accumulation of data gathered from various forms of the annual and quarterly financial statements. The information includes company name, company code, financial data year, business type, filing status, filing type, other names, company contacts, all addresses, officers, filing by state and waivers and extensions. The Other Names information is retrieved from the Producer Database.
• Data Reference Manual: The Data Reference Manual utility details how the financial statement data is stored within the NAIC database tables. This utility includes the structures of the tables sorted by page number or table name, as well as additional non-financial information for companies. Company, IRIS and Financial Analysis Systems tables are also included.

63
• Filing at a Glance: The Filing-at-a-Glance report provides regulators the details of the status of an individual company’s filing. This report provides receive dates and whether the filing passed all minimum standards. Filing-at-a-Glance provides a quick look at the status of an annual or quarterly filing and eliminates the uncertainty regarding the availability of a filing.
• Line Reports: Line Reports provides the data from one line from a page of a financial statement for several companies (for example, “Total Assets” listed in the Current Year field of the Assets Page for all Fraternal companies domiciled in a specified state).
• Loss Reserves: Loss Reserve Analysis Report allows for the examination of a company’s losses in relation to their loss reserves. This information comes from Schedule P of a company’s annual statement and is available only for property companies.
• Pick-A-Page: The I-SITE Pick-A-Page Report provides financial information from selected pages of an insurance company’s annual or quarterly statement.
• Profiles: The Profile Report provides a snapshot of a company’s financial information for the previous five years. The Quarterly Profiles provide information for each quarter of the year for which you are requesting data. Profiles and Quarterly Profiles are available for companies that have filed Health, Life or Property statements.
• Validation Exceptions: The Validation Exceptions application provides information regarding errors related to an insurance company’s financial statement filing. Users may select any individual company and assuming the company has filed with the NAIC, validation exceptions associated with that filing are reported. These errors may have prevented the filing from loading to the database or they may provide an indication of data quality.
• View Documents: The View Documents application provides access to electronic documents stored by the NAIC for a specific filing. A printable version of a company’s data as filed is available. In addition, electronic access to free-form text portions of the annual statement filing is available. These include SVO Compliance, Statement of Actuarial Opinion, Management Discussion and Analysis and Annual Audited Financial Statements. The View Documents functionality is also utilized in the Consumer Information Source (CIS) to view the Annual Financial Statements.
5. Market Analysis Profile Reports In February of 2004, the NAIC released a new list of reports to use specifically for market analysis entitled market analysis profile reports. These reports pull data from other areas within I-SITE to create comprehensive reports without having to manually retrieve the data in multiple locations.
• State-Specific Premium Volume Written - 5 years: This report is a summary of the data on the Schedule T report for a five year period for the state of the user requesting the report for those companies filing a Property, Life, Health, Fraternal or Title annual statement. This differs from the Schedule T report under the Financial Company Search link as those reports are national in scope and each one is for a single specified year.
• Modified Financial Summary Profile - 5 years: This report is similar to the Profile reports similar to the Profile reports available under the Financial Company Search link for the state of the user requesting the report. They are limited to those companies filing a Property, Life or Health annual statement.
• Complaints Index Report - 5 years: This reports lists the index, complaint share, complaint count, market share and premiums written for the specified company for the state of the user requesting the reports for a five-year period. This report is available for all companies with an active NAIC cocode on the financial database.

• Regulatory Actions Report - 5 years: The Regulatory Information Retrieval System (RIRS) contains regulatory actions taken by participating state insurance departments. A summary of the RIRS information appears below the identifying demographic information. The actions are listed in reverse chronological order from the Action Date.
• Special Activities Report - 5 years: The Special Activities Database (SAD) contains information related to market activities and legal actions involving entities engaged in the business of insurance. The absence of data is not conclusive information that no market activities are or have been under investigation or that no legal actions have been taken against an entity.
• Closed Complaints Report - 5 years: The Closed Complaints Report displays the number of complaints selected for an entity or National Producer Number based on various complaint codes (Type, Reason and Disposition).
• ETS Summary Report - 5 years: The ETS Summary Report displays a history of exams called through the Exam Tracking System for the stated company over a five-year span.
• Modified IRIS Ratios Report - 1 year: The Modified IRIS Ratios Report contains a report similar to the IRIS Ratios available under the Financial Company Search, with just those ratios most important to market conduct regulators for those companies filing a Property or Life annual statement.
• Defense Costs Against Reserves Report - 5 years: The Defense Costs Against Reserves Report is available for Life and P&C companies containing the data from the financial statements related to defense costs incurred by the company over a five-year span. The data for Property companies comes from the state page. The data for Life companies comes from Exhibit 8, the Life Insurance Exhibit and Schedule F.
• State-By-State Premium & Company Licensing Info - 5 years: The State-By-State Premium & Company Licensing Info report compiles data from the Schedule T report over a five-year span for the state grouping selected for those companies filing a Property or Life annual statement. User may choose to get this information for all states or for one of the zone state groups.
6. Other NAIC Resources • Personalized Information Capture System: The Personalized Information Capture System
(PICS) allows one to set up a customized notification system for changes to the NAIC databases. When information changes within the scope of the profile a subscriber has created, an e-mail alert is sent. Events for which alerts are available include: Company Name Change, Group Code Change, Company Status Change, Financial Filings Available, Company Scoring, IRIS Results Summary, Key Financial Data Change, Analyst Team Level Assignment. There are even specific events designed for market conduct and these include: producer loss of resident license, Regulatory Action for producers licensed in a state, and six various events for tracking the status of examinations.
• Producer Database (PDB): The PDB contains license information relating to insurance producers and brokers. Data concerning disciplinary history, administrative actions, licensure status (resident and non-resident) and appointments are maintained.
• Uniform Certificate of Authority Application (UCAA) Summary Report: The UCAA process is designed to allow insurers to file a single basic application in multiple states for admission or for new lines of business. An summary report of UCAA filings is available on I-SITE.
• Specific Issuer-Schedule D Securities: This is an I-SITE summary report that provides a listing of all companies that own a particular security.

65
• The Information Systems Questionnaire (ISQ): The ISQ is approximately 47 pages in length and is contained in the NAIC’s Financial Examiners Handbook as Exhibit C-1. This is a very detailed questionnaire and it should be reviewed by a state prior to conducting a market conduct examination in order to avoid repetition. All licensed insurers are required to file an ISQ with their domestic state. This information is helpful not only for knowing the company’s current business affairs but has been a helpful when, during an exam or the closing of an exam, a company attributes its claim payment errors, for example, to a “computer problem.”
• Automobile Insurance Database: Contains information by state about auto insurance premiums and losses and the costs that affect auto insurance, such as hospitalization charges, auto theft and accident rates and insurance and traffic laws. 1994-1998.
• Credit Life and Accident & Health Experience by State 1998-2000: Using data obtained from the Credit Life and Accident Health Exhibit insurers file with the NAIC, this report provides tables summarizing, by state, credit life loss ratios and credit accident and health loss ratios. Three other tables provide information, by state, about credit life premiums and losses, credit accident and health premiums and losses and state credit insurance regulatory provisions.
• Credit Life and Accident & Health Insurance Loss Ratios 1998-2000: Lists life and accident/health companies by percentage of written premiums that are incurred losses. To aid in a quick reference, this report separates life companies from accident/health. Nationwide data reported by company name and loss ratios by direct premium.
• Homeowners Insurance Report 1998: Reports on homeowner, dwelling fire and tenant insurance. Contains a summary of market distribution and average cost by policy form and amounts of insurance. Provides specific information for each state. Subscribers can examine trends in homeowner policies written, amount of insurance and average premiums in each state.
• Insurers’ Distribution of Assets 1999: Shows how companies that file annual statements with the NAIC distribute their assets. Corresponds to the assets page of the annual statement and lists total dollars in each invested asset. Summaries of non-invested assets also included. Lists insurers alphabetically by name. Provides insurers’ total assets and a breakdown of assets, expressed as a percent of total assets, by category.
• Insurance Department Resources Report: State-by-state comparative report providing in-depth look at the resources of the 55 insurance departments. Information includes size of budget and staff, examination and oversight data, premiums written, number of agents/brokers and number of consumer complaints. Updated each November.
• Insurers’ Long-Term Mortgage Loan and Real Estate Investments in 1999: Identifies the following information for each insurer: total assets (excluding separate accounts for life/health insurers), total capital and surplus, total mortgages, total real estate, real estate and mortgages as a percent of assets, real estate acquired in the process of foreclosure, mortgages with interest more than three months overdue, mortgages in foreclosure, real estate and past due/in foreclosure as a percent of assets, real estate and mortgages as a percent of capital and surplus, net income on real estate as a percent of average book value of real estate and earned income on mortgages as a percent of average mortgages.
• Insurers’ Medium and Lower-Quality Bond Holdings in 1999: Contains reports for life, fraternal and property/casualty insurers, listing insurers alphabetically. Information includes amounts of lower-rated bonds each insurer holds, total bold holdings, total capital and surplus, total assets and lower-rated bonds as a percent of total assets.
• Long-Term Care Experience Report: Based on the long term care experience reporting Form B for the annual statement filed. Contains company specific experience for all forms combined, with

the experience segmented by calendar durance and company specific experience displayed on a form-by-form basis. Annual reports available since 1992.
• Managed Care in Auto Insurance: Survey and analysis of state responses to insurers’ attempts to introduce managed care concepts into auto insurance markets. Illustrates how managed care only makes sense when a state has a no fault law. Includes a chart of states allowing insurers to use managed care concepts. Analyzes discounts in Colorado, the state with the longest operational program.
• 2000 Market Share Reports for Groups and Companies: A reference tool for identifying the top 10 company groups for each annual statement line of business. Allows monitoring of increases and decreases in market share and overall size of the market and level of market concentration. (Relies upon 1999 data).
• Medicare Supplement Loss Ratios Report 2000: Data drawn from Medicare Supplement Insurance Expense Exhibits filed with NAIC. Exhibits identify direct premiums earned, market share, direct claims earned and loss ratios. Reports available since 1990, published annually.
• Insurers’ Profitability by Line by State: Statistics derived from state page data in the annual statement and the Insurance Expense Exhibit (IEE) can be used to compare profitability among different states and property/casualty lines. For each line and each state, presents aggregate statistics on premiums, losses, expenses, investment income and estimated profits for the preceding calendar year. Shows estimated underwriting profits and operating profits, as well as estimated federal taxes. Reports published each December.
• Raising the Safety Net: Risk-Based Capital for Life Insurance Companies: A valuable research tool for analyzing insurance industry trends. Provides an overview of development of risk-based-capital, explains the theory of risk-based-capital and reviews the risk-based-capital formula components and model law.
• Research Quarterly: NAIC research and statistical analysis reported quarterly. Provides a forum for discussing current regulatory issues. Contains feature length and shorted articles of interest to regulators and non-regulators involved with financial topics and market trends.
• State Average Expenditures & Premiums for Personal Automobile Insurance: Shows estimated state average expenditures and average premiums per insured vehicle for private passenger automobile insurance for 1995-1999. Statistics provide an approximate measure of the relative cost of automobile insurance to consumers in each state. Updated annually.
• Statistical Compilation of Annual Statement Information: Aggregated annual statement data for property/casualty and life/health insurance companies. Assists in the monitoring of market share, premiums and other select data.
• Statistical Compilation & Market Share Reports for HMOs and Accident & Health: Aggregated annual statement pages and data elements for all HMOs and companies that write accident and health insurance and file annual statements. Insurance Companies: Listing of all companies, provides company code and contact data on more than 5,000 property, life and fraternal insurers, as well as alien insurers and reinsurers included in NAIC database. Updated semi-annually.
• Statistical handbook of Data Available to Insurance Regulators: Describes the collection, compilation and reporting of insurance statistical information.

67
C. Other Regulatory Sources 1. Federal Regulators and Databases Expanded information sharing with federal regulators should assist both state and federal regulators in being more efficient and effective. States should do their part by reporting information to federal databases, such as the Healthcare Integrity & Protection Database and should pursue access to federal databases (e.g., the FBI database for producer licensing purposes). Your state should have ongoing arrangements with the various federal financial services regulators to share consumer complaint information arising out of cross-sector market activities.
2. Other States Many states require specific filings or reports in response to past problems. An inventory of such filings may produce valuable new information, as well as identify some filing requirements that have outlived their usefulness. It is very helpful to have ongoing e-mail and phone communications on companies and issues of common concern with your counterparts in other insurance departments, especially those in neighboring states or with specialized expertise on particular issues affecting your state.
3. Regulatory Meetings NAIC meetings and trainings seminars provide valuable opportunities to share information. The same is true for other forums, such as meetings of the National Conference of Insurance Legislators (NCOIL), the Insurance Regulatory Examiners Society (IRES), the Society of Financial Examiners (SOFE) and trade association meetings.
4. Other Regulatory Agencies Within Your State Insurance companies’ market conduct market regulators have areas of common concern with various other state agencies, including the agencies that regulate health care, workers’ compensation and consumer protection. These agencies can be valuable sources of information and assistance.
D. The World Wide Web The proliferation of insurance Web sites offers an increasingly valuable window into company practices and market trends. The NAIC Financial Examiner Handbook includes some discussion of Web pages. When reviewing a specific company, its Web site is an essential information source and producer websites also contain useful information. Some key Web sites of general interest to insurance regulators are:
1. www.naic.org
2. http://www.naic.org/state_contacts/sid_websites.htm – Within the NAIC site, but deserves special mention. This page provides access to every state insurance department site, to which you can link from either an alphabetical list or a U.S. map. This portal also provides access to several specific pages of interest.
3. http://i-site.naic.org – This direct link provides a more efficient I-SITE connection than the link from within the general NAIC site.
4. www.insure.com – A major insurance sales portal, offering consumer information as well as a vast number of marketing links.
5. www.sec.gov – the EDGAR database. Allows one to retrieve publicly available filing information submitted to the SEC from 1994 to present.

6. www.hoovers.com – business information, links to news, lists, stock quotes and company profiles.
7. www.ambest.com
8. www.standardandpoors.com
9. www.moodys.com
10. www.weissratings.com
11. www.fitchratings.com
12. www.acl.com
13. www.census.gov
14. www.findarticles.com
E. Industry Sources
1. Financial Rating Agencies Market analysts are encouraged to review rating changes over a period of five years for substantive changes. Many of the rating changes may be documented through industry and news periodicals so access to the individual rating systems may not be required. There are five major rating agencies currently evaluating insurers:
A.M. Best Company: A.M. Best has some rating information available on their Web site at www.ambest.com. The Web site explains the two types of ratings offered by this organization (Financial Strength Ratings and Debt Ratings). They also provide additional reports and publications that compile individual company and industry wide data.
Fitch Ratings: Fitch Ratings also has some rating information available on their Web site at www.fitchratings.com. This company also has two main types of ratings (Fixed Income Security Ratings and Insurer Financial Strength Ratings) explained on their website. Additional reports and publications are also available. Fitch also conducts rating reviews of other types of financial institutions and touts their analysis of global companies in the financial services industry.
Moody’s Investor Service: Moody’s Investor Service also has a Web site at www.moodys.com. Much of the Web site, including ratings are not available without a logon User ID. Moody’s also provides other financial service research and reporting services for worldwide organizations.
Standard & Poor’s: Standard & Poor’s has two types of ratings, both which are available via their website at www.standardandpoors.com A key area of review by S&P involves the assessment of an insurer’s ability to pay claims. Their rating focus leans toward the consumer purchasing insurance.
Weiss Ratings: Weiss ratings are only provided for a fee since they do not charge companies for company requested ratings (each of the other services collect fees for company initiated ratings). They do, however, maintain a list of the strongest and weakest insurers in the country on their Web site at www.weissratings.com.

69
2. Company Self-Audits Self-audits, when made available to regulators, can provide information about how particular market problems have been addressed on a voluntary basis. The growing use of self-audits and voluntary accreditation programs, such as the National Council on Quality Assurance (NCQA) and the Insurance Marketplace Standards Association (IMSA), has the potential of providing regulators important information about companies. Many of these organizations require companies to actively monitor their compliance practices and take appropriate corrective actions when necessary. This information can provide useful insights regarding a company’s commitment to establishing and maintaining a culture of compliance designed to continually improve their market conduct and compliance practices.
F. Public Information Sources 1. CEJ Data Guide In 1999, The Center for Economic Justice, a consumer advocacy group based in Austin, Texas, published A Consumer Advocate’s Guide to Getting, Understanding and Using Insurance Data. As explained in the introduction to this 40-page manual: “This handbook provides an introduction to the topic of auto and homeowners insurance data and ratemaking. This handbook attempts to serve as a tool kit for consumer advocates working on insurance issues by discussing the sources, uses and misuses of insurance data. Sections II through IV of the handbook provide background on homeowners and personal automobile insurance sales, markets and ratemaking. Section V discusses the sources of insurance data. Section VI provides a glossary of insurance data terms.”
2. Legal Actions Monitoring of litigation may alert regulators to issues that the regulatory system has not yet addressed. There are many class action Web sites available on the Internet.
3. Consumer and Community Groups Regular communication with consumer and community groups can help regulators identify and address issues of consumer concern. Educating consumers on insurance matters and where to report concerns can increase complaints among groups, identifying possible trends.
4. Trade Press/Research Papers Trade publications and academic research papers inform regulators about emerging issues and other regulatory concerns.

Appendix B: Navigating I-SITE _________________________________________________________________________________________
As explained in section II of the guide, the NAIC’s secure I-SITE utility is available to regulators at http://i-site-state.naic.org from any state insurance department network that has a direct connection to the NAIC network. This is the fastest connection, but if you are at a computer without a direct NAIC connection, I-SITE can also be accessed from any Web connection at http://i-site.naic.org or from the “Members” tab on the NAIC home page, http://www.naic.org. This appendix provides a step-by-step introduction, illustrated with two examples: a complaint index summary report and a company’s financial statement. This information is based on I-Site Version 11.1, released in April 2004, as viewed with Microsoft Internet Explorer.
To reach I-SITE from the NAIC home page, click on the “Members” tab. A drop-down menu will appear. Select I-SITE:
The I-SITE main page will display. In order to enter the I-SITE system, the NAIC Oracle User ID and password will need to be entered in the appropriate fields. Each state department has a systems administrator that is responsible for granting access to I-SITE and can obtain an ID and password for individuals that have not been set-up or might have forgotten their access information. Once the ID and password has been completely entered, select the desired login category to proceed.

71
Example 1: Complaint Index Summary Suppose you’re interested in seeing complaint index information for the homeowners market in Maine for the most recent year of business. This is a summary report.
Click the “Summary Reports” link after you type in your password:
The next screen will display the various types of summary reports available. As you mouse over the four broad categories – Market Conduct, state page, Scoring and Other – menus will display in the center of the screen listing the specific reports available in each category.
As you mouse over each link within one of these menus, a description of that report will display on the right side of the screen. The current link will be highlighted.
When you see the report you want, click that link. In this case, we’re looking for a CDS Summary Index Report, which is one of the Market Conduct reports:
Clicking on the CDS Summary Index Report link will display a Search Criteria screen. Initially, every state will be checked, as will all four zones and the “All” column on the right. Checking or unchecking

one of the zone boxes in the right-hand column will add or clear every state or territory in that NAIC zone.
To select only the state of Maine, begin by unchecking “All,” which will clear the entire list and then check “Maine.” You can also select another state or list of states for comparison purposes, in this case the Northeast Zone.
Once you have selected the state(s), then select the line of business, the complaint year and premium year (the default selection is the most recent year with complete data, which is 2002 at this writing) and the order in which you want the companies displayed.
After you have made your selections, scroll to the bottom of the screen and click the “Report” button:
In a few seconds, the report will display:

73
Example 2: Financial Statement Data For information on a particular company or on a list of companies meeting the criteria you determine, select Financial Company Search at the I-SITE main page after completing the NAIC Oracle UserID and password.
The first step is to select the company or companies you’re interested in. As seen on the next screen, a list of criteria you can use to define which companies are of interest appears in the right-hand pane. Some criterion fields open to drop-down menus. For the other criteria, you can select either a single value or a comma-separated list.
Note the “Show more search criteria” link. If you click it, the criteria menu expands to include business type, state, licensure status, business written, Schedule T, “Recognized As” (accredited reinsurer, accredited insurer or captive), group name(s), group code(s), FEIN(s), filing type, filing status, exam zone, analyst team level, nationally significant and country.
For purposes of this example, we will generate reports on a specific company. If you know the NAIC code, you can type that in the appropriate box. Otherwise, you can type the name or a key word within the name.
For example, type “anthem,” click the Search button and you will get a list of all companies with “Anthem” in their name:

The companies will appear grouped by statement type. You cannot combine different types within the same list.
Check one or more companies in one of the three lists and then click the Select button:
Initially, even after you have made your selection, you may get the NAIC Company Codes Returned in the left-hand pane. If so, get the search engine’s attention by clicking one of the sort preferences (alphabetical or by code).
Blanked out for privacy
Blanked out for privacy

75
Now the list of companies displayed in the company information frame will display sorted by company name.
Click on the desired company, this company should then display as highlighted. More than one company can be selected.
When reports are selected with multiple companies selected within the company frame, the reports will be generated for all of those companies selected.

Click on the link under the Financial section “Pick A Page”
For example, the “Pick A Page” link populates a list of all of the available pages from the company’s annual financial statement for the data year specified.
To change data year, select this drop down

77
Data Year: The data year will default to the most current annual statement year. To switch data years, simply change the drop down option for year located in the upper right hand corner of the screen. It may take a minute or so to refresh this new page to the newly selected data year.
Reports may be viewed, printed or downloaded.
To view a list of report for all of the companies specified, simply click on the blue link, name of the report and the pages will automatically generate.
To select multiple reports for printing, select the check box next to the page number. After all of the desired reports have been checked, click the save selected report link at the top of the active frame. This option will allow you to save this list of reports to use in the future.

These reports can be all viewed or printed at the same time or zipped into a compressed file format for storage. Please note that the limit to the number of files save for multiple printing is based on the memory capacity of your individual computer in tandem with your printer capacity.
The button allows users to save either a list of generated report(s) or a list of companies for later use. Click the dark blue “Preferences” link near the top of the screen.
Clicking the button will display a prompt screen so that the user can type in a name for the group of cocodes that is pertinent for their research.

79
To open a previously saved report or to generate a new report on a previously saved list of companies go back to Preferences and click the applicable Load button.

Example 3: Market Analysis Profile Reports There are four ways to get to the market analysis profile reports within the NAIC I-SITE application. The first option is to go through the Financial Company Search, a second option is to go into the Market Firm Search and there are two additional locations within the Exam Tracking System. For these examples, we will discuss the first two options. Both of these options are available from the I-SITE login page and also available on the common headers in many other screens within I-SITE.
Using the Market Firm Search From the I-SITE login page, enter the NAIC Oracle User ID and Password and select the Market Firm Search link.
The Market Firm Search will display. This page allows users to enter the known information about a company in order to search the NAIC market data. If the user knows the NAIC cocode, they may search by using that criterion. In the following example, the user only knew the company name.
They typed in the criteria into the respective slot and clicked on the Go button.

81
The screen that follows is the Lookup Results page. Many of the fields in the following image are blanked out to protect the privacy of the company used in the example. The image below is also captured from the testing database so realistic dates are not included.
From this page, the user could then identify the desired company and click on the market analysis profile link horizontal to the desired company.
Unlike the Financial Company Search, the Market Firm Search often has multiple examples of the same company. The market data is all linked together, but there are many ways to get to the same company’s data. This can be useful for finding companies who used to go by another name or were recently purchased.
Blanked out for privacy
Blanked out for privacy
Blanked out for privacy
Blanked out for privacy

Using the Financial Company Search From the I-SITE login page, enter the NAIC Oracle User ID and Password and select the Financial Company Search link.
On the Financial Reports page, enter the known criteria and click the Search button.
Select the desired companies by checking the boxes under the Cocode column and click the Select button.

83
Select the company, by highlighting it within the company frame and then click the Market Analysis Profile link.
Blanked out for privacy

Appendix C: NAIC Standard Closed Complaint Filing
Submission Form _________________________________________________________________________________________
The state departments of insurance use the following form to submit any closed consumer complaints to the NAIC. Please note that new fields are being added to this form in mid 2004.
New Closed Consumer Complaint Fields The following additional fields will be added to the Reason for the Complaint:
Category First Level
Code First Level Description Reason - Underwriting 0823 Health Status 0824 Pre-Ownership Underwriting 0831 Credit Scoring 0832 PIP Primacy 0833 Terrorism 0834 COBRA 0836 CLUE Reports 0837 MIB Reports Reason - Policyholder Service 1101 Inadequate Provider Network 1103 Class Action 1104 1035 Exchange 1106 PIP Primacy 1107 Surrender Problems 1108 Terrorism Reason - Marketing & Sales 0901 Terrorism 0902 Unfair Discrimination 0903 Suitability 0904 Financial Privacy 0906 Health Privacy 0909 Unauthorized Insurer 0911 Unauthorized Entity

85
Category First Level
Code First Level Description Reason - Claim Handling 1000 Adverse Benefit Determination 1001 Adjuster Handling 1002 Prompt Pay 1003 Willing Provider 1004 Provider Availability 1006 Preexisting Condition 1008 Total Loss 1009 Fraud 1011 Cost Containment PIP 1013 Comparitive Negligence 1014 Mold 1016 Lead 1018 Out-of-Network Benefits 1019 Co-pay Issues 1021 No Preauthorization 1024 Obesity Service 1026 PIP Primacy 1029 Terrorism 1031 Value Dispute 1032 Adjuster Not Responding 1033 Consumer Education Needed 1034 Timeliness
The following table displays the newly added Dispositions that will be available in mid 2004.
Category First Level
Code First Level Description Dispositions 1201 Policy Not in Force 1239 Referred to Another Department 1241 Referred to Rates/Contacts 1242 Referred to Market Conduct

Closed Consumer Complaint State Submission Form FIELDS SHADED ON THIS FORM MUST BE USED FOR REPORTING MEDICARE SUPPLEMENT COMPLAINT INFORMATION
THROUGH THE Complaints Database System (CDS).
State: State Complaint Number: Date Opened: __ __ / __ __ / __ __ __ __ Date Closed: __ __ / __ __ / __ __ __ __
M M D D Y Y Y Y M M D D Y Y Y Y
Complaint Against
Entity Name State ID: NAIC Entity Number: __ __ __ __ __ __
CoCode: __ __ __ __ __ AA/FEIN: __ __ - __ __ __ __ __ __ __ Entity Type Code: __ __ __ Function Code: __ __ __SSN: __ __ __ - __ __ - __ __ __ __ DOB: __ __ / __ __ / __ __ __ __ Phone: ( __ __ __ ) __ __ __ - __ __ __ __ M M D D Y Y Y Y
Address: ____________________________________________ City: ___________________ State: __ __ Zip: __ __ __ __ __ - ___ __ __ __
Complainant/Insured Information
Medicare Supplement Policy Type Code: ___ Standardized Medicare Supplement Benefit Plan Codes: A through J, O or P
Type of CoverageSelect only one (1) item from the first level of coverage listed; up to three (3) may be selected from the second level.
AUTO FIRE, ALLIED LINES & CMP
HOMEOWNERS
F I R S T 0105 Private Passenger 0205 Fire, Allied Lines 0305 Homeowners L E V E L 0107Group Private 0207 Crop/Hail 0307 Group Homeowners 0110 Commercial 0210 Commercial Multi- 0310 Farmowner/Ranchowner 0115 Motorcycle 0215 Credit Property 0315 Mobile Homeowner 0120 0217 Dwelling Fire 0317 Condo/ Town 0123 Motorsport 0218 Builder’s Risk 0318 Renters/Tenants 0124 Rental 0220 Other 0320 Other 0125 Other Second 0130 Liability 0225 Liability 0325 Liability Level 0135 Physical Damage 0230 Theft 0330 Theft 0137 Collision 0233 Windstorm 0333 Earthquake 0138 Comprehensive 0235 Fire - Real Property 0334 Flood 0140 Medical Payments 0240 Personal Property 0335 Fire - Real 0145 UM/UIM 0243 Residual Mkt./JUA Related 0336 Single Interest 0150 No-Fault/PIP 0245 Other 0337 Medical 0151 Personal Effects 0340 Personal 0152 Policy Proof of Interest 0341 Residual _____0153 Rental Reimbursement ACCIDENT & HEALTH _____0342 Replacement
Cost 0154 Towing 0505 Individual 0343 Loss of Use 0155 Residual Mkt./JUA 0510 Group 0344 Windstorm 0156 Physical Damage 0515 Credit 0345 Other 0157 Collision Damage 0517 Other 0158 Supplemental Liability 0520 Accident Only 0159 Personal Passenger 0525 Disability Income 0160 Other 0530 Health Only 0535 LIABILITY
LIFE & ANNUITY 0536 0605 General0405 Individual Life 0540 Long- 0610 Products
0410 Group Life 0541 Home 0615 Professional E 0415 Annuities 0543 Mental 0617 Umbrella 0417 Group Annuities 0545 Dental 0618 Directors & 0420 Credit Life 0546 0620 Other 0425 Accelerated Benefits 0547 Limited 0625 Employment 0430 Other 0548 0630 Excess Loss 0435 Accidental Death & Dismemberment 0549 0635 Medical 0440 Association 0550 0640 Pollution 0445 Equity Indexed 0551 Vision 0695 Other 0450 Fixed 0552 HIPAA 0455 Premium Waiver 0553 0460 Single Premium 0554 Pre- 0465 Term 0555 0470 Universal 0556 Self 0475 Variable 0557 0480 Whole 0558 HMO
0495 Other 0559 PPO 0560 Other
0705 Workers’ Compensation 0730 Mortgage Guaranty 0739 Bail Bonds 0710 Fidelity & Surety 0733 Boiler Machinery 0740 Extended Warranty & 0715 Ocean Marine 0734 PMI 0741 Federal Programs 0720 Inland Marine 0736 Surplus Lines 0742 Federal Crop 0725 Title 0737 Watercraft 0743 Federal Flood
Complainant Type Code:

87
0727 In Home/Incidental Business 0738 Aircraft 0745 Other
Reason for Complaint
UNDERWRITING POLICYHOLDER SERVICE CLAIM HANDLING MARKETING & SALES _____0805 Premium & Rating _____1105 Premium Notice/Billing _____1005 Unsatisfactory _____0905 Misleading Advertising _____0810 Refusal to Insure _____1110 Cash Value Settlement/Offer _____0907 Churning _____0815 Cancellation _____1113 Accelerated Benefits _____1007 Medical Necessity _____0908 Replacement _____0816 Nonrenewal _____1115 Delays/No Response _____1010 Post Claim Underwriting _____0910 Agent Handling _____0817 Countersignature _____1117 Information Requested _____1012 Subrogation _____0912 Internet Related _____0818 Credit Report _____1118 Policy Delivery _____1015 Denial of Claim _____0913 Fiduciary/Theft _____0819 Redlining _____1120 Premium Refund _____1017 Usual, Customary, _____0914 Failure to Place _____0820 Delays _____1121 Nonforfeiture Reasonable _____0915 Misrepresentation _____0821 Forced Placement _____1122 Viatical Settlement _____1020 Coordination of Benefits _____0916 Not Licensed _____0822 Audit Dispute _____1123 Payment Not Credited _____1022 PCP Referrals _____0917 Policy Delivery _____0825 Unfair Discrimination _____1125 Coverage Question _____1023 Utilization Review _____0918 Misappropriation of _____0826 Rate Classification _____1126 Access to Care _____1025 Delays Premium _____0827 Domestic Violence _____1127 Quality of Care _____1027 Experimental _____0919 Not Appointed w/Company _____0828 Rescission _____1128 Company/Agent Dispute _____1028 Assignment of Benefits _____0920 Twisting _____0829 Surcharge _____1129 Abusive Service _____1030 Cost Containment _____0921 Deceptive Cold _____0830 Endorsement/Rider _____1130 Other _____1035 Other Lead Advertising _____0835 Group Conversion _____0922 High Pressure Tactics _____0840 Continuation of Benefits _____0923 Duplication of Coverage _____0841 Medicare Supplement: Refusal to Insure During Open Enrollment Period _____0924 Rebating _____0842 Medicare Supplement: Refusal to Insure After Open Enrollment Period _____0925 Delays _____0845 Other _____0926 Misstatement on Application _____0927 Home Service _____0928 Misappropriations _____0929 Fraud/Forgery _____0930 Other
Disposition
_____1205 Policy Issued/Restored _____1240 Referred to Proper Agency _____1275 Apparent Unlicensed Activity _____1207 Advised Complainant _____1243 Appointed _____1277 Deductible Refunded _____1208 Compromised Settlement/Resolution _____1244 Licensed _____1278 Forfeiture _____1210 Additional Payment _____1245 Advertising Withdrawn/Amended _____1280 Referred for Disciplinary Action _____1215 Refund _____1250 Underwriting Practice Resolved _____1285 Question of Fact _____1217 Entered into Arbitration/Mediation _____1253 Information Furnished/Expanded _____1287 Rating Problem Resolved _____1220 Coverage Extended _____1255 Delay Resolved _____1290 Contract Provision/Legal Issue _____1223 Unable to Assist _____1257 Fine _____1293 Company in Compliance _____1225 Claim Reopened _____1260 Cancellation Notice Withdrawn _____1295 Company Position Upheld _____1227 Cancellation Upheld _____1228 Nonrenewal Upheld _____1297 Endorsement Processed _____1230 Claim Settled _____1265 Nonrenewal Notice Rescinded _____1300 No Jurisdiction _____1233 Filed Suit/Retained Attorney _____1267 Nonforfeiture Problem Resolved _____1303 Recovery _____1235 No Action Requested/Required _____1270 Premium Problem Resolved _____1305 Insufficient Information _____1273 ERISA Compliant _____1310 Other
Submit completed Complaint forms to the NAIC – Market Information Systems:
Mail to: 2301 McGee, Suite 800, Kansas City, MO 64108-2604 OR Fax to: NAIC –Enterprising Data Services at (816) 460-7510

Entity Type Codes
FRM Firms IND Individual
Entity Function Codes
ADJ Adjuster/Appraiser JUA Joint Underwriting Association REI Reinsurance Intermediary AIR Alien Insurer or Reinsurer KEE Key Employee RPG Risk Purchasing Group BBA Bail Bond Agency MET MEWA or Multiple Employer Trust RRG Risk Retention Group BOG Bogus MGA Managing General Agent SEC Secretary CAI Captive Insurer OFF Officer SEI Self Insured CEO Chief Executive Officer OTH Other STF State Fund COO Chief Operating Officer PAJ Public Adjuster TAG Title Agency DIT Director of Trustees PFC Premium Finance Company TPA Third Party Administrator EMP Employee PPO Preferred Provider Organization TRE Treasurer HCP Health Care Provider PRE President UDI U.S. Domiciled Insurer HMO Health Maintenance Organization PRI Principal or Owner UNK Unknown INC Insurance Consultant PRO Producer (agent, broker, solicitor, etc.) URO Utilization Review Organization VIP Vice President
Function Codes: Relation to Entity Type
IND FRM EITHER CEO AIR * ADJ * If ARIS number provided, AIR is the default COO BBA BOG function code EMP CAI DIT KEE HMO HCP ** If CoCode is provided, UDI is the default OFF JUA INC function code PRE MET MGA SEC PFC OTH *** If no function code is provided, UNK is TRE PPO PAJ the default function code VIP RPG PRI RRG PRO SEI REI STF TPA TAG URO UDI ** UNK ***
Standard Abbreviations
AMER American CORP Corporation NATL National ASSN Association INC Incorporated MGT Management ASSOC Associate (s) INS Insurance MUT Mutual ASSR Assurance INTL International PSHIP Partnership CO Company LTD Limited REINS Reinsurance
2-Letter State Abbreviations
AL Alabama HI Hawaii MO Missouri PR Puerto Rico AK Alaska ID Idaho MT Montana RI Rhode Island AS American Samoa IL Illinois NE Nebraska SC South Carolina AZ Arizona IN Indiana NV Nevada SD South Dakota AR Arkansas IA Iowa NH New Hampshire TN Tennessee CA California KS Kansas NJ New Jersey TX Texas CO Colorado KY Kentucky NM New Mexico UT Utah CT Connecticut LA Lousisana NY New York VT Vermont CN Canada ME Maine NC North Carolina VI Virgin Islands DE Delaware MD Maryland ND North Dakota VA Virginia DC District of Columbia MA Massachusetts OH Ohio WA Washington FL Florida MI Michigan OK Oklahoma WV West Virginia GA Georgia MN Minnesota OR Oregon WI Wisconsin GU Guam MS Mississippi PA Pennsylvania WY Wyoming

89
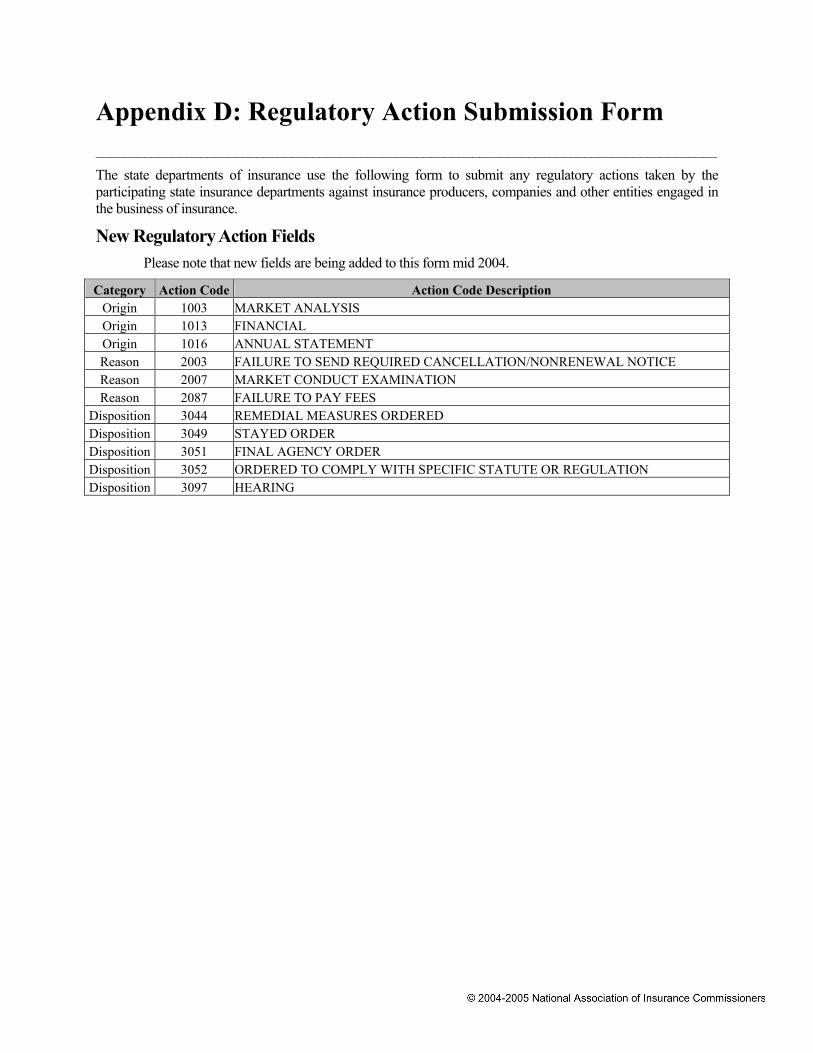
Appendix D: Regulatory Action Submission Form _________________________________________________________________________________________
The state departments of insurance use the following form to submit any regulatory actions taken by the participating state insurance departments against insurance producers, companies and other entities engaged in the business of insurance.
New Regulatory Action Fields Please note that new fields are being added to this form mid 2004.
Category Action Code Action Code Description Origin 1003 MARKET ANALYSIS Origin 1013 FINANCIAL Origin 1016 ANNUAL STATEMENT Reason 2003 FAILURE TO SEND REQUIRED CANCELLATION/NONRENEWAL NOTICE Reason 2007 MARKET CONDUCT EXAMINATION Reason 2087 FAILURE TO PAY FEES
Disposition 3044 REMEDIAL MEASURES ORDERED Disposition 3049 STAYED ORDER Disposition 3051 FINAL AGENCY ORDER Disposition 3052 ORDERED TO COMPLY WITH SPECIFIC STATUTE OR REGULATION Disposition 3097 HEARING

91
RIRS Submission Form ENTITY INFORMATION
Entity name, address and a numberic identifier (CoCode, AA/FEIN, SSN, Entity Number or National Producer Number) are required.
Entity Name: State ID: (for Individual Name key in Last Name, First Name, Middle Name and Suffix if available)
NAIC Entity No: NAIC CoCode: AA/FEIN: -
Entity Type Code: (select one)
FRM
IND
Entity Function Code: (listed on back)
( ) DOB
SSN
- -
Addr:
Line 2 Addr:
Line 3 Addr:
City: State: Zip: - Phone: ( ) -
REASON FOR ACTION Check at least one item in the section below – maximum 20
(2005) Underwriting (2040) Failure to Timely File (2075) Failure to report other state action
(2010) Marketing & Sales (2042) Failure to Pay Child Support (2080) Dissolution
(2012) Life Insurance Replacement Violation (2045) Rebating (2085) Failure to pay tax
(2014) Misrepresentation of Insurance Product/Policy (2050) Rate Violation (2090) Failure to pay fine
(2015) Claim Handling (2053) Use of Unapproved Forms (2095) Failure to pay assessment
(2020) Policyholder Service (2055) No License (2097) Bail Bond Forfeiture Judgement
(2025) Advertising (2056) Demonstrated Lack of Fitness or Trustworthiness (2100) No Certificate of Authority
(2026) Premium Finance Act Violation (2058) Misstatement on Application (2101) Certification Violation
(2027) Surplus Lines Violation (2059) Failure to Make Required Disclosure on application (2102) Unauthorized Insurance Business
(2028) TPA Violation (2060) Not Appointed (2103) Fiduciary Violation
(2029) Unfair Insurance Practices Act Violation (2061) Selling for Unlicensed Insurer (2104) Failure to Remit Premiums to insurer
(2030) Failure to meet Continuing Education Requirements (2062) Allowed Business from Agent Not
Appointed/Licensed (2105) Misappropriation of Premium
(2032) Continuing Education Requirements Met (2063) Employed Unlicensed Individuals (2106) Forgery
(2035) Failure to Respond (2064) Paid Commissions to Unappointed Agents (2107) Criminal Record/History
(2036) Late or Incomplete Response (2065) Notice of Financial Impairment from another state (2108) Criminal Proceedings
(2037) Failure to Notify Department of Address Change (2070) Financial Impairment (2110) Reconsideration
(2038) Failure to Comply with Previous Order (2072) Cure of Financial Impairment (2115) Other (enter up to 50 char)
(2039) Failure to Maintain Books & Records (2074) Other States Action
* if checked you must enter description.

Continue form on reverse side DISPOSITION Check at least one item in the chapter below – maximum 4
(3001) License, Denied (3028) Certificate of Authority, Expired (3065) Show Cause
(3003) License, Suspended (3029) Certificate of Authority, Probation (3070) Re-exam
(3004) License, Cancelled (3031) Certificate of Authority, Reinstated (3075) Rescission of
(3006) License, Revoked (3034) Certificate of Authority, Surrendered (3076) Involuntary Forfeiture
(3009) License, Probation (3036) Certificate of Authority, Other (enter up to 50 char)
(3078) Restitution
(3010) License, Conditional
(3079) Suspended from writing new business; renewals ok
(3011) License, Supervision (3042) Cease and Desist from Violations (3080) Supervision
(3012) License, Reinstatement (3043) Cease and Desist from all Insurance Activity
(3085) Rehabilitation
(3013) License, Granted (3045) Consent Order (3090) Liquidation
(3014) License, Surrendered (3046) Stipulated Agreement/Order (3095) Conservatorship
(3015) License, Voluntarily Surrendered
(3047) Previous Order Vacated (3100) Receivership
(3016) License, Other (50 Char)
(3048) Ordered to provide requested information
(3101) Ancillary Receivership
(3021) Certificate of Authority, Denied
(3050) Temporary Restraining Order (3102) Monetary Penalty
(3023) Certificate of Authority, Suspended
(3055) Reprimand (3103) Aggregate Monetary Penalty
(3025) Certificate of Authority, Suspension Extended
(3060) Hearing Waiver (3104) Settlement
(3026) Certificate of Authority, Revoked
(3105) Other (you must enter up to 50 char)
Complete as needed
( ) (If DAYS, enter number of days) Time or Length of Order: * Length of time required for Suspensions, Probations
Penalty/Fine/Forfeiture $ Enter amount in whole dollars only. Do not use punctuation.
Required, please complete Action Date: Effective Date: File Reference #
CONTACT INFORMATION
Required, Please complete.
Action State Contact Name: Last First: MI:
Phone: ( ) - e-mail address:
ENTITY FUNCTION CODES Code Description Code Description Code Description ADJ Adjuster/Appraiser KEE Key Employee RRF Risk Retention Group AIR Alien Insurer/Reinsurer MET MET/MEWA SCY Security CAI Captive Insurer MGA Managing General Agent SEC Secretary CEO Chief Executive Officer OFF Officer SEI Self Insured COO Chief Operating Officer OTH Other STF State Funded DIT Director/Trustee PFC Premium Finance Co. TPA Third Party Administrator EMP Employee PRE President UDI U.S. Domiciled Insurer HCP Health Care Provider PRI Principal/Owner UNK Unknown HMO Health Maintenance Org. PRO Producer (agency, brokerage etc) URO Utilization Review Org. INC Insurance Consultant REI Reinsurance Intermediary VIP Vice President JUA Joint Underwriting Assoc. RPG Risk Purchasing Group
Mail completed form to: NAIC, RIRS, 2304 McGee Suite 800 Kansas City, Mo 64108 Or Fax completed form to: NAIC, RIRS, 816.460.7510 or e-mail to: [email protected] (Re: RIRS)

![Handbook [Sensory Analysis Workshop]](https://static.fdocuments.us/doc/165x107/545f1515b1af9f85238b4bf1/handbook-sensory-analysis-workshop.jpg)