Market Analysis for Effective Food Security Programming IFADC May 7, 2012 Prepared by USAID-BEST...
35
Market Analysis for Effective Food Security Programming IFADC May 7, 2012 Prepared by USAID-BEST Project/Fintrac Inc.
-
Upload
seth-ashwood -
Category
Documents
-
view
215 -
download
0
Transcript of Market Analysis for Effective Food Security Programming IFADC May 7, 2012 Prepared by USAID-BEST...

Market Analysis for Effective Food Security
Programming
IFADC
May 7, 2012
Prepared by USAID-BEST Project/Fintrac Inc.

• Theory: Key Elements & Approaches
• Practice: Challenges & Insights
• Q&A
2012 IFADC: Market Analysis Overview
Fintrac/USAID-BEST Ethiopia Study, 2010

Food Aid: Intervention Tools
To improve food security for vulnerable populations, donors can use a number of food aid tools:
º Direct distributionº Monetizationº Local or regional procurement
(LRP)º Cash transfersº Vouchers
Fintrac/USAID-BEST Zimbabwe Study, 2012

We want to maximize food security impact, and maximize efficient use of scarce resources
We don’t want to risk hurting the very people we are trying to help, by:
º Encouraging dependencyº Putting people out of businessº Competing with farmers for laborº Supporting corruptionº Supporting uncompetitive marketsº Creating inflation
Market Analysis to Maximize Impact & Efficiency, Minimize Risk
Fintrac/USAID-BEST Guatemala Study, 2011

How Does the Market View Food Aid?
Distributed food aid:º An increase in the local food
supplyº An (in-kind) income transfer to a
household
Monetized food aid:º An (ad hoc) increase in the local
food supply induced by a non-commercial market actor
Local procurement of food aid/cash/vouchers:
º An (ad hoc) increase in demand for the local food supply
Fintrac/USAID-BEST Guatemala Study, 2011
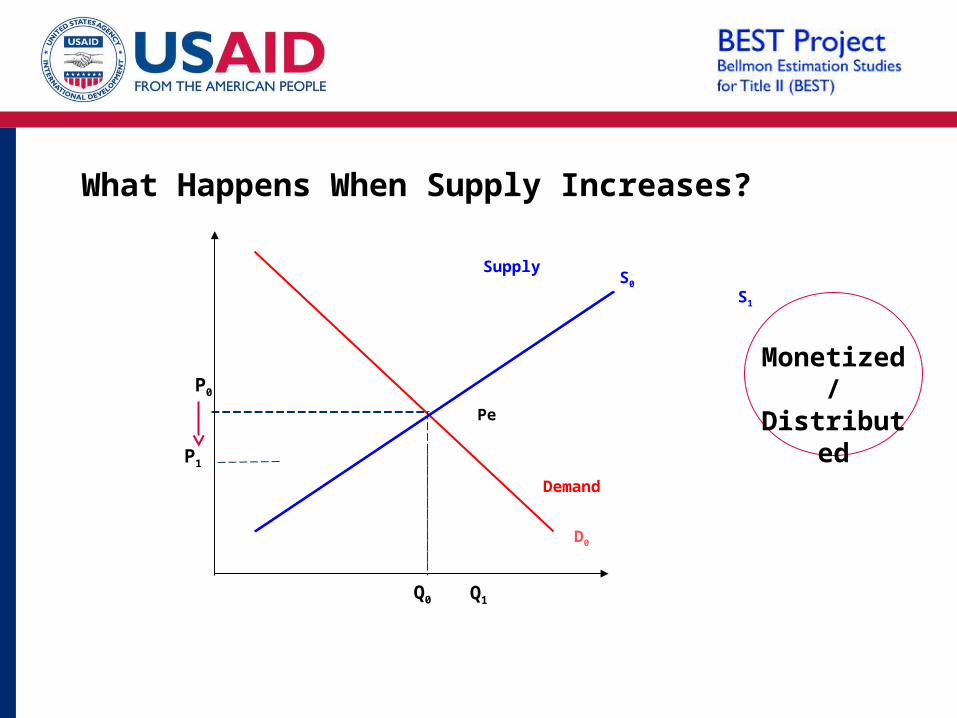
What Happens When Supply Increases?
Fintrac/USAID-BEST Ethiopia Study, 2010Fintrac/USAID-BEST Zimbabwe Study, 2012
Quantity supplied or demanded
Supply
Price
Pe
S0S1
P0P0
Q0 Q1
Q1
Demand
P0P1
Q0
Q1
Monetized/
Distributed
D0
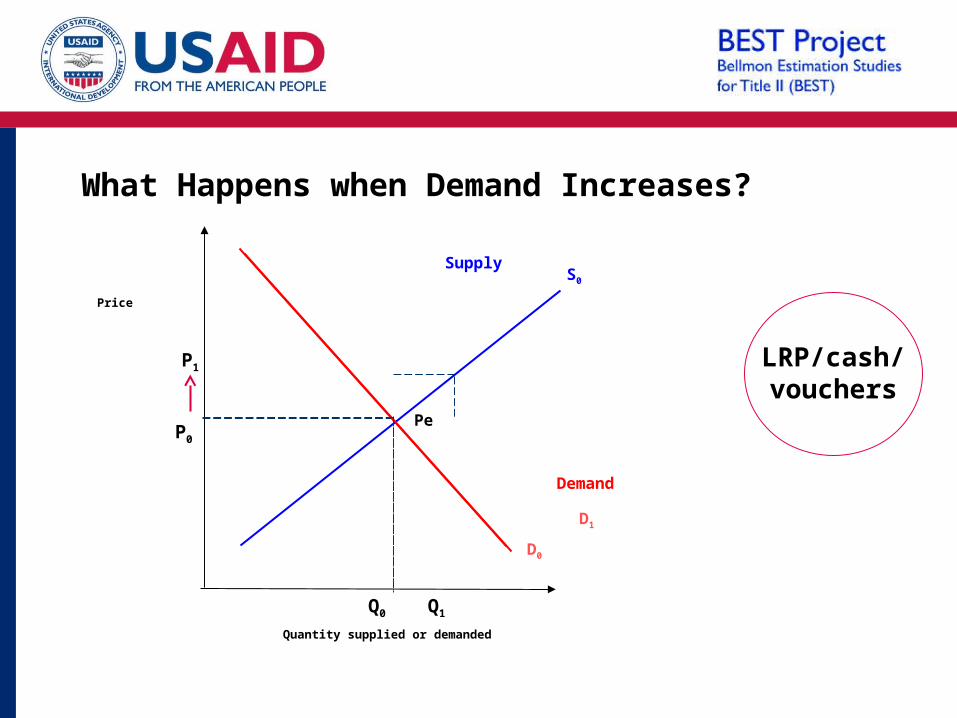
What Happens when Demand Increases?
Fintrac/USAID-BEST Ethiopia Study, 2010Fintrac/USAID-BEST Zimbabwe Study, 2012
Quantity supplied or demanded
Demand
Supply
Price
Pe
S0
P0
P1
Q0 Q1
D0
D1
LRP/cash/
vouchers
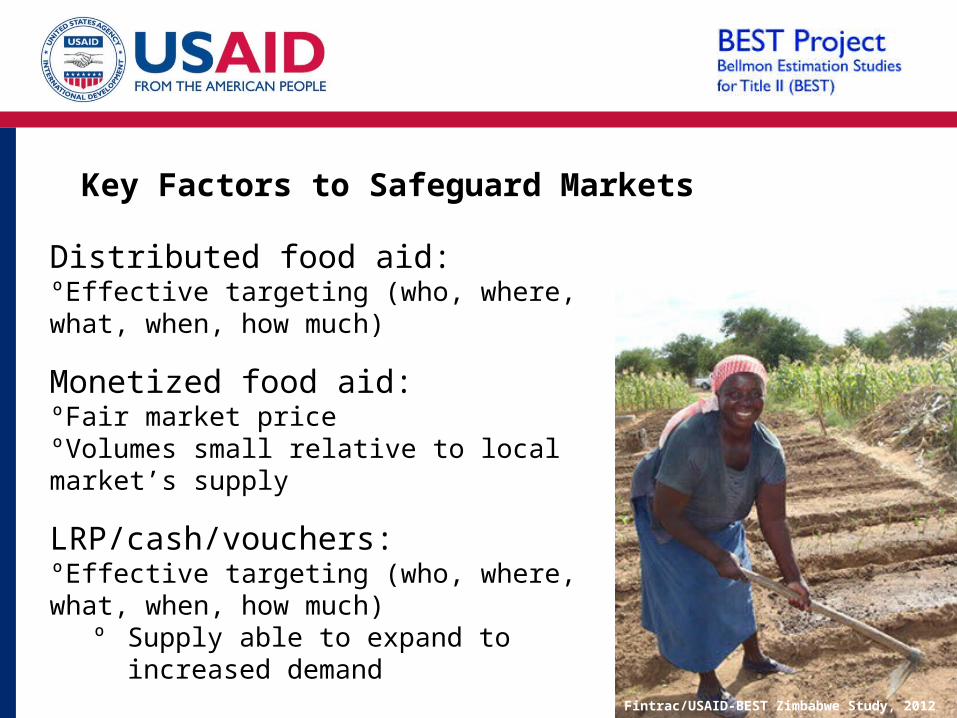
Key Factors to Safeguard Markets
Distributed food aid: ºEffective targeting (who, where, what, when, how much)
Monetized food aid: ºFair market priceºVolumes small relative to local market’s supply
LRP/cash/vouchers:ºEffective targeting (who, where, what, when, how much)
º Supply able to expand to increased demand
Fintrac/USAID-BEST Zimbabwe Study, 2012
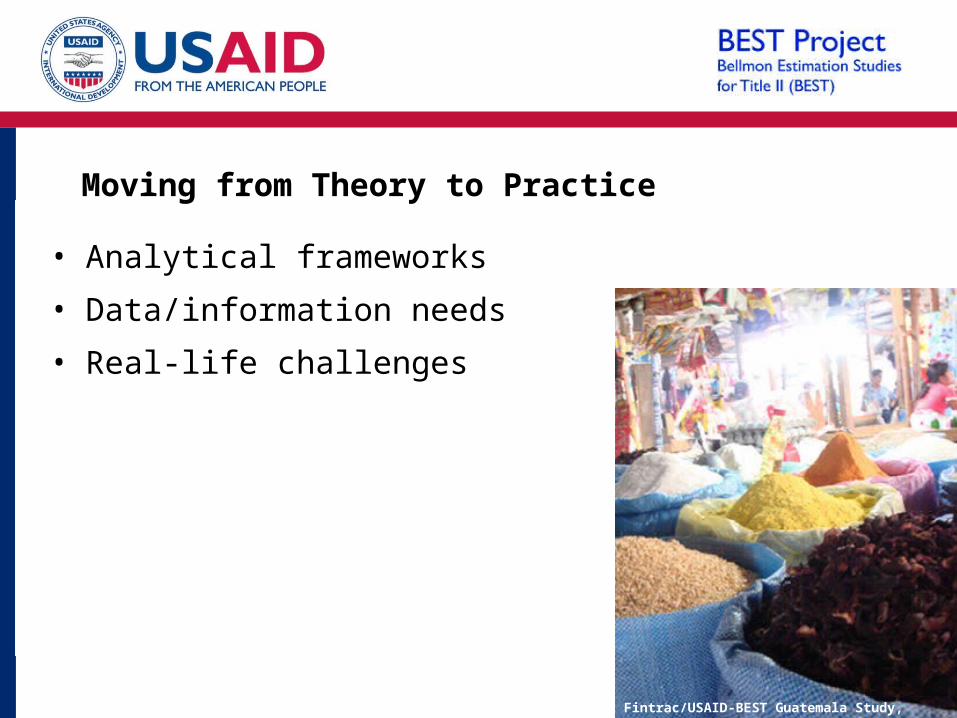
Moving from Theory to Practice
• Analytical frameworks
• Data/information needs
• Real-life challenges
Fintrac/USAID-BEST Guatemala Study, 2011
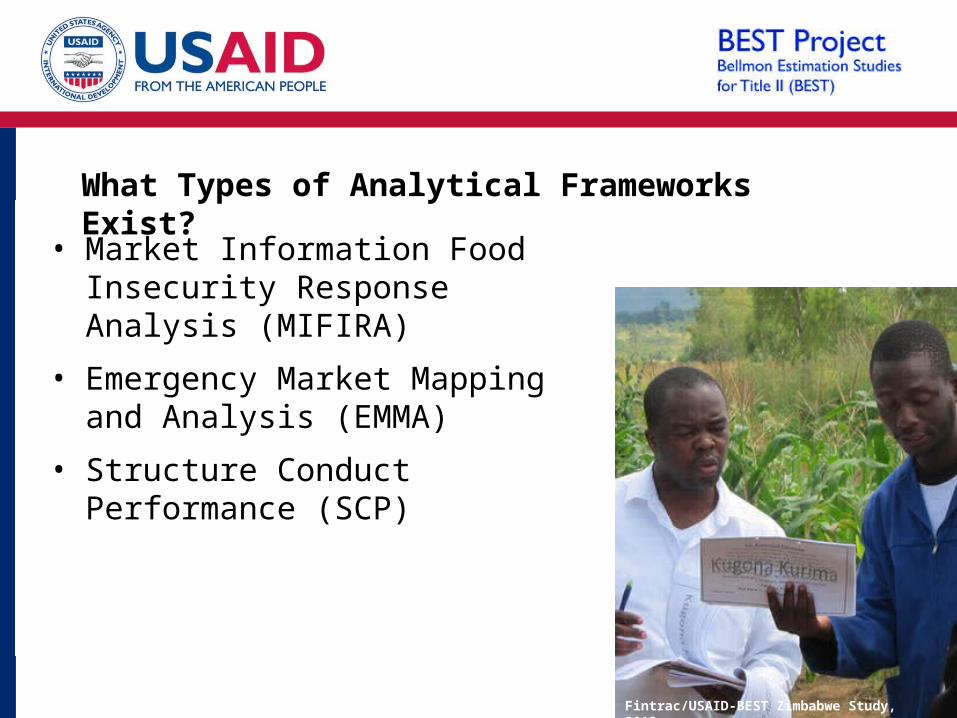
What Types of Analytical Frameworks Exist?
• Market Information Food Insecurity Response Analysis (MIFIRA)
• Emergency Market Mapping and Analysis (EMMA)
• Structure Conduct Performance (SCP)
Fintrac/USAID-BEST Zimbabwe Study, 2012
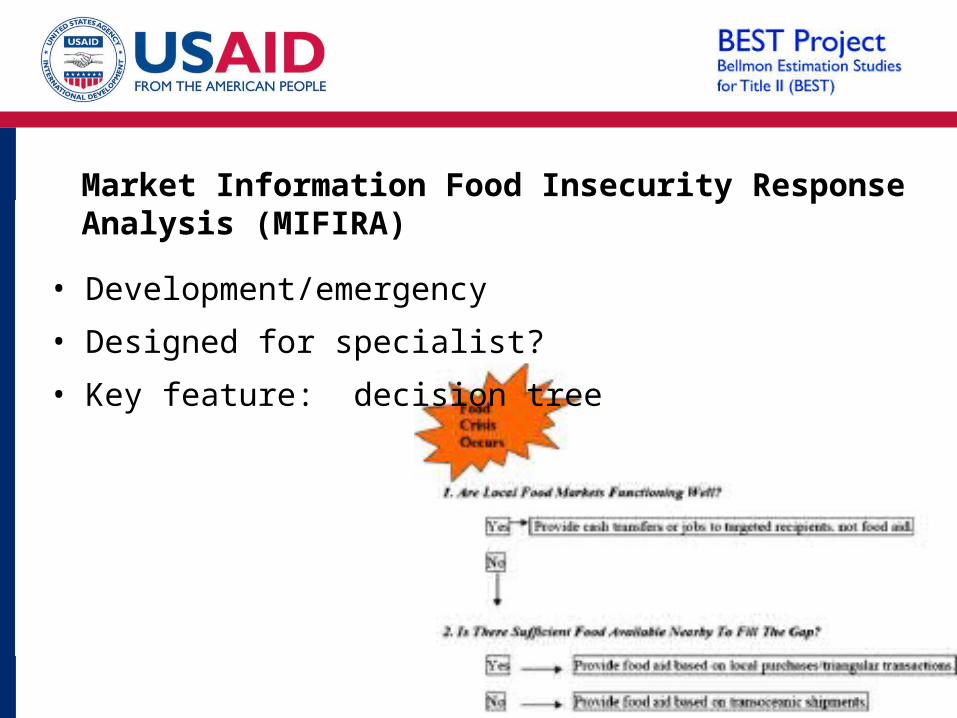
Market Information Food Insecurity Response Analysis (MIFIRA)
• Development/emergency
• Designed for specialist?
• Key feature: decision tree
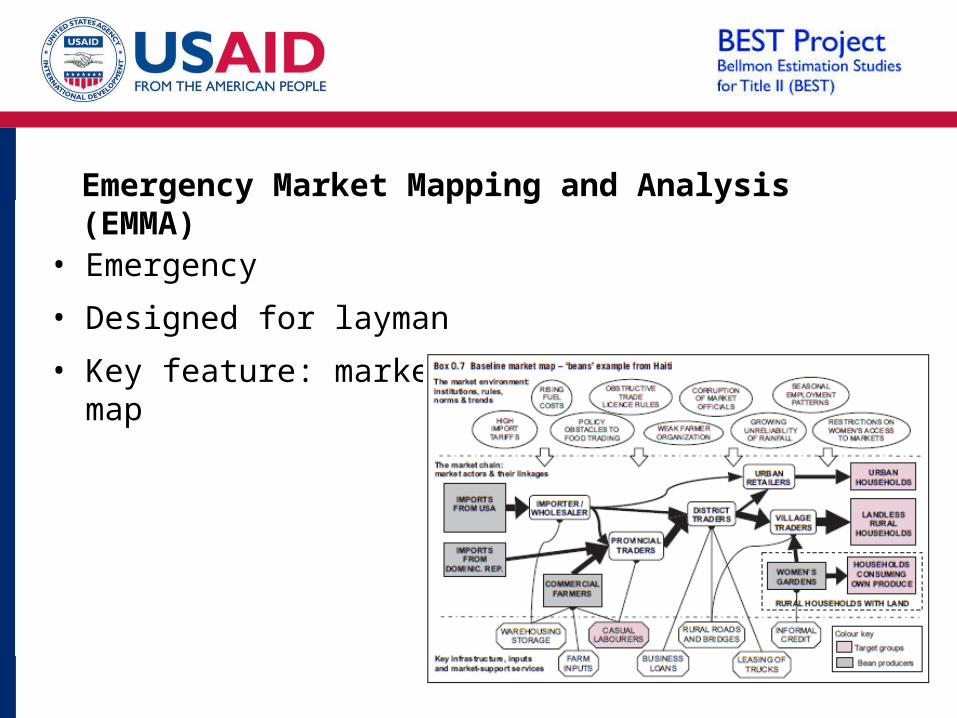
Emergency Market Mapping and Analysis (EMMA)
• Emergency
• Designed for layman
• Key feature: market map
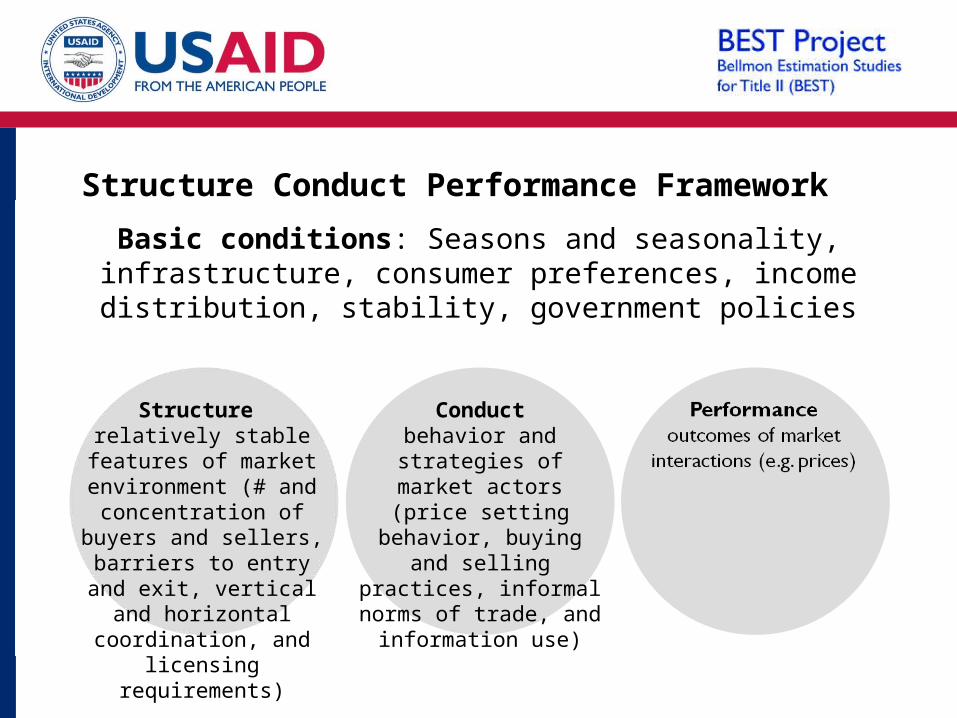
Structure Conduct Performance Framework
Basic conditions: Seasons and seasonality, infrastructure, consumer preferences, income
distribution, stability, government policies
Conductbehavior and
strategies of market actors (price setting behavior, buying and
selling practices, informal norms of
trade, and information use)
Structure relatively stable
features of market environment (# and
concentration of buyers and sellers,
barriers to entry and exit, vertical and
horizontal coordination, and
licensing requirements)
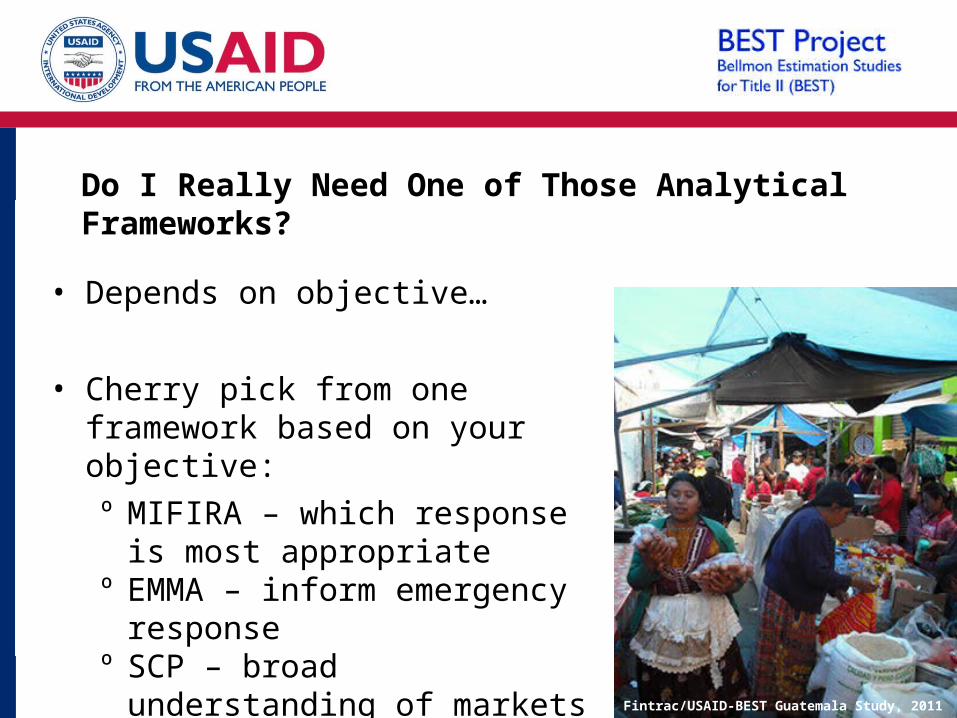
Do I Really Need One of Those Analytical Frameworks?
• Depends on objective…
• Cherry pick from one framework based on your objective:º MIFIRA – which response is
most appropriateº EMMA – inform emergency
responseº SCP – broad understanding
of marketsFintrac/USAID-BEST Guatemala Study, 2011

What Do We Need to Know, and Where Do We Find It?• Household needs (demand)• How local markets ‘work’ (supply, demand, price
formation)
• Primary sources• Secondary sources
Secondary• Vulnerability assessments,
livelihood profiles, consumption and expenditure surveys
• Crop assessments• Trade statistics• Price monitoring: gov’t,
FEWS, WFP, FAO, etc.
Primary• Formal and informal
surveys of market actors (producers, traders, wholesalers, retailers, consumers) – esp. producer and trader conduct

How Do We Get the Information We Need?
• Desk researchº Existing market analyses
including past Bellmon analyses, food security reports
º Prices, production, trade, and food aid data from international and local data collection systems
• In-field researchº Interviews with private sector,
various levels of government, communities, NGOs, and UN agencies
º Market visitsFintrac/USAID-BEST Zimbabwe Study, 2012

What we’ve covered:
Basic principles Analytical framework General data/information needs
So, now what?
•Practical challenges translating theory into practice

Practical Challenge
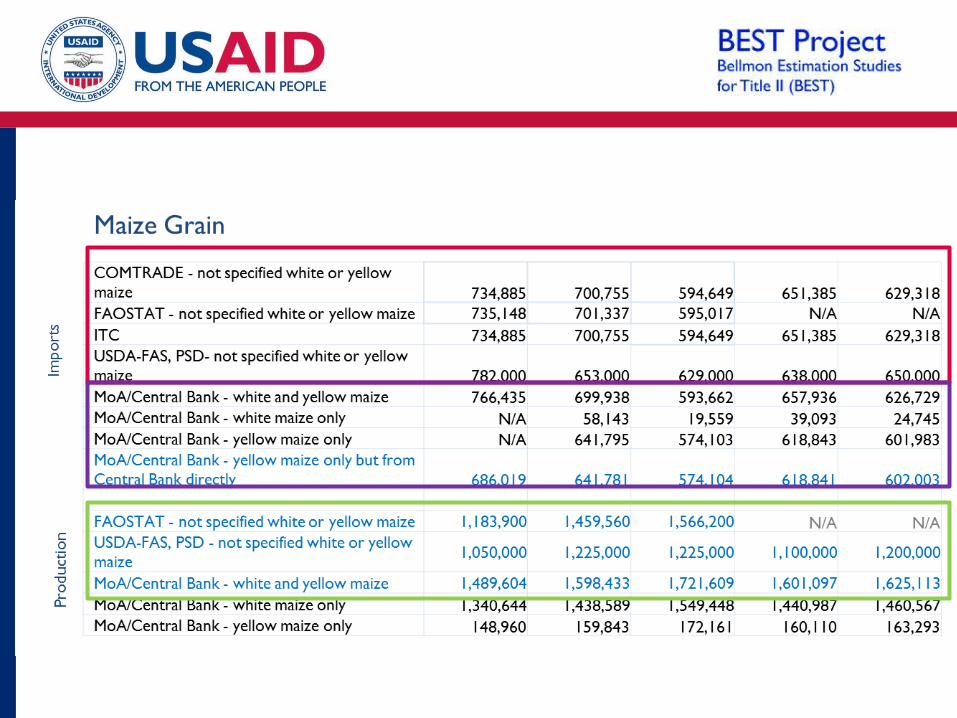
• Production, trade, and food aid data from desk research are often unreliable or incomplete

Production
• Lack of resources to conduct frequent assessments
• Sometimes politicized• Validation in field is critical, but also
imperfect

Imports
• Lack of resources to monitor and report• Importers’ incentive to evade customs
duties

Food Aid
• Not all donors report to online databases• Among donors who report, reporting is often
inconsistent • FY vs CY vs MY• Does not specify whether monetized or
distributed food aid

Practical Challenges
• Commodity markets are complex.
Fintrac/USAID-BEST Haiti Study, 2011

• Questions So Far?
Market Analysis: Piece of Cake, or Piece of Work?
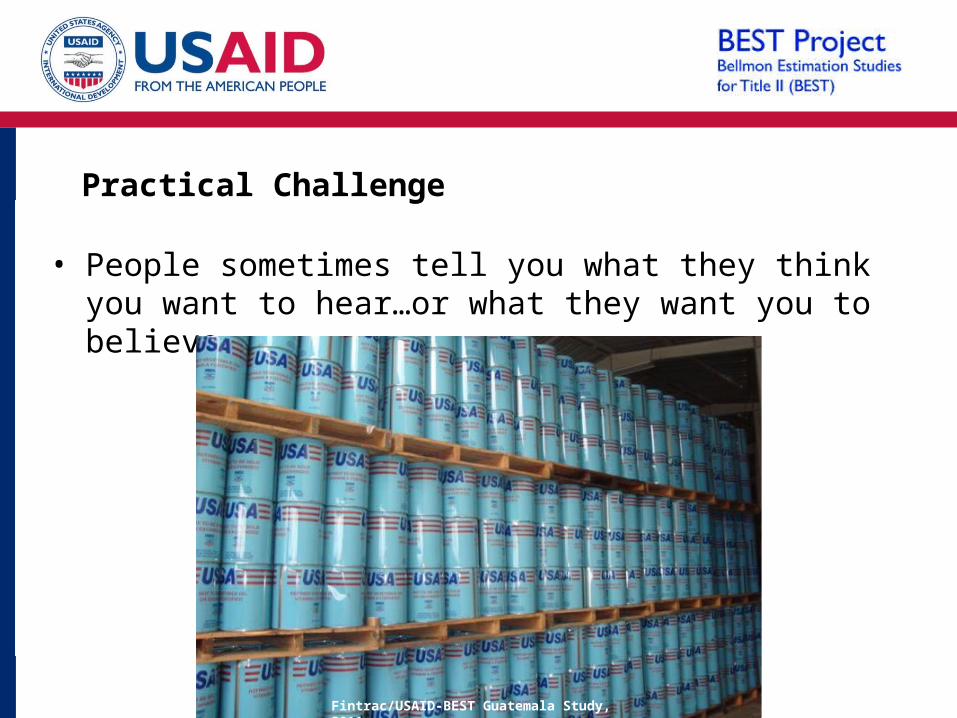
Practical Challenge
• People sometimes tell you what they think you want to hear…or what they want you to believe.
Fintrac/USAID-BEST Haiti Study, 2012
Fintrac/USAID-BEST Guatemala Study, 2011
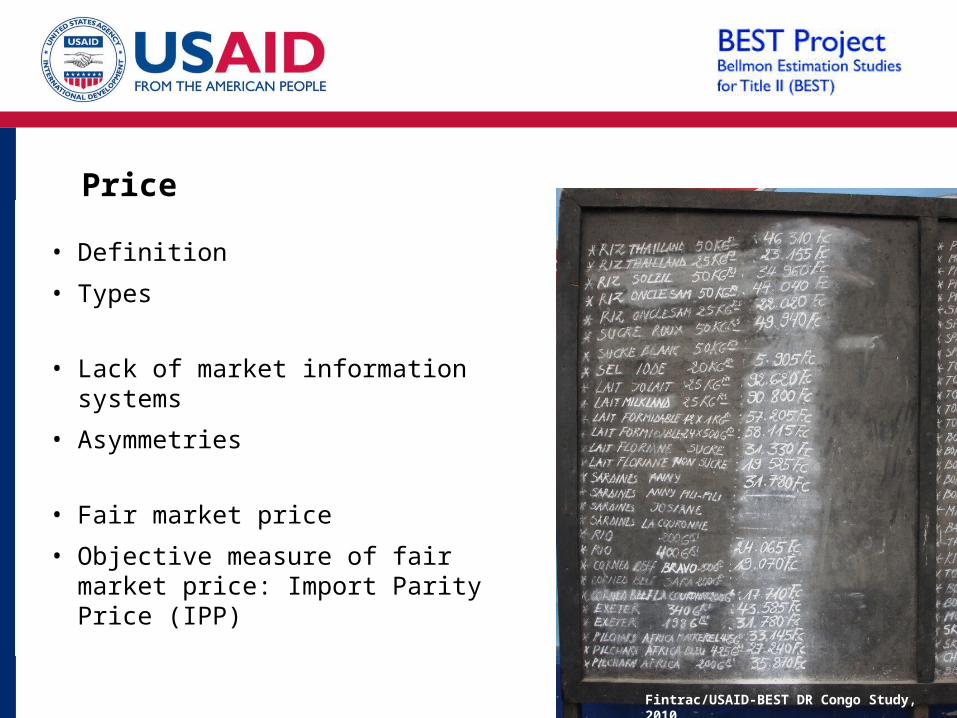
Price
• Definition
• Types
• Lack of market information systems
• Asymmetries
• Fair market price
• Objective measure of fair market price: Import Parity Price (IPP)
Fintrac/USAID-BEST DR Congo Study, 2010

Import Parity Price (IPP)
• Value of a unit of product brought from a foreign country and priced at a geographic location of interest in the importing country.
Fintrac/USAID-BEST Honduras Study, 2011

Calculating IPP:
• Import data (assess likely country of origin)• Commodity cost (in likely country of origin)• Ocean transport (from likely country of origin)• Insurance fees, port charges at port of entry • Custom duties and taxes (if applicable)• Inland transport costs to eventual point of sale (if
applicable)• Storage, operational fees, etc. (if applicable)

Determining Country of Origin
Ex: UN Comtrade – Wheat Imports
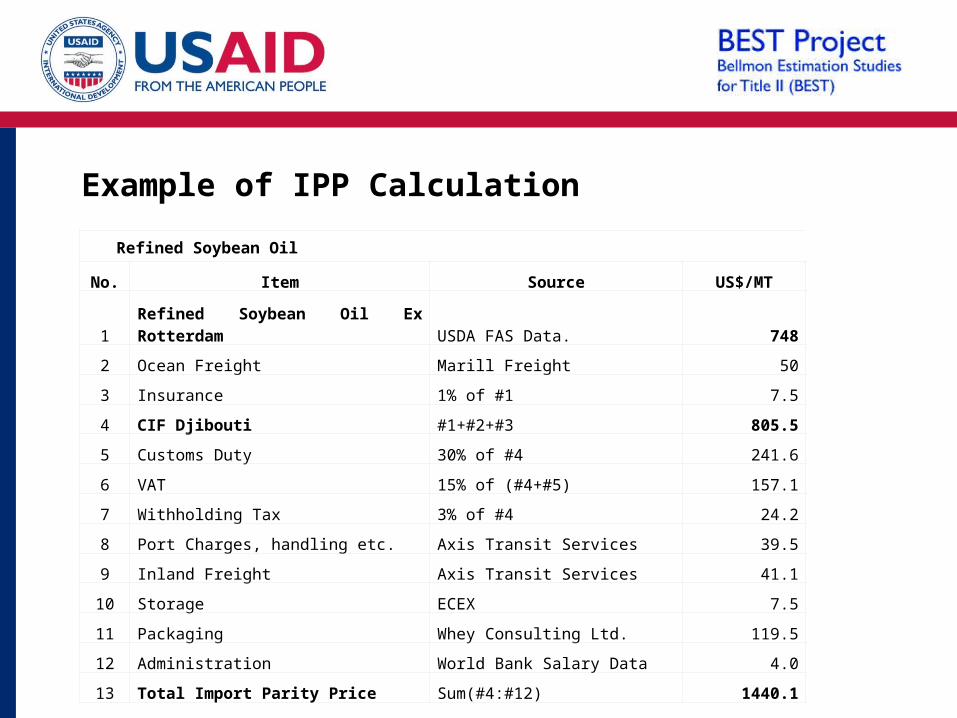
Example of IPP Calculation
Refined Soybean Oil
No. Item Source US$/MT
1 Refined Soybean Oil Ex Rotterdam USDA FAS Data. 748
2 Ocean Freight Marill Freight 50
3 Insurance 1% of #1 7.5
4 CIF Djibouti #1+#2+#3 805.5
5 Customs Duty 30% of #4 241.6
6 VAT 15% of (#4+#5) 157.1
7 Withholding Tax 3% of #4 24.2
8 Port Charges, handling etc. Axis Transit Services 39.5
9 Inland Freight Axis Transit Services 41.1
10 Storage ECEX 7.5
11 Packaging Whey Consulting Ltd. 119.5
12 Administration World Bank Salary Data 4.0
13 Total Import Parity Price Sum(#4:#12) 1440.1

Practical Challenge
• USG implementing partners have rich experience with demand-side constraints
• Newer tools -- LRP/cash/vouchers -- require understanding supply-side constraints as well
Fintrac/USAID-BEST Haiti Study, 2011

Practical Challenge
• Markets are dynamic.
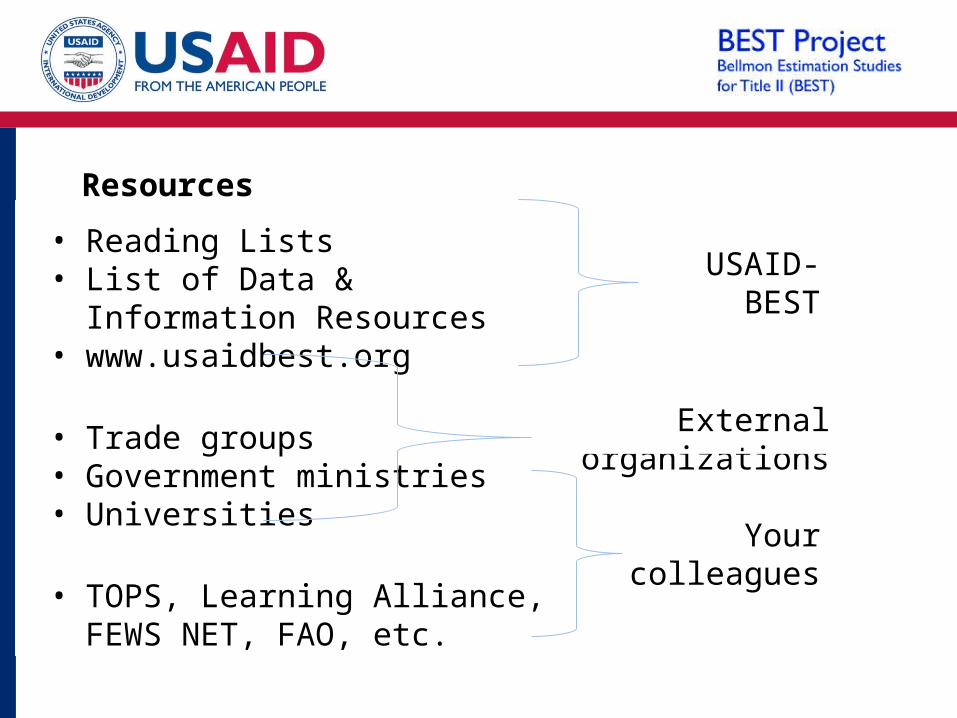
External organizations
• Reading Lists• List of Data & Information
Resources• www.usaidbest.org
• Trade groups• Government ministries• Universities
• TOPS, Learning Alliance, FEWS NET, FAO, etc.
Resources
USAID-BEST
Your colleagues
Market Analysis for Effective Food Security Programming
• Questions?
• Comments?
Fintrac/USAID-BEST Haiti Study, 2012Fintrac/USAID-BEST Peru Study, 2011

Thank You!
IFADC
May 7, 2012
Prepared by USAID-BEST Project/Fintrac Inc.