Market Analysis and Development Forecast · A market-based development forecast for the next 20...
30
www.lelandconsulting.com 1 Market Analysis and Development Forecast Date August 21, 2019 To Kara Hall, Don Samdahl Fehr & Peers From Sam Brookham, Chris Zahas Leland Consulting Group Subject Market Analysis and Development Forecast Project West Plains Transportation Management Plan INTRODUCTION AND PURPOSE Project Overview The US 2 West Plains Subarea Management Plan refines previous studies that have been completed in the West Plains area. Previous studies have indicated performance concerns mobility gaps (congestion) for the US 2 corridor in Airway Heights, as well as a need for a local parallel roadway network. This study addresses the mobility gaps along US 2 between the US 2 & I-90 interchange and Fairchild Air Force Base entrance. This study also looks at other possible parallel frontage road connections for 6th/12th and 18th/21st, to help alleviate traffic loading directly onto the US 2 corridor. In recent years, land use developments in the West Plains area has been growing at a fast pace. There is a need to understand the land use growth and the impacts it will have on the transportation system, so we can plan accordingly. This transportation-focused study will help position the West Plains for continued growth, prioritize improvements and maximize return on investments, secure scarce funding, and plan for dedication of needed right-of-way. 1 Economic Analysis This economic analysis is aimed to help WSDOT better understand the future development potential of the study area for residential, commercial, and industrial uses by providing data relating to new jobs and residents to populate new traffic models based on realistic development trends in the area. A market-based development forecast for the next 20 years summarizes future conditions by identifying net new development on vacant and underutilized sites. While the analysis is largely undertaken at the parcel-level, the development forecast is aggregated into TAZ shapefiles to populate traffic models. The forecast is informed by a market analysis, which includes an assessment of current and future demographic conditions, land use conditions, real estate dynamics, and West Plains strengths and weakness. The analysis 1 From WSDOT Project Home Page, URL
Transcript of Market Analysis and Development Forecast · A market-based development forecast for the next 20...

www.lelandconsulting.com 1
Market Analysis and Development Forecast Date August 21, 2019
To Kara Hall, Don Samdahl
Fehr & Peers
From Sam Brookham, Chris Zahas
Leland Consulting Group
Subject Market Analysis and Development Forecast
Project West Plains Transportation Management Plan
INTRODUCTION AND PURPOSE
Project Overview
The US 2 West Plains Subarea Management Plan refines previous studies that have been completed in the West
Plains area. Previous studies have indicated performance concerns mobility gaps (congestion) for the US 2
corridor in Airway Heights, as well as a need for a local parallel roadway network. This study addresses the
mobility gaps along US 2 between the US 2 & I-90 interchange and Fairchild Air Force Base entrance. This study
also looks at other possible parallel frontage road connections for 6th/12th and 18th/21st, to help alleviate traffic
loading directly onto the US 2 corridor.
In recent years, land use developments in the West Plains area has been growing at a fast pace. There is a need
to understand the land use growth and the impacts it will have on the transportation system, so we can plan
accordingly. This transportation-focused study will help position the West Plains for continued growth, prioritize
improvements and maximize return on investments, secure scarce funding, and plan for dedication of needed
right-of-way.1
Economic Analysis
This economic analysis is aimed to help WSDOT better understand the future development potential of the
study area for residential, commercial, and industrial uses by providing data relating to new jobs and residents
to populate new traffic models based on realistic development trends in the area.
A market-based development forecast for the next 20 years summarizes future conditions by identifying net
new development on vacant and underutilized sites. While the analysis is largely undertaken at the parcel-level,
the development forecast is aggregated into TAZ shapefiles to populate traffic models.
The forecast is informed by a market analysis, which includes an assessment of current and future demographic
conditions, land use conditions, real estate dynamics, and West Plains strengths and weakness. The analysis
1 From WSDOT Project Home Page, URL

West Plains Transportation Management Plan | Market Analysis and Development Forecast
www.lelandconsulting.com 2
culminates with the characterization of long-term growth potential and expected development types for each
expected land use in the study area.
Related to many, if not all, components of this market research are a series of stakeholder interviews.
Stakeholder interviews are critical in building a basic understanding of development trends, the area’s strengths
and weaknesses, expected development projects, as well as how the area might change as a direct result of
infrastructure investment. This memorandum includes a summary of these interviews.
West Plains Study Area
West Plains is located on the western edge of the Spokane metro region in Spokane County, Washington,
centered around Highway 2 and Interstate 90. Fairchild Air Force Base, the City of Airway Heights, the City of
Spokane, the Kalispel Tribe, the Spokane Tribe, Spokane County, and Spokane International Airport are all
prominent stakeholders. With few cities or town to the west, and only the cities of Medical Lake and Cheney
nearby to the south, West Plains has a substantial trade area which is unique to the rest of the Spokane metro
region.
Figure 1. West Plains Study Area and Regional Context
Source: TIGER, Spokane County, State of Washington, Google (imagery), Leland Consulting Group

West Plains Transportation Management Plan | Market Analysis and Development Forecast
www.lelandconsulting.com 3
REGIONAL CONTEXT
In recent years, the Spokane
metropolitan regional market has
not been considered a hotbed of
investment. Indeed, Spokane
ranked 64th out of the 79 markets
identified by the Urban Land
Institute (ULI) in its annual
“Emerging Trends in Real Estate”
publication. This score is based on
participants’ opinions on the
strength of the local economy,
investor demand, capital
availability, development and
redevelopment opportunities, public/private investments, and the local development community.
Generally, however, ULI maintains that the Mountain region will “continue to exhibit strong demographic and
economic growth,” and the “comparatively low cost of living and [cost] of doing business is considered
attractive to new residents and conducive to employment growth.” Indeed, the Spokane metro region has
added population and jobs faster than the USA average, although income growth is expected to grow at a
slower rate.
Emerging Trends also advises on the types of development that are likely to be most desirable in the coming
years from both a developer and investor perspective. While this is a national outlook, the guidance is relevant
for most local markets, including West Plains and the greater Spokane region.
The figure below shows ULI’s high-level summary of national investment and development prospects for 2019.
Industrial and housing top the list, with office, hotels, and retails falling somewhat far behind. Industrial and
distribution uses have become increasingly popular investments in recent years, largely due to the rapid rise of
ecommerce.
Focus groups conducted by ULI for the
Spokane/Coeur d’Alene region report
that their metro could benefit from
increased infrastructure investment, and
that they continue to see rising interest
from national and regional investors.
However, like most cities across the
nation, Spokane is experiencing
significant issues with a shortage of
construction labor and higher
construction costs, which is amplified
locally by stagnant rent growth.

West Plains Transportation Management Plan | Market Analysis and Development Forecast
www.lelandconsulting.com 4
EXISTING CONDITIONS ANALYSIS
This section presents demographic and employment conditions for the study area and surrounding region, as
well as high-level assessment of land supply conditions in the study area.
Demographic Summary
The data provided in this section pertains to West Plains, Spokane County, and the State of Washington. Also
included is the “subregion,” referring to the area generally defined by the West Plains study area, Medical Lake,
Cheney, Four Lakes, and Cheney Spokane Road—roughly a 7.5-mile radius around the 902/I-90 interchange.
This subregion represents the residential market area, reflecting the area that shares similar characteristics with
the West Plains study area and from which most competitive development will originate.
The following table shows population trends over the past 18 years. The West Plains study area has seen
higher-than-average growth compared to the wider region, county, and state. It is important to note that
although the data shows a 2.2 percent compound annual growth rate in West Plains’ population from 2010 to
2019, the last year saw almost 4.8 percent growth, highlighting the rapid increase in the rate of growth in very
recent years. West Plains’ existing employment focus is highly apparent, as the only area showing more workers
than residents for “daytime population.”
Also significant is the proportion of the population in group quarters (17.5 percent), reflecting the presence of
the Airway Heights Correctional Facility.
Table 1. Population Summary, 2000-2019
Population West Plains Subregion Spokane Co. Washington
2000 Total 12,418 33,815 417,939 5,894,121
2010 Total 14,344 40,313 471,221 6,724,540
2019 Total 17,415 46,033 515,061 7,608,571
00-19 CAGR 1.90% 1.73% 1.17% 1.43%
10-19 CAGR 2.18% 1.67% 1.12% 1.56%
2019 Daytime Pop 22,749 47,883 524,440 7,526,959
Workers 13,892 23,648 238,181 3,701,657
Residents 8,857 24,235 286,259 3,825,302
% In Group Quarters (’19) 17.5% 11.5% 2.9% 2.0%
Source: ESRI
The following table shows age distribution and the percent of the population aged 25 and over that have a
bachelor’s degree or higher. This part of the Spokane metro region is significantly younger than the rest, with an
average age of only 32.1 versus 38.1 for the county. Most significantly, well in excess of half the population is
under 35 years old. A smaller proportion of seniors (aged 65 and over) is potentially indicative of the area’s
employment-heavy focus and isolation from the rest of the Spokane metro, where a greater array of transit
options, amenities, services, and housing is more accessible.

West Plains Transportation Management Plan | Market Analysis and Development Forecast
www.lelandconsulting.com 5
Table 2. Population Age Distribution and Education, 2019
West Plains Subregion Spokane Co Washington
Median Age 32.3 32.1 38.1 38.6
% Under 18 21.8% 19.6% 21.3% 21.3%
% 18-34 33.3% 34.8% 24.5% 23.5%
% 35-64 35.6% 33.6% 37.9% 39.1%
% 65+ 9.3% 12.0% 16.3% 16.1%
% with bachelor’s degree 19.8% 28.6% 31.1% 36.0%
Source: ESRI
The following graphic provides a more detailed breakdown of the West Plains population by generation.
Different generations typically share similar lifestyle preferences and trends. This is particularly true for housing,
recreation, and amenities. People belonging to the Millennial and Boomer generations typically place the
highest demand for multifamily housing and affordable, smaller single-family homes (including townhomes and
small single-family structures). Generation Xers, of which West Plains has a significant population, typically drives
demand for larger “move-up” single-family homes. Generation Z—largely the children of older Millennials and
Gen Xers—are likely to either move out of the area for college or enter the local workforce. Gen Z preferences
remain open-ended, but it is likely that they will continue to drive demand for multifamily and, more selectively,
student housing.
According to data from the Washington Office of Financial
Management, Spokane County is projected to experience major
population growth in Baby Boomer and Millennial generations
over the next 10 years.
The stakeholder interviews conducted for this analysis—
summarized in more detail later in the report—highlighted
substantial projected growth for the Cheney School District. This
data would appear to support that notion, with Alpha’s (the
newest, youngest generation) already totaling more than four
percent of the total population, despite only being born in the
last two to three years.
The following table shows a range of housing characteristics, hightling the high proportion of rental housing in
West Plains, despite the fact that the area has not historically been a hotbed of apartment construction. Indeed,
the fact that West Plains also has the highest average household size of other comparison areas appears to
reflect the single-family nature of the housing market. Along with the previous data showing West Plains’
significantly younger population, this appears to suggest young families living in rented single-family homes,
perhaps driven by the presence of larger institutions like Fairchild Air Force Base.

West Plains Transportation Management Plan | Market Analysis and Development Forecast
www.lelandconsulting.com 6
Table 3. Household Summary, 2019
West Plains Subregion Spokane Co Washington
Avg. Household Size 2.60 2.52 2.48 2.54
1- & 2-Person HHs 57.3% 61.1% 63.5% 61.7%
Med. HH Income $52,684 $53,338 $56,511 $73,627
Med. Home Val. $220,970 $250,158 $225,078 $370,055
% Renter Occupied 49% 45% 37% 36%
Source: ESRI
Employment Summary
This section provides an overview of employment and commute patterns in West Plains. The following chart
provides a high-level summary of West Plains employment profile.
Figure 2. West Plains Employment Profile, 2018 (est.)
Source: ESRI
The graph shows “public administration” accounting for about one-third of all jobs in West Plains. Public
administration encompasses the many public or semi-public agencies or jobs in West Plains, such as the Airway
Heights Corrections Facility, Fairchild Air Force Base (military) and Spokane International Airport (notably,
security).
Entertainment and recreation jobs are also very prominent, largely because of the Spokane Tribe Casino and
the Northern Quest Resort and Casino. Both these institutions are expected to expand in the near future, so jobs
in the art, entertainment, and recreation industry are likely to continue to feature prominently. Similarly, retail
12
0
6
43
64
167
216
225
255
443
458
574
632
635
763
986
1,418
1,425
2,511
5,273
Agriculture, Forest, Fish, Hunt
Mgmt. of Companies & Enterprises
Mining, Oil & Gas Extraction
Information
Utilities
Finance & Insurance
Administrative & Support Svcs.
Educational Svcs.
Real Estate & Rental & Leasing
Other Svcs., except Public Admin.
Health Care & Social Assistance
Construction
Wholesale Trade
Professional, Scientific & Tech Svcs.
Transportation & Warehousing
Accommodation & Food Svcs.
Manufacturing
Retail Trade
Arts, Entertainment, & Recreation
Public Administration

West Plains Transportation Management Plan | Market Analysis and Development Forecast
www.lelandconsulting.com 7
trade and accommodation and food services are both prominent industries and expected to grow as the Tribes
develop their land, more housing units are built in the area, and tourism emerges as a prominent sector.
Most significantly, however, manufacturing, transportation and warehousing, professional, scientific, and
technical services, and wholesale trade—which collectively account for almost one-fifth of all jobs—are
expected to grow at a faster rate the rest of the region. West Plains presents a significant competitive advantage
for manufacturing and transportation and warehousing, in particular, both regionally and further afield, and will
drive industrial development in the area. Employment growth in the professional, scientific, and technical
services industry will drive office demand but the industry is smaller and unlikely to achieve the same rate of
growth as more prominent office locations in the Spokane metro, such as downtown Spokane. The Pacific
Northwest Tech Park may be one of the few places that well-suited office tenants may locate.
Commute Patterns
Figure 3. Employment Inflow/Outflow, 2015
The figure at left shows—using 2015 data (the latest
available)—the number of employees that worked,
lived, or both worked and lived in West Plains. Despite
a larger geographical area, very few people lived and
worked in the area in 2015.2
The data also shows a significantly higher number of
employees than employed residents, demonstrating
West Plains’ status as a strong employment hub in the
region.
Source: LEHD
The past three years has seen significant growth in both residential and employment-based construction, so
some of these numbers may have changed. Anecdotally, it is also understood that quality of life, housing
quality, and housing availability have all improved in recent years. However, there is likely still an opportunity to
provide additional housing that meets the needs and desires of those working in West Plains.
To reinforce this point, the following map shows the home location of people working West Plains. Most people
that commute into the region for work live further east in Spokane and Spokane Valley. West Plains is unlikely to
attract people to live in the area purely based on commute time as the transportation network provides quick
cross-metro travel times. Instead, West Plains is challenged with creating a place that offers an attractive mix of
housing, recreational and commercial amenities, and high-quality schools3, among other elements.
2 Typically, the larger the area, the higher the percentage of employed persons and work and live in the area. 3 The Cheney School District, which encompasses West Plains and is not seen as attractive relative to other school districts in
the Spokane metro region, is considered a barrier to major growth.
West Plains Transportation Management Plan | Market Analysis and Development Forecast
www.lelandconsulting.com 8
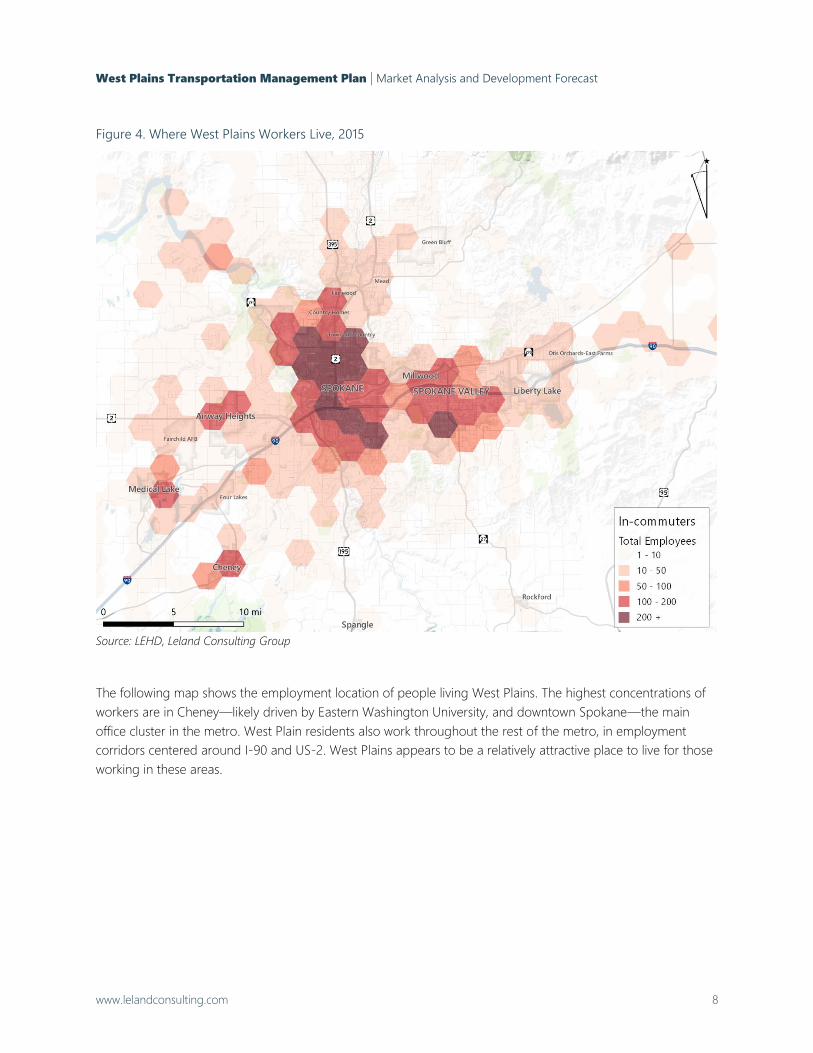
Figure 4. Where West Plains Workers Live, 2015
Source: LEHD, Leland Consulting Group
The following map shows the employment location of people living West Plains. The highest concentrations of
workers are in Cheney—likely driven by Eastern Washington University, and downtown Spokane—the main
office cluster in the metro. West Plain residents also work throughout the rest of the metro, in employment
corridors centered around I-90 and US-2. West Plains appears to be a relatively attractive place to live for those
working in these areas.

West Plains Transportation Management Plan | Market Analysis and Development Forecast
www.lelandconsulting.com 9
Figure 5. Where West Plains Residents Work, 2015
Source: LEHD, Leland Consulting Group
Land Conditions
Cataloging the amount of developable land is critical to a land development Land supply is a critical component
of a land development forecast. To this end, land utilization, zoning, and ownership are all important factors.
The following information portrays the aggregated zoning for the entire West Plains study area. These zones
were considered when forecasting future development. Light industrial zoned land is the dominant zoning type,
largely due to the presence of the airport, which also owns a substantial portion of the land in central West
Plains.
West Plains Transportation Management Plan | Market Analysis and Development Forecast
www.lelandconsulting.com 10
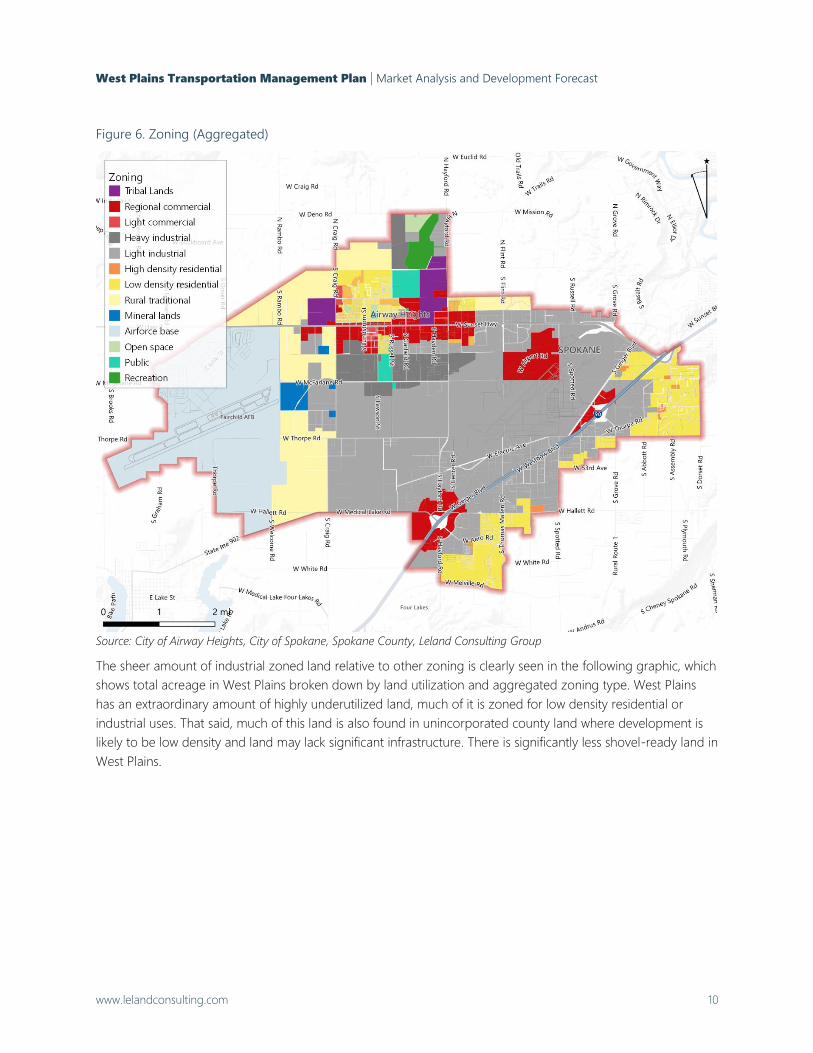
Figure 6. Zoning (Aggregated)
Source: City of Airway Heights, City of Spokane, Spokane County, Leland Consulting Group
The sheer amount of industrial zoned land relative to other zoning is clearly seen in the following graphic, which
shows total acreage in West Plains broken down by land utilization and aggregated zoning type. West Plains
has an extraordinary amount of highly underutilized land, much of it is zoned for low density residential or
industrial uses. That said, much of this land is also found in unincorporated county land where development is
likely to be low density and land may lack significant infrastructure. There is significantly less shovel-ready land in
West Plains.

West Plains Transportation Management Plan | Market Analysis and Development Forecast
www.lelandconsulting.com 11
Figure 7. Acreage by Land Utilization and Zoning
Source: City of Airway Heights, City of Spokane, Spokane County, Leland Consulting Group
STAKEHOLDER INTERVIEW SUMMARY
Stakeholder interviews are an integral component of the analysis, as they help to ground truth preliminary
market findings, identify trends that would not otherwise be seen in more traditional data sources, and highlight
the area’s nuanced strengths and weaknesses. Stakeholder interviews are especially critical in areas with multiple
jurisdictions, significant landowners, and other organizations, such as the West Plains. For example, plans for
development on Tribe-owned land or on Spokane International Airport property are likely to register with
traditional, market-driven sources of real estate data.
The interviews involved a number of public representatives, namely from Spokane International Airport, the
Spokane Tribe, the Kalispel Tribe, Airway Heights, City of Spokane, Spokane Transit Authority (STA), West Plains
Public Development Authority (PDA), and West Plains Chamber. Additionally, a significant landowner and two
commercial and industrial brokers were interviewed to gain an understanding of markets trends from the
perspective of the private sector.
Findings from the interviews, including strengths, challenges, opportunities, and development trends, are
summarized as follow. These findings will be carried through the remainder of the memorandum and—where
applicable—elaborated. As much of the interview content focused on not-yet-public information, the findings
are typically presented as key takeaways and major themes.
0 1,000 2,000 3,000 4,000 5,000 6,000 7,000 8,000
<0.5
0.5-1.5
1.5-2.5
2.5+
Tribal Lands
Commercial
Industrial
Multifamily
Low density residential

West Plains Transportation Management Plan | Market Analysis and Development Forecast
www.lelandconsulting.com 12
Strengths
• Substantial Growth. There has been a recent uptick in growth—particularly with regard to industrial and
residential land uses. The rate of growth is expected among stakeholders to continue ramp up.
• Good Access. West Plains benefits from access to major transportation networks, rail, and the airport, which
is attractive to industrial users, in particular.
• Industrial Land Supply. The West Plains area is one of the few places in the entire region where an
industrial user can find large tracts (e.g. 15 acres) of industrial-zoned land that can be served by adequate
infrastructure.
• Strengthening Housing Market. Rapidly increasing housing prices and declining vacancies reflect the
growing strength of the housing market. Despite the recent uptick in growth, the rate of construction is still
not keeping pace with demand. New units are therefore almost immediately absorbed by the market.
• Significant Aerospace Cluster. The region has one of the strongest aerospace manufacturing industry
clusters in the nation, with around 240 aerospace-related manufacturing businesses and approximately
8,000 jobs. Significant growth could occur within the next few decades, especially if a large user is
successfully attracted to airport land.
• Strong Workforce. The area boasts a young, educated workforce and strong workforce development
programs in partnership with educational and other institutions throughout the region.
• Affordable Housing Market. Housing is cheaper than the rest of the Spokane metro region, although
housing prices are increasing. Housing construction cannot keep up with demand, particularly with regard to
workforce housing.
Challenges
• Highway 2 is considered “at capacity,” with the performance of many key intersections expected to worsen
as the rate of growth in the area continues. Potentially troublesome pinch points include Hwy 2 & Hayford,
Hwy 2 & Craig.
• FAA Restrictions. While Spokane International Airport owns a significant portion of the land in West Plains,
it is unlikely to attract small- to medium-sized private developers. Due to FAA regulations, the airport has
little choice but to ground lease land to developers. If the airport desires to sell any land, they must go
through an extensive, time-consuming process with the FAA. This is likely to deter near- and mid-term
development while other, less complicated land is still available in the area. Larger companies—particular
aerospace-related—are less likely to be deterred.
• Restrictive Overlay Zone. The airport overlay zone impacts allowed development and building types and
extends into the surrounding areas where development might otherwise be possible. The zone largely
impacts land within the City of Spokane and in unincorporated Spokane County.
• Adequate Infrastructure to support high-intensity users is lacking in many places. Additional infrastructure
investment—which is understood to be planned—would greatly increase development prospects by
providing shovel-ready land and heighten development feasibility for all users, particularly with regard to
land to the south of US 2 (in and near Airway Heights).
• Wetlands present a barrier to development in some places that must be mitigated prior to new
development.
• Fairchild Air Force Base may prefer to remain isolated from adjacent development. As such, prospective
developers looking to locate projects near the base face challenges on the basis of encroachment.

West Plains Transportation Management Plan | Market Analysis and Development Forecast
www.lelandconsulting.com 13
• Image Issue. West Plains and the greater Spokane region does not typically attract significant national
interest, but the area is beginning to “get on the map” due to a number of new large businesses and an
extensive marketing effort. This also extends to substandard perceptions about the school district and quality
of life, irrespective of actualities.
• Regional Competition. Post Falls and Spokane Valley may also prove difficult to compete against for
industrial development. However, West Plains possesses unique competitive advantages with the airport,
tribal land development plans, Fairchild AFB, and the new Amazon facility.
• Lack of Households for Retail. West Plains has about 35 square feet of retail space per capita, significantly
higher than the 15 to 20 square feet that is typically considered “equilibrium.” While the West Plains trade
area extends significantly beyond its boundaries to the southwest (i.e. the area containing the consumer
base that existing retail serves), retailers are today placing increasingly more importance on activity densities
and income levels. While prospective retail tenants in the past have struggled to see a significant market in
West Plains for new development—citing feasibility concerns in addition to a saturated market—significant
household growth and mid-wage job growth is expected to improve retail prospects.
Opportunities
• Residential Demand. Demand for residential uses typically follow large job generators, such as Amazon,
Kenworth Trucking, Caterpillar, casino growth, etc. These types of uses are especially driving demand for
workforce housing. Residential development is allowed in the County area south of I-90 despite a
designation as light industrial in the Spokane comprehensive plan, resulting in several new subdivisions and
other residential projects. This is likely to continue until the existing developable residential land has built out.
Rezoning certain areas or removing regulatory and physical barriers to development would likely result in
further residential development within the next few decades.
• Fairchild Air Force Base Growth. Fairchild has been selected to receive 12 additional KC-135 refueling
aircraft, which will begin arriving in 2020. Fairchild is said to be planning to reactivate its 97th Air Refueling
Squadron, as well as an unnamed maintenance unit, to handle the Stratotankers. About 1,000 additional
airmen and family members combined are expected to move to the Spokane region, potentially having a
profound positive impact on demand for housing and commercial amenities in West Plains. Beyond this
known near-term growth, there is the potential for further employment growth.
• Industrial Growth. Manufacturing, transportation, and distribution are likely to drive industrial development,
but these users are not necessarily expected to require access to the airport. Instead, transportation
infrastructure and clustering nearby mutualistically beneficial users is of greater importance.
• New Transload Facility. The new transload facility and rail spur presents a tremendous opportunity for
major industrial development and employment generation. The facility is expected to support the expansion
of existing industries and improve the prospects of attracting major companies to the area.
• Opportunity Zone. Much of West Plains is considered an Opportunity Zone—a tax incentive program that
is likely to increase development in the area. However, Spokane also has several Opportunity Zones in prime
development locations, so this may prove less significant.
• Plentiful Land Supply. There is plentiful vacant land that is ripe for new development—depending on the
provision of adequate infrastructure and the successful navigation of the regulatory restrictions that apply to
some of the land (e.g. FAA regulations, flight overlay zones, etc.).
• The I-90 corridor is a desirable place to develop for industrial and commercial users, and benefits from City
of Spokane infrastructure (versus Airway Heights, where there is less infrastructure capacity for these users).

West Plains Transportation Management Plan | Market Analysis and Development Forecast
www.lelandconsulting.com 14
• Strong Transit System. STA is adding new routes to accommodate residential and employment growth in
the area. New transit routes help connect the area, especially people living in Cheney and Medical Lake to
jobs in and around Airway Heights. STA anticipates these new routes, as well as a planned BRT route in 2040
along US-2, to induce growth.
• New Infrastructure Investment. The PDA is undertaking a regional stormwater study and aim to invest in
critical stormwater infrastructure to support new investment in the next two to three years. This will be a
coordinated effort focused on implementing other infrastructure elements, largely made possible by a recent
grant.
Development Trends
• Tribal Land. There is significant development interest in both Tribe areas, with both Tribes expressing a
desire for development. Immediate plans include casino/event space expansions. Additional development is
expected to be market-driven, with a range of land uses on the table, including housing, retail,
entertainment, and hotel.
• Amazon. The new Amazon facility is expected to drive significant interest for associated distribution,
logistics, and other industrial uses in the near-term.
• Phasing. Highway 2 and I-90 corridors are likely to approach build-out in the next 20 to 30 years,
particularly with regard to residential land. The area east of Airway Heights along US-2 may see build out
achieved even sooner. Industrial development surrounding Macfarlane Road and the new transload facility is
anticipated in the near-term, but only with new investments in infrastructure.
• Airport Development. Spokane International Airport and the PDA are targeting large aerospace
manufacturing companies for its land to the west of the airport. A third runway is planned in this area which
will absorb a significant chunk of the land, particularly once the land at either end is subsequently classified
non-developable due to aircraft takeoff/landing zones. The additional runway is still considered a long-term
project and construction may occur beyond the 2040 planning horizon of this project.
This land is a key component in the airport’s efforts to attract Boeing or other relating suppliers as Boeing
targets 2025 for its new midsize aircraft (NMA). Spokane is thought to be competing with North Carolina for
the opportunity to home Boeing. If successful, around 300 acres of aeronautical land will be developed,
potentially generating around 5,000 new jobs.
• Spokane International Airport also owns the land east of Spotted Road (roughly bounded by the US-2 and
Geiger Blvd.)—about 590 acres of vacant space that has had some infrastructure investment. However,
despite investments in roads more than 15 years ago the area has remained vacant with little development
interest. This is unlikely to change, although there is a planned interchange and new road that may improve
access and, subsequently, prospects.
• Hotel Growth. Additional hotel development is expected in the I-90 corridor and near the airport.
• Limited Office Market. While the office market is considered limited, new development is likely to occur
north of the airport. The PDA is looking into an innovation park, which will include research and
development (R&D) to partner with the extensive number of local educational institutions in the area.
• Increasing Rate of Development. Development over the past few decades has been highly constrained.
However, the rate of development over the past two to three years has been unprecedented and is likely to
continue as long as the economy remains strong. Continuing growth largely depends on infrastructure

West Plains Transportation Management Plan | Market Analysis and Development Forecast
www.lelandconsulting.com 15
availability and capacity, the success of the PDA to attract a large aerospace-related user, and the lifting of
regulatory barriers to development.
• Multifamily Development. Several large apartment projects have been recently constructed or are in the
near-term pipeline. Historically challenging market conditions and long-lasting impacts from the recession
potentially resulted in a highly constrained housing market with pent-up demand. As absorption slows and
the market right-sizes, there may be a glut of multifamily units in the next five years, but the housing market
is likely to remain strong.
MARKET ANALYSIS
Real Estate Market Summary
With regard to non-institutional or non-single-family residential land uses, the West Plains study area is primarily
made up of industrial and multifamily land uses, with a relatively small amount of retail, flex, office, and other
developments, as shown in Figure 8, below. These are usually more equally proportioned, and the retail sector is
typically one of the largest in terms of square footage. For West Plains, it would appear that these other real
estate sectors are lagging behind industrial and residential development.
Since 2010, this trend has only intensified, with multifamily development increasing the pre-2010 inventory by
about 50 percent and the industrial market also showing significant growth (not including under construction or
planned developments, such as Amazon and Kenworth Trucking). As an earlier section highlight national
development and investment prospects, this closely follows national trends that suggest strong support for
industrial and residential development.
Figure 8. West Plains Development by Total Square Feet and Year Built
Source: Costar
Industrial
MFR
Specialty
Retail
Flex
Hotel
Office Sports/
Entmnt.
Total Development (All Years)
Industrial,
1,841,233
MFR,
1,157,880
Specialty,
62,000
Office,
56,038 Retail,
53,925
Development Since 2010

West Plains Transportation Management Plan | Market Analysis and Development Forecast
www.lelandconsulting.com 16
These trends go some way in underlining West Plains’ industrial character. The lack of retail is a curious
phenomenon: in contrasting form to much of the retail sector throughout the rest of the United States, it would
appear that continued residential and employment growth in West Plains would only underpin the need and
demand for significant retail construction going forward. As such, as we move into the demand forecast later in
this report, land use projections indicate significantly higher rates of retail development over the next 20 year.
Market Sectors
This section includes a summary of current market trends at both the Spokane metro region (market) and West
Plains (submarket) levels.
Residential Market
Multifamily Residential. Spokane’s multifamily sector continues to benefit from strong fundamentals. Vacancy
remained tight in 2018, even as over 900 new units came online. Though annual rent growth has moderated,
rents are growing more quickly in Spokane than nationally. Buyers are taking increasing notice of the Spokane
multifamily sector’s strength: multifamily sales volume more than doubled in 2018, and investment benefits from
numerous transactions.
Market data pertaining to the West Spokane County Submarket is as follows.
• The local multifamily market appears more constrained than the metro market, with very low vacancies (3.1
percent) and historically low deliveries (average of 45 units per year over the past 10 years).
• Average rents are relatively consistent with those throughout the Spokane metro region, with high rent
growth likely reflecting the addition of several new projects.
• Th rate of multifamily construction has increased recently, with 232 units delivered over the past year—seven
percent of the total inventory and the first deliveries since 2015. This growth is clearly in line with demand,
with the market showing almost instant absorption.
• Average rents remain around $815 per unit, on average, but new construction been upwards of $900 to
$1,000—in line with averages in the rest of the Spokane market. New multifamily construction on the Kalispel
Tribal land, for example, is looking to rent for even more (between $1,000 and $1,500 for one-, two-, and
three-bedroom units), which would easily be a historical high for the submarket. Generally, however, rent
growth remains slower than the wider market, at 3.27 percent versus 5.21 percent for the submarket and
market, respectively.
• Anecdotally, it is understood that significant demand exists for apartments, with several developers poised to
develop if the opportunity arises. However, significant barriers exist, such as the airport overlay zone, the glut
of light industrial zoning, and a lack of quality infrastructure in places.
Area 12 Month
Deliveries
12 Month
Absorption
Vacancy Rate
(%)
Average Rent 12 Month Rent
Growth
Metro 542 units 561 units 5.0% $1.08 PSF 5.4%
Submarket 232 units 212 units 3.1% $1.03 PSF 4.2%
Source: Costar

West Plains Transportation Management Plan | Market Analysis and Development Forecast
www.lelandconsulting.com 17
Single-family Residential. The West Plains residential market has been—at least historically—predominantly
single-family oriented. Development activity has increased in Airway Heights and in Spokane County south of I-
90, with many new single-family subdivisions coming online.
The Spokane housing market is viewed as affordable when compared to Seattle and Portland. It was also ranked
fourth out of 300 cities in a national Realtor.com survey of the hottest markets, trailing Midland, Texas; Chico,
California; and Colorado Springs, Colorado. The survey, released in March, measures listing views per property
and the average amount of time a home is on the market. With such a hot market, it is not uncommon for
sellers to receive multiple offers on homes, especially in the $300,000-or-less price range. However, high
demand will usually drive up home prices. In the Spokane market, home prices rose more than 11 percent over
the past year.
Two key indicators of market strength in the for-sale housing market are the average number of days on the
market from list date to sale (closing) date, as well as the ratio of sale price to list price. These trends are
presented below in Figure 9.
• For days on market, decreasing numbers indicate a strengthening market. Spokane County has
continued to experience a decreasing average since the Great Recession.
• For sale-to-list ratio, a ratio of 1.0 indicates that homes are being sold for the original list price, on
average. If this ratio is anywhere near or even above 1.0, the housing market is considered very tight
and a seller’s market. At 0.99, this rings true for Spokane County, and demand for new housing is
strong.
Figure 9. Spokane County For-Sale Market Trends
Source: Zillow Market Research
The strength of the Spokane metro market has certainly spilled over into West Plains, with data indicating a very
tight market. Indeed, current home listings account for less than three months of standing inventory, and new
homes (built in the past five years) account for one-third of these sales. Strong demand exists for all housing
types, but particularly for homes priced under $300,000, with only 1.7 months of standing inventory.
0.90
0.91
0.92
0.93
0.94
0.95
0.96
0.97
0.98
0.99
1.00
40
50
60
70
80
90
100
110
120
130
140
2010
-06
2010
-12
2011
-06
2011
-12
2012
-06
2012
-12
2013
-06
2013
-12
2014
-06
2014
-12
2015
-06
2015
-12
2016
-06
2016
-12
2017
-06
2017
-12
2018
-06
2018
-12
Sale
-to
-Lis
t Price
Ratio
Avg
. D
ays
on M
ark
et
Befo
re S
ale
Days on Market 12mo. Avg.
Sale-to-list ratio 12mo. Avg.
West Plains Transportation Management Plan | Market Analysis and Development Forecast
www.lelandconsulting.com 18
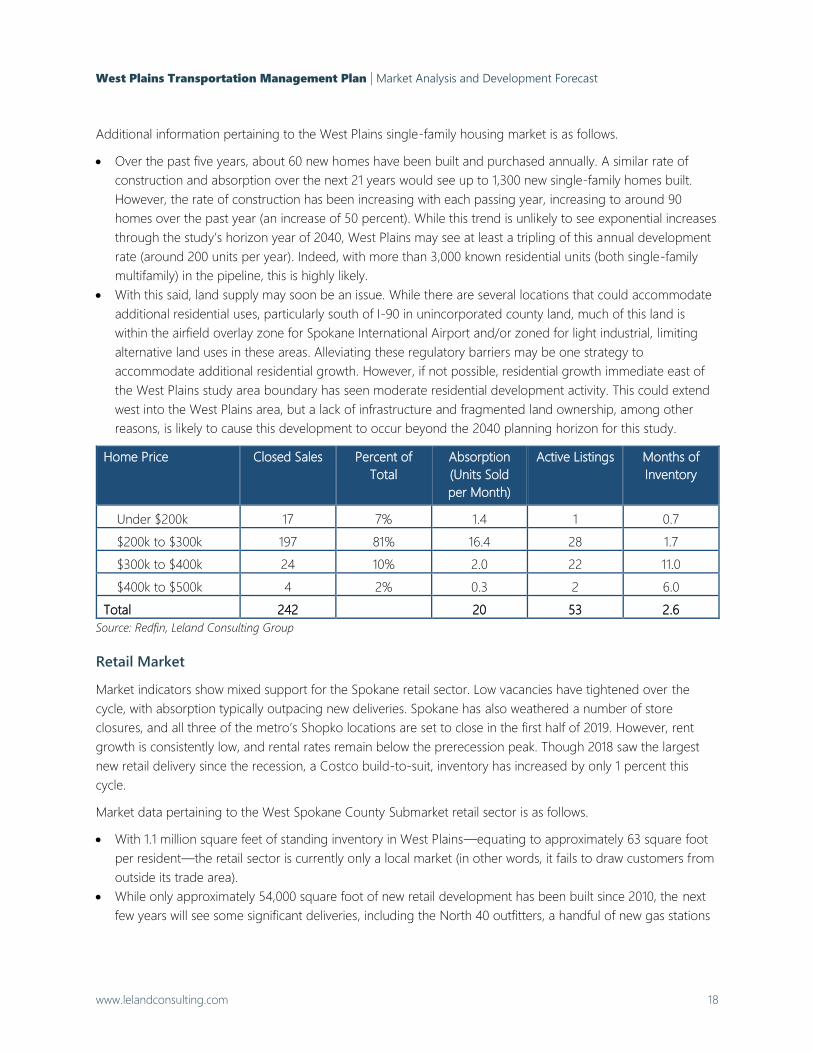
Additional information pertaining to the West Plains single-family housing market is as follows.
• Over the past five years, about 60 new homes have been built and purchased annually. A similar rate of
construction and absorption over the next 21 years would see up to 1,300 new single-family homes built.
However, the rate of construction has been increasing with each passing year, increasing to around 90
homes over the past year (an increase of 50 percent). While this trend is unlikely to see exponential increases
through the study’s horizon year of 2040, West Plains may see at least a tripling of this annual development
rate (around 200 units per year). Indeed, with more than 3,000 known residential units (both single-family
multifamily) in the pipeline, this is highly likely.
• With this said, land supply may soon be an issue. While there are several locations that could accommodate
additional residential uses, particularly south of I-90 in unincorporated county land, much of this land is
within the airfield overlay zone for Spokane International Airport and/or zoned for light industrial, limiting
alternative land uses in these areas. Alleviating these regulatory barriers may be one strategy to
accommodate additional residential growth. However, if not possible, residential growth immediate east of
the West Plains study area boundary has seen moderate residential development activity. This could extend
west into the West Plains area, but a lack of infrastructure and fragmented land ownership, among other
reasons, is likely to cause this development to occur beyond the 2040 planning horizon for this study.
Home Price Closed Sales Percent of
Total
Absorption
(Units Sold
per Month)
Active Listings Months of
Inventory
Under $200k 17 7% 1.4 1 0.7
$200k to $300k 197 81% 16.4 28 1.7
$300k to $400k 24 10% 2.0 22 11.0
$400k to $500k 4 2% 0.3 2 6.0
Total 242 20 53 2.6
Source: Redfin, Leland Consulting Group
Retail Market
Market indicators show mixed support for the Spokane retail sector. Low vacancies have tightened over the
cycle, with absorption typically outpacing new deliveries. Spokane has also weathered a number of store
closures, and all three of the metro’s Shopko locations are set to close in the first half of 2019. However, rent
growth is consistently low, and rental rates remain below the prerecession peak. Though 2018 saw the largest
new retail delivery since the recession, a Costco build-to-suit, inventory has increased by only 1 percent this
cycle.
Market data pertaining to the West Spokane County Submarket retail sector is as follows.
• With 1.1 million square feet of standing inventory in West Plains—equating to approximately 63 square foot
per resident—the retail sector is currently only a local market (in other words, it fails to draw customers from
outside its trade area).
• While only approximately 54,000 square foot of new retail development has been built since 2010, the next
few years will see some significant deliveries, including the North 40 outfitters, a handful of new gas stations
West Plains Transportation Management Plan | Market Analysis and Development Forecast
www.lelandconsulting.com 19
and convenience stores, Dutch Bros coffee, and continued development interest in the Cross Pointe
commercial center. Further, not-yet-planned retail development is also likely in the near-term.
• Very low vacancies suggest a constrained market, but with zero to negative absorption and a volatile
national market, there is reason to be guarded about the strength of Spokane’s retail sector.
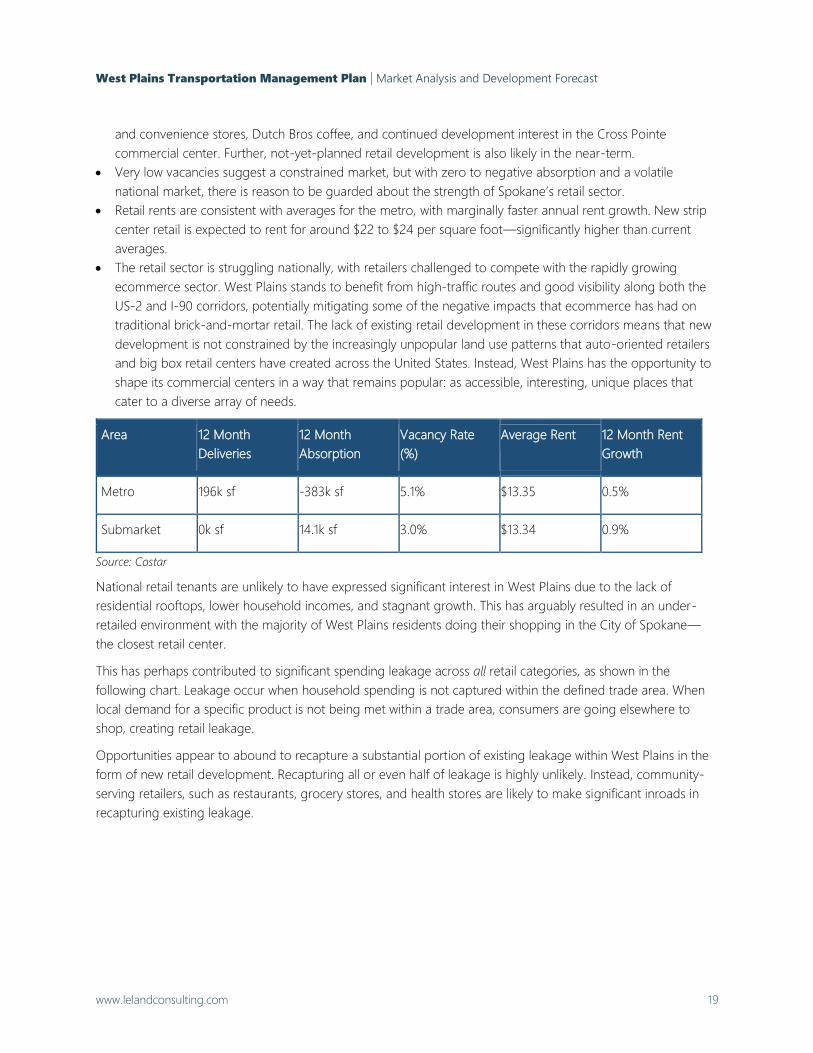
• Retail rents are consistent with averages for the metro, with marginally faster annual rent growth. New strip
center retail is expected to rent for around $22 to $24 per square foot—significantly higher than current
averages.
• The retail sector is struggling nationally, with retailers challenged to compete with the rapidly growing
ecommerce sector. West Plains stands to benefit from high-traffic routes and good visibility along both the
US-2 and I-90 corridors, potentially mitigating some of the negative impacts that ecommerce has had on
traditional brick-and-mortar retail. The lack of existing retail development in these corridors means that new
development is not constrained by the increasingly unpopular land use patterns that auto-oriented retailers
and big box retail centers have created across the United States. Instead, West Plains has the opportunity to
shape its commercial centers in a way that remains popular: as accessible, interesting, unique places that
cater to a diverse array of needs.
Area 12 Month
Deliveries
12 Month
Absorption
Vacancy Rate
(%)
Average Rent 12 Month Rent
Growth
Metro 196k sf -383k sf 5.1% $13.35 0.5%
Submarket 0k sf 14.1k sf 3.0% $13.34 0.9%
Source: Costar
National retail tenants are unlikely to have expressed significant interest in West Plains due to the lack of
residential rooftops, lower household incomes, and stagnant growth. This has arguably resulted in an under-
retailed environment with the majority of West Plains residents doing their shopping in the City of Spokane—
the closest retail center.
This has perhaps contributed to significant spending leakage across all retail categories, as shown in the
following chart. Leakage occur when household spending is not captured within the defined trade area. When
local demand for a specific product is not being met within a trade area, consumers are going elsewhere to
shop, creating retail leakage.
Opportunities appear to abound to recapture a substantial portion of existing leakage within West Plains in the
form of new retail development. Recapturing all or even half of leakage is highly unlikely. Instead, community-
serving retailers, such as restaurants, grocery stores, and health stores are likely to make significant inroads in
recapturing existing leakage.

West Plains Transportation Management Plan | Market Analysis and Development Forecast
www.lelandconsulting.com 20
Figure 10. Spending Leakage by Retail Category
Industrial Market
The new Amazon distribution center aside, Spokane’s industrial sector remains a local market despite exhibiting
very strong fundamentals. Rent growth has posted substantial gains for years, and vacancies are well below the
historical average. However, construction has been limited. Inventory has increased by only 3.7 percent since
2010, with absorption steadily outpacing new supply. The Spokane metro’s moderate sales volume is in line with
the historical average. Many properties trade hands each year, though at low prices, and typically both buyers
and sellers are based within the region.
With this said, economic development and other marketing efforts have intensified in recent years to broaden
the reach of Spokane’s economy and attract and expand companies to the region. Indeed, the metro region
currently boasts the fifth largest aerospace manufacturing cluster in the United States and the industrial market
stands to gain a significant impetus if these economic development efforts are successful in attracting related
industries.
Market data pertaining to the West Spokane County Submarket (West Plains) is as follows.
• Absorption has fallen in West Plains over the past 12 months, although the last 10 years has averaged
around 110,000 square feet of positive net absorption. This is largely due to significant new vacancies in
2018, resulting in a vacancy rate spike. Vacancies have otherwise been very low over the past decade.
• Rent growth remains high—a positive sign for new development—although industrial development
typically follows buy/sell trends than rental trends.
$0 $10 $20 $30 $40 $50 $60 $70
Building Material, Garden Equip
Electronics and Appliance
Sporting Gds, Hobby, Book, Music
Food and Beverage (grocery)
Furniture and Home Furnishings
Misc. Store Retailers
Foodservice and Drinking Places
Health and Personal Care
Other (incl. cinema,
prof./med. office, banks)
Clothing and Accessories
General Merchandise
Millions $

West Plains Transportation Management Plan | Market Analysis and Development Forecast
www.lelandconsulting.com 21
• Upcoming projects include the 2,560,000 square foot Amazon facility, Kenworth Trucking (80,000 sq.
ft.), and a number of proposed projects in and around the Pacific Northwest Tech Park along US-2 that
have not been finalized.
• Despite the lack of deliveries in in the last year, approximately 1.2 million square feet of new industrial
space was built (not including flex) since 2010—accounting for more than one-quarter of existing
inventory. The recent construction surge indicates an emerging industrial market in the West Plains that
appears set to continue.
Area 12 Month
Deliveries
12 Month
Absorption
Vacancy Rate
(%)
Average Rent 12 Month Rent
Growth
Metro 266k sf -81.3k sq. ft. 2.7% $6.90 4.2%
Submarket 0k sf -83.6k sq. ft. 6.1% $6.78 4.5%
Source: Costar
Office Market
The Spokane office market presents mixed indicators. Though pipeline activity remains limited, vacancy rates
have fluctuated significantly. Deliveries during the current cycle have largely been build-to-suits, and more
recent speculative projects are experiencing lease-up challenges. However, though rent growth remains fairly
low, it remains stronger than both the historical average and the three preceding years. Additionally, investment
in Spokane is increasing. Sales volume in 2018 was near the cycle peak, seeing the largest office trade of the
post-recession era. That said, the office market appears limited to downtown, with even higher vacancies, lower
rent growth, limited construction, and negative absorption in the north county submarket.
Market data pertaining to the West Spokane County Submarket is as follows.
• With only 536,000 square feet, West Plains’ office sector is considered local. New construction has been
very limited, although new medical-related offices have recently been in the pipeline.
• Vacancies have fluctuated significantly despite the lack of new construction, providing signs that the
market would support new development.
• Rent growth among the existing inventory has been stagnant, with rents averaging around $17 per
square foot (gross).
• With regard to absorption, the West Plains submarket has actually performed better than the wider
region, helping to lower vacancies. A prolonged period of positive absorption may help attract office
developers to the area.
• Despite weaker office market fundamentals (such as slower rent growth, relatively stagnant construction
activity, and moderate average rents), office development is likely to ramp up, albeit as a secondary
land use (to industrial, retail, and residential uses) and only in select locations. New development is
likely to locate primarily around Flint Road near existing and planned office development. Continued
infrastructure investment and successful economic development efforts are likely to support additional
office growth. Further, residential growth will heighten the need for medical offices, such as clinics and
dentists, and support specialized office developments, such as coworking spaces, business incubators,
and small-scale speculative office space.

West Plains Transportation Management Plan | Market Analysis and Development Forecast
www.lelandconsulting.com 22
Office Market Trends, Spokane Metro Region, 2019 Q2
Area 12 Month
Deliveries
12 Month
Absorption
Vacancy Rate
(%)
Average Rent 12 Month Rent
Growth
Metro 6.3k sf 493k sq. ft. 8.2% $17.27 PSF 2.8%
Submarket 0k sf 74.7k sf 5.7% $17.14 PSF 2.6%
Source: Costar
Demand Forecasts
Demand forecasts for retail, residential, office and industrial development over the next 20 years are shown in
the following pages. Both the retail and residential forecasts utilize projected annual household growth rates.
Given the lack of geographically specific projected growth rates for West Plains, LCG has triangulated multiple
data sources—including existing county-wide projections and historical growth rates—to come up with a 2.6
percent annual growth rate in an attempt to minimize the potential margin of error.
Methodology
Retail Demand Forecast
The retail demand model provides estimated demand by square feet per retail category for the primary trade
area, which extends west in a semi-circle 35-miles from near the US-2 and I-90 interchange, in an area
encompassing Davenport, Harrington, Sprague, and Spangle. The primary trade area represents the area from
which most retail spending will be derived.
LCG’s demand model is built from consumer spending reports that show existing household demand and
spending for every retail category. Projected annual growth rates are then applied to existing demand, leakage
recapture potential is assessed, and an assumption is made about the level of redevelopment or replacement of
standing inventory due to obsolescence.
The resulting demand model shows the total estimated square feet of new retail development that can be
expected over the next 20 years in the primary trade area.
Residential Demand Forecast
The residential demand model provides the estimated number of single-family and multifamily housing units
expected in the residential market area over the next 20 years. The residential market area is generally defined
by the West Plains study area, Medical Lake, Cheney, Four Lakes, and Cheney Spokane Road—roughly a 7.5-
mile radius around the 902/I-90 interchange. This subregion represents the residential market area, reflecting
the area that shares similar characteristics with the West Plains study area and from which most competitive
development will originate.
The residential model similarly utilizes triangulated growth rate projections to build off the existing housing
inventory. The models apply these growth rates to the existing number of households by income to provide a
breakdown of total demand by future income level. Assessing tenure trends (i.e. rent versus own) distinguishes
the number of rental apartments to owned single-family homes and townhomes.

West Plains Transportation Management Plan | Market Analysis and Development Forecast
www.lelandconsulting.com 23
Office and Industrial Demand Forecast
The employment demand model provides the estimated amount of industrial and office development by new
square feet in West Plains over over the next 20 years. Given the lack of competing employment lands
elsewhere in the region (namely to the south and west of the West Plains study area) and the unique market
characteristics of the West Plains, the West Plains boundary serves as the primary employment market area.
To calculate demand for employment uses, we apply annual growth rates to current employment data. Growth
rates are triangulated for each industry based on published projected growth rates for the region, expected
growth from new projects in the pipeline, and historical trends. Applying industry standards to these job totals,
such as space needs and the percentage of workers in either office or industrial space, then provides total
estimated building square footage.
Retail Demand
Total retail demand for the primary trade area over the next 21 years is shown in the following figure. This shows
the total retail square footage expected to be supported by existing and future households and visitors.
The chart shows three sources of demand for the development of new retail space:
• Household growth, i.e., from new households moving into the market area;
• Leakage recapture, i.e., by “recapturing” some of the retail spending that households are making outside of
the market area; and
• Replacement, reflecting the fact that existing space becomes obsolete over time. This is a small share of
overall demand.
Retail demand for the entire primary trade area accounts for 2.3 million square feet over the next 21 years. With
the model utilizing a 2.6 percent annual household growth rate, it is reasonable to think that additional demand
may arise with other demand drivers, such as significant employment generation and tourism efforts.
Given the lack of other competing areas of retail throughout the primary trade area, West Plains can expect to
capture the vast majority of total retail demand. Recent development trends show West Plains capturing upward
of 75 percent of new retail demand in the trade area. Using this same metric, West Plains might capture 1.7
million square feet of retail within its boundaries, depending on available land, infrastructure capacity, and
continued residential and employment growth.

West Plains Transportation Management Plan | Market Analysis and Development Forecast
www.lelandconsulting.com 24
Figure 11. Retail Demand, Primary Trade Area, 2019-2040
Residential Demand
The following chart shows total market area demand for multifamily and single-family housing units. In total, we
project demand for 16,500 new residential units in the market area—an area containing Medical Lake, Cheney,
and extending west about 7.5 miles from the 902/I-90 interchange.
As West Plains is unlikely to capture 100 percent of total market area demand, a capture rate needs to be
established based on historical trends and anticipated future trends. Medical Lake, Cheney, and the surrounding
unincorporated county land will continue to grow and capture a significant portion of demand. However, West
Plains is well-poised to capture denser housing typologies, such as apartments and townhomes, as well as a
smaller share of single-family homes. Indeed, a look at recent trends suggest that this is highly likely, particularly
as subdivisions are completed and land becomes scarcer.
Between 2000 and 2019, West Plains was responsible for about 35 percent of new growth in the residential
market area, up from 25 percent between 2000 and 2010, suggesting an increasing preference for residential
development in West Plains.
As such, while we anticipate a similar rate of growth to continue in West Plains, we expect the area to be able to
capture about 30 percent of total market area demand, equating to about 5,000 units. A conservative estimate
of attainable capture, with 10 percent of single-family detached, 25 percent of single-family attached, and 40
percent of rental apartments would equate to 3,940 total units.
0 100,000 200,000 300,000 400,000 500,000
Electronics and Appliance
Building Material, Garden Equip
Sporting Gds, Hobby, Book, Music
Furniture and Home Furnishings
Misc. Store Retailers
Health and Personal Care
Clothing and Accessories
Foodservice and Drinking Places
Food and Beverage (grocery)
Other (incl. cinema,
prof./med. office, banks)
General Merchandise
est. square feet
Household Growth
Leakage Recapture
Replacement
2.3 million square
feet total

West Plains Transportation Management Plan | Market Analysis and Development Forecast
www.lelandconsulting.com 25
Figure 12. Residential Demand, Residential Market Area, New Units, 2019-2040
Office and Industrial Demand
Primary drivers of demand are likely to remain industrial-oriented, particularly with Amazon’s new facility
creating additional interest for associated warehousing and distribution. Aerospace manufacturing growth at
and around Spokane International Airport will support manufacturing growth and, to a lesser extent, research
and development. Successful economic development efforts may provide even more impetus to this industry.
Also, while not necessarily market-driven, the continued growth of “public administration” jobs will continue to
support both office and industrial development, particularly at Fairchild and the airport.
New estimated demand for office and industrial development over the next 21 years is as follows.
270,000 sq. ft. 6,340,000million sq. ft.
Flex space, which can often bridge the gap between office and industrial, depending on total market demand,
currently accounts for about 15 percent of office, industrial, and flex space in West Plains. At a similar rate, flex
development would account for an additional 1.0 million square feet. However, flex is particularly challenging to
forecast, so we would simply expect that any potential market gaps in the future would be plugged by new flex
space.
1,191900 1,042
1,558 1,472
973
523
46 0
132
225
447
1,0391,472
1,806
2,091
880744
0
500
1,000
1,500
2,000
2,500
3,000
3,500
< $15K $15-25K $25-35K $35-50K $50-75K $75-100K $100-150K $150-200K $200K+
0-25% 25-45% 45-65% 65-90% 90-135% 135-180% 180%+ 180%+ 180%+
$375 $625 $875 $1,250 $1,875 $2,500 $2,500+ $2,500+ $2,500+
$45,000 $75,000 $105,000 $150,000 $225,000 $300,000 $450,000 $600,000 $600,000+
90% 80% 70% 60% 45% 10% 5% 0% 0%
Num
ber
of
Units
Multifamily
Single-familyTotal Units:
16,543
H'hold Income
AMI Percentile
Max Rent
Max Home Price
Est. % Renter
West Plains Transportation Management Plan | Market Analysis and Development Forecast
www.lelandconsulting.com 26
DEVELOPMENT PROGRAM
This section describes total predicted new development, based on known projects, land supply analysis,
planning documents, and general development trends in the area, among other elements. The development
forecast applies the findings from the market analysis to the West Plains study area at the parcel level,
highlighting potential development opportunities on a site-by-site basis.
Generally, the Hwy 2 (City of Spokane segment) and I-90 corridors are likely to see the most development
activity based on current development trends, existing infrastructure capacity, and a number of planned projects
providing impetus to the market. Key takeaways, including phasing notes, additional rationale, and other
findings relating to each development type are discussed below.
• For industrial, development to the south of the airport is likely to follow in Amazon’s footsteps. New
infrastructure investments and access to high quality transportation networks make this area particularly
attractive to transportation, distribution, and warehousing companies. The new Geiger Rail Spur and planned
transload facility will also improve prospects for industrial users, like manufacturers, for the area surrounding
McFarlane Road, although much of this land is owned by the airport. The remaining areas likely to see
additional industrial development are the Pacific Northwest Tech Park, the area south of Triumph, and the
airport business. These areas are served by existing infrastructure and transportation networks and
development interest have recently peaked.
• Development of airport-owned land is challenging to forecast for a number of reasons. There is a
concerted effort to attract large companies to the area that are tied to the aerospace industry, but these
rarely follow regular market dynamics. We understand that talks are underway with a number of companies
but may not necessarily result in new development projects. Another complication for airport-owned land
are the FAA regulations that restrict the sale of the land for private development, which is to be considered a
barrier to development. If the PDA and airport’s economic development efforts are successful in attracting a
number of large companies to the area, full build-out numbers are more likely to apply (development would
likely impact TAZ 460, 546, and potentially 551). The aforementioned transload facility will likely increase the
appeal of this land to these companies.
• For residential, development activity is largely expected in Airway Heights, on Kalispel Tribal land, and south
of I-90. Single-family residential will continue to be highly sought after, particular homes in the $200,000 to
$300,000 range that give West Plains a competitive advantage over its neighboring area. Continued
residential construction of lots in the County south of I-90 and outside the overlay zone is expected, adding
significant residential activity to the area and supporting retail demand. Substantial residential activity is also
planned for the Kalispel Tribal land, which will capitalize on the high demand for multifamily units. Airway
Heights’ residential areas to the north of Hwy 2 will likely continue to see residential construction until full
build-out is achieved, likely before the 2040 planning horizon. At which point, increasing the availability of
buildable residential land through rezoning or annexation may be needed; the strength of the housing
market is likely to support almost all additional development.
• For retail, there are a few areas identified for significant retail development, largely based on available land,
suitable zoning, visibility and access. These include eastern Airway Heights and further along US-2 (near the
proposed North 40 outfitters), as well as surrounding each of the I-90 interchanges. Retail is currently
challenging on industrially zoned land in the City of Spokane and Spokane County within the airport overlay
zone. Commercial developments and expansions of existing property (potentially including retail, hotel, and
other entertainment uses) are also expected on both Kalispel and Spokane Tribal Lands.

West Plains Transportation Management Plan | Market Analysis and Development Forecast
www.lelandconsulting.com 27
• The office market is limited and is unlikely to see the same uptick in development activity as residential and
industrial. Some data points to a handful of small- and medium-sized office projects on or near existing
business parks to the north and east of the airport. The development forecast summary table, below,
presents about 90,000 additional square feet of office space than the demand forecast in the previous
section identified. This is to be considered a “buffer” that would largely be accommodated by flex
development, although flex space is likely to assume a larger market share than 90,000 square feet over the
next 20 years.
• Significant infrastructure investment is required to increase the development capacity of the West Plains,
particularly in order to attract high-intensity industrial users. Water remains an issue to be addressed,
especially in Airway Heights, and improvements to the transportation network have highlighted as necessary
for the area’s continued development. With an understanding that there are plans for major infrastructure,
this investment would greatly increase development prospects by helping to prepare shovel-ready land and
heighten development feasibility for all users, particularly with regard to land to the south of Hwy 2 (in and
near Airway Heights).
These site-specific development projections are presented in the following map.
Figure 13. Anticipated New Development, 2019-2040
Source: Leland Consulting Group

West Plains Transportation Management Plan | Market Analysis and Development Forecast
www.lelandconsulting.com 28
Development Forecast Summary
In order to populate traffic models, these site-specific development projections are packaged into areas called
traffic analysis zones (TAZ). Development projections for each land use in each TAZ are presented in the
following table. Basic metrics (such as average square feet per employee for each land use and people per
household) are provided to show estimated job generation and population growth. For industrial job
generation, we assume a lower density to reflect the propensity of new industrial to be largely tied to logistics,
warehousing, and distribution. Additional manufacturing jobs—particularly aerospace-related—would be
expected to be higher density. Several additional notes are provided below the table.
Table 4. Market-based Development Forecast, 2019-2040
TAZ Number Housing
Units
Industrial Office Retail Hotel Storage Other/
Misc.4
459 1,098 25,744
460 500,000a
461 150,000
462 567 118,021
463 120,000 100,000 120,000
464 241 475,060 31,494 105,851
546 249
547 78 201,705 120,160 368,015
549
550 204 769,416 285,274 387,629 64,040
551 3,520,215b 407,460 63,824 38,021
552 298,916 113,555 104,361
553 791 177,829 12,000 146,362
556 295,206
558 8
559 897 201,979
579 147
Total Dev't. 4,274 6,263,141 328,768 e 1,721,967 268,185 470,076 270,000
Est. Employees5 8,563c 939 2,870 107 19 450
Est. Pop (2.60/HH) 11,112 Total Est. Employment: 12,949d
Source: Leland Consulting Group
4 “Other/Misc.” here refers to non-specific commercial uses associated with the potential development on Tribal Lands,
which may include hotel(s), entertainment uses, retail, etc.
5 These employment projections are calculated using a combination of direct employment inputs for planned and under
construction projects with known project details and estimated forecasts for projected development using average industry
standards for square footage per job (the rationale for which is provided on the following page).

West Plains Transportation Management Plan | Market Analysis and Development Forecast
www.lelandconsulting.com 29
a Mullen Technologies Inc. planned development for 500,000 square foot manufacturing plant adjacent to the planned
Transload Facility employing around 800 people (625 sq. ft. per employee). An additional 800,000 (1.3 total) square feet and
2,200 jobs (3,000 total) may be possible with a potential lithium battery R&D and production facility (potential expansion, not
planned). Only the first, known phase of development is included in this analysis.
b Includes known 2.6m sq. ft. Amazon facility, set to employ between 1,500 and 1,800 employees, with seasonal influxes up to
2,300 (model uses an average of 2,000 employees—an equivalent of 1,300 sq. ft. per employee).
c Job density calculations are used for speculative development only. That is, for large planned and under construction
projects—such as Kenworth Trucking, Amazon, Mullen Technologies, etc.—this job data is added directly to the model, rather
than as an employment density calculation. That said, it is expected that, cumulatively, new development will largely follow
industry standards.
d This employment forecast is significantly higher than most employment projections sources indicate. That is because these
projections are typically based on historical averages and high-level trends. This analysis, on the other hand, blends market
research and analysis with a detailed understanding of the development pipeline, highlighting several substantial projects that
do not abide by typical market dynamics (for example, a market analysis cannot provide guidance on whether a development
as large as Amazon will occur because there are far more important elements at play, nor can it indicate significant growth in
government institutions, such as Fairchild Air Force Base).
e Assumes additional development beyond the office demand presented in the previous section due to demand for flex space.
Employment Density
Existing employment at a specific site can be known with certainty. But often, industry averages serve as a
starting point for communities planning future land use. Several institutions have research on the average
square feet typically utilized by employees for different land uses. These include the Building Owners and
Managers Association (BOMA), the U.S. Energy Information Administration (EIA), commercial brokers, and local
governments that have conducted surveys of commercial buildings to identify space utilization averages for
specific building types or industries. The variability of the data is typically broad, so a certain level of
customization is required depending on anticipated land uses. For example, big box retail and warehouse
industrial or high tech industrial data centers will have fewer employees per square foot than food-service retail
and manufacturing industrial. Total employment generation for known development projects in the region also
help ground truth some of these density assumptions.
The following table provides an explanation of the rationale behind the employment density used in the
development forecast.

West Plains Transportation Management Plan | Market Analysis and Development Forecast
www.lelandconsulting.com 30
Table 5. Typical Space Utilization Per Job
Land Use Sq. Ft./
Emp Rationale
Industrial 1,000 EIA recommends 1,500 square feet (sf) for warehouse, using 2012 data, while Energy
Star estimates 1,700 sf. Building Owners and Managers Association (BOMA)
recommends 469 sf per employee for industrial (primarily manufacturing). Snohomish
County’s 2007 employment density study estimated 1,000 for wholesale,
transportation, and utilities (WTU), and 500 for manufacturing. With industrial
development expected to largely mostly WTU and warehousing, we expect a
marginally higher-than-average employment density metric of 900 to 1,100 sf.
Office 350 EIA recommends 600 sf per office job, and 550 for medical offices. However, EIA uses
2012 data and new research (C&W, URL) indicates office space utilization trending
towards 180 sf. BOMA, as of 2018, also recommends 288 sf per worker for private
sector office buildings. Several other planning agencies have documented 250 sf for
traditional office, 350 for R&D or flex, and 400 for medical office.
For the West Plains area, where office space is likely to be limited to land uses that
require more space, such as flex buildings, medical offices, and secondary office
buildings (i.e. in support of other industries, like construction), employment density is
likely marginally lower than the BOMA and broker numbers, which would apply mostly
to established urban office locations.
Retail 600 Retail development can be either food service establishments strip/big box retail, or
others, each of which have different employment densities. Regional planning entities
have these ranging from 200 sf for food service, to 600 or more for traditional
mercantile retail, and 1,000 for a supermarket. EIA estimates are high, at 920 sf for
traditional retail and 567 for food service but reflect the range of metrics presented by
different entities. Retail in West Plains is likely to be predominantly traditional
mercantile, so an upper range of 600 is reasonable.
Hotel 2,500 EIA’s estimates for hotel employment density is approximately 2,500 sf. While the data
is from 2012, there have been few changes in the manner in which hotels operate over
the past decade, so it is reasonable to assume this information still rings true. More
recent data provided by Energy Star also uses a ratio of 0.32 workers per 1,000 sf, the
equivalent of about one employee per 2,500 sf (URL).
Self-
Storage
25,000 Self-storage typically only employs a full-time attendant and one or two others due to
its hands-off and often automated nature. This is reflected in the fact that it is one of
the lowest employment generators across all land uses.
Other/
Misc.
600 For properties that do not necessarily fit within the above categories, such as
entertainment uses associated with the casino and/or others, are likely to follow a
similar trend to retail.
Source: Leland Consulting Group