Market Access in FTAs: Assessment Based on Rules of ... and Agricultural Trade Liberalization Inkyo...
53
DP RIETI Discussion Paper Series 07-E-016 Market Access in FTAs: Assessment Based on Rules of Origin and Agricultural Trade Liberalization Inkyo CHEONG Inha University Jungran CHO Inha University The Research Institute of Economy, Trade and Industry http://www.rieti.go.jp/en/
Transcript of Market Access in FTAs: Assessment Based on Rules of ... and Agricultural Trade Liberalization Inkyo...

DPRIETI Discussion Paper Series 07-E-016
Market Access in FTAs:Assessment Based on Rules of Origin and Agricultural Trade Liberalization
Inkyo CHEONGInha University
Jungran CHOInha University
The Research Institute of Economy, Trade and Industryhttp://www.rieti.go.jp/en/

1
RIETI Discussion Paper Series 07-E-016
2006-11-16
Market Access in FTAs: Assessment Based on Rules of
Origin and Agricultural Trade Liberalization
Inkyo Cheong (Professor of Economics and Director for Center on FTA Studies, Inha University)
Jungran Cho (Research Fellow, Center on FTA Studies, Inha University)
Table of Contents
1. Introduction 2. Descriptive Overviews of ROO 2.1. Theoretical Survey of ROO 2.2. Descriptive Analysis of ROO in Major FTAs 3. Empirical Assessment of ROOs 3.1. Analysis on Index Components 3.2. Assessment of Restrictiveness of ROO 3.2.1. Existing Studies 3.2.2. Restrictiveness of ROO in FTAs by Japan and Korea 4. Agricultural Liberalization in Major FTAs 4.1. FTAs by Western Countries 4.2. FTAs by Japan and Korea 4.3 ASEAN-China FTA 5. Conclusion References Appendices
2
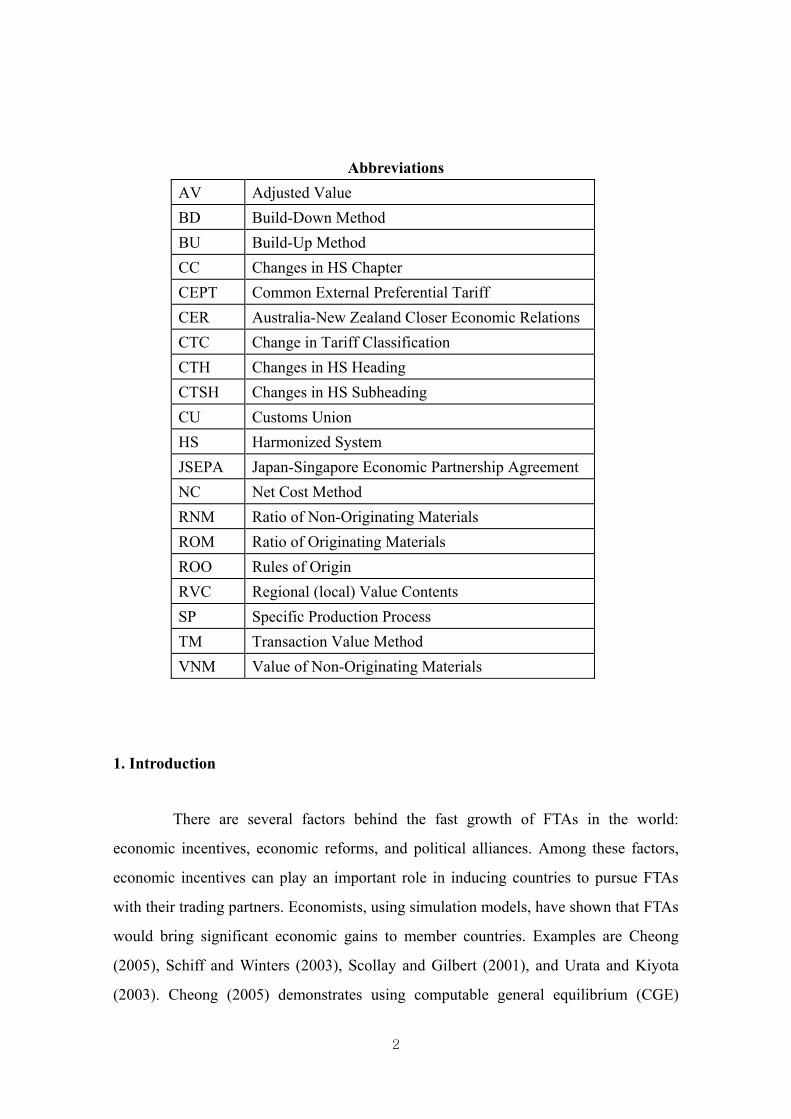
Abbreviations AV Adjusted Value BD Build-Down Method BU Build-Up Method CC Changes in HS Chapter CEPT Common External Preferential Tariff CER Australia-New Zealand Closer Economic Relations CTC Change in Tariff Classification CTH Changes in HS Heading CTSH Changes in HS Subheading CU Customs Union HS Harmonized System JSEPA Japan-Singapore Economic Partnership Agreement NC Net Cost Method RNM Ratio of Non-Originating Materials ROM Ratio of Originating Materials ROO Rules of Origin RVC Regional (local) Value Contents SP Specific Production Process TM Transaction Value Method VNM Value of Non-Originating Materials
1. Introduction
There are several factors behind the fast growth of FTAs in the world:
economic incentives, economic reforms, and political alliances. Among these factors,
economic incentives can play an important role in inducing countries to pursue FTAs
with their trading partners. Economists, using simulation models, have shown that FTAs
would bring significant economic gains to member countries. Examples are Cheong
(2005), Schiff and Winters (2003), Scollay and Gilbert (2001), and Urata and Kiyota
(2003). Cheong (2005) demonstrates using computable general equilibrium (CGE)

3
models that East Asian countries can collect the highest gains with a region-wide FTA in
East Asia rather than any subregional FTA. Schiff and Winters (2003) also show
through simulation analyses that there are potential dynamic gains for member countries
from FTAs. Scollay and Gilbert (2001) forecast positive impacts on world trade through
FTAs, indicating that trade creation associated with FTAs is greater than trade diversion.
Regarding FTAs in East Asia, Urata and Kiyota (2003) predict that emerging economies
in Southeast Asia and China gain a great deal more in terms of increases in GDP from
joining an East Asian FTA than other economies such as Korea and Taiwan in Northeast
Asia.
However, economic gains that are forecasted by simulation models cannot be
realized automatically from the inception of an FTA. It is important to introduce
measures such as FDI liberalization and the lowering of trade barriers to market entry to
increase the benefits of joining an FTA. All studies cited above are based on the
assumption that tariff elimination and loose rules of origin (ROO) will exist at the
foundation. Therefore, it can be said that the quality of FTAs is critical in determining
the scale of economic gains.
Most countries that establish FTAs state that they are pursuing high quality
FTAs. A country cannot become an FTA hub in a region automatically by expanding the
number of FTAs that it is involved in. Rather, it is necessary for a country to show a
strong willingness for trade liberalization and trade facilitation by maximizing market
access and harmonizing trade rules. In reality, market access is a core element for FTA
negotiations, and should be evaluated from several viewpoints such as tariff elimination,
the easing of non-tariff barriers (NTBs) such as customs clearance, the simplifying of
rules of origin, and the improvement of trade rules.
This paper tries to assess the quality of FTAs in terms of tariff elimination for
agricultural products and rules of origin. While analyzing the improvement of NTBs
and trade rules is also important in determining the quality of FTAs, this cannot be
easily evaluated in quantitative terms. This paper analyzes market access in
representative FTAs such as NAFTA, EU-Mexico FTA, Australia-New Zealand Closer

4
Economic Relations (CER), Japan-Singapore Economic Partnership Agreement
(JSEPA), Japan-Mexico Economic Partnership Agreement (JSEPA), ASEAN-China
FTA, Korea-Mexico FTA and Chile-Korea FTA. Chapter 2 discusses theoretical aspects
of ROO, and Chapter 3 provides the evaluation results on the stringency
(restrictiveness) of rules of origin. In Chapter 4, FTAs are assessed in the context of
agricultural tariff elimination. Since most FTA cases show that most manufacturing
goods are liberalized within 10 years of the implementation of the FTAs, only the
agriculture sector, which is the most sensitive sector in FTAs, is taken into account for
the study. Finally, concluding remarks are provided in the Chapter 5.
2. Descriptive Overviews of ROO
2.1. Theoretical Survey on ROO
One of the differences between Customs Union (CU) and FTA is the authority
to change tariffs on imports from non-member countries. CU member countries
introduce common tariff rates against non-member countries, and they cannot change
tariff rates voluntarily without prior consultation with other member countries. 1
However, FTA member countries can set tariff rates (not higher than WTO-bound rates)
independently. Because the tariff rates of the member countries of an FTA are different,
trade deflection can occur.2 In order to prevent trade deflection, FTA member countries
introduce specific rules, regulating that only the goods satisfying the rules be given
preferential treatment in terms of tariffs. These rules are called rules of origin (ROO).
There are three criteria for defining ROO in FTAs. The first criterion is Change
in Tariff Classification (CTC) or “tariff line shift.” CTC is widely used in regional
trading agreements (RTAs), and is preferred by the World Customs Organization
(WCO), which promotes the simplification and harmonization of ROO. CTC is based 1 CU also needs ROO during the transitional period toward the implementation of common external tariffs. 2 Trade deflection means that a good imported via a low tariff FTA member country is re-exported into a country with high tariffs without paying tariffs.

5
on the Harmonized System (HS), classifying goods at a two-digit chapter level, a four-
digit heading level, a six-digit subheading level or an eight (ten)-digit level. The
second rule is the requirement of Regional (local) Value Contents (RVC), implying the
requirement that the product should acquire a minimum regional value in exporting
country or a region of a RTA.3 The third rule is the requirement of Specific Production
Process (SP), which requires a specific production process for an item. Each criterion
has merits as well as demerits, as shown in Table 1. The CTC approach is relatively
simple in requiring the comparison between the tariff line of a final product and those of
intermediate materials, but it bears an intrinsic problem in that the HS system does not
follow industrial classifications for many products.
Table 1. Merits and De-merits by ROO Criteria
Merits De-merits CTC Simple comparison between
intermediate materials and final products
HS system is for trade classifications rather than for industrial classifications
RVC Simple, transparent, easy to check
Manipulations in accounting, the effect of exchange rates, coverage of costs (logistics, trademark etc)
SP Objective rules No incorporation of technical development. Requirements are too stringent in most cases.
RVC is widely used in most FTAs since the criterion is simple and easy to check, but the ROO of a good can be changed by manipulating the customs value. For example, increasing profits (accounting purpose) can change a non-originating good into a ROO-qualifying one, as demonstrated in Table 2.
Table 2. RVC Criterion and Profit Rates 3 The rule of regional value contents can be considered in various ways such as export value, import value and value of parts included in an article. However, we do not consider these separately, regarding all methods as regional value contents.

6
(unit: $, %)
Profit Rate
VNM VOM Value Added
Profits Customs Value
RVC (%) ROO
10% case 50 20 20 9 99 49.5 NO
20% case 50 20 20 18 108 53.7 YES
Note: ROO is 50% RVC
FTAs introduce multiple methods for calculating RVCs. Most commonly used
methods are as follows: Build-Down, Build-Up method and Share of Non-Originating
Parts. The RVC ratio, based on Build-Down, is expressed as a percentage in calculating
the difference between the adjusted value (AV) and the value of non-originating
materials (VNM) that are acquired and used by the producer in the production of the
good, and then divided by the difference with AV. Explanation for other methods are
given in Table 3.
Table 3. Methods for Calculating RVC
Method Equation NAFTA Method Build-Down Method
100*AV
VNMAV − Transaction Value Method:
100*TV
VNMTV −
Build-Up Method 100*
AVVOM
Net Cost Method:
100*NC
VNMNC −
Share of Non-Originating Parts
100*AV
VUOMVNM +
AV: Adjusted Value, VNM: Value of Non-Originating Materials, VOM: Value of Originating Materials,
VUOM: Value of Materials with Uncertain Origin, TV: Transaction Value, NC: Net Cost
Most RTAs employ multiple criteria for setting ROO, rather than applying a
single rule. According to the WTO (2002), while ROOs in many FTAs are based on
CTC, RVC and SP, a combination of the three methods rather than any one single

7
method is widely used in an FTA.
Table 4. Frequencies of CTC, RVC and SP in RTAs
RTA (no. of RTAs) CTC RVC SP
CU (6) 6 4(35-60%) -
FTA and PTA (87) 83 75(35-60%) 74
Note: Numbers in parentheses imply the minimum requirement ratios.
Source: Modified from WTO (2002, p8)
Each criterion that is used for defining ROO has its advantages and
disadvantages, and it is not easy to conclude which rule is the most desirable.4 However,
even though a specific rule is used, the stringency of the criterion can be changed
depending on a member country’s position towards trade liberalization. For example,
chapter change will be more stringent than changes in heading or subheading, when the
CTC method is employed. In the case that the RVC criterion is used, a 60% regional
value contents rate will be more stringent than 40%.
Some elements of ROOs are designed to promote intra-regional trade, although
ROOs in general constitute protectionist practices. For example, Cumulation5 and De
Minimis are commonly introduced in FTAs in order to facilitate producers under certain
conditions to use intermediate inputs from the region of another FTA or a third country.
De Minimis is called a tolerance rule in literature on the ROO and is found in 88 out of
93 RTAs surveyed, according to the WTO (2002, p9). In most cases, the De Minimis
rule is applied to less than 10% of the total value of final products to be sourced from
non-member countries.6
ROOs act like trade barriers, since they cause extra costs in production and
management. Producers/exporters need to pay costs for calculating production costs and
4 Parmeter (1997, p342) states that “although FTAs require rules of origin, there is a problem: there is no completely satisfactory rule of origin.” Regarding merits and demerits of methods of setting ROO, refer to Parmeter (1997) and Estevadeordal (2003). 5 Cumulation can be classified as bilateral cumulation, diagonal cumulation and full cumulation. Refer to Estevadeordal (2003) regarding the classification of cumulation. 6 EC-South Africa FTA sets 15% for De Minimis rule, but this is an exceptional case.

8
producing bookkeeping-related documents. 7 Also, extra costs will be incurred in
complying with the technical and specific process and regional value contents as
specified in the ROO protocol, and these costs will be added to the prices of export
goods.8
As ROOs become more stringent, the compliance costs will rise, undermining
the gains in terms of trade creation that can be obtained from an FTA. APEC (2004,
p76) states, “The complexity and stringency of ROO employed in RTAs has given rise
to concerns over the diversionary effects that ROO may have on trade and investment
flows.”
2.2. Descriptive Analysis of ROO in Major FTAs
This section provides descriptive analysis of ROOs in major FTAs, focusing on
assessing the stringency of ROOs. Empirical examination of the stringency of ROO will
be given in the following chapter. Most FTAs have a several hundred pages on ROO
protocol, and thus, requires a large amount of time and effort to understand the structure
and technical aspects of the ROO in a FTA. Unfortunately, the existing literature on the
subject is limited.9
For the analysis of ROOs, several FTAs were chosen as case studies for this
paper. They are NAFTA and the EU-Mexico FTA, which represent the first-generation
FTAs pursued by the US and the EU. Examples of FTAs under implementation by East
Asian countries are ASEAN Free Trade Area (AFTA) and ASEAN-China, Japan-
Singapore (EPA), US-Singapore, Japan-Singapore, Japan-Mexico, Korea-Singapore,
and Korea-Chile FTAs. In this section, we will compare the stringency of ROOs of East
Asian FTAs with that of the US and EU FTAs. Before presenting the result, however, it
is worth mentioning that the ROOs in the AFTA and the ASEAN-China FTA, which
introduce a simple rule for ROO. But other FTAs by East Asian countries have chosen 7 Regarding empirical research on administrative costs in a FTA and costs of preparing documents for preferential treatment, refer to Koskinen (1983) and Herin (1986), respectively. 8 Several empirical researches on the costs of stringent ROO under NAFTA show substantial costs to intra-regional traders and producers. For example, Cadot et al (2002) found that the utilization rate of NAFTA preferences is as low as 64% due to stringent ROO in part. Regarding more information on the costs of ROO, refer to Estevadeordal (2003, pp.8-9). 9 Comprehensive analysis of ROO in major RTAs can be found in Brenton (2003), Estevadeordal (2003), and WTO (2002).

9
to follow more complicated rules of origin.
● ROOs in the US and EU FTAs
NAFTA is the first FTA with comprehensive coverage of trade, investment,
services, and trade rules. In promoting FTAs, the US has imposed quite stringent ROOs
based on the change of heading, specific requirements for HS chapters, and complicated
criteria for the regional value content. Essevadeordal (2003, p348) evaluated that the US
specifies the ROO of “substantial transformation” in its FTAs. The CTC in chapter,
heading and subheading is most widely used, with additional requirements of specific
process and regional value contents. De Minimis rule is 7% in NAFTA, lower than in
other FTAs.
Since then, several countries have followed the structure of NAFTA ROO with
minor modifications for some items.10 A stringent ROO of “wholly obtained or
produced entirely” is applied to primary industries, and each of the non-originating
materials used in the production of the good must undergo an applicable change in tariff
classification set out in Annex 401 of the agreement. Technical processes are required
for many items. Regional value contents ratios are as high as 50-60% depending on
calculation methods.11 The agreement specifies a more stringent rule for automobiles
(HS8702-8704) with 62.5% under the net cost method.
In other FTAs, the US introduces a lower regional value contents ratio. For
example, in the US-Chile FTA, 35% (Build-Up) and 45% (Build-Down) were adopted
for some of HS34. A similar ROO is used for the US-Singapore FTA. However, a more
stringent ROO was introduced in the US-Australia FTA, especially for textiles and
footwear. In case of footwear (HS64), the regional value contents ratio is set at 55%
(Build-Down) with an additional requirement of subheading change. The analysis of the
US’s FTAs suggests that the stringency of ROO depends on its FTA partners.
The EU’s ROO heavily depends on PANEURO, which establishes a highly
uniform ROO across the EU’s FTAs such as the EU-EFTA FTA and the EU-Mexico 10 The framework of the NAFTA ROO became the basis of ROOs in many FTAs, concluded by Canada, Chile, Mexico, Japan, Korea, and so on. 11 NAFTA has two approaches for calculating the regional contents: One is the transaction value method, and the other is net cost method.

10
FTA. The EU-Mexico FTA adopts a wide range of rules in defining the ROO. In general,
EU ROOs are rather restrictive. The EU ROO is dominated by changes in heading,
although regional value content ratios range from 20% to 50%, with 20% for HS30.
One problem with the EU ROO is that the agreement imposes complicated rules for
producers. For example, special requirements are specified for sugar and cocoa in
defining the ROO for HS 18-22.
● ROOs in East Asian FTAs
FTAs by East Asian countries cover a wide spectrum in terms of the stringency
of ROO. The most simplest ROO can be found in the AFTA, and the ASEAN-China
FTA, which specify 40% regional value contents across all tariff lines, is the simplest
ROO in the world.12 The criterion of 40% regional value contents was first introduced
by AFTA, when the Common External Preferential Tariff (CEPT) scheme was agreed
upon in 1992. During the negotiation for a FTA between China and ASEAN, China
accepted the AFTA ROO and concluded the negotiations at the end of 2004.13
Singapore has been receptive to a loose ROO, while the US has imposed a
stringent ROO, as seen in the NAFTA agreement and in its recent FTAs with other
countries. Singapore adopted the position of the US for the ROO in the bilateral FTA
with the US. The US-Singapore FTA, which was concluded in 2003, basically follows
the framework of the NAFTA ROO, but it is substantially less restrictive than the
NAFTA.
Chapter 3 of the US-Singapore FTA contains the rules of origin, and the
requirements for specific items are given in Annex 3A. Heading changes are required
for HS27-HS48. For some HS chapters such as HS73, 78, 81, 84, 85, and 90, regional
value content ratios are required as 35% in the Build-Up method and 45% in Build-
Down method. De Minimis is set at 10%.
Japan and Korea were predisposed to introduce a complex and stringent ROO 12 Similarly simple ROO can be found in CER (Australia-New Zealand FTA), with a 50% RVC rule. However, it specifies an additional requirement that the last manufacturing process should be performed in the exporting territory for some items. However, the 40% rule is applied in the AFTA without extra requirements. 13 China led the negotiation with ASEAN for a bilateral FTA. In 2003, China provided an Early Harvest Package to ASEAN countries in order to attract ASEAN countries to the negotiation table.
11
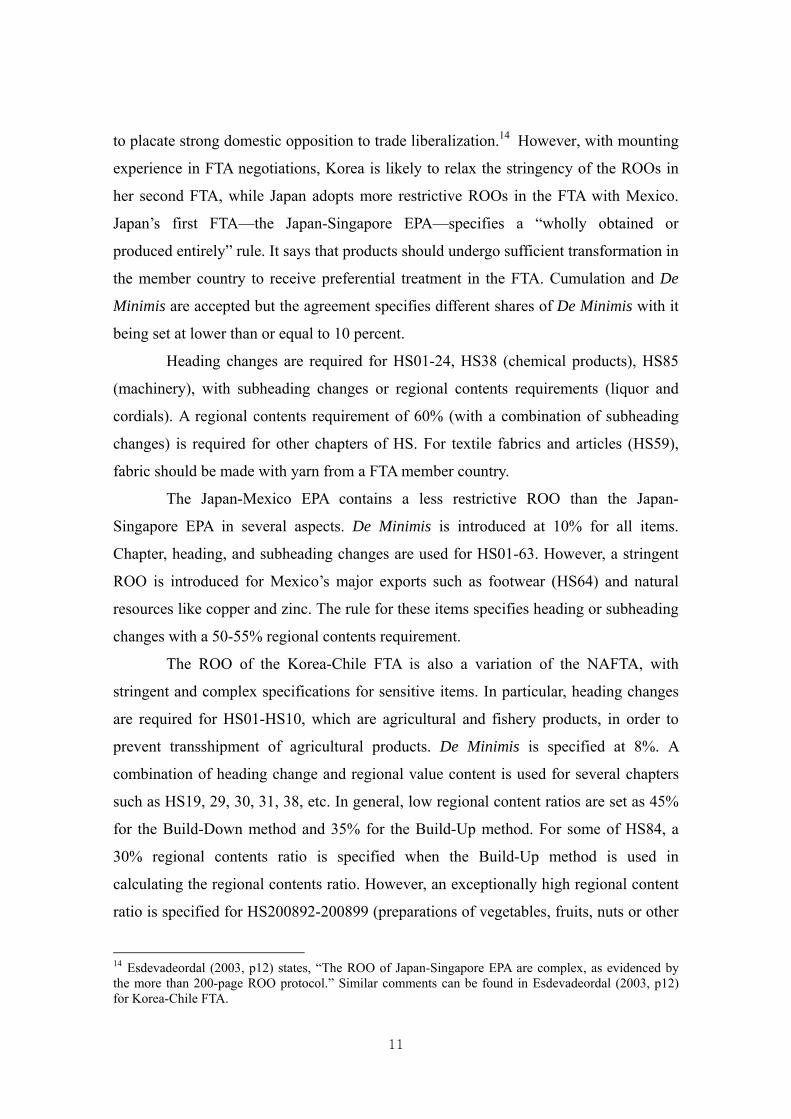
to placate strong domestic opposition to trade liberalization.14 However, with mounting
experience in FTA negotiations, Korea is likely to relax the stringency of the ROOs in
her second FTA, while Japan adopts more restrictive ROOs in the FTA with Mexico.
Japan’s first FTA—the Japan-Singapore EPA—specifies a “wholly obtained or
produced entirely” rule. It says that products should undergo sufficient transformation in
the member country to receive preferential treatment in the FTA. Cumulation and De
Minimis are accepted but the agreement specifies different shares of De Minimis with it
being set at lower than or equal to 10 percent.
Heading changes are required for HS01-24, HS38 (chemical products), HS85
(machinery), with subheading changes or regional contents requirements (liquor and
cordials). A regional contents requirement of 60% (with a combination of subheading
changes) is required for other chapters of HS. For textile fabrics and articles (HS59),
fabric should be made with yarn from a FTA member country.
The Japan-Mexico EPA contains a less restrictive ROO than the Japan-
Singapore EPA in several aspects. De Minimis is introduced at 10% for all items.
Chapter, heading, and subheading changes are used for HS01-63. However, a stringent
ROO is introduced for Mexico’s major exports such as footwear (HS64) and natural
resources like copper and zinc. The rule for these items specifies heading or subheading
changes with a 50-55% regional contents requirement.
The ROO of the Korea-Chile FTA is also a variation of the NAFTA, with
stringent and complex specifications for sensitive items. In particular, heading changes
are required for HS01-HS10, which are agricultural and fishery products, in order to
prevent transshipment of agricultural products. De Minimis is specified at 8%. A
combination of heading change and regional value content is used for several chapters
such as HS19, 29, 30, 31, 38, etc. In general, low regional content ratios are set as 45%
for the Build-Down method and 35% for the Build-Up method. For some of HS84, a
30% regional contents ratio is specified when the Build-Up method is used in
calculating the regional contents ratio. However, an exceptionally high regional content
ratio is specified for HS200892-200899 (preparations of vegetables, fruits, nuts or other
14 Esdevadeordal (2003, p12) states, “The ROO of Japan-Singapore EPA are complex, as evidenced by the more than 200-page ROO protocol.” Similar comments can be found in Esdevadeordal (2003, p12) for Korea-Chile FTA.

12
parts of plants). This is to curb the importation of non-Chilean juices and similar
products.
The Korea-Singapore FTA was concluded within a year of the start of
negotiations in early 2004 and became effective in March 2006. Korea was worried
about the illegal transshipment of goods through Singapore in the FTA and wanted to
have a stringent ROO, while Singapore wanted to introduce Outward-Processing. Korea
also strongly wanted to provide the ROO for products produced in the Gaesung
Industrial Complex.15 Korea could have persuaded Singapore on this issue, while
accepting Outward-Processing, but not as an exchange. Both countries agreed on a 10%
De Minimis rule, with textiles being an exception. This latter point was considered to be
sensitive in the Japan-Singapore EPA. Unlike the FTA with Chile, the Build-Down
method is widely used with ratios of 45%, 50% and 55%.
3. Empirical Assessment of ROOs
Stringent ROO can discourage exporters not to take advantage of tariff preferences provided by FTAs, undercutting the economic gains of FTAs. As different ROOs are introduced by overlapping FTAs, the spaghetti-bowl problem may be present, enforcing dampening trade effects of the ROO.16 The ROO may be the source of under-realization of FTA preferences, but there is not a great deal of literature on measuring the stringency of the ROO. Two pioneering works on this subject are Estevadeordal (2003) and the Productivity Commission (PC, 2004). The PC provides a comprehensive index approach for measuring the stringency and restrictiveness of ROOs and improves Estevadeordal index, which is too simple to use for empirical works. Both approaches are designed to calculate the degree of restrictiveness of ROOs, making numerical comparison of ROOs possible in FTAs. This chapter tries to measure the restrictiveness indices for selected FTAs in terms of the PC approach and Estevadeodal and presents
15 Gaesung Industrial Complex is located in North Korea. The acceptance of the Gaesung products as Korean goods was a critical concern for South Korea, in terms of economic gains as well as a symbolic meaning for improving South Korea-North Korea relations. 16 Because of the experimental operating difficulties of the ROO, there is a limited number of research on the stringent ROO effects on trade. Examples are Cadet, et al (2002), and Krueger (1995). The former shows 64% of NAFTA utilization ratio due to the ROO, and the latter tells that Canadian companies tend to pay tariffs rather than resorting to tariff preferences by complying with the stringent ROO.
13
the results of the study at the end of this chapter.17 More focus is given to the PC index than the Estevadeodal index, since the former can cover the latter.
3.1. Analysis on Index Components
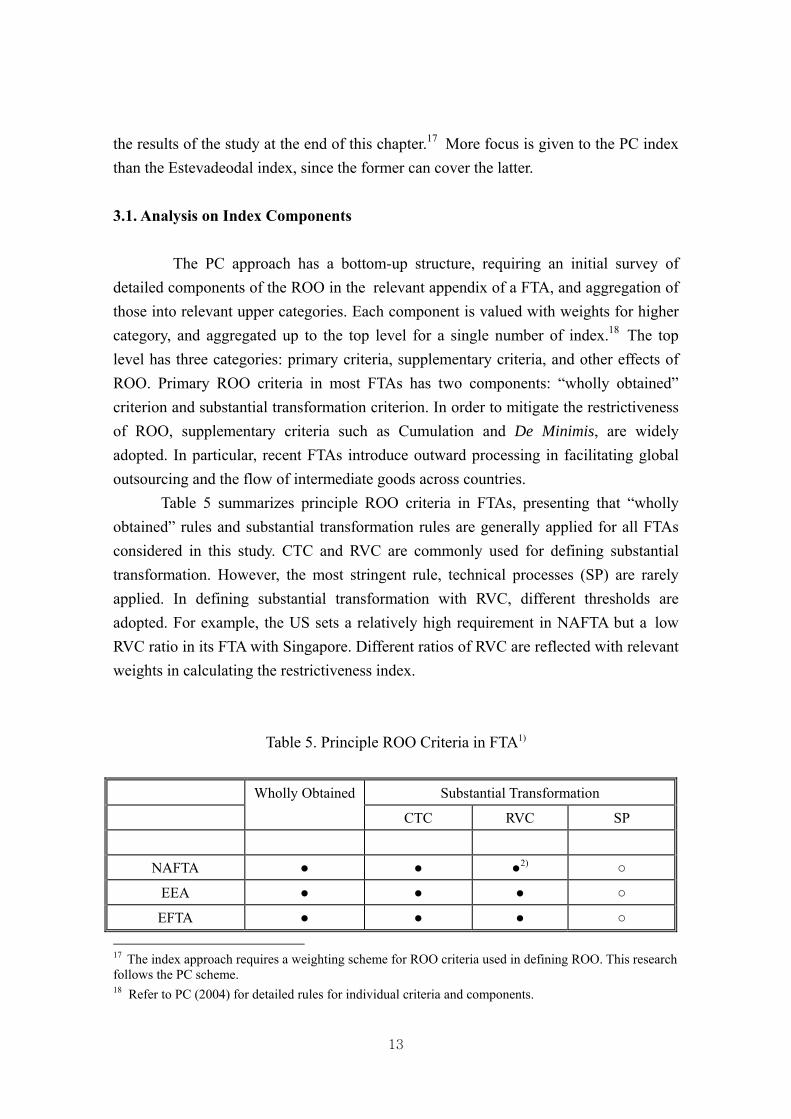
The PC approach has a bottom-up structure, requiring an initial survey of detailed components of the ROO in the relevant appendix of a FTA, and aggregation of those into relevant upper categories. Each component is valued with weights for higher category, and aggregated up to the top level for a single number of index.18 The top level has three categories: primary criteria, supplementary criteria, and other effects of ROO. Primary ROO criteria in most FTAs has two components: “wholly obtained” criterion and substantial transformation criterion. In order to mitigate the restrictiveness of ROO, supplementary criteria such as Cumulation and De Minimis, are widely adopted. In particular, recent FTAs introduce outward processing in facilitating global outsourcing and the flow of intermediate goods across countries.
Table 5 summarizes principle ROO criteria in FTAs, presenting that “wholly obtained” rules and substantial transformation rules are generally applied for all FTAs considered in this study. CTC and RVC are commonly used for defining substantial transformation. However, the most stringent rule, technical processes (SP) are rarely applied. In defining substantial transformation with RVC, different thresholds are adopted. For example, the US sets a relatively high requirement in NAFTA but a low RVC ratio in its FTA with Singapore. Different ratios of RVC are reflected with relevant weights in calculating the restrictiveness index.
Table 5. Principle ROO Criteria in FTA1)
Substantial Transformation
Wholly Obtained
CTC RVC SP
NAFTA ● ● ●2) ○
EEA ● ● ● ○
EFTA ● ● ● ○
17 The index approach requires a weighting scheme for ROO criteria used in defining ROO. This research follows the PC scheme. 18 Refer to PC (2004) for detailed rules for individual criteria and components.

14
EU-Mexico ● ● ● ○
EFTA-SGP ● ● ● ○
US-SGP ● ● ●3) ○
AFTA ● ● ○
ASEAN-China ● ● ●4)
Japan-SGP ● ● ● ○
Japan-Mexico ● ● ● ○
Korea-Chile ● ● ●5) ○
Korea-SGP ● ● ● ○
Note 1) ●: Generally applied, ○: Applied in small number of items 2) The RVC should be not less than 60% (transaction value method) or 50% (net cost method). 62.5% under the net cost method is set for automobiles (HS 8702.xx, 8703.21-90, 8704.21, 8704.31) 3) 35% in the Build-Up method and 45% in the Build-Down method
4) Not less than 60% (FOB price of a final good) of originating materials (CIF) from non-ACFTA 5) 30% in the Build-Up method and 45% in the Build-Down method. 80% for canned juice mix as an exception
CTC criterion will depend on the HS classification of ROO for transformation from
intermediate goods to final products. If Chapter change is required, then it will be most restrictive. This index rule is deliberately approached by Estevadeodal (2000), as shown in Table 6. His index is designed to evaluate RVC and SP, in the framework of CTC requirements.
Table 6. Restrictiveness Index of ROO defined by Estevadeordal
Index Description 1 Changes in HS8-10 digit (CI) 2 More restrictive than index 1 and changes in HS6 digit (CTSH) 3 More restrictive than index 2. Changes in HS6 digit (CTSH) and RVC 4 More restrictive than index 3 and changes in HS4 digit (CTH) 5 More restrictive than index 4. Changes in HS4 digit (CTH) and RVC 6 More restrictive than index 5 and changes in HS2 digit (CC)
7 More restrictive than index 5 and changes in HS2 digit (CC) and SP requirement
Source: Summarized from Estevadeodal (2003)

15
Several components of RVC are incorporated into measuring the index, in
addition to the RVC threshold. Important elements are how to calculate the RVC, reference prices and methodology across tariff lines. As seen in Table 7, FTAs have wide range of specifications for RVC in terms of threshold, methodology, and reference price. European FTAs heavily use Ratio of Non-Originating Materials in calculating the RVC, while East Asian countries tend to adopt Built-Down methods or Built-Up methods. For reference prices, European countries prefer Ex-Works (factory) prices, but FOB prices are widely used by the US and East Asian countries. Table 8 shows most commonly adopted specifications for FTAs, and each FTA defines different rules across tariff lines.
Table 7. Method for Calculation of RVC
Value Added Method of
Calculation VNM1) VOM2) Method3) Reference
Price
Remarks
NAFTA 40%, 50% 60%. 50% TM, NC FOB Auto (62.5%)
EEA 40% (60%) RNM Ex-works EFTA 40% (60%) RNM Ex-works
EU-Mexico 20~50% RNM Ex-works Combined with CTC
EFTA-SGP 20~60% 40~80% RNM Ex-works US-SGP 40~70% 30~60% BD, BU FOB AFTA 60% 40% ROM FOB
ASEAN-China
60% 40% ROM FOB
Japan-SGP 40% 60% BD, BU FOB Japan-Mexico 50% 50% TM 65%4) Korea-Chile 55%, 70% 45%, 30% BD, BU FOB Juice mix (80%) Korea-SGP 45~55% 45~55% BD FOB
Note: 1) Share of value added should be less than ones specified 2) Share of value added should be more than ones specified 3) TM: Transaction Value Method, NC: Net Cost Method, RNM: Ratio of Non-
Originating Materials, ROM: Ratio of Originating Materials, BD: Build-Down Method, BU: Build-Up Method
4) 65% of originating materials is required as an exception. 8544 (ex), 8703 (ex), 8704-8707, 8708 (ex), 8716 (ex).
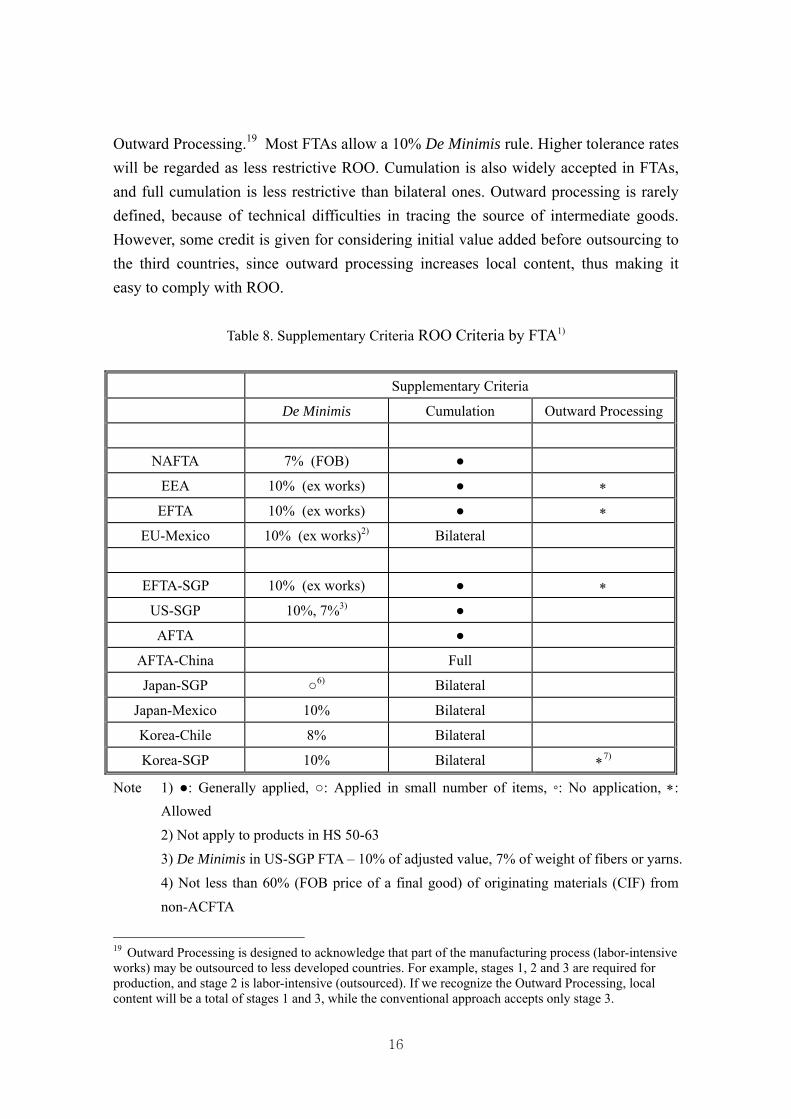
Major components of supplementary criteria are De Minimis, Cumulation, and
16
Outward Processing.19 Most FTAs allow a 10% De Minimis rule. Higher tolerance rates will be regarded as less restrictive ROO. Cumulation is also widely accepted in FTAs, and full cumulation is less restrictive than bilateral ones. Outward processing is rarely defined, because of technical difficulties in tracing the source of intermediate goods. However, some credit is given for considering initial value added before outsourcing to the third countries, since outward processing increases local content, thus making it easy to comply with ROO.
Table 8. Supplementary Criteria ROO Criteria by FTA1)
Supplementary Criteria
De Minimis Cumulation Outward Processing
NAFTA 7% (FOB) ●
EEA 10% (ex works) ● ∗
EFTA 10% (ex works) ● ∗
EU-Mexico 10% (ex works)2) Bilateral
EFTA-SGP 10% (ex works) ● ∗
US-SGP 10%, 7%3) ●
AFTA ●
AFTA-China Full
Japan-SGP ○6) Bilateral
Japan-Mexico 10% Bilateral
Korea-Chile 8% Bilateral
Korea-SGP 10% Bilateral ∗7)
Note 1) ●: Generally applied, ○: Applied in small number of items, ◦: No application, ∗: Allowed
2) Not apply to products in HS 50-63 3) De Minimis in US-SGP FTA – 10% of adjusted value, 7% of weight of fibers or yarns.
4) Not less than 60% (FOB price of a final good) of originating materials (CIF) from non-ACFTA
19 Outward Processing is designed to acknowledge that part of the manufacturing process (labor-intensive works) may be outsourced to less developed countries. For example, stages 1, 2 and 3 are required for production, and stage 2 is labor-intensive (outsourced). If we recognize the Outward Processing, local content will be a total of stages 1 and 3, while the conventional approach accepts only stage 3.
17
6) Noted in Appendix IIA (not in Text). 7) The total value of non-originating inputs should not exceed 40% of customs value,
and the value of originating materials is not less than 45% of the customs value. 3.2. Assessment of Restrictiveness of ROO
Based on the discussions in the previous section, this section provides empirical
results of restrictiveness of ROO by Estevadeordal and Suominen (2004) and the Productivity Commission (2004) in Section 3.2.1. Although these studies are comprehensive in analyzing ROO, they analyze FTAs by European and American countries. Four FTAs by Japan and Korea are under implementation, and these FTAs are not included in existing studies. Section 3.2.2 summarizes the study results for assessing restrictiveness of ROO in these FTAs by Japan and Korea. Rather than devising a restrictiveness index, this paper follows the approaches by existing studies.
3.2.1. Existing Studies
This section reports on existing studies on the restrictiveness index of ROO in FTAs, based on the research by Estevadeordal and Suominen (2004) and the Productivity Commission (2004). Both studies analyze the restrictiveness of ROO with different sets of FTAs, most of them being FTAs by Europe and Americas.
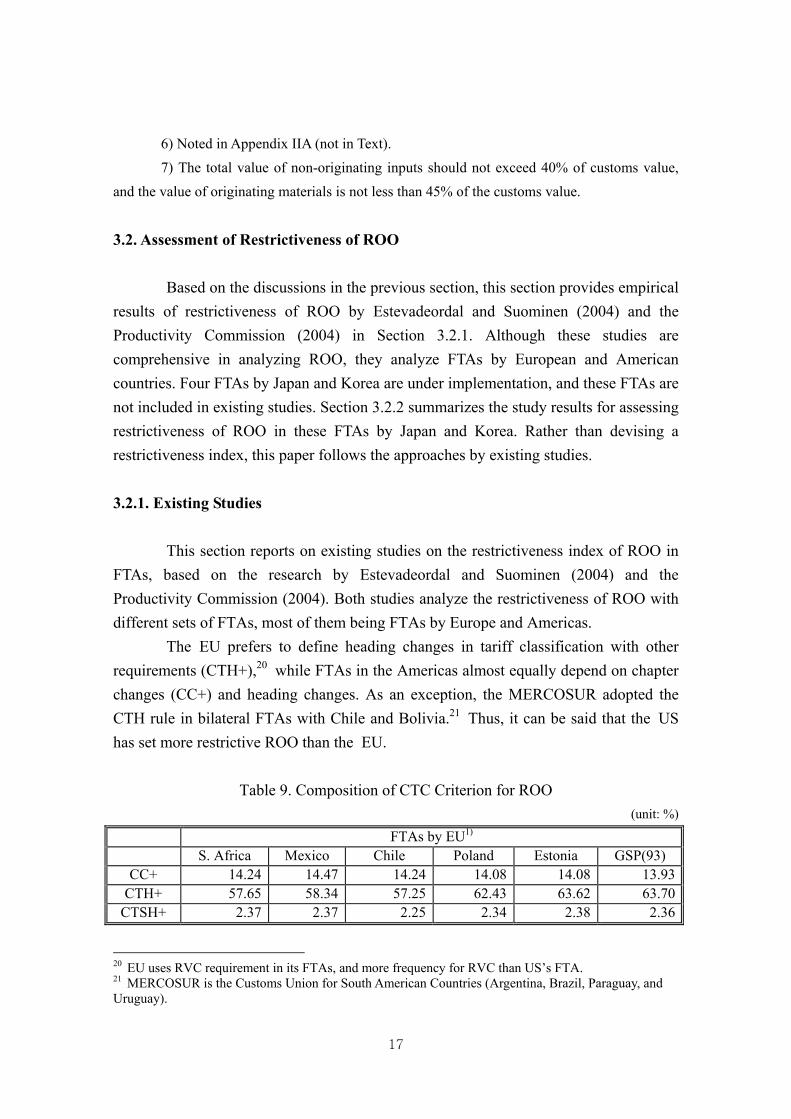
The EU prefers to define heading changes in tariff classification with other requirements (CTH+),20 while FTAs in the Americas almost equally depend on chapter changes (CC+) and heading changes. As an exception, the MERCOSUR adopted the CTH rule in bilateral FTAs with Chile and Bolivia.21 Thus, it can be said that the US has set more restrictive ROO than the EU.
Table 9. Composition of CTC Criterion for ROO
(unit: %)
FTAs by EU1) S. Africa Mexico Chile Poland Estonia GSP(93)
CC+ 14.24 14.47 14.24 14.08 14.08 13.93CTH+ 57.65 58.34 57.25 62.43 63.62 63.70
CTSH+ 2.37 2.37 2.25 2.34 2.38 2.36
20 EU uses RVC requirement in its FTAs, and more frequency for RVC than US’s FTA. 21 MERCOSUR is the Customs Union for South American Countries (Argentina, Brazil, Paraguay, and Uruguay).
18
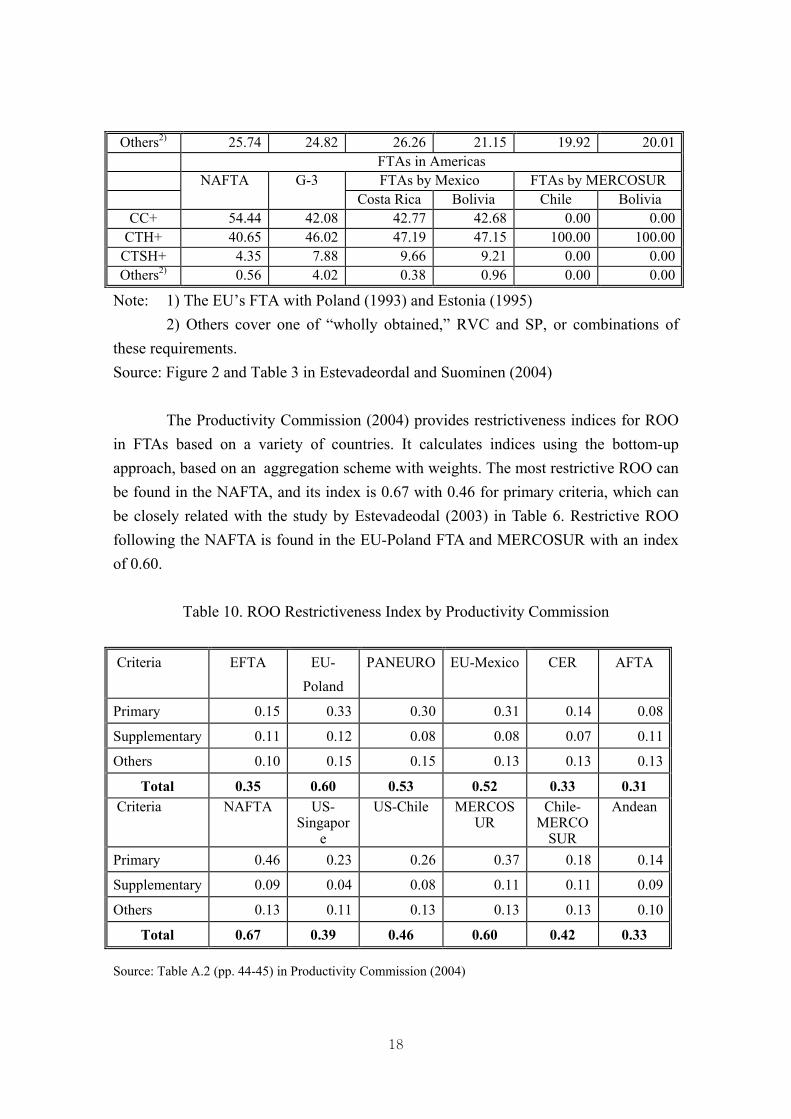
Others2) 25.74 24.82 26.26 21.15 19.92 20.01 FTAs in Americas FTAs by Mexico FTAs by MERCOSUR
NAFTA G-3 Costa Rica Bolivia Chile Bolivia
CC+ 54.44 42.08 42.77 42.68 0.00 0.00CTH+ 40.65 46.02 47.19 47.15 100.00 100.00
CTSH+ 4.35 7.88 9.66 9.21 0.00 0.00Others2) 0.56 4.02 0.38 0.96 0.00 0.00
Note: 1) The EU’s FTA with Poland (1993) and Estonia (1995) 2) Others cover one of “wholly obtained,” RVC and SP, or combinations of these requirements. Source: Figure 2 and Table 3 in Estevadeordal and Suominen (2004)
The Productivity Commission (2004) provides restrictiveness indices for ROO
in FTAs based on a variety of countries. It calculates indices using the bottom-up approach, based on an aggregation scheme with weights. The most restrictive ROO can be found in the NAFTA, and its index is 0.67 with 0.46 for primary criteria, which can be closely related with the study by Estevadeodal (2003) in Table 6. Restrictive ROO following the NAFTA is found in the EU-Poland FTA and MERCOSUR with an index of 0.60.
Table 10. ROO Restrictiveness Index by Productivity Commission
Criteria EFTA EU-Poland
PANEURO EU-Mexico CER AFTA
Primary 0.15 0.33 0.30 0.31 0.14 0.08
Supplementary 0.11 0.12 0.08 0.08 0.07 0.11
Others 0.10 0.15 0.15 0.13 0.13 0.13
Total 0.35 0.60 0.53 0.52 0.33 0.31 Criteria NAFTA US-
Singapore
US-Chile MERCOSUR
Chile-MERCO
SUR
Andean
Primary 0.46 0.23 0.26 0.37 0.18 0.14
Supplementary 0.09 0.04 0.08 0.11 0.11 0.09
Others 0.13 0.11 0.13 0.13 0.13 0.10
Total 0.67 0.39 0.46 0.60 0.42 0.33
Source: Table A.2 (pp. 44-45) in Productivity Commission (2004)

19
However, the US has adopted a less restrictive ROO in recent FTAs such as the
US-Singapore FTA and the US-Chile FTA. Similar trends can be found for the EU and MERCOSUR. Some countries tend to adopt loose type of ROOs. For example, Australia-New Zealand, AFTA and Andean Community chose to set relatively simple and loose ROOs.
3.2.2. Restrictiveness of ROO in FTAs by Japan and Korea Before presenting the restrictiveness index of FTAs by Japan and Korea, the
structures of ROO in Table 11 for Japan’s bilateral FTAs with Singapore and Mexico, and Table 12 for Korea’s FTA with Chile and Singapore are provided for readers’ brief overview. Restrictiveness indices are taken from Estevadeodal (2003), and the numbers of tariff lines for each ROO category are given in terms of a HS6 or HS8 digit. It is not easy to classify the specification of ROO for some tariff lines, and regard it as closest category.
Japan defined ROO in its FTA with Singapore as a HS6 digit, while using a HS8 digit with its FTA with Mexico. However, we found that the number of tariff lines with ROO in the EPA with Singapore is less than half of those with Mexico, although the former was based on a HS6 digit (the smaller number of tariff lines in a HS6 digit than a HS8 digit).22
Table 11. Summary of ROO in Japan-Singapore FTA and Japan-Mexico FTA
(unit: number of items in HS6) Japan-Singapore EPA Japan-Mexico EPA
Category Index HS6 Category Index HS8 CC + RVC 7 24 CC+SP 7 294
SP 6 120 SP 6 12
CC 6 49 CC 6 1,958
CTH + RVC + SP 6 14 CC or CC+RVC 6 3
CTH + SP 6 21 CC or CTH+RVC 6 108
CTH + RVC 5 182 CC or CTSH+RVC 6 83
22 In addition to this, Japan had narrow market access, especially for agriculture, and did not mention tariff lines for exclusion from tariff elimination. Thus, the number of tariff lines with ROO in the agreement became smaller.

20
CTH 4 1,684 CC or RVC 6 2
CTH+SP 6 3
CTH+RVC; CC; or CTSH+RVC
5 1
CTH+RVC; CC; or CTH 5 1
CTH+RVC 5 189
CTH 4 1,128
CTH or CC+RVC 4 1
CTH or CTH+RVC 4 131
CTH or CTH ; CTSH+RVC 4 8
CTSH or CTH or RVC 4 2
CTH or CTSH+RVC 4 661
CTH or RVC 4 59
CTSH+RVC 3 17
CTSH; CC or CTSH+RVC 3 1
CTSH or CTH or CTSH+RVC
3 4
CTSH or CTH+RVC 3 30
CTSH or CTSH+RVC 3 37
CTSH or CTH+RVC or CTSH+RVC
3 1
CTSH 2 472
RVC 1 13Total 2,094 Total 5,219
Source: Calculated based on the agreement of Japan-Singapore EPA and Japan-Mexico EPA
There are substantial differences between Japan’s first EPA and second EPA. In
Japan’s first EPA with Singapore, Japan introduced a smaller number of categories for ROO than in the EPA with Mexico. The majority of tariff lines has a CTH requirement for ROO in the EPA with Singapore, while the EPA with Mexico has a CC criterion. This implies that ROO in the EPA with Mexico is more restrictive than in the EPA with Singapore. Japan also heavily adopts the combined criteria of CTC and RVC in the EPA with Mexico, which enforce the restrictiveness of ROO.
On the contrary, Korea’s ROO shares similar pattern in its first two bilateral

21
FTAs with Chile and Singapore. First, the number of categories is similar in the two FTAs, although Korea reduced the number of categories in the later FTA with Singapore. Second, the most frequent ROO in both FTAs is a CTH criterion. Third, a HS6 digit is the tariff lines for defining ROO in both FTAs.
One of the differences is that the number of restrictive ROO (tariff lines with Index 6 or 7) is smaller in the Korea-Singapore FTA than the Korea-Chile FTA. This means that the former FTA is less restrictive than the latter.
Table 12. Summary of ROO in Korea-Chile FTA and Korea-Singapore FTA
(unit: number of items in HS6)
Korea-Chile FTA Korea-Singapore FTA Category Index HS6 Category Index HS6
CC + SP 7 178 CC + SP 7 292 CC + RVC 7 80 CC + RVC 7 144 CC 6 1,287 CC 6 874 CC or (CC+RVC) 6 1 CC or (CTH+RVC) 6 5 CC or (CTH+RVC) 6 27 CTH + RVC 5 278 CC or (CTSH+RVC) 6 31 CTH 4 2,968 CTH + RVC 5 322 CTH or RVC 4 1 CTH 4 1,739 CTH or (CTH+RVC) 4 85 CTH or (CTH+RVC) 4 66 CTH or (CTSH+RVC) 4 397 CTH or (CTSH+RVC) 4 471 CTSH + RVC 3 19 CTH or RVC 4 739 CTSH 2 117 CTSH + RVC 4 131 CTSH or RVC 2 1 CTSH 3 105 RVC 1 31 CTSH or RVC 3 5 RVC 1 30
Total 5,212 5,212 Note: CC - Changes in HS2 digit, CTH - HS4 digit, CTSH - HS6 digit, RVC - Regional Value
Contents, SP - Specific Production Requirement Based on Table 11 and 12, Table 13 was prepared to compare the composition
of CTC criteria in the FTAs by Japan and Korea with those of NAFTA and the EU-Mexico FTA. It is evaluated that the Japan-Singapore EPA has the highest share of CTH criterion, while the Japan-Mexico EPA is analyzed to have the lowest share of CTH among the six FTAs discussed in this study. The Japan-Mexico EPA increased the share of CTSH criterion, reducing the share of CTH substantially.
Table 13 shows that Korea has a similar structure of ROO, as shown in the previous analysis. Korea’s ROO tends to be developed towards CTH criterion, by reducing shares of ROOs for CC and CTSH. It implies that Korea is moving towards a

22
less restrictive ROO, while making some items more restrictive by changing ROO criteria from CTSH to CTH.
Table 13. Composition of CTC in FTAs by Japan and Korea (unit: %)
Japan’s EPA with Korea’s FTA
With
NAFTA EU-
Mexico FTA Singapore Mexico Chile Singapore
CC+ 54.44 14.47 9.22 47.14 30.21 25.18CTH+ 40.65 58.34 90.78 29.14 59.76 67.79
CTSH+ 4.35 2.37 0.00 23.47 9.46 6.44Other 0.56 24.82 0.00 0.25 0.58 0.59
Total 100 100 100 100 100 100 Source: Information on NAFTA and EU-Mexico FTA is recited from Table 9(originally from Estevadeordal-Suominen, 2004)
Restrictiveness of ROO can be calculated with relevant information for primary criterion, supplementary criterion, and other criterion, as described in the Productivity Commission (2004), in addition to above Table 11-13. In general, it can be said that Japan’s ROO is more restrictive than Korea’s, and East Asian ROO is less restrictive than NAFTA or the EU’s ROO system (PANEURO). Table 14 shows that Japan increased the restrictiveness of ROO in its second FTA, and its ROO with Singapore is more restrictive than Korea’s ROO with Singapore. Korea’s ROO in its second FTA is less restrictive than its first FTA with Chile. Korea borrowed the framework of ROO system for its first FTA from NAFTA, and its ROO is less restrictive than NAFTA. Finally, the US adopted a rather less restrictive ROO in a recent FTA with Singapore, which went into force in January 2004. Four East Asian FTAs have more restrictive ROO than the US-Singapore FTA.
Table 14. ROO Restrictiveness of FTAs by Japan and Korea
(unit: %)
Criteria PANEURO
NAFTA
US-SGP FTA
Japan-SGP FTA
Japan-Mexico
FTA
Korea-Chile FTA
Korea-SGP FTA
23
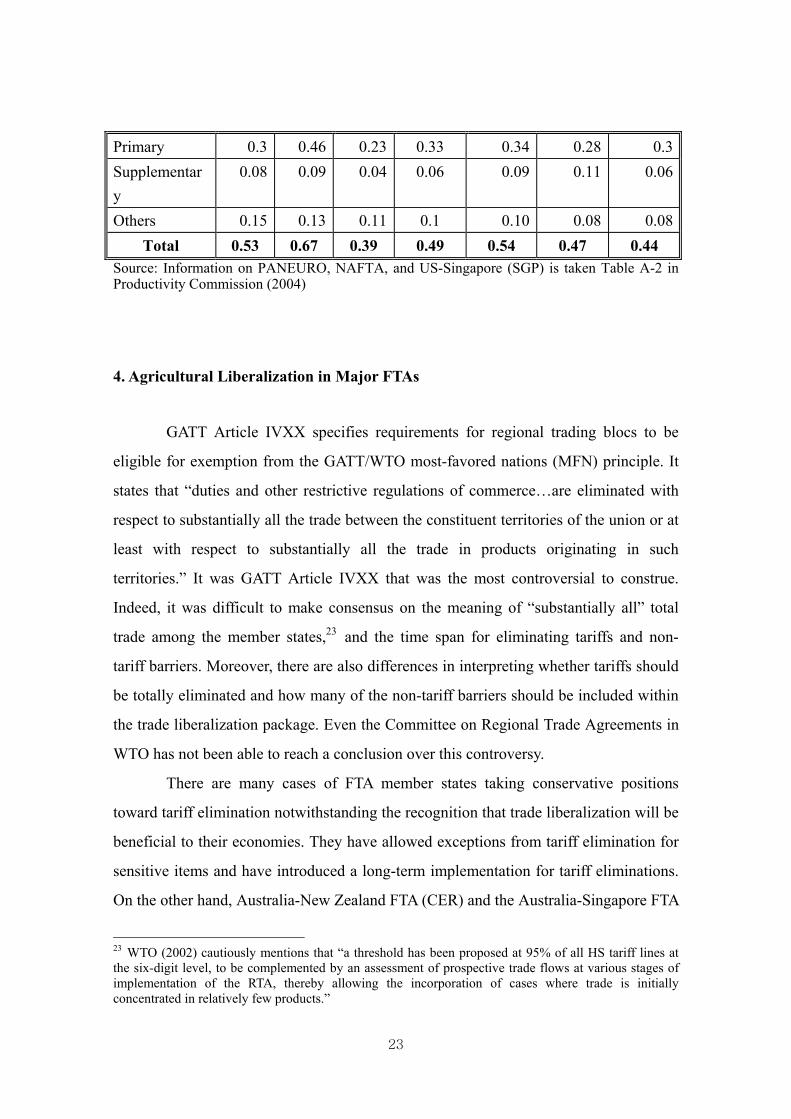
Primary 0.3 0.46 0.23 0.33 0.34 0.28 0.3Supplementary
0.08 0.09 0.04 0.06 0.09 0.11 0.06
Others 0.15 0.13 0.11 0.1 0.10 0.08 0.08Total 0.53 0.67 0.39 0.49 0.54 0.47 0.44
Source: Information on PANEURO, NAFTA, and US-Singapore (SGP) is taken Table A-2 in Productivity Commission (2004) 4. Agricultural Liberalization in Major FTAs
GATT Article IVXX specifies requirements for regional trading blocs to be
eligible for exemption from the GATT/WTO most-favored nations (MFN) principle. It
states that “duties and other restrictive regulations of commerce…are eliminated with
respect to substantially all the trade between the constituent territories of the union or at
least with respect to substantially all the trade in products originating in such
territories.” It was GATT Article IVXX that was the most controversial to construe.
Indeed, it was difficult to make consensus on the meaning of “substantially all” total
trade among the member states,23 and the time span for eliminating tariffs and non-
tariff barriers. Moreover, there are also differences in interpreting whether tariffs should
be totally eliminated and how many of the non-tariff barriers should be included within
the trade liberalization package. Even the Committee on Regional Trade Agreements in
WTO has not been able to reach a conclusion over this controversy.
There are many cases of FTA member states taking conservative positions
toward tariff elimination notwithstanding the recognition that trade liberalization will be
beneficial to their economies. They have allowed exceptions from tariff elimination for
sensitive items and have introduced a long-term implementation for tariff eliminations.
On the other hand, Australia-New Zealand FTA (CER) and the Australia-Singapore FTA
23 WTO (2002) cautiously mentions that “a threshold has been proposed at 95% of all HS tariff lines at the six-digit level, to be complemented by an assessment of prospective trade flows at various stages of implementation of the RTA, thereby allowing the incorporation of cases where trade is initially concentrated in relatively few products.”
24
stipulated complete tariff elimination. Both agreements indicate that each party shall
eliminate all customs duties on goods originating in the territories of the other party that
meet the requirements for the rules of origin specified in respective agreements.
However, most of the agreements allow exceptions. This chapter analyzes the content of
trade liberalization focusing on agricultural tariffs, since manufacturing sectors are
liberalized within 10 years of the implementation in most cases.
Tariff elimination schemes of agricultural tariff lines were analyzed for two
groups of FTAs by Western countries and East Asian countries. NAFTA, US-Australia
FTA, US-Chile FTA, and EU-Mexico FTA are selected for samples of western
countries’ FTAs, while East Asian FTAs for analysis are Japan-Singapore Economic
Partnership Agreement (EPA), Japan-Mexico EPA, Korea-Singapore FTA, and Korea-
Chile FTA.
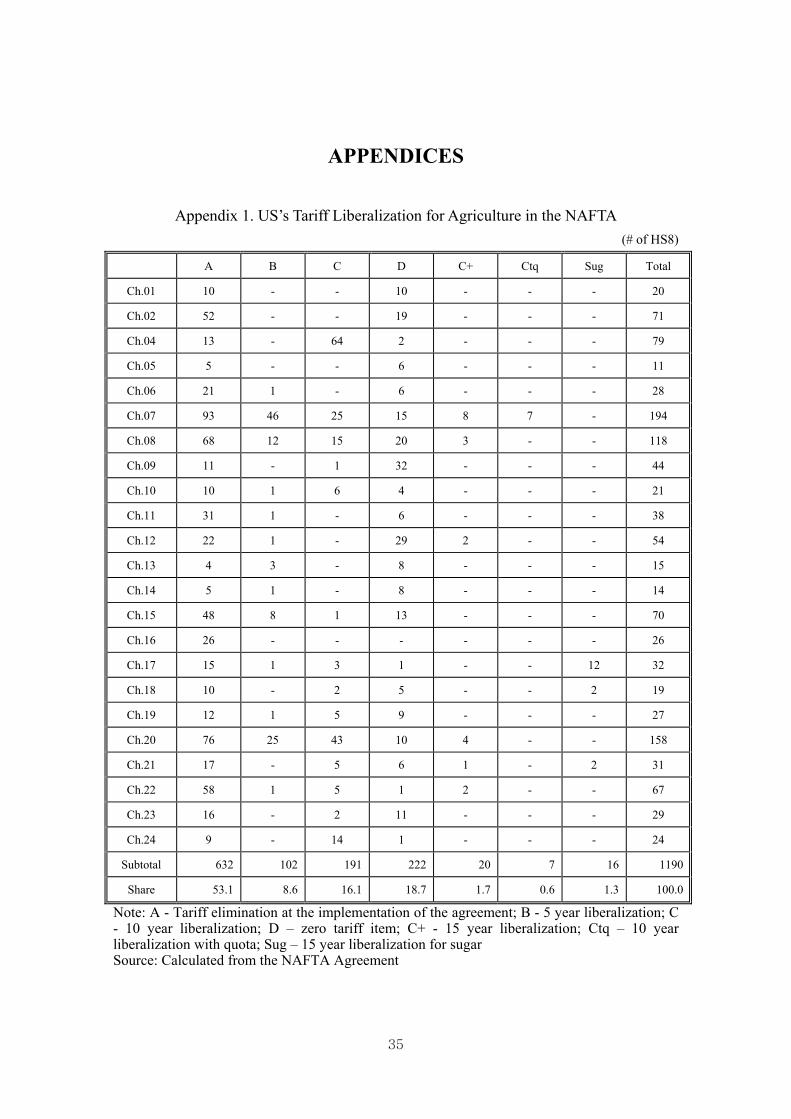
Tariff elimination can be analyzed with diverse approaches depending on the
purpose of research. This study counts tariff lines according to the categories of tariff
elimination provided in appendices of FTAs considered.24 Tariff lines in the HS chapter
01-24 except HS3 (fisheries) are regarded as agricultural products.25 For reference,
detailed survey results are provided in the Appendices 1-11. It is not easy to make
groups for comparison since each agreement introduces different liberalization
categories, including quota without tariff change, partial liberalization, and future
reviews. This chapter reports the summary of the survey of agricultural liberalization by
calculating the numbers of tariff lines for three groups; the first group is items which are
scheduled to be liberalized within 10 years after the implementation of a FTA, the
second one includes items of liberalization after 10 years and the third group is for
excluded items from trade liberalization.
4.1. FTAs by Western Countries
24 For more accurate analysis, trade volumes need to be considered in addition to tariff lines. However, this requires substantially more work efforts, and this can be done in a follow-up study. 25 Some items in HS29, 33, 35, 38, 41, 43, 50, 51-53 can be regarded as agriculture, but these items are not taken into account in this study.
25
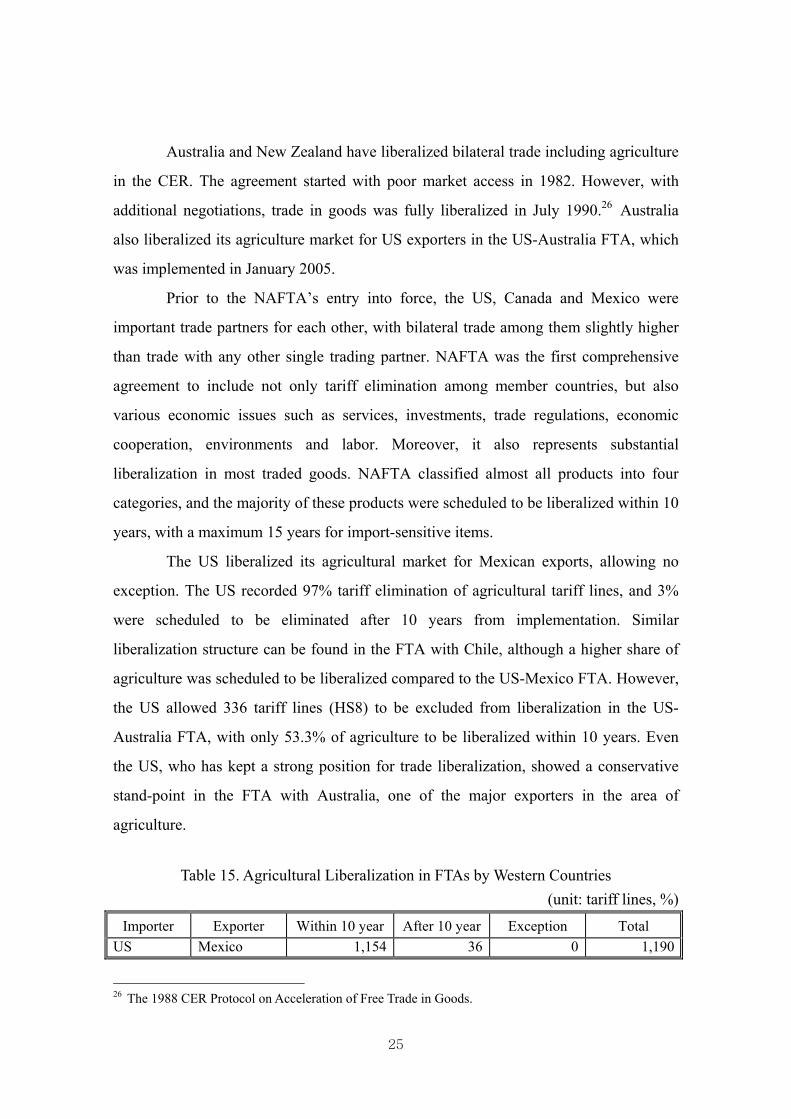
Australia and New Zealand have liberalized bilateral trade including agriculture
in the CER. The agreement started with poor market access in 1982. However, with
additional negotiations, trade in goods was fully liberalized in July 1990.26 Australia
also liberalized its agriculture market for US exporters in the US-Australia FTA, which
was implemented in January 2005.
Prior to the NAFTA’s entry into force, the US, Canada and Mexico were
important trade partners for each other, with bilateral trade among them slightly higher
than trade with any other single trading partner. NAFTA was the first comprehensive
agreement to include not only tariff elimination among member countries, but also
various economic issues such as services, investments, trade regulations, economic
cooperation, environments and labor. Moreover, it also represents substantial
liberalization in most traded goods. NAFTA classified almost all products into four
categories, and the majority of these products were scheduled to be liberalized within 10
years, with a maximum 15 years for import-sensitive items.
The US liberalized its agricultural market for Mexican exports, allowing no
exception. The US recorded 97% tariff elimination of agricultural tariff lines, and 3%
were scheduled to be eliminated after 10 years from implementation. Similar
liberalization structure can be found in the FTA with Chile, although a higher share of
agriculture was scheduled to be liberalized compared to the US-Mexico FTA. However,
the US allowed 336 tariff lines (HS8) to be excluded from liberalization in the US-
Australia FTA, with only 53.3% of agriculture to be liberalized within 10 years. Even
the US, who has kept a strong position for trade liberalization, showed a conservative
stand-point in the FTA with Australia, one of the major exporters in the area of
agriculture.
Table 15. Agricultural Liberalization in FTAs by Western Countries
(unit: tariff lines, %)
Importer Exporter Within 10 year After 10 year Exception Total US Mexico 1,154 36 0 1,190
26 The 1988 CER Protocol on Acceleration of Free Trade in Goods.

26
(97.0) (3.0) (0.0) (100)US Chile 1,364
(85.2)235
(14.8)0
(0.0) 1,599(100)
US Australia 876(53.3)
434(26.3)
336 (20.4)
1,646(100)
Australia US Immediate elimination of all tariff lines for agriculture Chile US 574
(81.2)133
(18.8)0
(0.0) 707
(100)EU Mexico 1,204
(59.3)0
(0.0)833
(40.7) 2,047(100)
Mexico US 832(90.6)
17(1.8)
70 (7.6)
919(100)
Mexico EU 669(67.9)
0(0.0)
316 (32.1)
985(100)
Average 79 8 13 100
Note: Numbers in the parenthesis are shares out of total number of tariff lines for agriculture Source: Summarized from appendices provided in Appendices 1-7
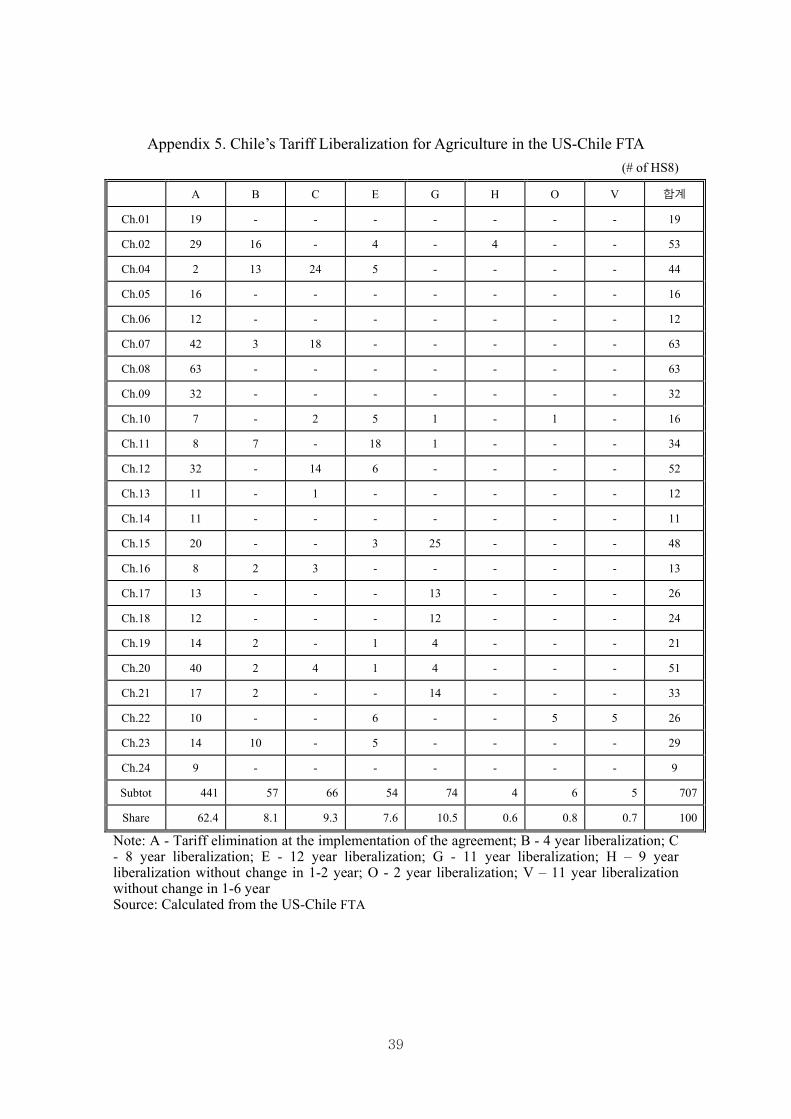
Chile is one of countries which has actively promoted FTAs, and achieved high
economic growth and the improvement of the business environment. The country did
not allow exceptions for agriculture, and 574 tariff lines (HS8, 81.2%) were liberalized
within 10 years. Out of 574 items, 441 items (62.4%) were immediate liberalization
products at the implementation of the FTA with the US.
The EU and Mexico started to negotiate a free trade agreement in late 1998 and
concluded these negotiations in late 1999. The agreement came into effect on July 1,
2000. The EU had tried to enlarge and deepen its economic integration within Europe
before the agreement, and the EU-Mexico FTA offered the opportunity for the EU to
expand its regionalism to non-European regions. The EU has protected its agriculture in
the multilateral trading system and regional trade agreements. In its FTA with Mexico,
the EU liberalized only 59% of agriculture within 10 years, and allowed 41% to be
excluded from tariff elimination. In responding to the EU’s tariff concession, Mexico
eliminated 68% of agricultural tariff lines, with exception share of 32%. However, the
country recorded 90.6% of tariff lines in the NAFTA. It can be inferred that the market
access for a country depends on the counter party in a FTA.
On average, 79% of agricultural tariff lines were liberalized within 10 years in

27
the Western FTAs analyzed in this study, while it is calculated that countries allowed
13% of agriculture to be excluded from liberalization package.
4.2. FTAs by Japan and Korea
There are several FTAs in East Asia including ASEAN Free Trade Area
(AFTA), AFTA-China FTA, Japan-Singapore EPA, Korea-Chile FTA, etc. ASEAN
countries felt the need for a more instrumental economic cooperation program in early
1990s, and a Common Effective Preferential Tariff (CEPT) was proposed at the 22nd
ASEAN Economic Minister’s Meeting (AEM) in October 1990. It is not easy to
compare the liberalization scheme of AFTA, since the targeted tariff rates were 0-5%
rather than zero tariffs for items in the liberalization list. Similar schemes were
introduced for AFTA’s FTAs with China and Korea.
With this problem, those FTAs were not taken for analysis. Instead, four FTAs
by Japan and Korea were reviewed for assessing agricultural liberalization, representing
FTAs by East Asian countries. More FTAs, such as the US-Singapore FTA, can be
added for the study, but this is left for future works.
Japan concluded its first FTA with Singapore in January 2002. The agreement
was officially entitled the Agreement between Japan and the Republic of Singapore for
a New-Age Economic Partnership (JSEPA), since it is expected to promote economic
partnership and linkages of the two countries in a comprehensive manner. However,
Japan showed a passive position in liberalizing agricultural market, recording the lowest
rate of tariff elimination within 10 years in the FTAs reviewed in this study. The
country introduced only one liberalization category for agriculture, which is immediate
liberalization. 27 The agreement stipulates only agricultural items for immediate
liberalization, while other items are not shown in the agreement.
Japan improved market access for agriculture in the FTA with Mexico, which
was signed in September 2004, and went into force in April 2005. Mexico strongly 27 MFN Tariff rates for items in the immediate liberalization category were zero. This means Japan’s agriculture has not been affected at all by the Japan-Singapore EPA.

28
requested Japan to expand market access for the Japanese agricultural market during
negotiation. Japan provided tariff-rate quotas for some of agricultural products such as
pork and oranges, while minimizing tariff elimination for agriculture. Japan agreed with
Mexico in eliminating 51.9% of its agricultural tariffs within 10 years, and 7.7% within
11 years. Forty items (HS8) were categorized as preferential tariff treatment, under
which parts of tariffs were supposed to be cut.28
Table 16. Agricultural Liberalization in FTAs by Japan and Korea
(unit: tariff lines, %)
Importer Exporter Within 10 years
After 10 years
Exception Total Remarks
Japan Singapore 250(39.4)
0(0.0)
385(60.6)
635 (100)
HS6
Japan Mexico 508(51.9)
75(7.7)
396(40.5)
979 (100)
HS8
Korea Singapore 933(65.0)
0(0.0)
481(34.0)
1,414 (100)
HS10
Korea Chile 1,011(71.5)
12(0.9)
391(27.7)
1,414 (100)
HS10
Average 57.1 2.2 40.7
Note: numbers in the parenthesis are shares out of total number of tariff lines for agriculture
Korea introduced four categories for agricultural trade liberalization in the FTA
with Singapore: Immediate elimination, five-year elimination, 10-year elimination and
exception. In its first FTA, Korea eliminated 65% of agricultural tariff lines and 34%
were grouped for exception from trade liberalization. Korea was more progressive than
Japan in bilateral FTAs with Singapore, in that the former recorded higher liberalization
rate than the latter.
Korea spent three years in concluding its first FTA with Chile, and additional
1.5 years for approval from the National Assembly. The government of Korea
liberalized 71.5% of agricultural products in the FTA within 10 years from the
28 These items mostly apply for HS Chapter 2 (meats).

29
implementation (April 2004). Most of them were supposed to eliminate tariffs in the
fifth year when the agreement became effective.
FTAs by Japan and Korea showed that 57.1% of agricultural tariff lines were
supposed to be liberalized on average, and 40.7% were categorized into exception.
Overall, East Asian countries adopted lower liberalization ratio of within 10-year
liberalization for agriculture than Western countries, although it should be carefully
interpreted in that only FTAs by Japan and Korea were under consideration.
4.3. ASEAN-China FTA
China and ASEAN began talks on a free trade accord in early 2002 and signed
a framework agreement in November, containing general goals of the bilateral FTA
between ASEAN and China. At the agreement, both parties agreed to work faster
toward a free trade agreement in 2010, thus creating a large marketplace with over with
1.7 billion consumers, about US$1.8 trillion in GDP and US$1.2 trillion in trade volume.
After a series of negotiations, the two sides have concluded the FTA on the market
access for commodity in 2004 and implemented the agreement July 2005, reducing
bilateral tariffs, which should be down to zero for most products by 2010.
According to Article 3 (4) of the framework agreement of ASEAN-China
FTA,29 the products which are subject to the tariff reduction or elimination program
shall be categorized into two Tracks as follows: Normal Track and Sensitive Track. For
products listed in the Normal Track, respective applied MFN tariff rates gradually
reduced or eliminated over a period from July 1, 2005 to 2012 for ASEAN 6 and China,
and in the case of the new ASEAN Member States,30 the period shall be from July 1,
2005 to 2018 with higher starting tariff rates and different staging. Products listed in the
29 The Framework Agreement on Comprehensive Economic Co-operation between the Association of
South East Asian Nations and the People’s Republic of China, which is signed November 4, 2002 in
Phnom Penh.
30 New ASEAN member countries are Cambodia, Laos, Myanmar and Vietnam.

30
Sensitive Track shall have their respective positive applied MFN tariff rates, meaning
that those items would not be free of tariffs even after 2018.
The number of products listed in the sensitive track shall be subject to a
maximum ceiling to be mutually agreed among the Parties. ASEAN 6 and China can
not have more than 400 HS6 tariff lines, while the sensitive track items for new member
countries can not exceed 500 items (HS6). The sensitive track items will be categorized
into two groups: Sensitive List and Highly Sensitive List. Only maximum 40% of
sensitive track items can be listed as highly sensitive goods.
Since the ASEAN-China FTA involves 11 countries and special considerations
are taken into account in the concession of tariff elimination, the appendices of tariff
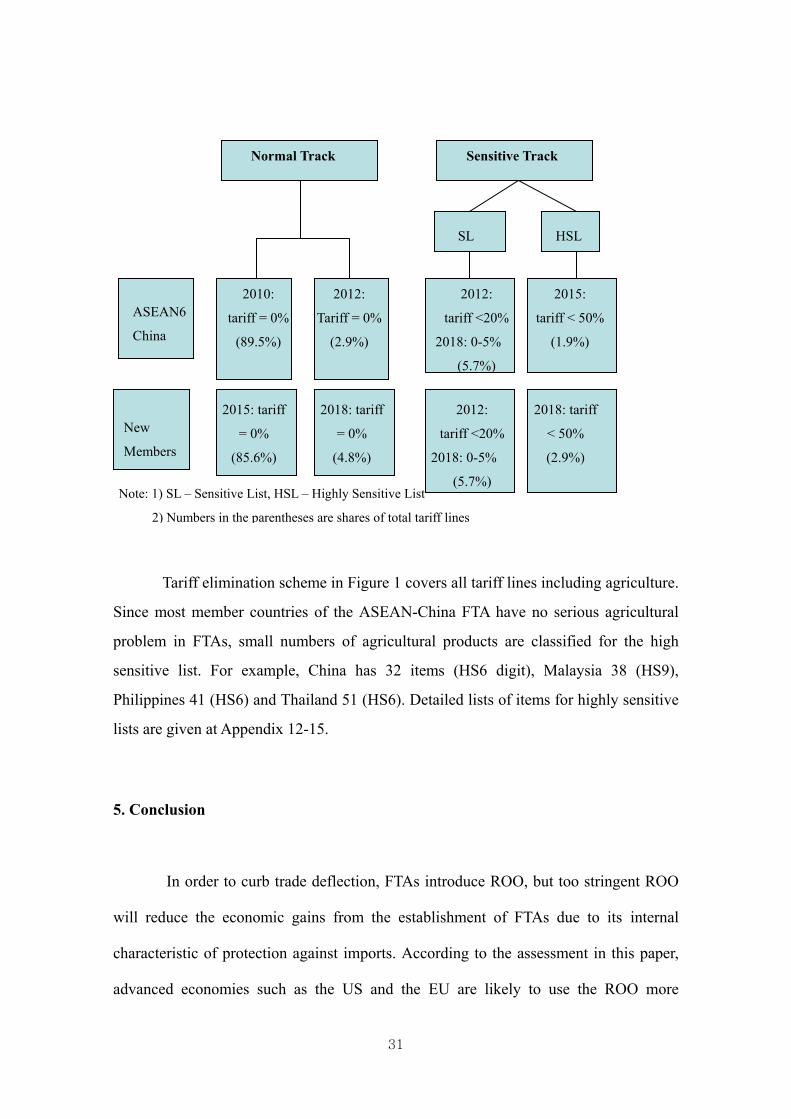
elimination are quite complicated. Figure 1 represents overall views of tariff elimination
in the ASEAN-China FTA. Most of tariff lines (92.4% for ASEAN 6 and China, 90.4%
for new member countries) will be completely liberalized by 2012 for ASEAN 6 and
China and 2018 for new member countries. The remaining items will be categorized
into sensitive track and tariffs for these items will be reduced to 0-5% by 2018 for
ASEAN 6 and China and 2020 for new member countries. However, small numbers of
items, which are listed as highly sensitive, will have their tariffs reduced to not higher
than 50% not later than January 1, 2015 for ASEAN 6 and China, and January 1, 2018
for the newer ASEAN member countries.
Figure 1. Summary of Tariff Elimination in the ASEAN-China FTA
31
Tariff elimination scheme in Figure 1 covers all tariff lines including agriculture.
Since most member countries of the ASEAN-China FTA have no serious agricultural
problem in FTAs, small numbers of agricultural products are classified for the high
sensitive list. For example, China has 32 items (HS6 digit), Malaysia 38 (HS9),
Philippines 41 (HS6) and Thailand 51 (HS6). Detailed lists of items for highly sensitive
lists are given at Appendix 12-15.
5. Conclusion
In order to curb trade deflection, FTAs introduce ROO, but too stringent ROO
will reduce the economic gains from the establishment of FTAs due to its internal
characteristic of protection against imports. According to the assessment in this paper,
advanced economies such as the US and the EU are likely to use the ROO more
Normal Track Sensitive Track
SL HSL
2012:
Tariff = 0%
(2.9%)
2015:
tariff < 50%
(1.9%)
2012:
tariff <20%
2018: 0-5%
(5.7%)
ASEAN6
China
2010:
tariff = 0%
(89.5%)
New
Members
2015: tariff
= 0%
(85.6%)
2018: tariff
= 0%
(4.8%)
2012:
tariff <20%
2018: 0-5%
(5.7%)
2018: tariff
< 50%
(2.9%)
Note: 1) SL – Sensitive List, HSL – Highly Sensitive List
2) Numbers in the parentheses are shares of total tariff lines

32
heavily than developing countries. This trend was seen when the former countries
established FTAs with developing countries, targeting the blocking of the inflow of
imports from partner countries.
ROO will be maintained unless member countries of a FTA agree to revise it.
However, original ROO adopted in a FTA may not be relevant as economic structure
and business environment change.31 For example, most companies depend on a wide
range of outsourcing, and it will be more beneficial for FTAs to allow some forms of
outsourcing, resulting in the facilitation of intra and external trade. Or political issues
can raise the necessity of changing the structure of ROO for specific sectors.
As MFN tariffs are reduced, the importance of ROO will become smaller, since
the expected net gains from satisfying the ROO will shrink. Krueger (1985) argues that
many companies give up applying for the tariff preferences of the NAFTA because of
high compliance costs. Even though tariff preferences are high enough to cover the
extra costs, companies will then have incentives for satisfying the ROO.
This paper reports that FTAs by East Asian countries have a wide gap in ROOs,
from the most simplest ROO in the world (ASEAN-China FTA) to stringent ROOs in
FTAs by Japan and Korea.32 This implies a high probability of the spaghetti-bowl
effect in East Asia. All FTAs by East Asia are under implementation now, and no serious
problems are reported yet. The region will experience negative impacts coming from
different ROOs across FTAs.
East Asia has been discussing and promoting a region-wide FTA since the East
Asian Vision Group (EAVG) was established in 1999, with the agreement by ASEAN+3
31 Australia and New Zealand adopted a loose type of ROO in the bilateral FTA (CER) in 1990s, but recently the two countries are discussing the revision of the ROO. 32 This means that ROOs are designed defensively by Japan and Korea, showing a passive approach against FTAs and resulting in their standing in the way of regional trade integration.

33
Leaders. One viable approach is to consolidate multiple bilateral FTAs in East Asia into
an East Asian FTA (Cheong 2005). Although there are many huddles the region should
overcome in future for the FTA, one of them will be to harmonize the ROOs in East
Asian FTAs.
References APEC, 2004, “Free Trade Agreements/Regional Trade Agreements (FTAs/RTAs) in the
Asia-Pacific Region,” Part II in APEC Economic Outlook. Brenton, Paul. 2003, “Notes on Rules of Origin with Implications for Regional
Integration on Southeast Asia.” Presented at PECC Trade Forum. Washington D.C. April 22-23.
Cadot, Oliver, Jaime de Melo, Antoni Estevadeordal, Akiko Suwa-Eisenmann and Bolormaa Tumurchudur, 2002, “Assessing the Effects of NAFTA’s Rules of Origin,” Mimeo.
Cheong, Inkyo, 2001, “Analysis of Chile-MERCOSUR FTA,” Unpublished Manuscript, Seoul: Korea Institute for Economic Policy, July.
______, 2003a, “The Korea-Chile FTA: Contents and Assessment,” Seoul: Korea Institute for Economic Policy, March.
______, 2003b, “Korea’s FTA Policy: Progress and Prospects” in Yangseon Kim and Chang Jae Lee (eds.), Northeast Asian Economic Integration: Prospects for a Northeast Asian FTA, Korea Institute for International Economic Policy, Seoul, Korea.
______, 2005, “Estimation of Economic Effects of FTAs in East Asia,” in Ahn, Choong Yong, Richard E. Baldwin, and Inkyo Cheong (eds.), East Asian Economic Regionalism, Amsterdam: Springer.
Estevadeordal, Antoni, 2003, “Rules of Origin in FTAs: A World Map,” Presented at PECC Trade Forum, Washington D.C., April 22-23.
______ and Kati Suominen, 2004, “Rules of Origin in FTAs in Europe and in the Americas: Issues and Implications for the EU_Mercosur Inter-Regional Association Agreement,” Washington DC: Inter-American Development Bank.
Herin, Jan. 1986. “Rules of Origin and Differences between Tariff Levels in EFTA and in the EC.” EFTA Occasional Paper No. 13.

34
Koskinen, Matti. 1983, “Excess Documentation Costs as a Non-Tariff Measure: An Empirical Analysis of the Effects of Documentation Costs.” Working Paper. Swedish School of Economics and Business Administration.
Krueger, Anne O. 1993, “Free Trade Agreements as Protectionist Devices: Rules of Origin.” NBER Working Paper No. 4352. Cambridge, MD: NBER.
Levine, R. and D. Renelt. 1992. “A sensitivity analysis of cross-country growth regressions,” The American Economic Review, Vol. 82 (4), 942-963.
Palmeter, David. 1997. “Rules of Origin in Regional Trade Agreements.” In Regionalism and Multilateralism after the Uruguay Round – Convergence, Divergence and Interaction, published by European Interuniversity Press, Brussels.
Productivity Commission, 2004, “Rules of Origin under the Australia-New Zealand Closer Economic Relations Trade Agreement,” Canberra, Australia: Productivity Commission.
Schiff, Maurice and L. Alan Winters, 2003, Regional Integration and Development, Oxford University Press for the World Bank.
Scollay, Robert and John P. Gibert, 2001, New Regional Trading Arrangements in the Asia Pacific? Institute for International Economics, Washington, D.C.
Urata, Shujiro and Kozo, Kiyota, 2003, “The Impacts of an East Asia FTA on Foreign Trade in East Asia,” NBER Working Paper 10173, December.
WTO, 2002, “Rules of Origin Regimes in Regional Trade Agreements,” Committee on Regional Trade Agreements, April 5.
35
APPENDICES
Appendix 1. US’s Tariff Liberalization for Agriculture in the NAFTA (# of HS8)
A B C D C+ Ctq Sug Total
Ch.01 10 - - 10 - - - 20
Ch.02 52 - - 19 - - - 71
Ch.04 13 - 64 2 - - - 79
Ch.05 5 - - 6 - - - 11
Ch.06 21 1 - 6 - - - 28
Ch.07 93 46 25 15 8 7 - 194
Ch.08 68 12 15 20 3 - - 118
Ch.09 11 - 1 32 - - - 44
Ch.10 10 1 6 4 - - - 21
Ch.11 31 1 - 6 - - - 38
Ch.12 22 1 - 29 2 - - 54
Ch.13 4 3 - 8 - - - 15
Ch.14 5 1 - 8 - - - 14
Ch.15 48 8 1 13 - - - 70
Ch.16 26 - - - - - - 26
Ch.17 15 1 3 1 - - 12 32
Ch.18 10 - 2 5 - - 2 19
Ch.19 12 1 5 9 - - - 27
Ch.20 76 25 43 10 4 - - 158
Ch.21 17 - 5 6 1 - 2 31
Ch.22 58 1 5 1 2 - - 67
Ch.23 16 - 2 11 - - - 29
Ch.24 9 - 14 1 - - - 24
Subtotal 632 102 191 222 20 7 16 1190
Share 53.1 8.6 16.1 18.7 1.7 0.6 1.3 100.0
Note: A - Tariff elimination at the implementation of the agreement; B - 5 year liberalization; C - 10 year liberalization; D – zero tariff item; C+ - 15 year liberalization; Ctq – 10 year liberalization with quota; Sug – 15 year liberalization for sugar Source: Calculated from the NAFTA Agreement

36
Appendix 2. Mexico’s Tariff Liberalization for Agriculture in the NAFTA (# of HS8)
A B C D Ctq Ca Cg EX B+ BP Sug Pr Total
Ch.01 10 1 5 9 2 - - 4 - - - - 31
Ch.02 1 3 23 7 9 3 - 14 - 2 - - 62
Ch.04 1 - 1 - - - - 45 - - - - 47
Ch.05 12 - 1 - - - - - - - - - 13
Ch.06 23 - - 6 - - - - - - - - 29
Ch.07 97 2 - 3 2 1 1 - - - - - 106
Ch.08 45 14 6 - 1 - - - - - - - 66
Ch.09 30 - 4 - - - - - - - - - 34
Ch.10 6 1 10 2 - 2 1 - - - - - 22
Ch.11 - - 35 - - 2 - - - - - - 37
Ch.12 11 2 12 55 - - - - - - - 3 83
Ch.13 29 1 1 1 - - - - - - - 4 36
Ch.14 12 - 1 - - - - - - - - - 13
Ch.15 16 2 59 - - 2 - - - - - - 79
Ch.16 - - 11 - - - - 4 - - - - 15
Ch.17 - - 12 - - - - - - - 12 - 24
Ch.18 6 - 4 - - - - - - - 1 - 11
Ch.19 1 10 9 - - - - - - - - - 20
Ch.20 41 12 13 - 2 - - - - - - - 68
Ch.21 6 6 13 - - - - 2 - - 2 - 29
Ch.22 9 20 14 - - - - - 1 - - - 44
Ch.23 6 9 22 - - - - 1 - - - - 38
Ch.24 - - 12 - - - - - - - - - 12
Subtot 362 83 268 83 16 10 2 70 1 2 15 7 919
Share 39.4 9.0 29.2 9.0 1.7 1.1 0.2 7.6 0.1 0.2 1.6 0.8 100
Note: A - Tariff elimination at the implementation of the agreement; B - 5 year liberalization; C - 10 year liberalization; D – zero tariff item; Ca - 9 year liberalization ; Cg – 14 year liberalization; EX – Exclusion; B+ - 7 year liberalization; BP – 5 year liberalization with large cut later; Sug – 15 year liberalization for sugar; Pro – Import prohibited item Source: Calculated from the NAFTA Agreement

37
Appendix 3. US’ Tariff Liberalization for Agriculture in the US-Australia FTA (# of HS8)
A B D E F G H I Wine Total
Ch.01 12 1 - 14 1 - - - - 28
Ch.02 43 16 - 19 - - 20(20) - - 98
Ch.04 55 2 8 2 25(1) - - 157(99) - 249
Ch.05 5 1 - 15 - - - - - 21
Ch.06 19 2 1 6 - - - - - 28
Ch.07 90 30 23 16 8 - - - - 167
Ch.08 60 16 13 23 4 2(2) - - - 118
Ch.09 13 2 - 33 - - - - - 48
Ch.10 16 1 - 4 - - - - - 21
Ch.11 29 3 - 4 1 - - - - 37
Ch.12 24 2 - 31 2(2) - - 2 - 61
Ch.13 5 - - 10 - - - - - 15
Ch.14 6 - - 7 - - - - - 13
Ch.15 28 9 5 16 2 - - 2(2) - 62
Ch.16 19 7 1 2 - - - - - 29
Ch.17 13 2 2 2 15 - - 32(2) - 66
Ch.18 12 1 4 6 - - - 54(26) - 77
Ch.19 18 10 2 10 - - - 30(14) - 70
Ch.20 80 33 25 13 29(3) - - 3 - 183
Ch.21 19 7 8 9 7 - - 42(11) - 92
Ch.22 20 - 2 32 6 - - 2(2) 11(11) 73
Ch.23 20 1 - 10 - - - 4(4) - 35
Ch.24 9 4 6 19 9(7) - - 8 - 55
Subtot 615 150 100 303 109 2 20 336 11 1646
Share 37.4 9.1 6.1 18.4 6.6 0.1 1.2 20.4 0.7 100.00
Note: A - Tariff elimination at the implementation of the agreement; B - 4 year liberalization; C - 8 year liberalization; D – 10 year liberalization; Wine - 10 year liberalization with quota; E - zero tariff item; F -18 year liberalization; G - 17 year liberalization; I – Exclusion Source: Calculated from the US-Australia FTA

38
Appendix 4. US’ Tariff Liberalization for Agriculture in the US-Chile FTA (# of HS8)
A B C D E F G H J Total
Ch.01 12 - - - - 11 - - - 23
Ch.02 59 9 1 - - 20 - 4 - 93
Ch.04 143 15 5 7 2 2 - - 77 251
Ch.05 6 - - - - 11 - - - 17
Ch.06 21 1 - - - 6 - - - 28
Ch.07 96 14 12 6 9 15 3 - - 155
Ch.08 58 15 10 4 2 24 4 - - 117
Ch.09 14 - - - - 33 - - - 47
Ch.10 17 - - - - 4 - - - 21
Ch.11 29 3 - - - 6 - - - 38
Ch.12 27 - - - 2 29 - - - 58
Ch.13 4 1 - - - 10 - - - 15
Ch.14 6 - - - - 8 - - - 14
Ch.15 29 8 2 1 3 16 - - 1 60
Ch.16 26 - - - - 1 - - - 27
Ch.17 44 - 1 3 15 2 - - 1 66
Ch.18 38 - - 1 12 7 - - 20 78
Ch.19 38 2 2 2 6 9 - - 9 68
Ch.20 89 11 29 6 13 12 10 - - 170
Ch.21 56 1 1 - 15 7 1 - 7 88
Ch.22 27 3 - - 4 31 7 - 1 73
Ch.23 21 1 - - - 12 - - 2 36
Ch.24 20 2 5 - 9 20 - - - 56
Subtot 880 86 68 30 92 296 25 4 118 1,599
Share 55.0 5.4 4.3 1.9 5.8 18.5 1.6 0.3 7.4 100.0
Note: A - Tariff elimination at the implementation of the agreement; B - 4 year liberalization; C - 8 year liberalization; D – 10 year liberalization; E - 12 year liberalization; F - zero tariff item; G - 11 year liberalization; H – 9 year liberalization without change in 1-2 year; J -11 year liberalization without change in 1-7 year Source: Calculated from the US-Chile FTA
39
Appendix 5. Chile’s Tariff Liberalization for Agriculture in the US-Chile FTA (# of HS8)
A B C E G H O V 합계
Ch.01 19 - - - - - - - 19
Ch.02 29 16 - 4 - 4 - - 53
Ch.04 2 13 24 5 - - - - 44
Ch.05 16 - - - - - - - 16
Ch.06 12 - - - - - - - 12
Ch.07 42 3 18 - - - - - 63
Ch.08 63 - - - - - - - 63
Ch.09 32 - - - - - - - 32
Ch.10 7 - 2 5 1 - 1 - 16
Ch.11 8 7 - 18 1 - - - 34
Ch.12 32 - 14 6 - - - - 52
Ch.13 11 - 1 - - - - - 12
Ch.14 11 - - - - - - - 11
Ch.15 20 - - 3 25 - - - 48
Ch.16 8 2 3 - - - - - 13
Ch.17 13 - - - 13 - - - 26
Ch.18 12 - - - 12 - - - 24
Ch.19 14 2 - 1 4 - - - 21
Ch.20 40 2 4 1 4 - - - 51
Ch.21 17 2 - - 14 - - - 33
Ch.22 10 - - 6 - - 5 5 26
Ch.23 14 10 - 5 - - - - 29
Ch.24 9 - - - - - - - 9
Subtot 441 57 66 54 74 4 6 5 707
Share 62.4 8.1 9.3 7.6 10.5 0.6 0.8 0.7 100
Note: A - Tariff elimination at the implementation of the agreement; B - 4 year liberalization; C - 8 year liberalization; E - 12 year liberalization; G - 11 year liberalization; H – 9 year liberalization without change in 1-2 year; O - 2 year liberalization; V – 11 year liberalization without change in 1-6 year Source: Calculated from the US-Chile FTA

40
Appendix 6. EU’s Tariff Liberalization for Agriculture in the EU-Mexico FTA (# of HS8)
1 2 3 4 4a O Subtot
Ch.01 13 3 3 17 0 11 47
Ch.02 40 18 15 42 0 118 233
Ch.04 4 0 0 1 0 163 168
Ch.05 22 0 0 0 0 0 22
Ch.06 14 20 2 3 0 0 39
Ch.07 14 7 32 97 0 12 162
Ch.08 17 15 39 49 0 8 128
Ch.09 49 6 0 1 0 0 56
Ch.10 5 0 0 2 0 48 55
Ch.11 0 0 8 4 0 71 83
Ch.12 75 3 2 0 0 0 80
Ch.13 16 0 2 0 0 1 19
Ch.14 12 0 0 0 0 0 12
Ch.15 54 46 9 14 7 5 135
Ch.16 3 29 3 18 0 34 87
Ch.17 0 0 0 0 0 46 46
Ch.18 2 4 0 0 1 21 28
Ch.19 1 1 0 0 0 45 47
Ch.20 7 41 26 104 0 107 285
Ch.21 9 8 0 1 0 24 42
Ch.22 35 26 0 1 0 114 176
Ch.23 32 5 0 25 0 5 67
Ch.24 0 25 5 0 0 0 30
Subtot 424 257 146 379 8 833 2,047
Share 20.7 12.55 7.13 19 0.4 40.7 100 Note: 1 - Tariff elimination at the implementation of the agreement; 2 - 3 year liberalization; 3 -
8 year liberalization; 4 - 10 year liberalization; 4a - 9 year liberalization; O – future review, exception and others Source: Calculated from the EU-Mexico FTA

41
Appendix 7. Mexico’s Tariff Liberalization for Agriculture in the EU-Mexico FTA (# of HS8)
1 2 3 4 4a O Subtot
Ch.01 21 0 3 1 0 13 38
Ch.02 3 0 4 1 0 59 67
Ch.04 2 0 0 0 0 46 48
Ch.05 17 9 1 2 0 1 30
Ch.06 40 0 0 0 0 0 40
Ch.07 75 2 0 0 0 4 81
Ch.08 50 0 7 5 3 3 68
Ch.09 2 25 2 0 0 5 34
Ch.10 2 3 0 0 0 17 22
Ch.11 0 0 2 1 4 30 37
Ch.12 75 2 6 0 0 0 83
Ch.13 7 23 2 0 0 0 32
Ch.14 10 0 1 0 0 0 11
Ch.15 12 4 4 16 14 19 69
Ch.16 9 5 3 3 1 22 43
Ch.17 3 0 0 0 0 22 25
Ch.18 1 0 0 0 0 13 14
Ch.19 3 1 4 0 0 17 25
Ch.20 47 13 0 0 0 13 73
Ch.21 8 11 1 5 1 12 38
Ch.22 17 7 21 3 2 5 55
Ch.23 5 4 14 1 0 14 38
Ch.24 11 2 0 0 0 1 14
Subtot 420 111 75 38 25 316 985
Share 42.64 11.27 7.61 3.86 2.54 32.08 100.00 Note: 1 - Tariff elimination at the implementation of the agreement; 2 - 3 year liberalization; 3 -
8 year liberalization; 4 - 10 year liberalization; 4a - 9 year liberalization; O – future review, exception and others Source: Calculated from the EU-Mexico FTA

42
Appendix 8. Japan’s Tariff Liberalization for Agriculture in the Japan-Singapore EPA (# of HS6)
Immediate Liberalization Exception Subtotal
Ch.01 21 2 23
Ch.02 26 33 59
Ch.04 1 26 27
Ch.05 17 0 17
Ch.06 9 3 12
Ch.07 10 51 61
Ch.08 10 45 55
Ch.09 25 7 32
Ch.10 9 7 16
Ch.11 2 27 29
Ch.12 37 7 44
Ch.13 10 2 12
Ch.14 6 2 8
Ch.15 12 34 46
Ch.16 6 20 26
Ch.17 3 13 16
Ch.18 3 8 11
Ch.19 0 19 19
Ch.20 0 50 50
Ch.21 2 14 16
Ch.22 10 12 22
Ch.23 25 0 25
Ch.24 6 3 9
Subtot 250 385 635
Share 39.37 60.63 100.00 Source: Calculated from the Agreement between Japan and the Republic of Singapore for a New-Age Economic Partnership

43
Appendix 9. Japan’s Tariff Liberalization for Agriculture in the Japan-Mexico EPA (# of HS8)
A B Ca P Q X Subtotal
Ch.01 25 0 0 0 0 5 30
Ch.02 32 0 0 1 20 20 73
Ch.04 2 5 0 0 1 23 31
Ch.05 17 0 0 0 0 2 19
Ch.06 12 0 0 0 0 0 12
Ch.07 36 21 0 0 0 25 82
Ch.08 20 30 2 0 1 29 82
Ch.09 25 2 0 0 0 28 55
Ch.10 11 0 0 0 0 13 24
Ch.11 2 0 1 0 0 31 34
Ch.12 38 0 0 0 0 12 50
Ch.13 12 0 0 0 0 5 17
Ch.14 6 0 0 0 0 3 9
Ch.15 14 9 0 0 0 36 59
Ch.16 26 0 0 2 8 15 51
Ch.17 3 0 0 0 0 18 21
Ch.18 3 1 0 0 0 8 12
Ch.19 0 0 0 0 0 19 19
Ch.20 2 74 26 0 5 65 172
Ch.21 5 9 4 0 2 23 43
Ch.22 20 8 2 0 0 7 37
Ch.23 31 1 0 0 0 5 37
Ch.24 6 0 0 0 0 4 10
Subtot 348 160 35 3 37 396 979
Share 35.5 16.34 3.6 0.3 3.8 40.4 100.0 Note: A-immediate liberalization, B-liberalization within 8 years, Ca-liberalization in 11 years, P(Q)-preferential liberalization, R-future review, X-exception Source: Calculated from the Agreement between Japan and the United Mexican States for the Strengthening of the Economic Partnership

44
Appendix 10. Korea’s Tariff Liberalization for Agriculture in the Korea-Singapore FTA (# of HS10)
Immediate Year 5 Year 10 Exception Subtotal
Ch.01 9 35 0 6 50
Ch.02 2 3 31 55 91
Ch.04 0 3 0 48 51
Ch.05 30 26 9 4 69
Ch.06 0 35 30 9 74
Ch.07 0 1 58 65 124
Ch.08 0 0 32 41 73
Ch.09 3 25 3 5 36
Ch.10 10 2 6 14 32
Ch.11 1 4 11 29 45
Ch.12 47 49 16 14 126
Ch.13 3 12 4 9 28
Ch.14 2 0 4 17 23
Ch.15 17 54 20 6 97
Ch.16 0 18 23 49 90
Ch.17 9 5 3 16 33
Ch.18 1 25 1 6 33
Ch.19 0 36 3 10 49
Ch.20 2 0 71 28 101
Ch.21 0 37 14 16 67
Ch.22 0 11 30 11 52
Ch.23 34 1 8 2 45
Ch.24 0 0 4 21 25
Subtot 170 382 381 481 1414
Share 12.02 27.02 26.94 34.02 100.00
Source: Calculated from the Korea-Singapore Free Trade Agreement
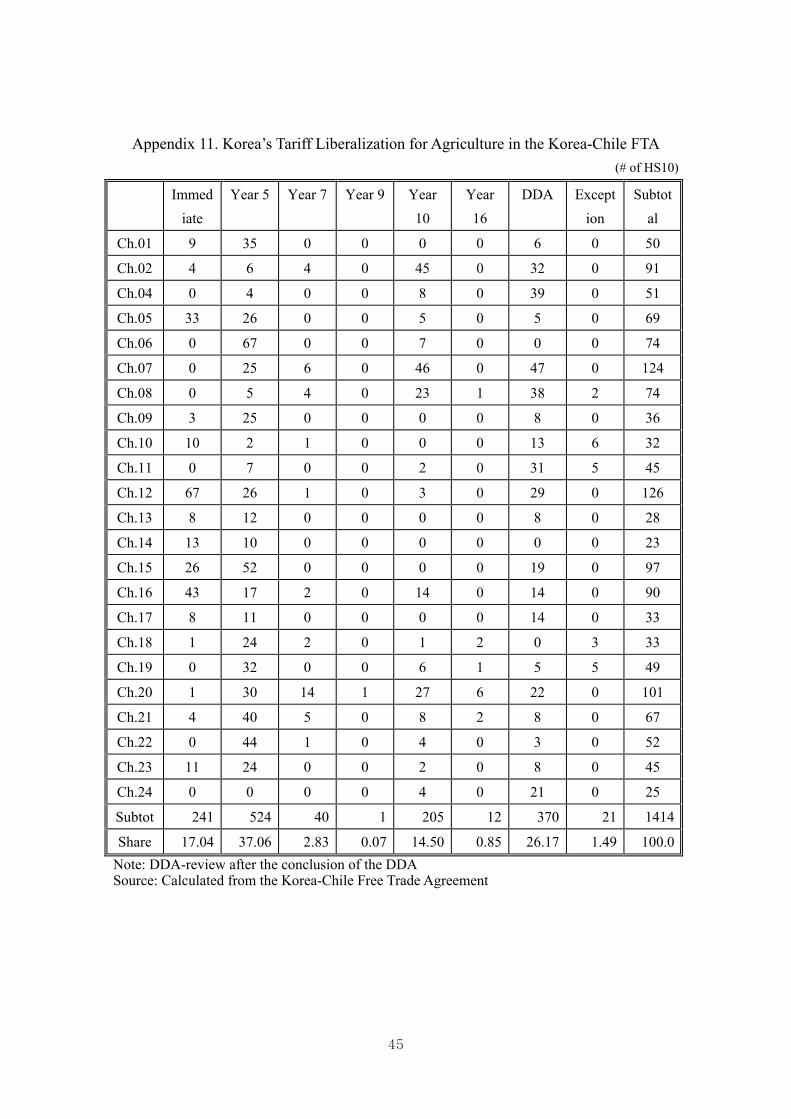
45
Appendix 11. Korea’s Tariff Liberalization for Agriculture in the Korea-Chile FTA (# of HS10)
Immediate
Year 5 Year 7 Year 9 Year 10
Year 16
DDA Exception
Subtotal
Ch.01 9 35 0 0 0 0 6 0 50
Ch.02 4 6 4 0 45 0 32 0 91
Ch.04 0 4 0 0 8 0 39 0 51
Ch.05 33 26 0 0 5 0 5 0 69
Ch.06 0 67 0 0 7 0 0 0 74
Ch.07 0 25 6 0 46 0 47 0 124
Ch.08 0 5 4 0 23 1 38 2 74
Ch.09 3 25 0 0 0 0 8 0 36
Ch.10 10 2 1 0 0 0 13 6 32
Ch.11 0 7 0 0 2 0 31 5 45
Ch.12 67 26 1 0 3 0 29 0 126
Ch.13 8 12 0 0 0 0 8 0 28
Ch.14 13 10 0 0 0 0 0 0 23
Ch.15 26 52 0 0 0 0 19 0 97
Ch.16 43 17 2 0 14 0 14 0 90
Ch.17 8 11 0 0 0 0 14 0 33
Ch.18 1 24 2 0 1 2 0 3 33
Ch.19 0 32 0 0 6 1 5 5 49
Ch.20 1 30 14 1 27 6 22 0 101
Ch.21 4 40 5 0 8 2 8 0 67
Ch.22 0 44 1 0 4 0 3 0 52
Ch.23 11 24 0 0 2 0 8 0 45
Ch.24 0 0 0 0 4 0 21 0 25
Subtot 241 524 40 1 205 12 370 21 1414
Share 17.04 37.06 2.83 0.07 14.50 0.85 26.17 1.49 100.0 Note: DDA-review after the conclusion of the DDA Source: Calculated from the Korea-Chile Free Trade Agreement

46
Appendix 12. China’s Items for the Highly Sensitive List
NO. HS CODE DESCRIPTION 1 1005.10.00 Maize seeds 2 1005.90.00 Maize (excluding seed) 3 1006.10.10 Rice seeds 4 1006.10.90 Rice in the husk (paddy or rough)(excluding seed) 5 1006.20.00 Husked (brown) rice 6 1006.30.00 Semi-milled or wholly milled rice 7 1101.00.00 Wheat or meslin flour 8 1102.20.00 Maize (corn) flour 9 1102.30.00 Rice flour
10 1103.11.00 Groats & meal of wheat 11 1103.13.00 Groats & meal of maize (corn) 12 1103.21.00 Wheat pellets 13 1104.23.00 Other worked grains of maize (corn), not elsewhere specified 14 1507.10.00 Crude soya-bean oil 15 1507.90.00 Soya-bean oil (excluding crude) & fractions 16 1511.10.00 Crude palm oil 17 1511.90.10 Palm oil (excluding crude) & liquid fractions 18 1511.90.20 Palm stearin 19 1511.90.90 Other palm oil and its fractions, not elsewhere specified 20 1514.10.10 Crude rape, colza oil & fractions thereof 21 1514.10.90 Mustard oil & fractions thereof 22 1514.90.00 Rape, colza or mustard oil (excluding crude) & fractions thereof 23 1701.11.00 Raw cane sugar, in solid form 24 1701.12.00 Raw beet sugar, in solid form 25 1701.91.00 Cane or beet sugar, containing added flavouring or colouring 26 1701.99.10 Granulated sugar 27 1701.99.20 Superfine sugar 28 1701.99.90 Other cane or beet sugar, in solid form, not elsewhere specified 29 2402.90.00 Cigars, cigarillos, cigarettes, etc, not containing tobacco 30 2403.10.00 Smoking tobacco with or without tobacco substitutes 31 2403.91.00 Homogenized or reconstituted tobacco 32 2403.99.00 Other manufactured tobacco, not elsewhere specified

47
Appendix 13. Malaysia’s Items for the Highly Sensitive List
NO. HS CODE DESCRIPTION
1 0105.11.100 Day old chicks of the species Gallus weighing not more than 185 gram
2 0105.92.000 Fowls of the species Gallus domestic weighing not more than 2000 gram; others
3 0207.11.000 Meat of fowls of the species Gallus domestic, not cut in pieces, fresh or chilled
4 0207.12.000 Meat of fowls of the species Gallus domestic, not cut in pieces, frozen
5 0207.13.000 Edible cuts and offal, of the species gallus domestic, fresh or chilled
6 0207.14.000 Edible cuts and offal, of the species gallus domesticus, frozen
7 0401.10.100 Milk and cream not concentrated not containing sugar, fat content less than 1%
8 0401.10.900 Milk and cream not concentrated not containing sugar, fat content less than 1%
9 0401.20.100 Milk and cream not concentrated, fat content more than 1% but less than 6%
10 0401.20.900 Milk and cream not concentrated not containing sugar
11 0401.30.100 Milk and cream not concentrated not containing sugar
12 0401.30.900 Milk and cream not concentrated not containing sugar
13 0407.00.111 Fresh hens' eggs, in shell, for hatching
14 0407.00.112 Fresh ducks' eggs, in shell, for hatching
15 0407.00.910 Hens' eggs, in shell, preserved or cooked
16 0407.00.920 Ducks' eggs, in shell, preserved or cooked
17 0704.90.110 Round cabbages, fresh or chilled
18 1006.10.100 Pulut (glutinous rice), in the husk in the husk
19 1006.10.900 Other rice in the husk
20 1006.20.100 Husked pulut (glutinous rice)
21 1006.20.900 Other husked (brown) rice
22 1006.30.100 Pulut (glutinous rice), semi-milled or wholly semi-milled
23 1006.30.900 Other semi-milled or wholly milled rice, whether or not wholly milled rice
24 1006.40.100 Broken rice for animal feeding
25 1006.40.900 Other broken rice
26 2402.20.100 Beedies
27 2402.20.900 Other cigarettes containing tobacco
28 2402.90.100 Ccigars, cheroots and cigarillos containing tobacco substitutes
29 2402.90.200 Cigarettes containing tobacco substitutes /others
30 2403.10.110 Smoking tobacco, whether or not containing tobacco substitutes
31 2403.10.190 Other smoking tobacco, whether or not containing tobacco substitutes
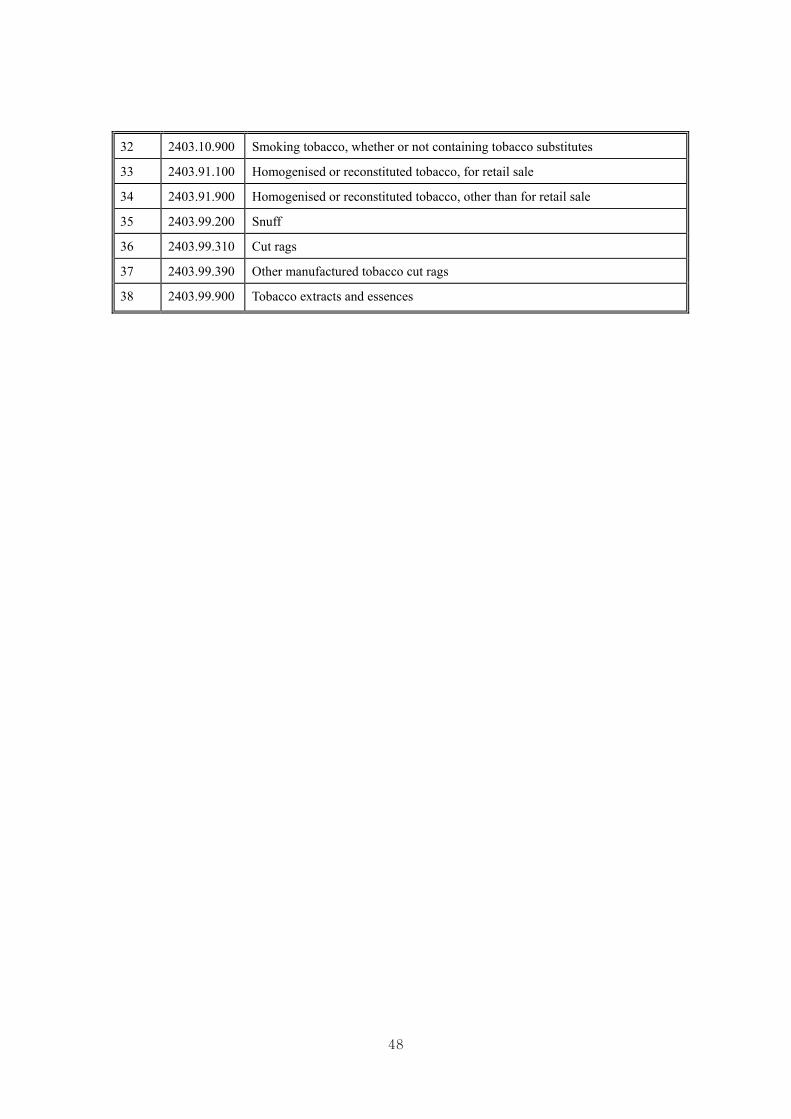
48
32 2403.10.900 Smoking tobacco, whether or not containing tobacco substitutes
33 2403.91.100 Homogenised or reconstituted tobacco, for retail sale
34 2403.91.900 Homogenised or reconstituted tobacco, other than for retail sale
35 2403.99.200 Snuff
36 2403.99.310 Cut rags
37 2403.99.390 Other manufactured tobacco cut rags
38 2403.99.900 Tobacco extracts and essences
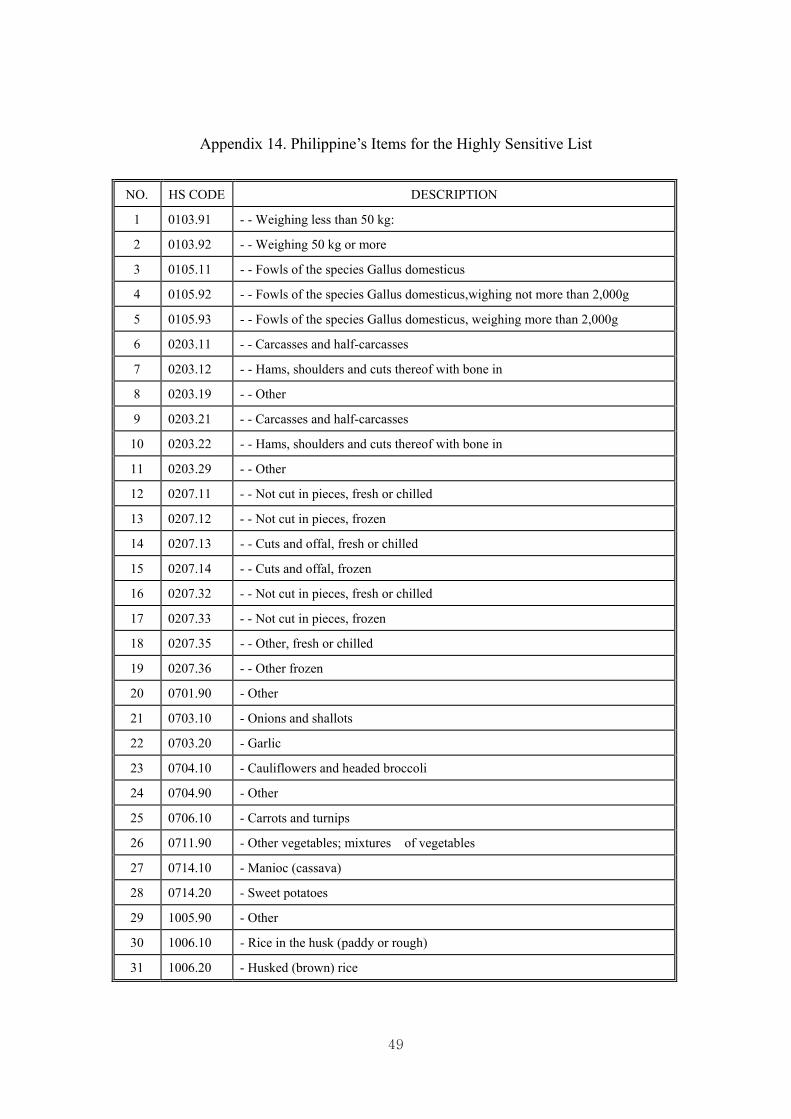
49
Appendix 14. Philippine’s Items for the Highly Sensitive List
NO. HS CODE DESCRIPTION
1 0103.91 - - Weighing less than 50 kg:
2 0103.92 - - Weighing 50 kg or more
3 0105.11 - - Fowls of the species Gallus domesticus
4 0105.92 - - Fowls of the species Gallus domesticus,wighing not more than 2,000g
5 0105.93 - - Fowls of the species Gallus domesticus, weighing more than 2,000g
6 0203.11 - - Carcasses and half-carcasses
7 0203.12 - - Hams, shoulders and cuts thereof with bone in
8 0203.19 - - Other
9 0203.21 - - Carcasses and half-carcasses
10 0203.22 - - Hams, shoulders and cuts thereof with bone in
11 0203.29 - - Other
12 0207.11 - - Not cut in pieces, fresh or chilled
13 0207.12 - - Not cut in pieces, frozen
14 0207.13 - - Cuts and offal, fresh or chilled
15 0207.14 - - Cuts and offal, frozen
16 0207.32 - - Not cut in pieces, fresh or chilled
17 0207.33 - - Not cut in pieces, frozen
18 0207.35 - - Other, fresh or chilled
19 0207.36 - - Other frozen
20 0701.90 - Other
21 0703.10 - Onions and shallots
22 0703.20 - Garlic
23 0704.10 - Cauliflowers and headed broccoli
24 0704.90 - Other
25 0706.10 - Carrots and turnips
26 0711.90 - Other vegetables; mixtures of vegetables
27 0714.10 - Manioc (cassava)
28 0714.20 - Sweet potatoes
29 1005.90 - Other
30 1006.10 - Rice in the husk (paddy or rough)
31 1006.20 - Husked (brown) rice

50
32 1006.30 - Semi-milled or wholly milled rice, whether or not polished or glazed
33 1006.40 - Broken rice
34 1602.32 - - Of fowls of the species Gallus domesticus
35 1602.41 - - Hams and cuts thereof
36 1602.49 - - Other, including mixtures
37 1701.11 - - Cane sugar
38 1701.12 - - Beet sugar
39 1701.91 - - Containing added flavouring or coloring matter
40 1701.99 - - Other
41 2309.90 - Other
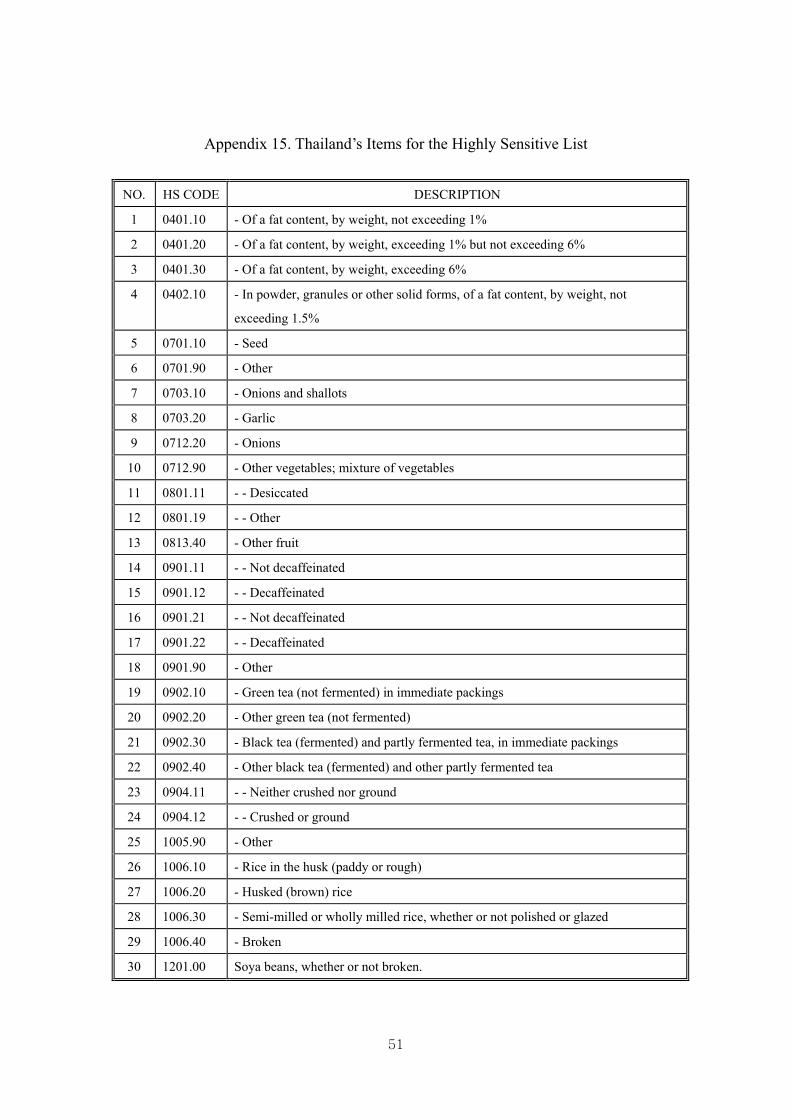
51
Appendix 15. Thailand’s Items for the Highly Sensitive List
NO. HS CODE DESCRIPTION
1 0401.10 - Of a fat content, by weight, not exceeding 1%
2 0401.20 - Of a fat content, by weight, exceeding 1% but not exceeding 6%
3 0401.30 - Of a fat content, by weight, exceeding 6%
4 0402.10 - In powder, granules or other solid forms, of a fat content, by weight, not
exceeding 1.5%
5 0701.10 - Seed
6 0701.90 - Other
7 0703.10 - Onions and shallots
8 0703.20 - Garlic
9 0712.20 - Onions
10 0712.90 - Other vegetables; mixture of vegetables
11 0801.11 - - Desiccated
12 0801.19 - - Other
13 0813.40 - Other fruit
14 0901.11 - - Not decaffeinated
15 0901.12 - - Decaffeinated
16 0901.21 - - Not decaffeinated
17 0901.22 - - Decaffeinated
18 0901.90 - Other
19 0902.10 - Green tea (not fermented) in immediate packings
20 0902.20 - Other green tea (not fermented)
21 0902.30 - Black tea (fermented) and partly fermented tea, in immediate packings
22 0902.40 - Other black tea (fermented) and other partly fermented tea
23 0904.11 - - Neither crushed nor ground
24 0904.12 - - Crushed or ground
25 1005.90 - Other
26 1006.10 - Rice in the husk (paddy or rough)
27 1006.20 - Husked (brown) rice
28 1006.30 - Semi-milled or wholly milled rice, whether or not polished or glazed
29 1006.40 - Broken
30 1201.00 Soya beans, whether or not broken.

52
1201.001 - - - Edible
1201.009 - - - Other
31 1203.00 Copra.
32 1209.91 - - Vegetable seeds
33 1507.10 - Crude oil, whether or not degummed
34 1507.90 - Other
35 1511.10 - Crude oil
36 1511.90 - Other
37 1513.11 - - Crude oil
38 1513.19 - - Other
39 1513.21 - - Crude oil
40 1513.29 - - Other
41 1701.11 - - Cane sugar
42 1701.12 - - Beet sugar
43 1701.91 - - Containing added flavouring or colouring matter
44 1701.99 - - Other
45 2101.11 - - Extracts, essences and concentrates
46 2101.12 - - Preparations with a basis of extracts, essences or concentrates
47 2202.90 - Other
48 2304.00 Oil-cake and other solid residues
49 2401.10 - Tobacco, not stemmed/stripped
50 2401.20 - Tobacco, partly or wholly stemmed/stripped
51 2401.30 - Tobacco refuse


![Programme1R[1] - INHA](https://static.fdocuments.us/doc/165x107/62b3c82dff311a3a8c0ef049/programme1r1-inha.jpg)