
Markal, a model to support greenhouse gas reduction policies
30
Global change and sustainable development Subprogramme 2 : to provide scientific support for belgian politics N° CG/DD/221 & CG/DD/222 SERVICES FEDERAUX DES AFFAIRES SCIENTIFIQUES, TECHNIQUES ET CULTURELLES rue de la Science 8 § B-1000 BRUXELLES Tél. 02 238 34 11 § Fax 02 230 59 12 URL : www.belspo.be FEDERALE DIENSTEN VOOR WETENSCHAPPELIJKE, TECHNISCHE EN CULTURELE AANGELEGENHEDEN Wetenschapsstraat 8 § B-1000 BRUSSEL Tel. 02 238 34 11 § Fax 02 230 59 12 URL : www.belspo.be Markal, a model to support greenhouse gas reduction policies Final report CES-KULeuven - VITO
Transcript of Markal, a model to support greenhouse gas reduction policies

Global change and sustainable developmentSubprogramme 2 : to provide scientific support for belgian politics
N° CG/DD/221 & CG/DD/222
SERVICES FEDERAUX DESAFFAIRES SCIENTIFIQUES,
TECHNIQUES ET CULTURELLES
rue de la Science 8 § B-1000 BRUXELLESTél. 02 238 34 11 § Fax 02 230 59 12
URL : www.belspo.be
FEDERALE DIENSTEN VOORWETENSCHAPPELIJKE, TECHNISCHEEN CULTURELE AANGELEGENHEDEN
Wetenschapsstraat 8 § B-1000 BRUSSELTel. 02 238 34 11 § Fax 02 230 59 12
URL : www.belspo.be
Markal, a model to support greenhousegas reduction policies
Final report
CES-KULeuven - VITO

D/2001/1191/21Published in 2001 by theFederal Office for Scientific, Technical and Cultural Affairs
For more informations :
Madame A. FierensDWTC/SSTCWetenschapstraat 8 rue de la scienceBrussel 1000 BruxellesTel. : +32-2-238.36.60Fax. : +32-2-230.59.12E-mail : fier @belspo.beInternet : http://www.belspo.be
LEGAL NOTICE
Neither the Federal Office for Scientific, Technical and Cultural Affairs (OSTC) nor any person actingon behalf of the OSTC is responsible for the use which might be made of the following information. Nopart of this publication may be reproduced, stored in a retrieval system, or transmitted in any form orby any means, electronic, mechanical, photocopying, recording, or otherwise, without indicating thereference.

DWTC/SSTC
Final Report
MARKAL, A MODEL TO SUPPORT GREENHOUSEGAS REDUCTION POLICIES
partners
CES-KULeuven
VITO
coordinator
Prof. Stef ProostKatholieke Universiteit Leuven
CES69 NaamsestraatB-3000 Leuven
BelgiumTel: + 32 16 326812Fax: + 32 16 326796
e-mail: [email protected]

1
I. Introduction...........................................................................................................................2A. Objective...........................................................................................................................2B. Research Strategy ..............................................................................................................2
II. Methodology..........................................................................................................................3III. Activities and Results .............................................................................................................4
A. Maintenance, extension and quality control of the technology database .................................41. The electricity sector .....................................................................................................42. The industrial sector......................................................................................................43. The residential sector ....................................................................................................54. The transport sector ......................................................................................................5
B. Model development............................................................................................................61. Development of MARKAL-STOCHASTIC ......................................................................62. Representation of secondary benefits............................................................................12
C. Contribution to the GHG policy of Belgium through policy studies ..................................... 181. The reference scenario ................................................................................................182. The policy scenarios ....................................................................................................21
D. Participation in ETSAP network....................................................................................... 25IV. Assessment and Perspectives ...............................................................................................26
A. Assessment ..................................................................................................................... 26B. Project perspectives ......................................................................................................... 26

2
I. INTRODUCTION
A. Objective
In view of the Kyoto protocol signed by the EU, climate change and its policy implications both atnational and international level will remain a priority for the policymakers. A correct evaluation of thepotential for emission reduction in Belgium, their allocation between economic sectors and their costis therefore essential. It is the main goal of this project to support the policy in Belgium regardingclimate change with the MARKAL model. More concrete, it can contribute to the followingobjectives:
• evaluation of the CO2-emission targets, which Belgium can achieve in the long term
• determine which sectors or technologies have to be considered in priority
B. Research Strategy
To achieve the goal of this project, the objective is to make the MARKAL model available in Belgiumto contribute to the definition of policies regarding climate change, at national and international level.
MARKAL is a generic model that represents all energy demand and supply activities and technologiesfor a country with a horizon of up to 40 years. It is a technico-economic model which assembles in asimple but economically consistent way technological information (conversion-efficiency, investment-and variable costs, etc.). As the model is formulated as a dynamic optimisation model, it can producealternative developments for energy supply and demand that achieve CO2 emission reduction goals atleast cost. Simultaneously, the model makes prospective energy and emission balances, tests thepotential of new energy technologies and contributes to R&D policy formulation. Finally the model iswell suited to approach the burden sharing issue between sectors of the same country in a transparentand scientific way. Compared to ad-hoc models which are more specific to a country or a sector andwhich use another modelling technique, it presents three important advantages:
• due to its transparency it promotes the communication between experts with differentsectoral or technological background (it is the place where engineers and economistsunderstand each other),
• it is easily verifiable : its results can be related to assumptions regarding technologicaldata and economic parameters,
• it is comparable at an international level : as many countries use the same model, itsresults can be immediately compared with results from other countries.
The first Belgian version has been developed by CES-KULeuven and VITO in the first GLOBALCHANGE program of the DWTC-SSTC and has already been used intensively for policy support.
At present the model is used in 30 countries for policy analysis purposes. It is a collaborative effortcoordinated by the ETSAP (IEA) network. The ETSAP-network (Energy Technology SystemsAnalysis Programme) is an agreement within the International Energy Agency which concentrates itswork on “Energy Options for sustainable Development”. The ETSAP-network is in charge of themaintenance of most of MARKAL model software (database-management system and modelspecification) and organises two workshops per year where the experience with case-studies of some20 countries are compared. Results from common case-studies are presented in international forums,organised ea. by IEA and can contribute to the negotiations within the United Nations FrameworkConvention on Climate Change (FCCC). This international network contributes particularly to acontinuous development of the model in many directions.

3
II. METHODOLOGY
This research project is centred on the development of the Belgian Markal model and its use for policyanalysis. Markal is a partial equilibrium model, which is complementary to other models. Thecomplementarity is mainly related to the following three types of models:
• detailed sectoral models : a model for one sector can be more detailed for the technologiesor the type of behaviour of the economic agents (e.g. microsimulation models whichrepresent the behaviour of a representative sample of approximately a hundredhouseholds); this type of model allows to evaluate more correctly other instruments with amore short term impact (information, specific norms, ...); these results can be used as aninput to energy models as MARKAL.
• national general equilibrium models : these are economic models which allow to evaluatethe macroeconomic impact of a CO2 policy (e.g. GEM-E3 model of the EU). Thesemodels can study such questions as the use of the revenue from a CO2 tax, the double-dividend discussion, the total impact on employment, etc. and deliver a basic forecast forthe demand for energy services (an input for MARKAL).
• international energy-economy models : these models evaluate the world impact of CO2emission reduction options in terms of burden sharing, climate damage, exhaustion ofresources, etc. (e.g. DICE model of Nordhaus, MERGE model of Manne & Richels andGEM-E3 for the EU) - Markal can deliver inputs to such models and can make use ofsome of their results (e.g. feedback on the price of resources).
The model can contribute to the following problems:
• propose minimum cost solutions for CO2 reductions and in this way contribute to theburden-sharing within a country,
• compute prospective energy and emission balances,• evaluate the role of new technologies for CO2 reductions and contribute to the setting of R
& D priorities,• evaluate the impact on the costs and on emissions of different types of regulations,
standards and taxes,
Besides the basic version of Markal, three other versions have been developed within the ETSAPcommunity:
• MARKAL-MACRO: through the integration of a simple macroeconomic sub-model thelevel of economic activity and the demand for energy services have become endogenousin the long run
• MARKAL-MICRO/ED: the demand for energy services become endogenous throughdemand functions for energy services (the first version has been developed by CES-KULeuven and is currently used in all studies with Markal for Belgium)
• MARKAL-STOCHASTIC: this version takes explicitly the uncertainty regardingtechnologies (carbon-free technology) or future emission reduction requirements (in 2010-20% or -40%) into account in the formulation of the problem and searches for an optimalhedging strategy.
and the network is currently involved in the development of a new Markal, called TIMES.
Regarding policy analysis, one of the main goals is to help in the formulation of a national Kyotostrategy. MARKAL can contribute with sectoral or intersectoral cost-efficiency studies. It cancontribute to the evaluation of the cost of emission reduction targets for the years 2005-2010. Markalcan also be used to investigate the effects of economic instruments, of technological standards andfuel standards. The participation in an international reference group such as ETSAP allows to integratethe national studies into international studies in a harmonised way.
4
III. ACTIVITIES AND RESULTS
The activities can be grouped into three categories: the maintenance and improvement of the database,new model developments and policy-studies. A further activity which is important for the dynamics ofthe development of the Markal model is the participation in the ETSAP network.
A. Maintenance, extension and quality control of the technology database
A basic version of Markal should be directly available for policy analysis and therefore needs to bemaintained. This maintenance necessitates a regular update of the technology databases and of theeconomic background figures. A common evaluation of the national database and an internal andexternal peer-review of the models is foreseen within the objective of ETSAP. This increases thereliability and representativeness of the model and allows for comparative international studies andanalysis.
The technology database is the basic element of MARKAL. In the Belgian database approximatelytwo hundred technologies are described. This includes existing technologies and technologies stillunder development and covers both technological and economical data. The maintenance and qualitycontrol of the technology database has been an important activity in the overall project, to take intoaccount in the long term studies the potential development of technologies. VITO was mainly incharge of this activity.
1. The electricity sector
The data concerning the electricity sector were updated based on data collected within the AmpereCommission. A complete database with the cost and technical data on potential electricity generationtechnologies in Belgium until 2030 was established with the help of the Ampere reports on eachtechnology, and through consultations with experts from the sector and members from theCommission. The engineering department of KULeuven also contributed. Significant changes weremade in the fields of nuclear energy, fuel cells, wind turbines, STAGs, coal power plants andcogeneration.
2. The industrial sector
Industry is an important user of energy and an important emitter of CO2. Until now it was onlymodelled in a very simplified way. A further decomposition of the industrial sectors into subsectorsnecessitates the introduction of new technologies. This decomposition is done for the most energyintensive sectors with a complete revision of the technological and economic data associated withthese sectors. Also the data for existing subsectors are revised with a special attention for theevaluation of the potential and the associated investment- and variable cost of energy savingtechnologies.
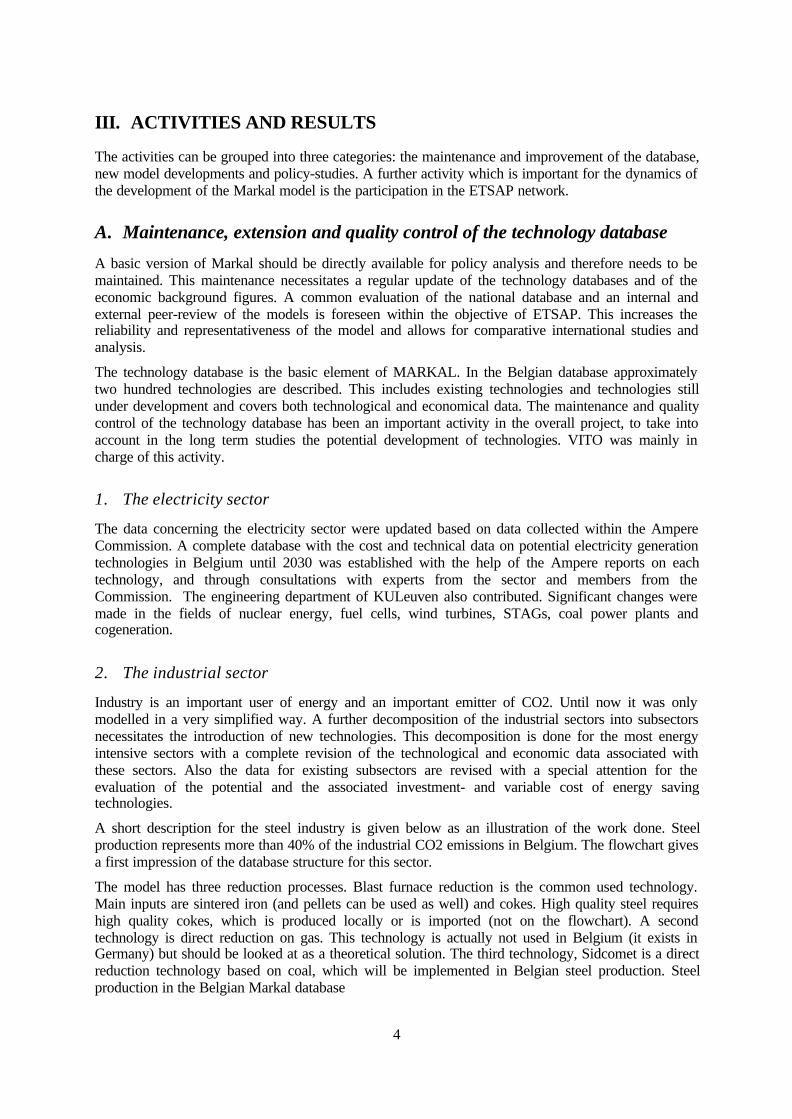
A short description for the steel industry is given below as an illustration of the work done. Steelproduction represents more than 40% of the industrial CO2 emissions in Belgium. The flowchart givesa first impression of the database structure for this sector.
The model has three reduction processes. Blast furnace reduction is the common used technology.Main inputs are sintered iron (and pellets can be used as well) and cokes. High quality steel requireshigh quality cokes, which is produced locally or is imported (not on the flowchart). A secondtechnology is direct reduction on gas. This technology is actually not used in Belgium (it exists inGermany) but should be looked at as a theoretical solution. The third technology, Sidcomet is a directreduction technology based on coal, which will be implemented in Belgian steel production. Steelproduction in the Belgian Markal database

5
Another alternative for steel production is the use of scrap iron. Depending on quality requirements itcan be mixed with blast furnace steel or it can be used in electro-steel
Some secondary flows have not been indicated on the flowchart. At the blast furnace reductionprocess, blast furnace gas is produced. This low-caloric waste gas is used in electricity production. Inthe cokes factory, high caloric cokes-oven gas is produced as by-product. This gas can have differentapplications in steel industry (heating cowpers) as well as in electricity production. Also a smallamount of coal is directly injected in blast furnace. Not all energy requirements are indicated on theflowchart. For instance small amounts of electricity are used is almost all processes. In the databasealso these flows are considered.
3. The residential sector
The data for the evaluation of the useful energy demand in the residential sector have been completelyreviewed and updated on the basis of a specific study on heat demand per type of building by Prof.Hens of the Laboratory of Construction Physics of the KULeuven and of the population survey of1991. This has led to a completely revised procedure to compute the total heat demand: it is based onassumptions regarding the evolution of the housing stock, the population and the size of households,starting from the heat demand per type of building and the allocation of the housing stock over thetypes in the base-year. The types of insulation measures in buildings and their cost were also revised.
4. The transport sector
Road transport has been modelled in detail, as it is in Belgium the primary energy consuming transportmode. Classical fuels (petrol-, diesel and LPG cars) as well as more advanced technologies (electricalcars, hybrid cars, natural gas, ethanol and methanol and fuel cell technologies) are introduced in thedatabase. For classical cars, the European emission standards for different pollutants are explicit in the
Import Cokes Import Coal Import Iron ore Gas Scrap Iron
Cokesfactory
Sinterfactory
Blast-furnace Sidcomet directreduction
Direct reduction gas
Blast-furnacesteel
Electrosteel
Electricity

6
database through the introduction of distinctive car technologies according to their emission standards(Euro 0 cars, Euro 1, Euro 2, Euro 3 and Euro 4). The fuel-efficient cars, as specified in the voluntaryagreement of the car-manufactures with the European Commission, were also introduced. For bussesand trucks, a wide variety of technologies, using different types of energy and with the differentEuropean emission standards have been implemented.
Summary statistics of the transport sector in Markal
Demand category Unit of measure Number of demand technologiesCars for short distance (14400km/year) Billion km 17Cars for long distance (22400 km/year) Billion km 19Busses Billion km 13Trucks Billion km 11Passenger train Million km 2Goods train Million km 2Inland transport by boat Million km 1
A full description of the database is given in annex.
B. Model development
The model development are concentrated on two domain:
• the implementation and the use of the MARKAL-STOCHASTIC version, as there are no othermodels in Belgium that take the uncertainty element into account.
• the reformulation of the model to take better into account the secondary benefits of CO2 emissionreduction, by secondary benefits one understands the saving of other external costs e.g. thedecrease in emissions of other pollutants or the macroeconomic impact (e.g. the employmenteffect).
1. Development of MARKAL-STOCHASTIC
This version can compute optimal hedging strategies when the information on the necessity of CO2emission reductions or the availability of cheap carbon free technologies becomes only available inlater periods. Deterministic scenario analysis and sensibility analysis, the approach followed until nowin the Belgian studies with MARKAL, can give some insights, but their results are not always usefulfor policymakers when the outcomes are very diverging and only one set of actions can be taken.
Within the ETSAP network, an experimental version of MARKAL-STOCHASTIC was developed inthe Netherlands and Canada, based on “multi-stage stochastic programming”. This approach allowstaking explicitly into account uncertainty and its evolution over time. This version has been adapted tothe Belgian case.
a) Theoretical approach for MARKAL-STOCHASTIC
(1) Basic approach for modelling of decision making under uncertainty
In the economic theory, the main approach for decision making under risk is maximising the expectedutility. However it is rather difficult to find a specific utility function and distribution function whichyields a tractable form for the expected utility, when the situation considered becomes more complex.Therefore in practice when considering investment decision under uncertainty, the mean-variancemodel is applied.
The mean-variance model maximises the objective function :

7
µ − λ ∗ σ2,
where µ is the expected return and σ2 is the variance of the disposable income. The variance is used asan indicator of the risk of the return and λ is a parameter reflecting the degree of risk aversion of thedecision-maker.
This model corresponds only exactly to the expected utility approach under very stringent conditionson the utility function or on the probability distribution function. But as Varian mentions “Even fornon-normal distributions, which cannot be completely characterised by their mean and variance, theMean-Variance model may well serve as a reasonable approximation to the expected utility model”.
When λ is assumed to be zero, the decision-maker is assumed to be risk-neutral. Besides theassumption regarding the attitude towards risk of the decision maker, this assumption has also apractical advantage: the objective function becomes linear and linear optimisation programs are muchmore powerful than non linear ones.
(2) Uncertainty and learning
When considering uncertainty it is important to take into account of the possibility of learning,because this can change the nature of the problem. Learning is a continuous process, but modelling itas such leads to complicated model. The easiest way of modelling learning is to consider two stages inthe model. In the first stage there is uncertainty about the state of nature that will be realised in thesecond stage. At the start of the second stage (t*) the uncertainty is resolved and the true state ofnature becomes known.
To better approximate the continuous process of learning, more stages can be introduced, however thiscomplicates the model1.
b) Stochastic Markal
(1) Specification
The objective function of stochastic Markal is based on the Mean-Variance model. It tries both tominimise the expected cost and the risk. The weight that is given to the risk is determined by theparameter λ. For a risk neutral decision maker λ equals 0, so that the only objective is to minimise theexpected cost.
Stochastic Markal considers 2 stages:
1. in the first stage, t = 1→ t2, there is uncertainty,
2. the second stage, t = t2 +1 → T, starts when this uncertainty is resolved and when thefuture becomes known; T is the last period in the model.
At this stage, considering the size of the Belgian Markal model, λ has been set to 0 in the applicationsfor this study, i.e. risk neutrality is assumed.
1 If one thinks that the characteristic of learning being a continuous process is important for the problem, one can model this
by introducing successive shorter periods in which uncertainty disappears gradually.

8
(2) Influence of parameter values and model characteristics on the solution generated by the model
Certain characteristics of the model and assumptions that are made in the model can influence thegenerated solution and it is important to have them in mind to get a better understanding of the modeland also to get a better interpretation of the results. The points specific for stochastic Markal are
1. the year that uncertainty is resolved2. the probabilities attached to the different possible outcomes and the degree of risk
aversion3. modelling of technologies in the model
(a) The year that uncertainty is resolved
The date at which uncertainty is assumed to be resolved influences the solution. If uncertainty isresolved late, the stochastic will be closer to the deterministic strategy with the worst possibleoutcome. This is so because one of the assumptions of the model is that in the end it must be possibleto satisfy the constraints for all possible outcomes. In the limiting case that the uncertainty is solvedonly at the end of the horizon, the stochastic path matches the deterministic path for the worstoutcome.
(b) The probabilities attached to the different possible outcomes and the degree of risk aversion
It is obvious that changing these parameters will result in changes of the solution. Therefore it mightbe important to make sensitivity studies around these parameters, as there is great uncertainty attachedto them.
(c) Modelling of technologies in the model
In the Belgian Markal model the fuel switch possibilities in the industry are mainly representedthrough technologies which can consume different types of fuels. Though the total cost is correct, thefuel switching possibilities and speed are overestimated. This can be important for the results, whenusing stochastic Markal model, because fuel switching technologies are very convenient in theuncertain stage. Ideally mono-fuel and bi- or tri-fuel technologies should be modelled explicitly andthis has been partly improved with the update of the industrial database.
c) Application of Stochastic Markal for Belgium: a comparison of stochastic strategywith deterministic strategies for a Kyoto scenario
(1) Description of the Kyoto scenario
The focus in this study lies on the comparison of a stochastic strategy with the deterministic strategies.The stochastic strategy has the advantage, to define “one” strategy which takes into account thepossible constraints that can be imposed after a certain period, it allows to keep a certain flexibilitybefore the uncertainty is resolved.
We consider therefore two types of strategies for the Kyoto scenario:
1. deterministic strategies, one for each State of the World2. a stochastic strategy combining the different States of the World
The model assumptions are:
1. in all the strategies, the CO2-emissions 2 for 1990 and 1995 are fixed to the observed levels3.2. in all strategies the CO2 emissions from 2008 to 2012 must be on average 7,5% below the CO2-
emissions in 1990, this to satisfy the agreements under the Kyoto Protocol.3. four possible states of the nature are considered for the cumulative CO2 constraints to be imposed 2 In order to make the scenario congruent with reality we should not only put fixed bounds on CO2-emissions but also on
the technologies that were used in the past period. This is not yet the case in this implementation.3 The figures for 1990 and 1995 are drawn from a Markal run under the scenario business as usual.

9
4. under the stochastic strategy, it is assumed that after 2012 it will become clear which one of 4possible cumulative emission levels will have to be reached between 1990 and 2030. Therefore thefirst decision moment on which there is certainty concerning the state of nature is 2013. Thus, onepath is followed until 2012 and starting from 2013, four different paths are possible, one for eachalternative emission constraint.
5. risk neutrality is assumed in the stochastic strategy.
The four possible states of nature, the attached cumulative emission levels (to be reached in 2030), andtheir attached probabilities are presented in the table below. The same cumulative emissionconstraints are used in the deterministic strategies, Det..., Det 0%, Det –8%, Det –25%.
State of natureCumulative emission level, to be
reached in 2030
Maximum on Cum. CO2-emissions between 1988and 2032 (Million tons)
ProbabilityState ofNature
without cumulative constraint Stoch. ... 0.25Stabilisation at 1990 level Stoch. 0% 4541 0.25-8% compared with stabilisation Stoch. –8% 4178 0.25-25%compared with stabilisation Stoch. –25% 3406 0.25
(2) CO2 emissions and costs
(a) CO2 emission paths for the different scenarios
In the figure below, the CO2-emission paths of the stochastic strategy (Stoch..) and of twodeterministic strategies (Det) are presented. As we mentioned already, the CO2-emissions for 1990and 1995 were fixed. The stochastic strategy results in one path until the year 2012 (period 2010) andin four paths from the year 2013 (period 2015). The Kyoto constraints must be satisfied for all cases.
For strategy “Det -25%”, the CO2-emissions in 2010 are already lower than should be according to theKyoto-constraint. Therefore the Kyoto constraint is not binding under this strategy and does not resultin extra costs.
Figure 1: CO2 emission paths for different strategies.

10
(b) Comparison of the costs for the different scenarios
Table 1 compares the total cost for the different scenarios, with the total discounted cost under“Det...”, the “deterministic strategy without cumulative constraint”, taken as a reference. EV stands forthe Expected Value of the four stochastic cases.
Table 1: Total discounted costs and CO2 emissions under different strategies(/scenarios)
Cost (MBF) Relativ cost'Det ...' =100
Diff. in Cost with'Det ...' (MBF)
CO2 emission(Mton)
relativ CO2 em.'Det ...' =100
Stoch. ... 20745559 100,3 66362 5265 97,3
Stoch. -0% 20813974 100,7 134777 4541 83,9
Stoch. -8% 20985476 101,5 306279 4178 77,2
Stoch. -25% 22016738 106,5 1337541 3406 62,9
EV 21140437 102 461240 4348 80,3
Det ... 20679197 100 0 5411 100
Det –0% 20793734 100,6 114537 4541 83,9
Det –8% 20981696 101,5 302499 4178 77,2
Det –25% 21762620 105,2 1083423 3406 62,9
In order to shed more light on the advantages of the stochastic strategy we put together the costs thatare incurred for the stochastic and deterministic strategy for the 4 possible outcomes after 2012 inTable 2. To explain Table 2 below, we remark that the first 4 cells of the header row give the 4possible cumulative constraints, of which will be known from 2013 on which is the true one. So, forinstance, for the row indicated by “Det...” the total discounted costs are represented for thedeterministic case where one assumes until period 2010 that it is certain that there will be no limit onthe cumulative CO2 emissions. If then indeed it will be revealed after period 2010 that there will beno limit on the emissions, the cost will be “100”. However, if the limit on yearly CO2 emissions willbe on average 0%, 8% or 25% lower than the 1990 level, the cost will be respectively 100.8, 102.0 and108.7. In the last cell of this row the expected cost of the “Det...”- strategy is calculated as the sum of0.25 times the cost under each of the four possible outcomes.
Table 2: Relative total discounted costs under different possible outcomes after 2012, for allstrategies.
POSSIBLE OUTCOMES
... 0 -8% -25% E.V.
St Det... 100.0 100,8 102 108,7 102,88
ra Det 0 100,2 100,6 101,6 107,3 102,42
te Det -8% 100,3 100,7 101,5 106,8 102,34
gi Det -25% 102,3 102,4 102,6 105,3 103,17
es Stochastic 100,4 100,7 101,6 106,6 102,33

11
For the stochastic scenario, the difference between the costs under the ‘most extreme’ outcomesremains limited. The cost of “Stoch. -25%” is 6% (or 1279 * 109 BF) higher than the cost of“Stoch...”. In both cases we have the same (stochastic) strategy until 2012, but after 2012 in the firstcase a very strong cumulative constraint (-25%) has to be satisfied, whereas in the second case there isno cumulative constraint at all.
For each of the four possible cumulative CO2 restrictions that may be imposed after 2012, the totaldiscounted system cost for the stochastic strategy never exceeds the cost of the “clairvoyantdeterministic strategy with the correctly assumed outcome” with more than 1%.
If one looks at Table 2 one remarks that the total discounted system costs under the stochastic strategyare very close (+0.1%) to the best possible solutions for the “non- extreme” outcomes (“0%” and “-8%” as cumulative restriction). For the extreme outcomes they are further away from the best possiblesolution, 0.4% for outcome ‘...’ and 1.3 % for outcome “-25%’.
If the solution of the stochastic strategy is compared with “Det 0%” and “Det -8%” for the fourpossible outcomes, the differences seem to be very small. Therefore it may seem that the stochasticstrategy has little advantage over intermediate deterministic strategies and that it may not be worth theeffort to use a stochastic strategy. This is not the case. First, since we deal with huge costs, a differenceof 0.1% of the total discounted system cost remains a very large amount (i.e. 20.6 * 109 BF). Secondlyit is not always the case that the intermediate deterministic strategies are close to the stochasticstrategy.
In terms of the expected value, the stochastic strategy performs better than the deterministic strategies.This should be so, because the stochastic strategy is chosen in a way to generate the smallest possibleexpected total discounted cost.
For a certain outcome no solution can be less costly than the deterministic strategy which assumedfrom the start that this outcome was certain to take place. In Table 2 above these costs are presented inbold characters. In Table 3, we calculated the regret that can be incurred for each strategy and eachoutcome as a percentage of the total discounted system cost of “Det...” if the real outcome is “...”.
Table 3: Regret for each strategy and each outcome as % of the total discounted system costof “Det...” if the real outcome is “...”.
POSSIBLE OUTCOMES
... 0 -8% -25% E.V. diff in E.V.
St Det ... 0 0.2 0.5 3.4 102.88 0.55
ra Det 0 0.2 0 0.1 2.0 102.42 0.09
te Det -8% 0.3 0.1 0 1.5 102.34 0.01
gi Det -25% 2.3 1.8 1.1 0 103.17 0.84
es Stochastic 0.4 0.1 0.1 1.3 102.33 0
From the five strategies presented in the table above, the stochastic strategy has the smallest maximumregret that can be incurred. The maximum regret that can be incurred under the stochastic strategyappears if outcome “-25%” is the true one. The regret is then 1,3% of the total discounted system costof “Det...” if “...” is the true outcome or this is 269 * 109 BF. The minimax regret strategy itself wasnot calculated, but we can deduce that under the minimax regret strategy more effort would be taken toreduce CO2-emissions in the uncertain time-span than under the stochastic strategy. The maximumregret that can be incurred under “Det...”, “Det 0” and “Det -8%” is respectively 3.4%, 2.0%, and1.5%, and this always if outcome “-25%” appears to be the true one, so that it is a “future” regret. Themaximum regret that can occur for strategy “Det -25%” is 2.3% and this if outcome “...” would be the

12
true outcome, it is a “present” regret. From the strategies above, it is strategy “Det -25%” that has thesmallest maximum cost that can be incurred.
Further details on this study can be found in the report in annex. It clearly shows the interest of thisapproach for evaluation of policies and technologies with a great uncertainty component, however itappeared to be difficult to use for policy design.
2. Representation of secondary benefits
The second model development has been its reformulation to be able to take explicitly into account inthe analysis of GHG policy options the secondary benefits/costs coming from other pollutants, as areduction in greenhouse-gas emissions has not only an impact at global level but can also bringbenefits locally by reducing other air pollutants linked to energy consumption. By secondary benefitsone understands the saving of other external costs e.g. by the decrease in emissions of other pollutantsor the macroeconomic impact (e.g. the employment effect). With the MARKAL model it is possible toevaluate the external cost and benefits of pollutants which are linked to energy consumption, such asNOx, SO2, VOC and PM. The benefits of the reduction of local air pollutants will accrue to thecurrent generation contrary to the reduction of climate change and also mostly to the populationundertaking the mitigation actions, though the transportation of pollutants can be rather extensive.Therefore it seems important to take these benefits into account to get a more correct evaluation of thecost of GHG reduction policies. It might be also useful to induce a policy design, which fully exploitthese benefits, while obtaining the same impact on global warming.
a) Database extension and model adaptation
The local environmental problems considered are: (i) problems related to the deposition of acidifyingemissions and (ii) ambient air quality linked to acidifying emissions and ozone concentration. Weconsider the energy-related emissions of NOx, SO2, VOC and particulates, which are the main sourceof air pollution. NOx is almost exclusively generated by combustion process, whereas VOC’s are onlypartly generated by energy using activities (refineries, combustion of motor fuels); other importantsources of VOC’s are the use of solvents in the metal industry and in different chemical products.
The approach followed for the evaluation of the benefits from the reduction of local pollutants is basedon the bottom up damage function approach as developed by the ExternE project.
This approach can be illustrated by the following figure (EC, 1995).
EMISSIONS
↓
DISPERSION
↓
IMPACT
↓
DAMAGE VALUATION
(1) The database extension
The Markal database has been extended into three directions:
a) emission coefficients for pollutants such as NOx, SO2, VOC and PM,b) immission coefficients for those pollutants, i.e. coefficient for the translation of
emissions into concentration, inclusive the transportation mechanismc) impact of emissions and immissions and their monetary valuation.

13
(a) Emission coefficients
Emission coefficients of NOx, SO2, VOC and PM associated with the energy using technologies havebeen added to the Belgian Markal database. This is a rather extensive work because, contrary to CO2emissions coefficients, these coefficients are technology linked.
(b) Coefficients for the transformation and transport of emissions
This step establishes the link between a change in emissions and the resulting change in concentrationlevels of primary and secondary pollutants. The transboundary nature of pollutants leads to thenecessity to account for the transport of SO2, NOx, VOC and particulates emissions between countries.In the case of tropospheric ozone (a secondary pollutant), besides the transboundary aspect, therelation between VOC and NOx emissions, the two ozone precursors, and the level of ozoneconcentration has also to be considered.
Theoretically, the concentration/deposition of a pollutant in a country is a function of the totalantropogenic emissions before time t, some background concentration4 in every country, and otherparameters such as meteorological conditions, as derived in models of atmospheric dispersion and ofchemical reactions of pollutants. In the model a static and linear relation is used which reflect theeffect the emitted pollutants in the different countries have on the deposition/concentration of apollutant in a specific country, such as to measure the incremental deposition/concentration, comparedto a reference situation.
It would be useful to include the distinction in the source of emission, for instance between emissionsfrom mobile sources and/or low height stationary sources as opposed to high stack sources as it isexpected that the deposition of pollutants per unit emitted will be different in each case. However,there is no information available at this moment that allows making such distinction.
(c) Damage parameters and their monetary valuation
The damage parameters and their monetary valuation are taken from the ExternE project of theEuropean Commission, in which CES and VITO are responsible for its Belgian application. Thereforethe approach followed here is entirely based on the framework derived in the project, though at a muchmore aggregated level. The damage occurs when primary (e.g. SO2) or secondary (e.g. SO4
--)pollutants are deposited on a receptor (e.g. in the lungs, on a building) and ideally, one should relatethis deposition per receptor to a physical damage per receptor. In practice, dose/exposure-responsefunctions are related to (i) ambient concentration to which a receptor is submitted, (ii) wet or drydeposition on a receptor or (iii) ‘after deposition’ parameters (e.g. the PH of lake due to acid rain).Following the ‘damage or dose-response function approach’, the incremental physical damage DAMper country is given as a function of the change in deposition/concentration (acidifying components orozone concentration in the model).
The damages categories considered in the model are
1. damage to public health (acute morbidity and mortality, chronic morbidity, but no occupationalhealth effect)
2. damage to the territorial ecosystem (agriculture and forests) and to materials, this last categorybeing treated in a very aggregated way at this stage.
The impact on biodiversity, noise or water is not considered, either because there are no data availablethat could be applied in this study or because air pollution is only a minor source of damage for thatcategory.
4 Resulting from natural emissions and emissions from geographic parts that are not included in the country set .

14
(i) Damage to public health
The assessment of health impacts by ExternE is based on a selection of exposure-response functionsfrom epidemiological studies on the health effects of ambient air pollution (both for Europe and theUS). The economic valuation of the damage is based on the willingness-to-pay or willingness toaccept concept. The valuation figures used in ExternE are summarised in Table 45.
Table 4 : Valuation of mortality and morbidity impacts from ExternE (ECU 1990)
Mortality
Statistical life 2600000
Lost life year 81000
Acute Morbidity
Hospital admission for respiratory or cardiovascular symptoms 6500
Emergency room visit or hospital visit for childhood croup 185
Restricted activity days (RAD) 62
Symptoms of chronic bronchitis or cough 6
Asthma attacks or minor symptoms 31
Chronic Morbidity
Chronic bronchitis/asthma in adults 87000
Non fatal cancer/malginant neoplasm 372000
Changes in prevalence of cough/bronchitis in children 186
Putting the impact and valuation data together, an estimation of the health damage figure perincremental pollution can be computed for PM10 en PM2.5 (direct and indirect), for SO2 (direct) andozone (cf. Table 3).
Table 5: Damage from an increase in air pollution (106 ECU95 per 1000 persons)
From an increase of one µg/m3 of PM10 and nitrite concentration 0.010058
From an increase of one µg/m3 of sulphite concentration 0.016352
From an increase of one µg/m3 of PM 2.5 concentration and Diesel particulates 0.017237From an increase of one µg/m3 of SO2 concentration 0.000540
From increase of one ppb of ozone concentration 0.001593
(ii) Impacts on territorial ecosystems and materials
Because of the great uncertainty around dose response functions and the valuation of the damages onthe ecosystem and materials, it was impossible to derive a damage impact coefficient with a valuationterm associated to it for each category of damage. Moreover first results from ExternE showed thatthey were relatively less important than public health impact: in the first ExternE evaluation theyrepresented approximately 25% of total damage from particulates (direct and indirect). Therefore MikeHolland (ExternE, ETSU) computed an average damage cost per person from the ExternE detailedcomputations to be used as an indicative value which has been implemented.
5 The latest ExternE figures (1997) are expressed in ECU 1995. They were transformed in ECU 1990 assuming a price
increase of 20.8% between 1990 and 1995.

15
Table 6: Damage from an increase in air pollution (106 ECU per 1000 persons)
From an increase of one µg/m3 of sulphite concentration 0.0028From an increase of one µg/m3 of nitrite concentration 0.0018
(d) Damage from emissions in Belgium
Combining the figures for the transportation and transformation of pollutants and the figures for thedamages, one can compute a figure representing the damage per unit of emission of a primarypollutant. The distinction can be made between the damage within the country and the damage acrossthe border, generated by the emission of a pollutant in one country, though at the country aggregationlevel it remains approximate, because the geographic location of the source can be important. Theestimations for Belgium are given in the table below.
Table 7: Damage from emissions in Belgium (106 BF90 per kton emission of pollutant)
Damage in Belgium Total damage (inBelgium and abroad)
Nox 18.4 194.4SO2 54.5 183.3VOC 0.6 9.9PM 190.8 609.2PM transp (PM2.5) 315.4 1006.8
It is clear that measuring environmental costs at the global level as in this model, raises differentproblems, which are extensively discussed in ExternE: transferability of the results from specificstudies, time and space limits, uncertainty, the choice of the discounting factor, the use of averageestimates instead of marginal estimates and aggregation. However, despite all these uncertainties, it ispossible, according to ExternE, to give an informative quantified assessment of the environmentalcosts.
b) Model Adaptations
The objective was to adapt MARKAL to be able to take into account in the analysis of policy optionsthe benefits/costs coming from local pollutants. Two approaches are modelled:
1. the environmental damage are computed ex-post, without feedback into the optimisation process2. the environmental damages are part of the objective function and therefore taken into account in
the optimisation process.
In the first approach this function is used to compute ex-post the damage associated with the modelsolution. In the second approach, a term is added to the objective function, which contains the sum ofthe damage-functions per pollutant. As the computation are based on dose response functions whichgive the incremental damage from air pollution, the results should also be interpreted in these terms,i.e. in terms of the change in total damage compared to a reference year.
c) Illustration with Policy Scenarios
(1) Definition of the policy scenarios
Three policy scenarios are considered, one focusing on local air pollution, a second one on GHGemission reductions and a third combining both types of policies. They are compared to a referencescenario in which no environmental policy is imposed.

16
For the local air pollution policy (LAP scenario), we impose an environmental tax on SO2, NOx, VOCand particulates emissions. The level of the tax is put equal to the total damage (in Belgium andabroad) generated by the pollutant emitted in Belgium, as given in Table 7. In a further stage, it mightbe interesting to relate this scenario to the different agreement Belgium has signed on local airpollutant. A more geographically disaggregated model, both at the level of the generation of emissionsand at the level of the transformation and transportation of emissions6, would clearly enhance theanalysis because the damages from air pollution are ‘location’ dependent.
For the global warming policy (GW scenario), the EU Kyoto target, translated into a target forBelgium through the burden sharing agreement within the EU, is imposed on the greenhouse gasemissions in Belgium in 2010. This target consists in reducing the emissions of greenhouse gasses in2008-2012 by 7.5% compared to the level of 1990. For after 2010, we have assumed that the GHGemissions must continue to decrease at the same rate: in 2030, they must be 15% below their 1990level. We also assume that this target has to be met in Belgium and that no tradable permits or otherflexible mechanisms can be used to achieve the required reduction in Belgium. The links between thereduction of certain pollutants and global warming, e.g. the cooling effect of sulphur emissions, shouldbe taken into account in this type of analysis, but this not done yet.
The third scenario, addressing both local pollution and global warming (LAPGW scenario), is acombination of the two scenarios. The focus of the comparison of scenarios lies, at this stage, on themutual impact of the policies and not on the definition of optimal environmental policies or the choiceof policy instruments.
(2) The scenarios comparison
The comparison between scenarios focuses, at this stage, on the cost differences and not on thetechnological options to reach the environmental targets neither on the distribution of the cost betweensectors. The main results are given in Table 8 (for the entire horizon) and in Table 9 (per period).
Table 8: Welfare and Damages over the entire horizon (1990-2030)(differences with reference scenario)
LAP GW LAPGWDiscounted welfare, excluding environmental damage(106BF) -41 869 -183 859 -203 623
Discounted local environmental damage (106BF) -90 978 -60 596 -118 962
GHG emissions (Mton) -487 -1 759 -1 761
Imposing a tax on local pollutants equal to the damage generated by these pollutant, reduces both localair pollution and GHG emissions. This reduction occurs through investment in abatement technologiesand a decrease of the demand of energy services because of the increase in price. Investment inabatement technologies has an impact on the local pollutant, whereas the decrease in demand reducesboth the local pollution and the GHG emissions. The abatement investment and the decrease in energyservices demand reduce the welfare, but the total welfare change (including the environmentalbenefits) remains positive.
The cost of addressing local air pollution remains limited especially considering the reduction indamage such a policy induces. Those results are clearly dependant on the damage figures used and theabatement possibilities modelled in Markal. Moreover how specific policies regarding the localpollutants are modelled in the reference scenario is also important; for instance the progressiveintroduction of more stringent standards for cars and trucks in Europe which are partly taken intoaccount in our database reduces the potential environmental benefits.
6 in this exercise the country is taken as ‘one’ grid.

17
When imposing a GHG constraint, the GHG emission are reduced up to the target but the localpollutants are also reduced. GHG reduction are obtained through energy efficiency improvement andthrough a decrease of the demand for energy services. However in this scenario no incentive is givento take into account the damage from local pollutant in the decision process.
When combining the local pollution scenario and the global warming, the interactions betweenpollutant is taken into account. The tax on local pollution creates an incentive for integrating thedamage from these pollutant in the decision for GHG emissions 7. For a same level of GHG emissions,the damage from local pollution is much lower than in the GW scenario and still further decreasedcompared to the LAP scenario. The cost in non environmental welfare is higher than in the GWscenario but lower than the sum of the cost in LAP and GW, but the total cost (non environmental andenvironmental) is lower.
When looking at the results per period (Table 9), the same conclusions can be drawn. However thegain in terms of cost decreases when higher GHG emission target are imposed because the gains fromlocal pollution abatement are becoming marginal compared to the GHG abatement cost.
Table 9: Welfare and Damages per period(undiscounted, differences with reference scenario)
2010 2020 2030Welfare, excluding environmental damage(106BF)
LAP -10 922 -16 829 -15 119GW -30 260 -112 468 -326 795
LAPGW -35 780 -115 905 -329 237Local environmental damage (106BF)
LAP -24 592 -30 177 -26 264GW -12 752 -32 764 -54 678
LAPGW -31 979 -46 704 -55 062GHG emissions (Mton)
LAP -8.94 -25.76 -14.55GW -27.32 -63.77 -104.1
LAPGW -27.32 -63.77 -104.1
This is also observed in the marginal cost of GHG reduction, the shadow price of the GHG constraint(Table 10).
Table 10: Marginal cost of GHG reduction (BF/ton)
2010 2020 2030GW -2160 -3888 -12624
LAPGW -1423 -3290 -12666
(3) Conclusion
This exercise has shown the importance of examining jointly interrelated environmental problems forpolicy design. A policy to reduce GHG will simultaneously reduce local pollution and thus thebenefits from the reduction of local pollutants should be included for a correct evaluation of the cost ofthe GHG policy. A policy aiming at reducing local pollution reduces also the GHG emissions andmight therefore reduce the cost of reaching a GHG reduction target. Our results have shown thatcombining both policies would allow to get the same overall benefits at a lower cost. This is only a
7 When a constraint is binding, the shadow price of the constraint is equivalent to a GHG tax. If a constraint is not binding,
there is no incentive to take the damage from the remaining pollutant into account when deciding on other pollutant.

18
first step in the analysis and our research will continue in two directions. The definition of the local airpollution policy should be related to the different agreements Belgium has signed for this type ofpollution. The choice of policy instrument is a crucial element for a full exploitation of the interactionsbetween pollutants and need to be further examined.
C. Contribution to the GHG policy of Belgium through policy studies
Analysis of greenhouse policies is one of the main goals of this project. The focus has been on theidentification of the options to reach the Kyoto target for GHG emissions, both in terms oftechnological choices and in terms of policy instruments and this for the Federal Ministry of theEnvironment, the Ministry of Economic Affairs and the Ministry of Energy. Moreover theimplications for investment in the electricity sector of policies regarding climate change and nuclearhave also been investigated.
The different studies have been elaborated during the last two years of the project. Because of thecontinuous improvement of the database and the changing international environment, their results arenot strictly comparable, however the broad messages remain the same. We will synthesise the mainconclusions hereafter, for the full analysis it is necessary to consult the reports in annex. The policystudies were either undertaken jointly by the partners either done individually, however in both casesthis activity benefits from the development by all partners. As a starting point to all studies lies theconstruction of a reference scenario, which elaborates the long term perspectives (30 to 40 years). Ithas to be consistent with other medium term forecasts (Planning Office, EC). It gives a path for thedemand of energy and of the GHG emissions in Belgium until 2030, given assumptions regardingenergy prices and economic growth.
1. The reference scenario
The procedure followed in the construction of the reference scenario is illustrated in
Figure 2.

19
P R O C E D U R E
input
I n t e r n a t i o n a l E n e r g y P r i z e s O t h e r E x o g e n o u s A s s u m p t i o n s- O v e r a l l T e c h n o l o g i c a l P r o g r e s s- O v e r a l l G r o w t h E x p e c t a t i o n s
G E M - E 3 p r o d u c e s b a s e l i n e l e v e l s o fe c o n o m i c a c t i v i t y
L E V E L S O F E N E R G Y S E R V I C E S R E Q U I R E DI N R E F E R E N C E S C E N A R I O
M A R K A L E X O G E N O U S A S S U M P T I O N S O NT E C H N O L O G I C A L D E V E L O P M E N T
A N D C O S T O F A L T E R N A T I V E
E n e r g y u s e a n d E m i s s i o n s
O u t p u t G E M - E 3
i n p u t M A R K A L
output
Figure 2: Construction of the reference scenario
It consists of the following steps:
Step 1: Build a scenario for exogenous economic factors
The main exogenous factors are the international energy prices and the overall growth level ofeconomic activity. International energy prices have been derived from simulations with the POLESmodel8 that represents the world energy scene, based on the 1999 study for the EU DG Research9. Anaverage GDP growth of 2.5% is assumed till 2005, 2.1% between 2005-2020 and thereafter 1.6% forthe OECD countries. The oil prices are increasing till 2010 given an assumption of relatively low oilreserves and the assumption on economic growth. Oil and gas prices are evolving in parallel.
Table 11: Growth and Energy Prices Assumptions (annual average growth rate)
2000/2005 2005/2010 2010/2020 2020/2030
OECD GDP 2.5% 2.4% 2.0% 1.6%
Oil ($90/bl) 2.6% 2.5% 2.5% 1.8%
Gas ($90/boe)
European market 4.2% 4.2% 3.6% 2.4%
Coal 0% 0.3% 0.2% 0.2%
8 Poles is a model, developed for DG Research under the Joule research program, that represents the world energy demand
and supply.9
Energy Technology Dynamics and Advanced Energy System Modelling, Final Technical Report, July 1999, Chapter 5:World Energy Projections to 2030, P. Criqui (IEPE) and N. Kouvaritakis (ECOSIM)

20
Step 2: Build a scenario for EU and Belgium economic activity
Here the GEM-E3 model10, a general equilibrium model for the 15 EU countries, is used to construct ascenario that is consistent with the exogenous energy price and growth assumptions of step 1. Theresulting medium term economic growth for Belgium is calibrated to make sure it is in the line withthe Belgium Planning Office forecasts. This gives a trend of economic activity by sector and a trend indisposable income that has a macro-economic consistency. These trends in economic activity and inincome are then translated into trends for the demand for energy services (tons of steel, km driven,etc..), which determines the shift of the demand curves for these services in MARKAL over thehorizon considered.
The sectoral activity levels and the growth in housing stock and private income (reflected in privateconsumption evolution) are the main determinants for the evolution in the demand for energy servicesin our reference scenario. Table 12 summarises the main assumptions.
Table 12: Macroeconomic background and sectoral evolution for Belgium (average annual growthrate)
1999/2005 2005/2010 2010/2030
Macroeconomic backgroundGDP growth 2.2 2.1 1.8Private consumption 2.3 2.2 2.2Housing stock 0.6 0.5 0.3
Sectoral productionAgriculture 1.8 1.9 1.7Iron & Steel 0.5 0.7 0.4Chemical sector 0.9 1.0 0.7Building materials 0.7 0.7 0.4Non energy intensive sectors 1.6 1.7 1.4Commercial and service sector 1.5 1.9 1.8
Moreover, the policy measures regarding energy and GHG emissions taken between 1990 and 2000are included in the reference scenario:
• a mandatory K55 insulation level for all new residential buildings from 1995 onwards.• increases in excise duties on fuels in the residential, service, industrial and transport sectors• the decided investments in new power plants (STAG) for 1990-2000.• promotion of electricity saving technologies (more efficient light bulbs and electric motors,
condensing boilers).• nuclear moratorium: no new nuclear power stations before 2010 (as it takes at least 10years to
build a new one). Investment in nuclear are possible after 2010.• a subsidy of 2 BEF/kWh for wind energy, from 2000/2005 to 2030.
Step 3: Build a detailed scenario for energy use and energy production in Belgium
In this step, given the demand for energy services computed with the trends from step 2 and the baseyear (1990) demand, MARKAL simulates the choice of energy efficiency by energy users, their fuelchoice, as well as the choice of energy production processes by the energy sector. The final result ofthis step is primary energy use and GHG emissions. In this step one uses information on the presentand future availability of energy technologies, their costs and performance at the level of the energyuser and at the level of the energy producer.
10 The GEM-E3 model is a general equilibrium macroeconomic model for the 15 countries of the EU, developed for DG
Research under the Joule research program.

21
The demand functions for energy services play an important role in the construction of policyscenarios. Every policy scenario that affects the energy sector will alter the marginal cost of energyservices and this will affect the level of demand for energy services. The demand function for energyservices is a short cut to represent all substitution and behavioural reactions outside the energy use andproduction sector.
The final energy demand increases with 1.1% till 2010 and with 0.9% thereafter. The growth is highestin the transport sector. The electricity demand increases more than the fuel demand and there is a shiftto heat produced in cogeneration plants from 2000 on. In terms of primary energy, the average growthis 0.8%. There is a shift from solids to gas till 2010, principally due to the replacement of coal powerplants with gas power plants. This tendency is reversed afterwards when coal powerplants replace thenuclear power plants. Oil products keep a relatively high share because they remain the dominant fuelin the transport sector. Renewable energy do not break through given the energy price assumptions
This induces an increase in the GHG emissions linked to energy. They are in 2010 16% above thelevel of 1990 and continue to increase thereafter, especially after 2025 if coal power plants shouldreplace the nuclear power plants. Belgium would therefore have to reduce its GHG emissions with20% in 2010 compared to the baseline to reach its Kyoto target.
2. The policy scenarios
a) The Kyoto targetThe objective of the study for the Federal Ministry of the environment was to evaluate measures andpolicy instruments to reduce the greenhouse gas (GHG) emissions in Belgium to the level agreed uponin the Kyoto protocol (-7.5% compared to the 1990 level). The policy evaluation had to take intoaccount three constraints: the reduction target should be reached by measures that can be taken bypolicy makers in Belgium, the reduction of GHG should continue after 2010 at the same rate as theone decided for 1990-2010, no new nuclear power investments are allowed in the period 1990-2030.
Given the baseline assumptions (as described in the previous section), Belgium has to reduce its GHGemissions in 2010 by 20% compared to the reference level to reach the Belgian Kyoto target. Thepolicy measures already taken or planned since 1990 to reduce the GHG emissions, will onlycontribute to a reduction of 1.8% in 2010.
Using a GHG emission tax as policy instrument, which is the least cost instrument for meeting anemission target, the cost per ton of GHG reduced reaches 1830BF in 2010 and increases sharply in2030. This sharp increase is due to the investment in coal power plants at the end of the horizon in thereference scenario and the ban on new nuclear capacity. The total discounted cost of reaching thetarget for 2010 and 2030, in terms of loss in consumer/producer surplus, is approximately 4% of the1990 GDP. The macroeconomic impact of the Kyoto target in 2010 remains very small.
In 2010 the greatest reductions are in the energy sector, -41%, followed by the industrial sector, -25.9% and the residential and service sector, -18.3%; the reduction in the transport sector remainsmore limited, -2.6%. The Kyoto target is reached through a least-cost mix of energy servicesreductions, changes in technologies and fuel switching that are triggered by the GHG emission tax.The demand for energy services is reduced by 8.5% in the industry and the residential & servicesector, but only by 2.9% in the transport sector. There is a switch away from solid fuels and oilproducts towards natural gas and, in a more limited way, towards renewables. More efficient andenergy saving technologies are used in the different sectors. Cogeneration is penetrating further in theindustry and in the residential & service sector.
Using alternative instruments such as an energy tax or standards increases the cost of reaching theKyoto target. An energy tax leaves out one option for emission reduction, as it does not give anincentive towards fuel switching. The loss in welfare is increased with 4.2% over the entire horizon

22
1990-2030 compared to the GHG tax. The use of standards will approximately double the loss inwelfare: the reduction in the level of energy services is smaller, because the remaining emissions arenot taxed and therefore stronger efficiency standards have to be imposed to reach the reduction target.
If the nuclear option is available, the total loss is reduced with 23%. The impact is rather limited until2010 but becomes significant from 2025 onwards when the existing nuclear power plants are scrapped.The reduction effort is shifted towards the energy sector, allowing the other sectors to reduce theiremissions far less.
This study was partly revised at the end of the project for the Federal Minister of Energy andSustainable Development. The figures have slightly changed but the main conclusions remain thesame. A full description can be find in the annexed report.
b) Excise tax policies
Two specific policies were evaluated with Markal for the Federal Minister of Energy and SustainableDevelopment: the harmonisation of excise taxes in the EU and the increase of Belgian excise taxes tothe levels in the neighbouring countries. These policies contribute to a reduction of the CO2 emissionsin Belgium, but are not sufficient to reach the Kyoto target, as can be seen in Table 13. Moreover theresults show that the use of such policy instruments (an energy tax) increases the cost of the CO2reduction compared to a CO2 tax, as observed in the previous study.
Table 13: GHG emissions changes in the excise tax & Kyoto target scenarios versus reference scenario
2000 2005 2010 2020 2030
Excise neighbours GHG (CO2 eq.) -1% -4% -5% -8% -7%Harmonisation GHG (CO2 eq.) 0% -2% -2% -11% -6%Kyoto GHG (CO2 eq.) -1% -2% -16% -35% -48%
c) CO2 reduction potential of measures
For the Federal Ministry of Economic Affairs an estimation of the CO2 emission reduction potentialfor a number of exogenous defined measures has been made by VITO. The type of measures issummarised in the following table. The simulation period is 2000-2030. In this study, the Markalmodel has been used to evaluate the reduction potential, without any cost consideration.
Table 14: Different types of measures with their cumulative CO2 emission reductionpotential.
Description of the measure CumulativeCO2 reduction(Mton)
1000 MW additional nuclear power plant 85New coal fired plant replaced by STEG 142.5
Centralisedelectricityproduction Limiting coal fired plant at 1200 MW 62.4
CHP as foreseen in the national equipment plan of the electricity sector 57CHP – additional 1200 MW in period 1995-2005 117.5Reduced delivery price gas for CHP modest reduction 270
CHP
Reduced delivery price gas for CHP high reduction 211Additional wind energy 10.535.000 ha biomass 4.5
Renewable
70.000 ha biomass 27

23
EU proposal harmonising taxes 122Higher tax levels 355Tax on low voltage electricity consumption (1Bef/Kwh) 55.5
Taxes
Tax on low voltage (1 Bef/Kwh) and high voltage (0.1 Bef/Kwh) 207.5Increased road taxation 29.5Increased tax on motor fuels (petrol & diesel) 160Efficiency improvement cars (ACEA) 122.5
TransportSector
Hybrid traction 76.5Efficiency improvement industry 27.3OtherImprovement electrical appliances 27.5Combined action 363
d) Study for the Ampere Commission
This study focuses on the electricity sector and evaluates the choice of technologies in this sector forthe period 2005/2010, under different constraints, i.e. the Kyoto target and the nuclear option. In allpolicy scenarios it is assumed, that the external costs of air pollution are internalised in all sectors from2005 onwards, with the exception of the cost of GHG emissions (which is taken care of by a globalemission limit)11.
(1) The policy scenarios
The alternative policies considered are:
Nuclear power plants: after 2010, either the moratorium is extended towards 2030, or new nuclearpower plants can be built with however a maximum of 8000MW on existing sites. In the referencescenario, there are no new investment in nuclear, based on cost comparison.
GHG emission constraints: either no GHG emission reductions are imposed over the entire horizon,or the Kyoto target is imposed in 2010 (7.5% reduction compared to the 1990 level, but corrected forthe high temperature in 1990 this gives a reduction of 11%) and the same proportional reduction isimposed between 2010 and 2030 (15% compared to 1990, or when corrected for temperature 21%).
The scenarios considered are therefore:
1. New nuclear capacity, no GHG constraint2. No new nuclear capacity, no GHG constraint3. No new nuclear capacity, Kyoto GHG constraint4. New nuclear capacity, Kyoto GHG constraint
(2) Results
The results of the different scenarios are summarised in Table 15. It gives the electricity demand andproduction by technology (in TWh) and the cost in terms of welfare for each scenario compared to thereference scenario (in % of the GDP in 2000).
The welfare cost, as considered in Markal, covers the cost for the whole energy system of themeasures imposed, i.e. the increased cost of satisfying the energy needs (investment cost, operatingcost, fuel cost,…), the loss in utility for the consumers due to the decrease in consumption of energyservices minus the saved external costs (other than climate change related damages). Whenconsidering the welfare cost figures, one must keep in mind that the MARKAL model is a simplifiedrepresentation of the energy system, where consumers and producers have an 'optimal' behaviour and
11 This assumption is made here to be consistent with the assumptions in the result of the Ampere Commission, but is not
made in the other studies regarding GHG emissions.

24
where there is perfect coordination between demand and supply on the basis of social marginal costs.Additional policy actions might be needed to realise this 'optimal' set-up.
The welfare cost can be negative because in the reference scenario, external costs (other than GHG)are by assumption not internalised. The welfare gain in internalisation of non GHG related externalcosts increases from some 0.3 to 0.4% of GDP in 2010 to some 0.4 to 0.7% of GDP in 2030.
In interpreting Table 15, one should also be aware that a Kyoto constraint is imposed on the Belgianenergy system and not only on the electricity sector. When it is relatively cheaper to reduce emissionsin the electricity sector than in other sectors, the electricity sector will reduce its emissions more.
Table 15: Electricity demand and production by technologies (in TWh) and total cost of thescenarios compared to the reference (in % of GDP 2000)
In 2010 In 2020 In 2030No Kyoto constraintNew nuclear12
Demand ELEC: 84 TWhNuclear 43 TWhCoal: 4 TWhGas: 19 TWhCogeneration: 17 TWhRenewables: 1 TWhCost: -0.1% of GDP 2000
Demand ELEC: 99 TWhNuclear 60 TWhCoal: 9 TWhGas: 10 TWhCogeneration: 19 TWhRenewables: 1 TWhCost: -0.7% of GDP 2000
Demand ELEC: 113 TWhNuclear 60 TWhCoal: 33 TWhGas: 1 TWhCogeneration: 19 TWhRenewables: 1 TWhCost: -0.5% of GDP 2000
No Kyoto constraintNo new nuclear
Demand ELEC: 84 TWhNuclear 43 TWhCoal: 4 TWhGas: 20 TWhCogeneration: 17 TWhRenewables: 1 TWhCost: -0.1% of GDP 2000
Demand ELEC: 88 TWhNuclear 30 TWhCoal: 16 TWhGas: 23 TWhCogeneration: 19 TWhRenewables: 1 TWhCost: -0.8% of GDP 2000
Demand ELEC: 106 TWhNuclear 4 TWhCoal: 74 TWhGas: 9 TWhCogeneration: 19 TWhRenewables: 1 TWhCost: -0.7% of GDP 2000
Kyoto constraintNo new nuclear
Demand ELEC: 81 TWhNuclear 43 TWhCoal: 4 TWhGas: 17 TWhCogeneration: 17 TWhRenewables: 1 TWhCost: -0.2% of GDP 2000
Demand ELEC: 86 TWhNuclear 30 TWhCoal: 4 TWhGas: 27 TWhCogeneration: 20 TWhRenewables: 5 TWhCost: 0.1% of GDP 2000
Demand ELEC: 98 TWhNuclear 4 TWhCoal: 4 TWhGas: 62 TWhCogeneration: 22 TWhRenewables: 5 TWhCost: 2.7% of GDP 2000
Kyoto constraintNew nuclear
Demand ELEC: 82 TWhNuclear 43 TWhCoal: 4 TWhGas: 17 TWhCogeneration: 17 TWhRenewables: 1 TWhCost: -0.2% of GDP 2000
Demand ELEC: 95 TWhNuclear 60 TWhCoal: 4 TWhGas: 12 TWhCogeneration: 18 TWhRenewables: 1 TWhCost: -0.3% of GDP 2000
Demand ELEC: 100 TWhNuclear 60 TWhCoal: 4 TWhGas: 11 TWhCogeneration: 21 TWhRenewables: 5 TWhCost: 0.6% of GDP 2000
The following conclusions can be drawn from the results:
− Until 2010 the production capacities are relatively fixed; imposing the Kyoto constraint implies aneffort to reduce electricity demand by around 3 TWh and the cost of meeting the Kyoto targetremains limited (comparing the scenarios with and without Kyoto gives cost differences of lessthan 0.1% of GDP)
12 This scenario differs from the reference scenario only because of the internalisation of the external cost in all sectors
(except GHG external cost)

25
− After 2010, the results are different depending on the policy constraints considered:
− the GHG-emission constraint imposes the largest reduction in electricity demand,86TWh in 2020 and 98TWh in 2030 compared to respectively 99TWh and 113TWhwhen no constraints are imposed.
− the cost of the GHG emission constraint increases sharply after 2010, reaching in2030 some 3.4% (= 2.7% - (-0.7%)) of the GDP of 2000 when the nuclear option isnot allowed and 1.1% (=0.6% -(0.5%)) when it is allowed.
− When no GHG-emission constraint is imposed, the welfare cost of the ban on newnuclear is small and consists mainly in higher (non GHG) external costs that areassociated to the more intensive use of fossil fuels (mainly coal)
− with the GHG constraint and without the nuclear option, mainly gas power plants areinstalled; without the Kyoto constraint either nuclear power plants are installed, andwhen this is not available, a sequence of gas power plants followed by coal powerplants is used
− the contribution of cogeneration and renewables to reach the Kyoto target remainsvery limited. Renewables are only interesting in the long run and when a GHGconstraint is imposed.
(a) Caveats
Some important aspects are not considered in our analysis:
- the opening of the electricity market and the impact it can have on the production and theinvestment in the electricity sector is not studied - in fact one has implicitly assumed that thetransmission constraints are such that intensive trade is not possible – if intensive trade becomespossible one could envision scenarios where part of base load production is located in less denselypopulated areas (North of France ..) and more renewables are installed abroad
− the possibility of reaching the Kyoto target through international actions (tradeable permits, jointimplementation) is not considered explicitly – the possibility of international trade would mitigatethe cost differences between scenarios
− only one scenario of fossil fuel prices has been used; one could study the robustness of theconclusions when lower or higher fuel prices are considered or one could use stochasticprogramming techniques
− the Markal model is an energy sector model and is not appropriate to study the contribution ofdecentralised power to the overall reliability of the power supply, a model specific for theelectricity sector would be more appropriate.
D. Participation in ETSAP network
This activity concerns on the one hand the participation to the ETSAP workshops, the presentation ofthe Belgian research results and the integration of the results for Belgium in common studies withinETSAP. On the other hand it concerns the continuous development of the Markal model. Thisparticipation is very important at this stage, as the ETSAP participants, including CES-KULeuven andVITO, are currently engaged in the development of a new Markal model, TIMES. The general modelspecification is still using the Markal paradigm (perfect foresight optimisation), but allows moreflexibility and a further development of the model. It includes also an update of the database software.

26
IV. ASSESSMENT AND PERSPECTIVES
A. Assessment
The project involves two partners, the Centre for Economic Studies, KULeuven and the FlemischInstitute for technological research VITO. Each partner was responsible for some specific tasks (CESfor the model development and VITO for the database management), though both partners contributedto all tasks when necessary. Regarding the case studies, some were done jointly by the partnerswhereas others were done under the responsibility of one partner. The cooperation between partners,though informal, has always been very fluent, contributing as such to the success of the project.
The principal goal of the MARKAL research consortium was to maintain the Markal expertise inBelgium and to make it available for policy studies. This goal has been achieved in the sense thatMarkal has been used as the principal policy tool in the study of greenhouse gas policies in Belgiumand is the reference for energy policy studies.
The second goal has been to improve the Markal modelling tool itself. This goal has been achievedtoo. The stochastic model is probably the most complex but it proved to be relatively difficult to usefor policy studies. The extension to Markal-Micro/ED (inclusion of demand function) was verysuccessful and proved to be an important addition to the Markal model. The same holds for theinclusion of the secondary benefits in the objective function. Both are now included in the standardMARKAL model distributed to ETSAP members.
In order to achieve this goal it proved important to function in the international ETSAP consortiumand to have a sufficiently stable research staff. Long term research contracts proved to be important inthis respect.
B. Project perspectives
Both CES and VITO are considering the possibility to develop further the model to improve itscapacity to evaluate climate change and energy policies. One is certainly the continuation of thecontribution to the development of TIMES, the new Markal model. Further the model has to beextended to include the GHG emissions not linked to energy to allow for a consistent policy evaluationcovering the GHG emissions from all sources. Because of the importance of international negotiationsin climate change policy, there is a need to develop the international dimension of the model, e.g. toevaluate the possible contribution of the Kyoto flexibility mechanism to a national climate changepolicy.

27
LIST OF ANNEXED REPORTS
The MARKAL Database
CES-KULeuven and VITO, 2001, 'The Belgian Markal Database'
The Stochastic Modelling
J. Aertsens, S. Proost and D. Van Regemorter, 1999, 'Optimal Investment Strategy underuncertainty in the Belgian Energy System'
Secondary Benefits
Gary Goldstein (IRG), Ken Noble (ABARE), Denise Van Regemorter (CES KULeuven),2001, 'Adaptation to Markal for including environmental damages'
S. Proost and D. Van Regemorter, 2000, 'Interaction between local air pollution and globalwarming policy and its policy implications'
Greenhousegas policy studies
Study for the Federal Ministry of Economic Affairs
VITO / Institut Wallon, 1999, 'Evaluatie van het potentieel van CO2-emissiebeperkingdoor middel van supplementaire maatregelen'
Study for the Ministry of the Environment
J. Duerinck, S. Proost and D. Van Regemorter, 1999, 'Prospective Study of theEmissions in Belgium until 2008/2012 of the Greenhouse Gasses included in theKyoto Protocol, Cost and Potential of Measures and Policy Instruments to ReduceGHG Emissions'
Study for the Secretary of State for Energy and Sustainable Development
A. Henry, S. Proost and D. Van Regemorter, 2000, 'Evaluation of Policy Scenariosfor reaching the Kyoto target in 2010'
Study for the AMPERE Commission
S. Proost and D. Van Regemorter, 2000, 'What do the Ampere Results imply forFuture Electricity Production in Belgium – an analysis with MARKAL model',
Stef Proost and Denise Van Regemorter, 2000, 'How to achieve the Kyoto Target in Belgium,modelling methodology and some results', CES-ETE Discussion Paper n°2000-09