Maritime Situation Awareness through Data Analytics ...
8
1 Maritime Situation Awareness through Data Analytics, Machine Learning and Risk Assessment Based on Ship Trajectories Felix Opitz, Camilla Mohrdieck, Kaeye Dästner Airbus Defence and Space GmbH, Wörthstr.85, 89077 Ulm, GERMANY ABSTRACT Modern surveillance networks are able to provide trajectories of many different types of vessels and aircraft worldwide. For example, the (Satellite-) Automatic Identification System (AIS) and Automatic Dependent Surveillance – Broadcast (ADS-B) are widely used in maritime and air surveillance. Both are cooperative technologies. Sensor networks based on ground installations or mounted on airborne and space-based platforms deliver object trajectories independent of any cooperation. These surveillance systems enable the extraction of mid- and long-term trajectories of objects. To generate situation awareness, the trajectories need to be placed into the right context and the intentions of the tracked objects need to be estimated. Activity-based intelligence and the determination of patterns of life support this goal. They are increasingly important components of modern surveillance systems, because they allow taking full advantage of large volumes of gathered data. Promising technologies that are at the basis of these efforts are Data Analytics and Machine Learning. In this paper, we present both methods in the context of use cases that address i) clustering techniques to identify areas of interest and patterns of life, ii) supervised machine learning for ship type and activity classification, and iii) the generation of thematic heat maps to enhance situational awareness and assist routing and mission planning. Furthermore, these new data analytic techniques have to be integrated in existing near real time surveillance systems. In our presentation, we therefore also briefly address examples of new system architectures as well as a new software tools that are adapted to achieve this. Keywords: maritime situation awareness, modern surveillance systems, data analytics, machine learning, patterns of life, thematic heat maps 1. INTRODUCTION 1.1 Sources of Trajectories An object trajectory is a sequence of chronologically ordered positions of the object that are collected by cooperative or uncooperative sources. Cooperative sources include, the Automatic Identification System (AIS) which is an automatic collision avoidance and tracking system used by ships and by vessel traffic services (VTS) as well as coastal authorities [1], [2]. The necessity to carry AIS equipment onboard a ship, depends on the ship’s size and mission. Vessels fitted with AIS transceivers can be tracked by AIS base stations located along coast lines or by satellite based AIS receivers (S- AIS). AIS equipped ships have an assigned mobile service identity (MMSI) that allows their unique identification. The position information is based on GPS receivers complemented by additional electronic navigation sensors, such as a gyrocompass or rate of turn indicator. Analogously, aircraft equipped with Automatic Dependent Surveillance-Broadcast (ADS-B) transceivers can be tracked by associating the aircraft’s unique ICAO number with its reported positions. However, both trajectory sources depend on the object’s willingness to be cooperative. If this is not given, or if the object does not fall under the carriage requirements (e.g. small ships), then the transmitted data might be incomplete, or completely missing or spoofed. In these situations, non-cooperative trajectory sources need to be used in order to complement or even generate an object track. Examples of uncooperative sources include costal surveillance radars, Ground Moving Target Indicating (GMTI) radar and image sequences from airborne and space borne imaging sensors (e.g. optical/ infrared cameras, synthetic aperture radar (SAR)). Partitioning all measured object positions resulting from heterogeneous sources into trajectories requires dedicated tracking systems [3], [4], [5].
Transcript of Maritime Situation Awareness through Data Analytics ...
1
Maritime Situation Awareness through Data Analytics, Machine Learning and Risk Assessment Based on Ship Trajectories
Felix Opitz, Camilla Mohrdieck, Kaeye Dästner Airbus Defence and Space GmbH, Wörthstr.85, 89077 Ulm, GERMANY
ABSTRACT
Modern surveillance networks are able to provide trajectories of many different types of vessels and aircraft worldwide. For example, the (Satellite-) Automatic Identification System (AIS) and Automatic Dependent Surveillance – Broadcast (ADS-B) are widely used in maritime and air surveillance. Both are cooperative technologies. Sensor networks based on ground installations or mounted on airborne and space-based platforms deliver object trajectories independent of any cooperation. These surveillance systems enable the extraction of mid- and long-term trajectories of objects. To generate situation awareness, the trajectories need to be placed into the right context and the intentions of the tracked objects need to be estimated. Activity-based intelligence and the determination of patterns of life support this goal. They are increasingly important components of modern surveillance systems, because they allow taking full advantage of large volumes of gathered data. Promising technologies that are at the basis of these efforts are Data Analytics and Machine Learning. In this paper, we present both methods in the context of use cases that address i) clustering techniques to identify areas of interest and patterns of life, ii) supervised machine learning for ship type and activity classification, and iii) the generation of thematic heat maps to enhance situational awareness and assist routing and mission planning. Furthermore, these new data analytic techniques have to be integrated in existing near real time surveillance systems. In our presentation, we therefore also briefly address examples of new system architectures as well as a new software tools that are adapted to achieve this.
Keywords: maritime situation awareness, modern surveillance systems, data analytics, machine learning, patterns of life, thematic heat maps
1. INTRODUCTION
1.1 Sources of Trajectories
An object trajectory is a sequence of chronologically ordered positions of the object that are collected by cooperative or uncooperative sources. Cooperative sources include, the Automatic Identification System (AIS) which is an automatic collision avoidance and tracking system used by ships and by vessel traffic services (VTS) as well as coastal authorities [1], [2]. The necessity to carry AIS equipment onboard a ship, depends on the ship’s size and mission. Vessels fitted with AIS transceivers can be tracked by AIS base stations located along coast lines or by satellite based AIS receivers (S-AIS). AIS equipped ships have an assigned mobile service identity (MMSI) that allows their unique identification. The position information is based on GPS receivers complemented by additional electronic navigation sensors, such as a gyrocompass or rate of turn indicator. Analogously, aircraft equipped with Automatic Dependent Surveillance-Broadcast (ADS-B) transceivers can be tracked by associating the aircraft’s unique ICAO number with its reported positions.
However, both trajectory sources depend on the object’s willingness to be cooperative. If this is not given, or if the object does not fall under the carriage requirements (e.g. small ships), then the transmitted data might be incomplete, or completely missing or spoofed. In these situations, non-cooperative trajectory sources need to be used in order to complement or even generate an object track. Examples of uncooperative sources include costal surveillance radars, Ground Moving Target Indicating (GMTI) radar and image sequences from airborne and space borne imaging sensors (e.g. optical/ infrared cameras, synthetic aperture radar (SAR)). Partitioning all measured object positions resulting from heterogeneous sources into trajectories requires dedicated tracking systems [3], [4], [5].
2
1.2 Processing Architectures for Trajectories
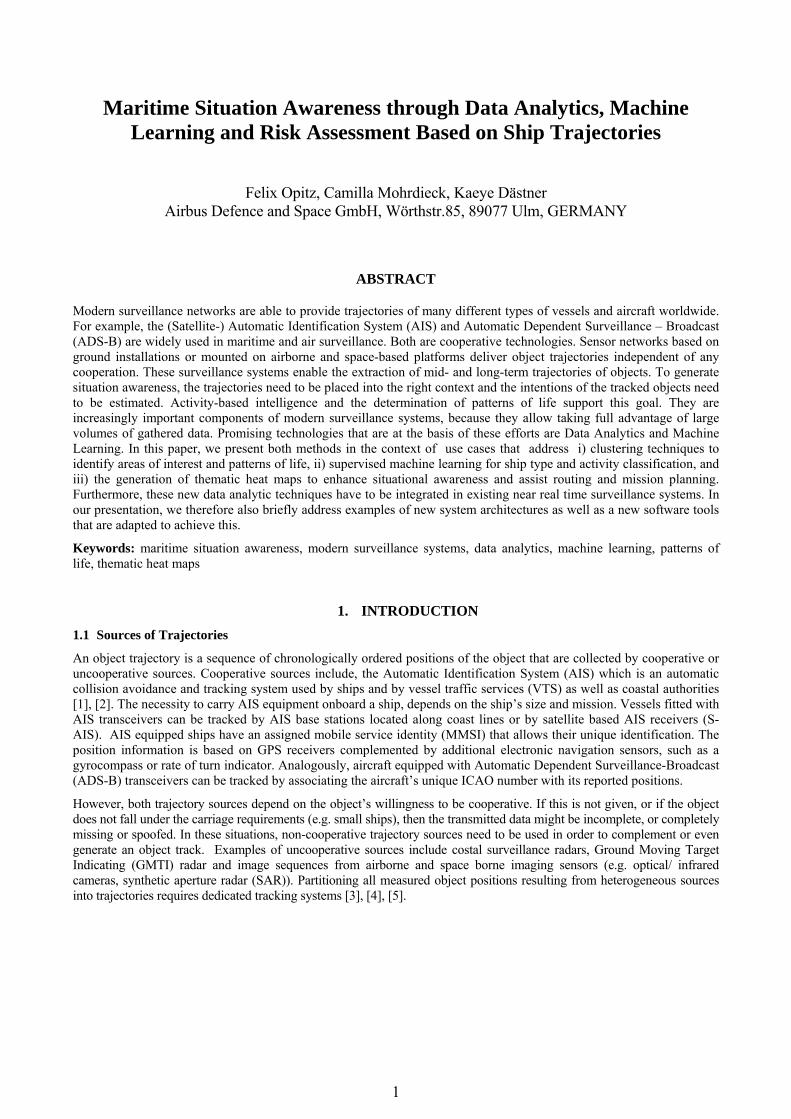
The processing of continuous long-time trajectories implies a novel approach to surveillance. While real-time surveillance systems focus on the detection, identification and tracking of objects with minimum possible time delays after signal detection, their integration with data analysis and machine learning techniques requires a big data architecture – the so called λ-architecture. In this architecture, data processing is spread over three different layers [6], [7], [8]:
• Batch Layer
• Serving Layer
• Speed Layer
The batch layer continuously receives and stores the raw trajectories. This may occur on a distributed filesystem and/or database, e.g. Hadoop HDFS or Cassandra [9]. Here, the trajectories have to be cleaned, transformed and presented such that different applications can access relevant information quickly [10].
Subsequently, trajectories are processed with methods related to data analytics and supervised or unsupervised machine learning. E.g. trajectories can be used to generate pure statistics – like heat maps. Or their patterns of life can be analyzed and visited areas or covered routes can be extracted to study an object’s normal behavior and to separate it from abnormal behavior. If trajectories are attributed with further information related to the objects’ type or activity, they can be used to train classifiers or predictors. This is supported by well-established tools like Spark [11] and a broad spectrum of machine learning libraries [12], [13], which enables distributed processing of large data volumes. These processing methods are done within the serving layer and do not necessarily occur in real time.
Figure 1. Lambda architectures
The real time aspects are considered in the third layer – the speed layer. Here, the learned patterns and classifiers/ predictors of the serving layer can be applied to the continual data stream to deliver real-time anomaly detection, predictive estimations, classification or even identification. For non-cooperative targets the speed layer possesses a tracking functionality, which can be used to aggregate single measurements to trajectories and to feed the batch layer.
Using this architecture allows a smooth integration of the big data and machine learning environment into already established and proven real time surveillance systems [8], [14]. Depending on the system’s requirements, a real time system can be enriched with either batch and serving layer, or with an extraction of the serving layer containing trained models and batch views only. The latter approach is particularly suitable for systems used in the field that are often subject to hardware limitations.

3
2. UNSUPERVISED MACHINE LEARNING FOR TRAFFIC ASSESSMENT
2.1 Area of Interest Extraction by Point Clustering
There are several areas of interest a trajectory normally passes through. These could be e.g. sea ports, airports/heliports (for aircraft), specific areas associated with offshore drilling rigs, wind parks or fishing grounds. Plots in these areas are usually easy to extract due to their characteristics such as navigation status, low speed or high turn rate or simply by the fact that they are the origin or terminus of a trajectory. After extraction, these plots can be clustered. The convex hulls of these point clusters are candidates for areas of interest [15], [16], [17].
Figure 2. Sea ports (blue: convex cluster hulls, red: centers of clusters)
If the data used for clustering contains an identifier, e.g. MMSI, relations between objects and areas of interest can be extracted, such as the traveling behaviour between ports. This finally opens the door to data mining and relational graphs.
Figure 3. Trajectories between sea ports based on one-month AIS data
2.2 Pattern of Life Analysis
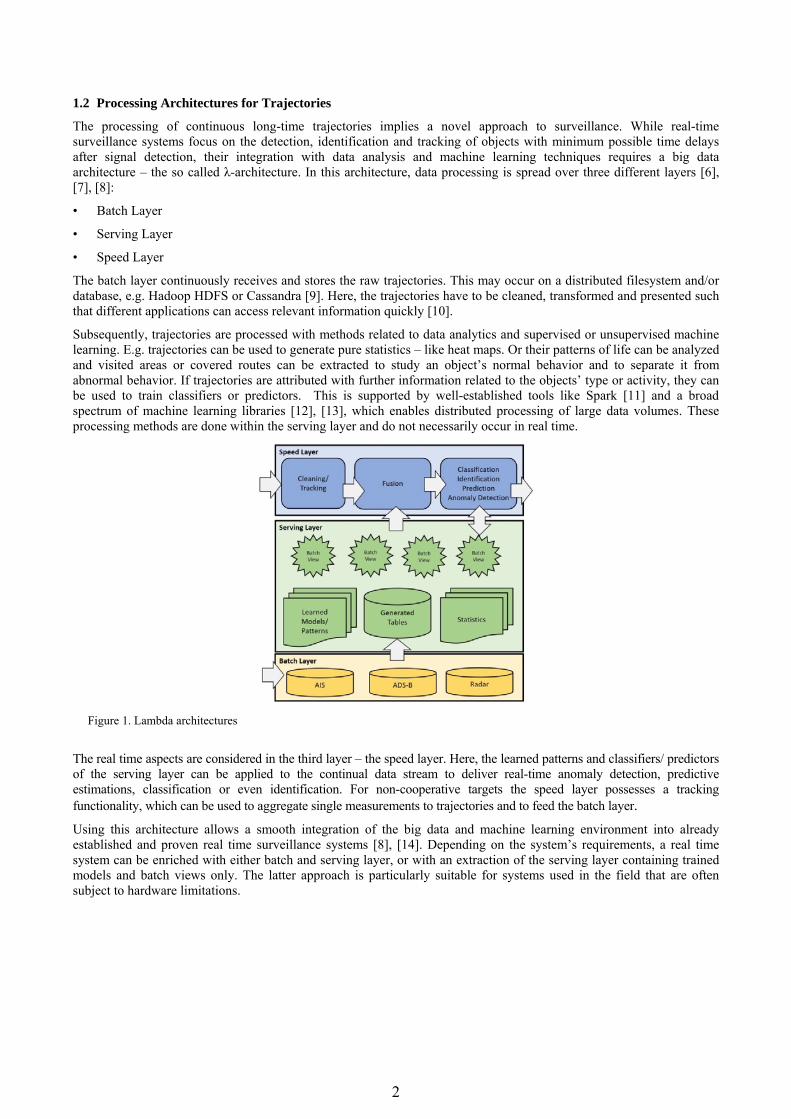
Besides the extraction of areas of interest, the clustering leads to the partition of trajectories into graphs, where the vertices (nodes) correspond to the areas of interest and the edges to the sub-trajectories with known starting and end node. This yields an inherent pattern of life analysis of the trajectories’ objects. The patterns of life of objects are the basis for determining their usual or normal travelling behavior which constitutes the reference with respect to which any abnormal behavior is detected [7], [8], [18].
4
Figure 4. Ship routes between ports
3. SUPERVISED MACHINE LEARNING FOR CLASSIFICATION
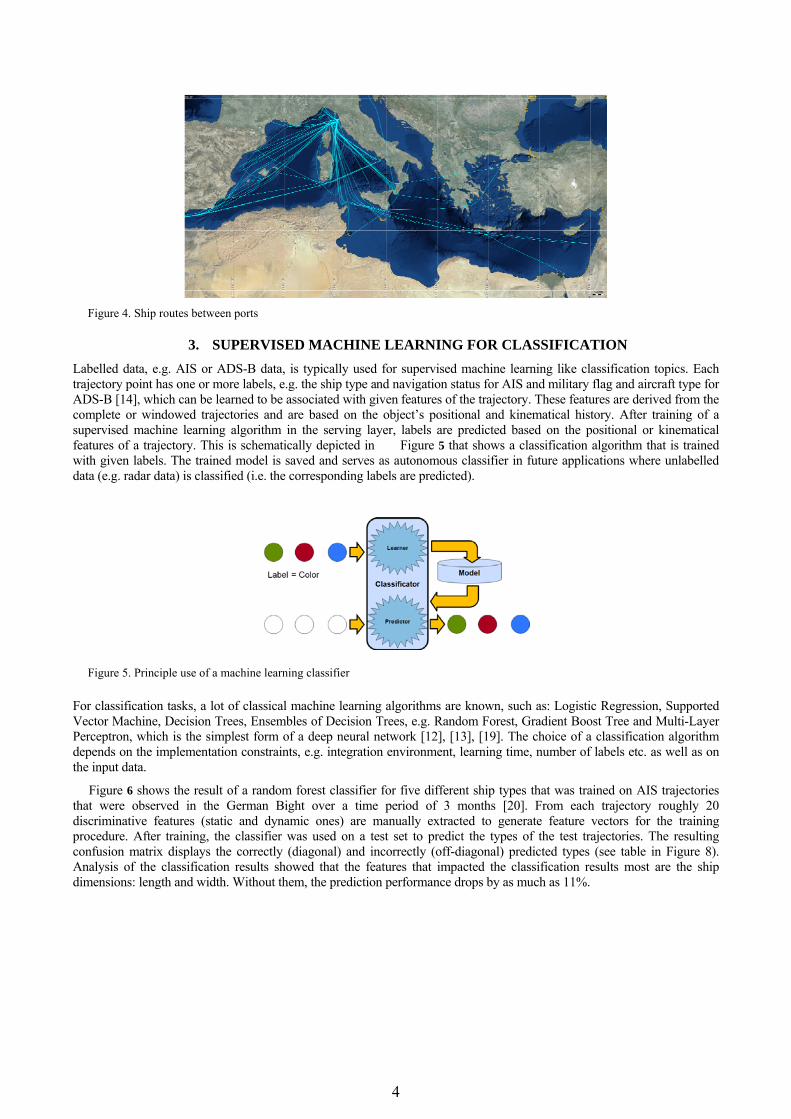
Labelled data, e.g. AIS or ADS-B data, is typically used for supervised machine learning like classification topics. Each trajectory point has one or more labels, e.g. the ship type and navigation status for AIS and military flag and aircraft type for ADS-B [14], which can be learned to be associated with given features of the trajectory. These features are derived from the complete or windowed trajectories and are based on the object’s positional and kinematical history. After training of a supervised machine learning algorithm in the serving layer, labels are predicted based on the positional or kinematical features of a trajectory. This is schematically depicted in Figure 5 that shows a classification algorithm that is trained with given labels. The trained model is saved and serves as autonomous classifier in future applications where unlabelled data (e.g. radar data) is classified (i.e. the corresponding labels are predicted).
Figure 5. Principle use of a machine learning classifier
For classification tasks, a lot of classical machine learning algorithms are known, such as: Logistic Regression, Supported Vector Machine, Decision Trees, Ensembles of Decision Trees, e.g. Random Forest, Gradient Boost Tree and Multi-Layer Perceptron, which is the simplest form of a deep neural network [12], [13], [19]. The choice of a classification algorithm depends on the implementation constraints, e.g. integration environment, learning time, number of labels etc. as well as on the input data.
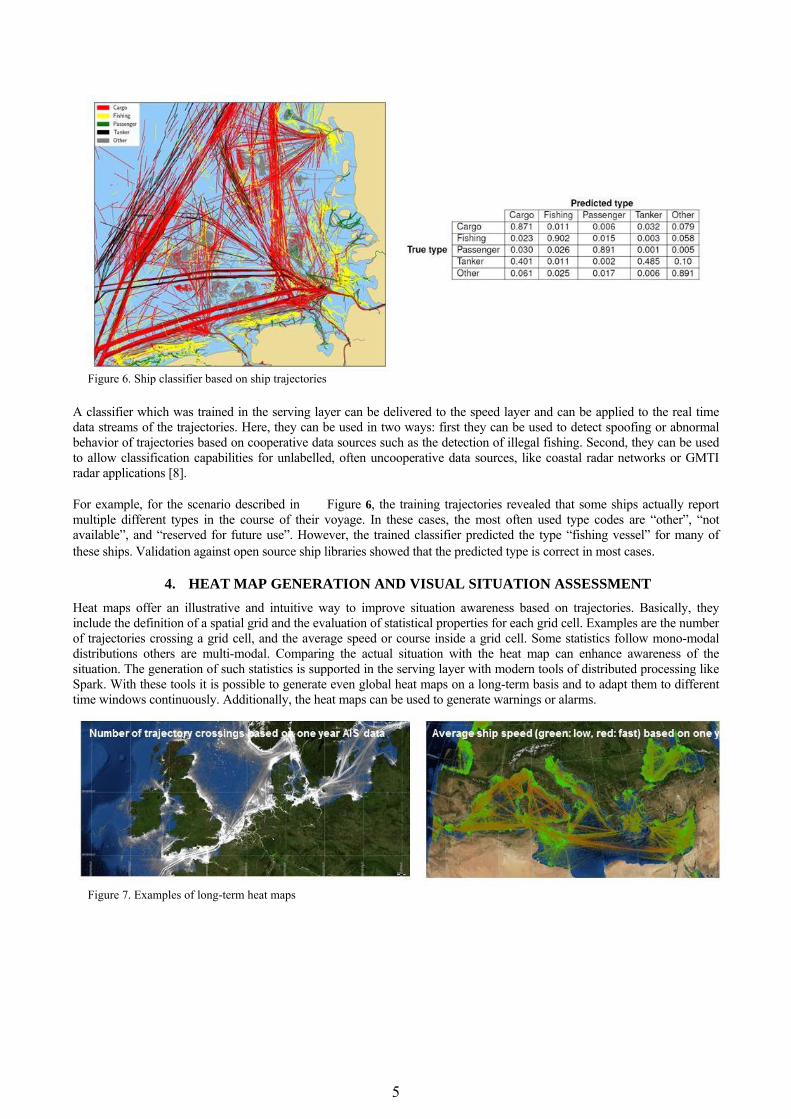
Figure 6 shows the result of a random forest classifier for five different ship types that was trained on AIS trajectories that were observed in the German Bight over a time period of 3 months [20]. From each trajectory roughly 20 discriminative features (static and dynamic ones) are manually extracted to generate feature vectors for the training procedure. After training, the classifier was used on a test set to predict the types of the test trajectories. The resulting confusion matrix displays the correctly (diagonal) and incorrectly (off-diagonal) predicted types (see table in Figure 8). Analysis of the classification results showed that the features that impacted the classification results most are the ship dimensions: length and width. Without them, the prediction performance drops by as much as 11%.
5
Figure 6. Ship classifier based on ship trajectories
A classifier which was trained in the serving layer can be delivered to the speed layer and can be applied to the real time data streams of the trajectories. Here, they can be used in two ways: first they can be used to detect spoofing or abnormal behavior of trajectories based on cooperative data sources such as the detection of illegal fishing. Second, they can be used to allow classification capabilities for unlabelled, often uncooperative data sources, like coastal radar networks or GMTI radar applications [8].
For example, for the scenario described in Figure 6, the training trajectories revealed that some ships actually report multiple different types in the course of their voyage. In these cases, the most often used type codes are “other”, “not available”, and “reserved for future use”. However, the trained classifier predicted the type “fishing vessel” for many of these ships. Validation against open source ship libraries showed that the predicted type is correct in most cases.
4. HEAT MAP GENERATION AND VISUAL SITUATION ASSESSMENT
Heat maps offer an illustrative and intuitive way to improve situation awareness based on trajectories. Basically, they include the definition of a spatial grid and the evaluation of statistical properties for each grid cell. Examples are the number of trajectories crossing a grid cell, and the average speed or course inside a grid cell. Some statistics follow mono-modal distributions others are multi-modal. Comparing the actual situation with the heat map can enhance awareness of the situation. The generation of such statistics is supported in the serving layer with modern tools of distributed processing like Spark. With these tools it is possible to generate even global heat maps on a long-term basis and to adapt them to different time windows continuously. Additionally, the heat maps can be used to generate warnings or alarms.
Figure 7. Examples of long-term heat maps

6
Another example of a thematic heat map is the time-and space resolved risk assessment presented in Figures 9-11. It has been developed in the course of a German-Canadian research project that was jointly conducted by Airbus Defence and Space, the Fraunhofer Institute for Communication, Information Processing and Ergonomics, FKIE, and Dalhousie University, Halifax [21]. The heat map assess the risk to a ship with a given ice class (or none at all) due to sea ice in a specific area and at a specific time with the aim of increasing the safety of the ship while operating in polar waters. The assessment is based on the internationally established Polar Operational Limitations Assessment Risk Indexing System (POLARIS) [22, 23] which was produced by the International Association of Classification Societies (IACS) to determine ship operational limits in ice. POLARIS uses a combination of the known ship ice classification limit and prevailing ice conditions in a given ice regime as published by the Canadian Ice Service to evaluate a risk score, the so called Risk Index Outcome (RIO), for each spatio-temporal grid cell. All numerical RIO values are associated with a recommendation of the type “operation permitted” or “operation permitted at limited speed” or “operation not permitted” to the ship operator. If a ship is escorted by an ice breaker, its RIO value is increased by 10, which increases the likelihood that the ship’s intended operation is permitted. This is depicted in Figure 8.
Figure 8. Operational limitations based on the POLARIS RIO value for operations in ice Using the color code as given in Figure 8, we can use the POLARIS framework to compute heat maps of an area of interest for different time periods, for different ship ice class classifications and for different statistical aggregations of RIO values. For example, in Figure 9 and Figure 10 the area of interest corresponds to Canadian arctic waters including the area of the Northwest Passage and Hudson Bay. The area is tessellated into 1km x 1km grid cells and in both cases the final RIO value per grid cell is the average over the RIO values of that grid cell evaluated for weekly published ice charts of the years 2007 – 2014.
Figure 9 shows three heat maps all for the same week in August but for different ship ice classes: “NOT IS” means not ice-strengthened at all, “IA” is a commonly occurring Baltic ice class, whereas “PC 1” is the strongest polar ice class. It can be seen that the area is getting increasingly safer to navigation as the ice class of the ship increases.
Figure 9. Operational limitations for 3 different ship ice classes during week 34 (August) in Canadian polar waters
7
In Figure 10, the heat maps correspond to the same time window (week 34) and to the same ship ice class (PC 7: lowest polar ice class) but display three different statistical aggregations of RIO values: the maximum (best case) RIO values per grid cell, the averaged RIO values per grid cell, and the minimum (worst case) RIO values per grid cell – always averaged over the RIO values of week 34 for the years 2007 – 2014.
Figure 10. Operational limitations for 3 different statistical RIO evaluations during week 34 for ice class PC 7
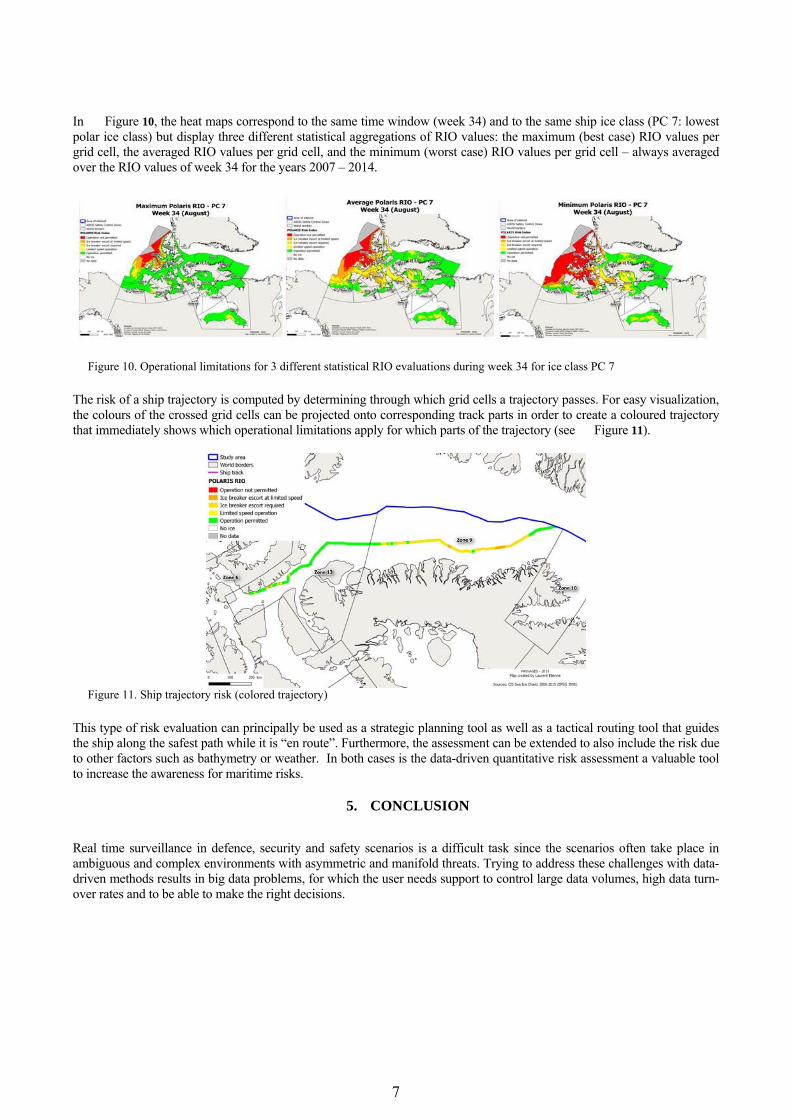
The risk of a ship trajectory is computed by determining through which grid cells a trajectory passes. For easy visualization, the colours of the crossed grid cells can be projected onto corresponding track parts in order to create a coloured trajectory that immediately shows which operational limitations apply for which parts of the trajectory (see Figure 11).
Figure 11. Ship trajectory risk (colored trajectory)
This type of risk evaluation can principally be used as a strategic planning tool as well as a tactical routing tool that guides the ship along the safest path while it is “en route”. Furthermore, the assessment can be extended to also include the risk due to other factors such as bathymetry or weather. In both cases is the data-driven quantitative risk assessment a valuable tool to increase the awareness for maritime risks.
5. CONCLUSION
Real time surveillance in defence, security and safety scenarios is a difficult task since the scenarios often take place in ambiguous and complex environments with asymmetric and manifold threats. Trying to address these challenges with data-driven methods results in big data problems, for which the user needs support to control large data volumes, high data turn-over rates and to be able to make the right decisions.

8
These needs are supported by innovative big data and machine learning methods that offer a chance to cope with existing and new challenges efficiently and effectively. Therefore, modern surveillance systems have to integrate big data concepts. Furthermore, globally and persistently available position data received by networked AIS and ADS-B transceivers and sensors deliver multitudes of trajectories. This paves the way for advanced data analytics and supervised and unsupervised machine learning. In this paper, we show how data-driven approaches can add to maritime situation awareness and decision support by applying these technologies to selected use cases.
REFERENCES
[1] International Maritime Organization (IMO) http://www.imo.org [2] US Department of Homeland Security, Navigation Center, https://www.navcen.uscg.gov/ [3] Blackman, S. and Popoli, R., [Design and Analysis of Modern Tracking Systems], Artech House, Boston, (1999) [4] Koch, W., [Tracking and Sensor Data Fusion: Methodological Framework and Selected Applications], Springer
Science & Business Media, (2013). [5] Bar-Shalom, Y., Rong Li, X., and Kirubarajan, T., [Estimation with applications to tracking and navigation: theory
algorithms and software], John Wiley & Sons, (2004). [6] Nathan, M., and Warren, J., [Big Data: Principles and best practices of scalable realtime data systems], Manning
Publications Co., (2015). [7] Opitz, F., Dästner, K., von Haßler zu Roseneckh-Köhler, B., and Schmid, E., “Data Analytics and Machine Learning
based on Trajectories,” NATO Specialist Meeting AI, Budapest, Hungary, (2018). [8] Dästner, K., et al., "Machine Learning Techniques for Enhancing Maritime Surveillance Based on GMTI Radar and
AIS," International Radar Symposium (IRS), Bonn, Germany, (2018). [9] Apache Cassandra, “a no-sql database”, cassandra.apache.org [10] Syd Ali, B., Schuster, W., Ochieng, W., and Majumdar, A., "Analysis of anomalies in ADS-B and its GPS data,"
Springer, GPS Solutions, Volume 20, Issue 3, 429–438, (July 2016). [11] Apache Spark, “a unified analytics engine for large-scale data processing”, spark.apache.org [12] scikit-learn, “Machine Learning in Python”, scikit-learn.org [13] Apache Spark MLlib, “a scalable machine learning library”, spark.apache.org/mllib [14] Dästner, K., Brunessaux, S., Schmid, E., von Haßler zu Roseneckh-Köhler, B., and Opitz, F., "Classification of
Military Aircraft in Real-time Radar Systems based on Supervised Machine Learning with Labelled ADS-B Data," 12-th Symposium Sensor Data Fusion, Bonn, Germany, (October 2018).
[15] Zhongliang, F. et al., “A two-step clustering approach to extract locations from individual GPS trajectory data,” ISPRS International Journal of Geo-Information 5.10, 166 (2016).
[16] Dästner, K. et al., “Exploratory data analysis for GMTI radar,” Radar Symposium (IRS), 18th International. IEEE, Prague, Czech Republic, (2017).
[17] Le Guillarme, N., and Lerouvreur, X., “Unsupervised extraction of knowledge from S-AIS data for maritime situational awareness,” Proceedings of the 16th International Conference on Information Fusion. IEEE, (2013).
[18] Pallotta, G., Vespe, M., and Karna, B., “Vessel Pattern Knowledge Discovery from AIS Data: A Framework for Anamoly Detection and Route Prediction,” Entropy 15, 2218-2245, (2013).
[19] Géron, A., “Hands On Machine Learning with Scikit-Learn & TensorFlow,”,O’Reilly, 5th Release, (2018). [20] Kraus, P., Mohrdieck, C., and Schwenker, F., “Ship classification based on trajectory data with machine-learning
methods,” Proc. International Radar Symposium, Bonn, Germany, (2018). [21] Battistello, G., Ulmke, M., and Mohrdieck, C.,“Enhanced maritime traffic picture for the Canadian Arctic,” Proc.10th
Future Security Research Conference, Berlin, Germany, (September 2015). [22] Maritime Safety Committee (2014b), Technical background to POLARIS, International Association of Classification
Societies (IACS). [23] Stoddard, M. A., Etienne, L., Pelot, R., Fournier, M., and Beveridge, L.,”From sensing to Sense-Making Assessing
and visualizing ship operational limitations in the Canadian Arctic using open-access ice data”, Proc. ShipArc Conference, Malmö, Sweden, (August 2015).