Maritime Meteorology
266
Transcript of Maritime Meteorology

8/19/2019 Maritime Meteorology
http://slidepdf.com/reader/full/maritime-meteorology 1/266

8/19/2019 Maritime Meteorology
http://slidepdf.com/reader/full/maritime-meteorology 2/266
REEDS
M RIT
meteoro

8/19/2019 Maritime Meteorology
http://slidepdf.com/reader/full/maritime-meteorology 3/266
Other Reeds Profes
Reeds Sea Transport 5th edition by Patrick
ISBN 0-7136-6944-6This book gives a complete picture of the Mits fifth edition, it includes new data and sof ship types, and a new chapter on marinefor professionals as well as students on couand Transport.
Reeds Marine Insurance by Barrie JervisISBN 0-7136-7396-6Written for those with little or no experexplains the principles of marine insurancaspects and is suitable for students studymaritime management course.
Reeds Marine Distance Tables 9th edition byby Miranda Delmar-MorganISBN 0-7136-6805-9These tables, which give worldwide coverowners and brokers for voyage estimatin
possible to calculate the shortest or mostthe major ports in the world.
Reeds Marine Surveying 2nd edition by ThoISBN 0-7136-7714-7

8/19/2019 Maritime Meteorology
http://slidepdf.com/reader/full/maritime-meteorology 4/266
Maurice M CornishExtra Master, FNI
and
Elaine E IvesBSc
REEDSM RIT
meteoro

8/19/2019 Maritime Meteorology
http://slidepdf.com/reader/full/maritime-meteorology 5/266
Published by Adlard Coles Nautical
an imprint of Bloomsbury Publishing Plc50 Bedford Square, London WC1B 3DP
www.adlardcoles.com
Copyright © Maurice M Cornish and Elaine E Ives
First edition published by Thomas Reed PublicatSecond edition 1997
Third edition published by Adlard Coles Nautica
Revised 2009
Print ISBN 978-1-4081-1206-9
ePub ISBN 978-1-4729-0265-8
ePDF ISBN 978-1-4081-2552-6
All rights reserved. No part of this publication m
form or by any means – graphic, electronic or m
photocopying, recording, taping or information s
systems – without the prior permission in writin
The authors have asserted their rights in accorda
Designs and Patents Act, 1988 to be identified a
A CIP catalogue record for this book is available

8/19/2019 Maritime Meteorology
http://slidepdf.com/reader/full/maritime-meteorology 6/266
8/19/2019 Maritime Meteorology
http://slidepdf.com/reader/full/maritime-meteorology 7/266
8 Visibility
Definitions Types of fog Advection, frsmoke Mist, dust and haze Sound sig
9 Atmospheric pressure and windUnits of pressure Cause of wind Reladirection and force and isobars Buys Babetween geostropic and gradient wind Epressure Planetary system of pressure awinds of the oceans Land and sea breez
10 Sea and swell wavesDefinitions Characteristics Formationbetween the period of a ship’s roll and the
dimensions Shallow water effects Imreporting wave data The Beaufort scale
11 Air masses and associated weatherSources and characteristics Classificatiomasses and associated weather
12 Isobaric patternsDistinctive types General characteristicsdepressions, anticyclones, secondary deprepressure, cols and straight isobars
13 Fronts and frontal depressions
Air mass boundaries Main frontal zonesof depressions The sequence of cloud anprocess of occluding The movement of depressions
M A R I T I M E M E T E O R O L O G Y

8/19/2019 Maritime Meteorology
http://slidepdf.com/reader/full/maritime-meteorology 8/266
18 Weather forecasting for the seafare
The synoptic map Storm warnings Ra Facsimile maps International aspectsSchemeWeather satellites Global wa
19 Forecasting the mariner’s own weatMovements of fronts Rules for estimati
Winds of the upper atmosphere
Upp
20 Ocean surface currentsCauses Characteristics General surfaccurrents
21 Sea icePhysics and formation Development seasons Practical warnings Dangers o
22 Weather routeingClimatological routeing Synoptic routeifrom shore specialists
23 Meteorological aspects of radarMeteorological phenomena on radar Wa Non-standard conditions
24 Meteorological factors of planning a
General principles Recommended refere
25 Brief notes on observations and instImportance of being observant Logbook Barographs Hygrometers Sea ther

8/19/2019 Maritime Meteorology
http://slidepdf.com/reader/full/maritime-meteorology 9/266
In keeping with the original aim, this editserving and trainee deck officers on merc
hoped that it will also be of value to yachhave an interest in the sea and meteorolog
We have avoided what appeared to us uthe same time have given as complete an considered appropriate. The book is principfor those studying for certificates of comp
pates changes in examination structures leAgency (MCA) qualifications in the UK, ataking place internationally, it should alsoreaders.
We have taken into account the vast ranthe Internet and included website addresse
priate for further reading at the end of somwas difficult as there are many hundreds.A helpful Glossary is included and quest
designed to help the student to test his or
h d h h l (h )
PREFA

8/19/2019 Maritime Meteorology
http://slidepdf.com/reader/full/maritime-meteorology 10/266
ACKNOWLEDGEMENTS
The authors would like to thank the staLibrary in Exeter, in particular Graham Bagave us generous assistance in selecting relating to the Beaufort scale and exampleague, Jef Forshaw, who was of considalternative photographs. Finally, thanks to tcloud types and sea state who responded w
ABOUT THE AUTHORS
Maurice Cornish served at sea as a navigAfter obtaining his Extra Masters CertifLondon before moving to Plymouth Colletaught for 19 years. In 1982 he was appointDepartment in Glasgow College of Nauticain 1992 and for some time acted as a
learning.
Elaine Ives graduated with a degree inEdinburgh in 1971. Since taking up a post Nautical Studies in 1978, she has lect

8/19/2019 Maritime Meteorology
http://slidepdf.com/reader/full/maritime-meteorology 11/266

8/19/2019 Maritime Meteorology
http://slidepdf.com/reader/full/maritime-meteorology 12/266
IntroductionThe Earth with its atmosphere, making thelikened to an enormous grapefruit havingpaper. The difference in this analogy is thinvisible gas termed the atmosphere and force. Its upper boundary has not yet beenwe are concerned almost entirely, with thcalled the troposphere, which extends fromof about 10 miles (compared with the EartBecause of its gaseous state, internal motiresponsible for all our ‘weather’ (state of skyother meteorological phenomena).
The composition of the atmosphereDry air is composed of a mixture of gases; surface, which is the zone in which we arnitrogen (about 78 per cent) and oxygen small quantities of other gases such as a
THE ATMOSPH1
8/19/2019 Maritime Meteorology
http://slidepdf.com/reader/full/maritime-meteorology 13/266
Vertical section of the atmospheFigure 1.1 is a schematic diagram showingof our atmosphere which is termed the troviewpoint, is really the ‘effective atmospherby a fall in air temperature with height ave(1°F per 300 feet), a very appreciable q
currents of air, turbulent eddies and hencand various atmospheric disturbances. Thentropopause, immediately above which wtemperature change with height is small aprotects the Earth from harmful effects comes the ionosphere which plays such an transmission and reception.
Pressure of the atmosphere
Our atmosphere comes under the gravitatiall gases are light they do have weight; theamount of atmosphere pressing down andpheric pressure per square unit area of Eart
atmospheric pressure is about 1,013.2 hPa;have fallen to about 670 hPa. It should bepressure at any point is a force which acwell as upwards and downwards.
Heating of the troposphere
The atmosphere is transparent to the shorreceives little or no appreciable heat fromheated by the sun’s rays and the surface athe Earth. This warmth is spread upwar
d ti Th l tt i b it lf
M A R I T I M E M E T E O R O L O G Y

8/19/2019 Maritime Meteorology
http://slidepdf.com/reader/full/maritime-meteorology 14/266

8/19/2019 Maritime Meteorology
http://slidepdf.com/reader/full/maritime-meteorology 15/266
The diurnal variation of lapse rate in th
often very marked over a land surface, espeskies. In the mornings when the Earth is corate is small and inversions (ie increase of 5.2 (b)) are common. After sunrise the landin the temperature lapse rate, and this maylate afternoon. As darkness approaches, t
temperature continues to fall throughoutrepeated. These effects may be modified oand force of wind.
Variation of pressure with heightAtmospheric pressure at any level is the w
follows therefore that the pressure must alower levels the average rate at which press27.7 metres of height, but the actual ratetemperature.
In Figure 1.2, A & B are two columns of area and the same mean sea level pressu
temperatures.
M A R I T I M E M E T E O R O L O G Y
500 hPa
A warm

8/19/2019 Maritime Meteorology
http://slidepdf.com/reader/full/maritime-meteorology 16/266
Radiation is a form of heat transfer whichmedium through which it travels. All bodie
heat energy in the form of short electromaspace at the speed of light. The actual waveof the radiating body. The hotter the body tmore intense is the emission. At very higheat and light, eg a fire. The surface tempernature of 6,000°C.
Of the sun’s radiant energy which stthereby increasing the temperature of theheat waves back into space. Some of the inthe sun is lost through absorption, reflecticloud will reflect nearly 80 per cent oAbsorption is very little, probably about se
Water vapour and cloud, when preseoutgoing long-wave radiation, some of wsome re-radiated downwards to the Earth’some measure for loss of heat by outg
greenhouse effect . It explains why, when th f ll i f d i h
SOLAR RADIATAND TEMPERAT2
8/19/2019 Maritime Meteorology
http://slidepdf.com/reader/full/maritime-meteorology 17/266
M A R I T I M E M E T E O R O L O G Y
range in temperature of a land surface is
surface which, in ocean areas, is generally lenents may vary by 16°C (30°F) or more). Thin land temperature is often modified locallyin wind direction might bring a much colder
Factors affecting the heating eff
The inclination of the solar beam to the
This depends on:
The latitude of the place. The sun’s declination, which varies wit
The daily change in the sun’s altitude.
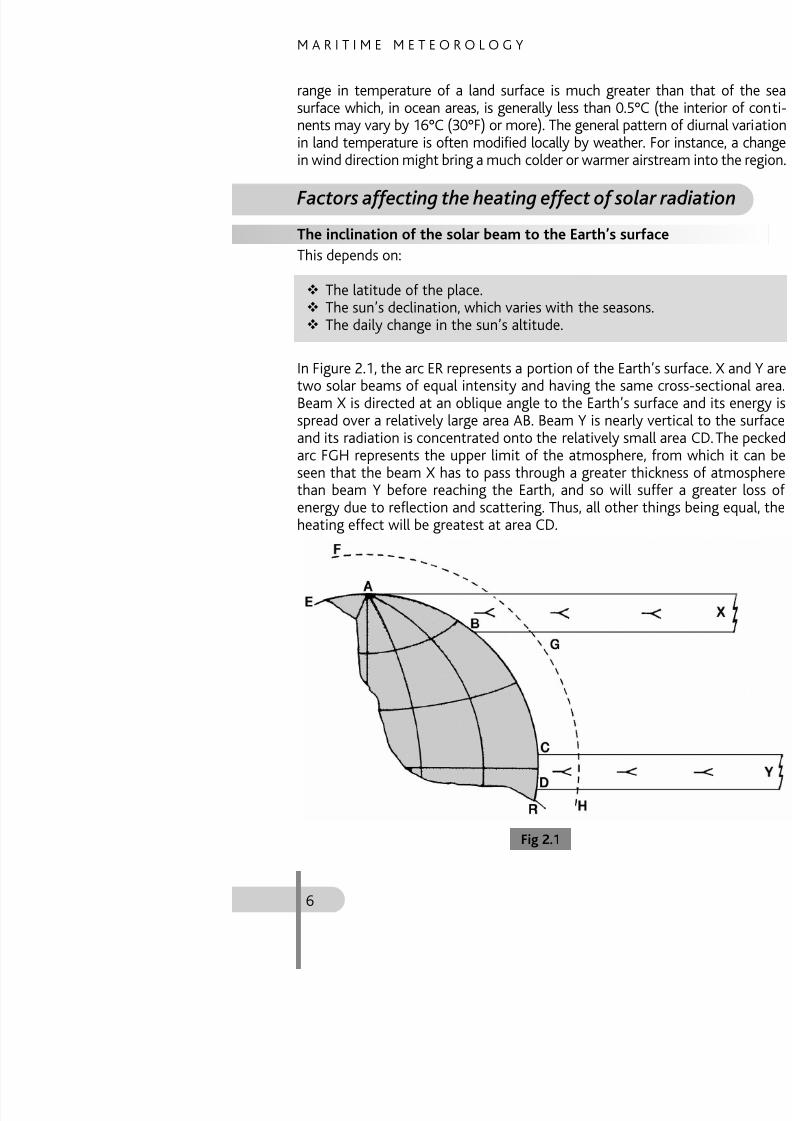
In Figure 2.1, the arc ER represents a portiotwo solar beams of equal intensity and haBeam X is directed at an oblique angle to spread over a relatively large area AB. Beam
and its radiation is concentrated onto the arc FGH represents the upper limit of theseen that the beam X has to pass throughthan beam Y before reaching the Earth, aenergy due to reflection and scattering. Thheating effect will be greatest at area CD.

8/19/2019 Maritime Meteorology
http://slidepdf.com/reader/full/maritime-meteorology 18/266
S O L A R R A D I A
The nature of the surface
Snow and ice surfaces reflect about 80 pesoil, bare rock and sand, though poor cabsorbers and the heat energy received pensurface amounting to a few inches. Henctemperature for a given amount of radiatithe sea surface changes only a very little fo
The reasons for this are:
The specific heat capacity* of water is The solar rays penetrate the sea surfac The stirring effect of the wind brings u Much of the heat received by the sea
in the process of evaporation. A water surface reflects solar radiation
incidence.
Air temperature near the surface tends tThus the annual range, like the diurnal range
continents than over the oceans. The mainat sea are:
Latitude. Generally warmest within th Season. Proximity to large land masses. Prevailing winds. Ocean currents. Upwelling of cooler water from the de The presence of ice or snow covering.

8/19/2019 Maritime Meteorology
http://slidepdf.com/reader/full/maritime-meteorology 19/266
Water vapour
This is water in the vapour state and althouin the atmosphere. The amount varies in bevaporation from the sea surface and, to msnow, ice and other moist surfaces on land
Cloud and fog
These should not be confused with wate
water droplets in the liquid state.Saturated air
The maximum quantity of water vapour volume of air is limited by temperature. Thethe quantity of water vapour the air can amount is present the air is said to be satuvapour than the maximum possible amowhich is unsaturated is often called dry avapour.) If unsaturated air is cooled sufFurther cooling will result in the excess wa
(
HUMIDITY ANDCONDENSATIO3

8/19/2019 Maritime Meteorology
http://slidepdf.com/reader/full/maritime-meteorology 20/266
H U M I D
Relative humidity
This is the ratio of the amount of watmaximum amount possible at the same percentage.
RH =Absolute h
Saturation va
Refer now to Figure 3.1 which is a graph svalues of absolute humidity against air temor no concern to the mariner but the simportance and this will become appare
should be noted:
1 At a temperature of, say, 20°C the mvapour which the air can contain is abohold about 50 g/m3. Thus, the higher tsaturation value of absolute humidity.
2 Suppose a sample of air at a temperaturvapour.
(a) Relative humidity = 20 = 40%50
(b) If the air is cooled sufficiently it willThe dew point is then 20°C. The dchanges of temperature above 20°C
(c) Should the temperature fall below th10°C, then the new dew point wou
( )
(

8/19/2019 Maritime Meteorology
http://slidepdf.com/reader/full/maritime-meteorology 21/266
M A R I T I M E M E T E O R O L O G Y

8/19/2019 Maritime Meteorology
http://slidepdf.com/reader/full/maritime-meteorology 22/266
H U M I D
Hygroscopic nuclei Within the troposphere there is always pminute solid particles, such as dust*, salt frdomestic and factory fires, plus other soparticles are hygroscopic – that is, they teThey are the nuclei onto which water vapodroplets (cloud or fog). Without their prehighly improbable. They are most abundantwhence they are carried upwards to higindustrial areas where there is a very high sometimes form in falling temperatures a reached.

8/19/2019 Maritime Meteorology
http://slidepdf.com/reader/full/maritime-meteorology 23/266
M A R I T I M E M E T E O R O L O G Y
Remember to use the Glossary
TEST QUESTIONS Chapters 1 to 3
1 Describe briefly the characteristics a
2 What is the average lapse rattroposphere?
3 In spite of the relatively high surfacthe temperature at the tropopausethan over the polar caps. Explain wh
4 Name and describe the processes the Earth’s surface to the troposphe
5 Write brief notes on the diurnal varthe lower levels of the troposphere.
6 Explain why atmospheric pressure
level.7 (a) What is the approximate ave
pressure within the lower levels(b) On what does the actual rate d
Solar radiation and temperature
8 Describe the greenhouse effect on t
9 Define specific heat.
10 (a) Describe briefly each of the mad b l d
QUESTIO
8/19/2019 Maritime Meteorology
http://slidepdf.com/reader/full/maritime-meteorology 24/266
Introduction
Cloud identification can be and often is, soof clouds being present at different levels ait may be quite simple with only one cloudseafarer should be able to recognise the bearing upon existing and future weatherweather forecaster but the arrival of a partic
timing of a particular forecast or may give change. This can be particularly useful wreason unobtainable. A seafarer also needscloud types for inclusion in weather repmeteorological service. The cloud formatifeature of most weather situations and
valuable information when preparing a fore
Summary of cloud types
The names and descriptions of the vario
CLASSIFICATIO4

8/19/2019 Maritime Meteorology
http://slidepdf.com/reader/full/maritime-meteorology 25/266
M A R I T I M E M E T E O R O L O G Y
Clouds heights
The names of the main cloud types, their aheights are shown in the table below.
The abbreviations as shown above are custovoluntary observers in describing the cloud
Description of cloud types (see p
Stratus (St)
A more or less continuous layer or sheet of
CLOUDGROUP
AVERAGE HEIGHT RA(For middle latitudes
LOWLEVELCLOUDS
From near surface leveto about2,000 metres (6,500 fe
Clouds of markedvertical extent
(heap clouds)
From near surface leveto about
14,000 metres (45,000
MEDIUMLEVELCLOUDS
About 2,000 metres (6to about5,500 metres (18,000
HIGH
LEVELCLOUDS
About 5,500 metres (1
to about14,000 metres (45,000
8/19/2019 Maritime Meteorology
http://slidepdf.com/reader/full/maritime-meteorology 26/266
C L A
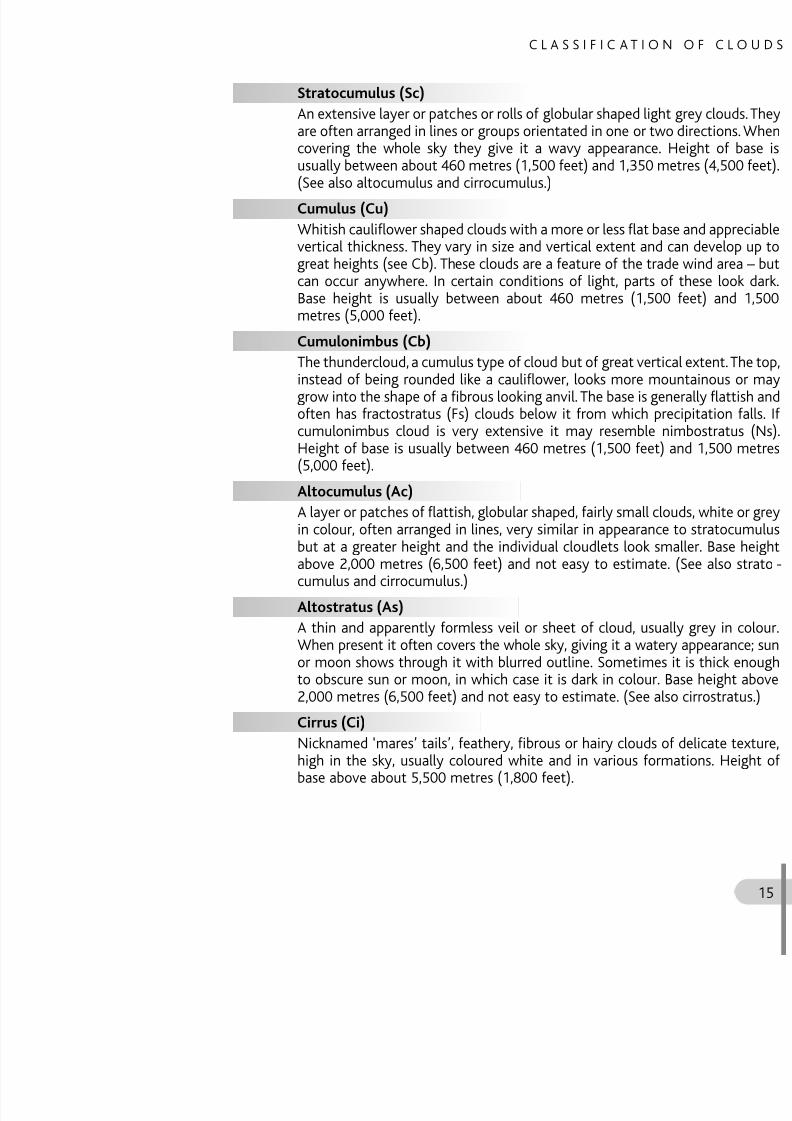
Stratocumulus (Sc)
An extensive layer or patches or rolls of gloare often arranged in lines or groups orientacovering the whole sky they give it a wausually between about 460 metres (1,500 f(See also altocumulus and cirrocumulus.)
Cumulus (Cu)
Whitish cauliflower shaped clouds with a mvertical thickness. They vary in size and vergreat heights (see Cb). These clouds are a fcan occur anywhere. In certain conditionsBase height is usually between about 46metres (5,000 feet).
Cumulonimbus (Cb)
The thundercloud, a cumulus type of cloud instead of being rounded like a cauliflowegrow into the shape of a fibrous looking anvoften has fractostratus (Fs) clouds below cumulonimbus cloud is very extensive it Height of base is usually between 460 me(5,000 feet).
Altocumulus (Ac)
A layer or patches of flattish, globular shapein colour, often arranged in lines, very simi
but at a greater height and the individual above 2,000 metres (6,500 feet) and not cumulus and cirrocumulus.)
Altostratus (As)

8/19/2019 Maritime Meteorology
http://slidepdf.com/reader/full/maritime-meteorology 27/266
M A R I T I M E M E T E O R O L O G Y
Cirrocumulus (Cc)
Layers or patches of very small globular diminutive altocumulus but derived from ‘mackerel sky’, the cloudlets are arrangeresemble flocks of sheep. Base height above(See also altocumulus and stratocumulus.)
Cirrostratus (Cs)A diffuse and thin veil of cloud, whitisaltostratus, but more diffuse. Only slightlymoon; it often produces a halo effect whicgives the sky a greyish or milky effect. Base(18,000 feet). (See altostratus.)
Weather associated with cloud ty
With a few obvious exceptions, a particulamuch by itself about impending weather cagainst a background of the process of particular clouds, also the wind and pres
recently. Ideally, a synoptic map is needed happening to the weather some distance aterms, that at sea level the possible indicatcloud types are as follows, but complication
Stratus
No special significance but may affect visiair mass, ie not much convection. Drizzle o
Nimbostratus
Can be termed the rain cloud. Considerableweather generally In some cases the rain d
C L A

8/19/2019 Maritime Meteorology
http://slidepdf.com/reader/full/maritime-meteorology 28/266
C L A
Altostratus
Is not infrequently a herald of rain (and wapproaching depression if it derives from cifalling barometer.
Cirrus
If it grows in extent it may well indicateweather generally. Gives timely warning
followed by a falling barometer. If it turns tcoming depression or confirms the advent probably has no significance.
Cirrocumulus
‘Not long wet not long dry’ seems a fair s
with fair weather and little wind.Cirrostratus
Gives a fair indication of the approach of indicate approach of a depression, or a trop
1 (a) Name the ten principal cloud typ(b) Between what limiting heights a
and ‘high’ clouds found?
2 Give a description of each of the folloNs and Fs (‘scud’).
3 (a) What are mares’ tails?(b) What might they indicate if they
QUESTIO

8/19/2019 Maritime Meteorology
http://slidepdf.com/reader/full/maritime-meteorology 29/266
Adiabatic heating and cooling
(See Adiabatic in the Glossary.)
When a body of air is subjected to an compressional heating as opposed to thermis subjected to a reduction in pressure it
opposed to thermal cooling. For an extemperature of the air in a bicycle pucompressed. In the latter case, when comprits temperature falls.
Adiabatic processes in the atmos
Atmospheric pressure decreases with heighthe surrounding air (ie its environment) it and is cooled adiabatically. Conversely, if itin pressure and is warmed adiabatically. Intakes place between the body of air and its
CLOUD FORMADEVELOPMENT5
C L O U D F O R M A T
8/19/2019 Maritime Meteorology
http://slidepdf.com/reader/full/maritime-meteorology 30/266
C L O U D F O R M A T
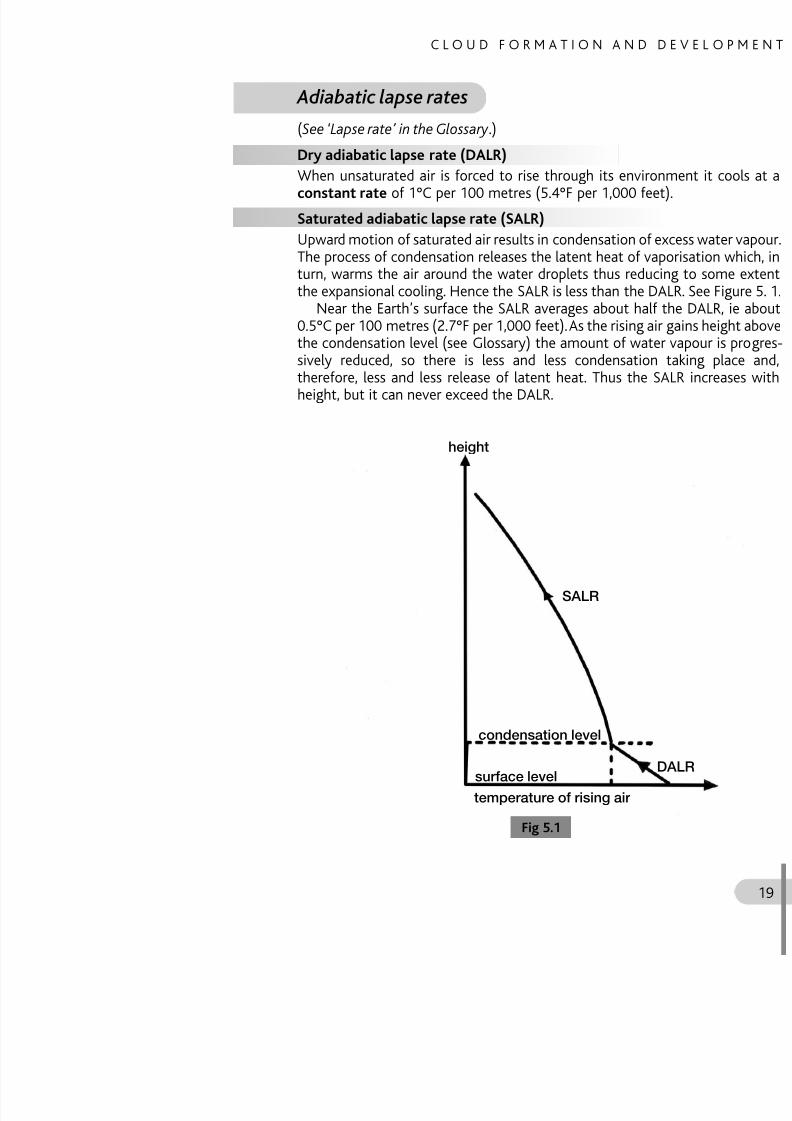
Adiabatic lapse rates
(See ‘Lapse rate’ in the Glossary .)
Dry adiabatic lapse rate (DALR)
When unsaturated air is forced to rise thrconstant rate of 1°C per 100 metres (5.4°
Saturated adiabatic lapse rate (SALR)Upward motion of saturated air results in coThe process of condensation releases the laturn, warms the air around the water dropthe expansional cooling. Hence the SALR is
Near the Earth’s surface the SALR avera
0.5°C per 100 metres (2.7°F per 1,000 feet)the condensation level (see Glossary) the asively reduced, so there is less and lesstherefore, less and less release of latent hheight, but it can never exceed the DALR.
height
M A R I T I M E M E T E O R O L O G Y

8/19/2019 Maritime Meteorology
http://slidepdf.com/reader/full/maritime-meteorology 31/266
M A R I T I M E M E T E O R O L O G Y
The Environmental lapse rate (ELR)
The ELR within the troposphere averages a300 feet), but the actual value is subject to and altitude. Refer now to Figure 5.2, whichof four possible environmental temperature
C L O U D F O R M A T

8/19/2019 Maritime Meteorology
http://slidepdf.com/reader/full/maritime-meteorology 32/266
C L O U D F O R M A T
(a) Represents a near average ELR curve w
(b) Illustrates a curve with negative* lasurface inversion may be caused thsurface at night, or by a warm air masssurface.
(c) Shows an inversion at height which subsiding from upper levels and being
descent. It is generally associated witexplained fully in Chapter 15.(d) Illustrates an isothermal layer which
be formed by the subsidence of dry ai
Atmospheric stability and instab
(See Stability in the Glossary .)
If a body of air at the surface becomes warcommence to rise through the environme
batically (see Figure 5.1). Upward motion wtemperature of the rising air reaches that which this takes place is governed almost en
Refer now to Figure 5.3 (a), (b) and (c). TGE2, and CE3 represent three ELRs of differeSALR respectively. Z represents a specimimportant to note that, at any height, the tenvironmental curve and either one of thethe horizontal distance between the releva
Case 1 Stable air (Figure 5.3a)
A i th i ti ELR i AE
M A R I T I M E M E T E O R O L O G Y

8/19/2019 Maritime Meteorology
http://slidepdf.com/reader/full/maritime-meteorology 33/266
b) Should the air specimen be initially forcit will warm adiabatically during descent, bair and thus offer increasing resistance toplacing force should cease to act the air spand finally come to rest at its original level
Case 2 Unstable air (Figure 5.3b)
In this case the ELR is greater than the DA
unstable regardless of whether it is saturatthe graph GE2, as the existing ELR in the figuis applied to the air specimen (Z) for only distance upwards.a) During this initial movement the rising will become warmer and lighter than its en
curves lie to the right of the ELR). Thus the lated and the air will continue to rise after thb) If the initial displacing force acts downwadiabatically but the graph will show that itits environment as height decreases. Thus tand will continue after the displacing force
Note: In general, stratiform cloud is associacloud with unstable air.
M A R I T I M E M E T E O R O L O G Y

8/19/2019 Maritime Meteorology
http://slidepdf.com/reader/full/maritime-meteorology 34/266

8/19/2019 Maritime Meteorology
http://slidepdf.com/reader/full/maritime-meteorology 35/266

8/19/2019 Maritime Meteorology
http://slidepdf.com/reader/full/maritime-meteorology 36/266

8/19/2019 Maritime Meteorology
http://slidepdf.com/reader/full/maritime-meteorology 37/266

8/19/2019 Maritime Meteorology
http://slidepdf.com/reader/full/maritime-meteorology 38/266

8/19/2019 Maritime Meteorology
http://slidepdf.com/reader/full/maritime-meteorology 39/266

8/19/2019 Maritime Meteorology
http://slidepdf.com/reader/full/maritime-meteorology 40/266

8/19/2019 Maritime Meteorology
http://slidepdf.com/reader/full/maritime-meteorology 41/266

8/19/2019 Maritime Meteorology
http://slidepdf.com/reader/full/maritime-meteorology 42/266

8/19/2019 Maritime Meteorology
http://slidepdf.com/reader/full/maritime-meteorology 43/266

8/19/2019 Maritime Meteorology
http://slidepdf.com/reader/full/maritime-meteorology 44/266

8/19/2019 Maritime Meteorology
http://slidepdf.com/reader/full/maritime-meteorology 45/266

8/19/2019 Maritime Meteorology
http://slidepdf.com/reader/full/maritime-meteorology 46/266
8/19/2019 Maritime Meteorology
http://slidepdf.com/reader/full/maritime-meteorology 47/266
8/19/2019 Maritime Meteorology
http://slidepdf.com/reader/full/maritime-meteorology 48/266
8/19/2019 Maritime Meteorology
http://slidepdf.com/reader/full/maritime-meteorology 49/266
C L O U D F O R M A T

8/19/2019 Maritime Meteorology
http://slidepdf.com/reader/full/maritime-meteorology 50/266
Case 3 Conditionally unstable air (Figure
In this case the value of the ELR lies betwrepresented by the curve CE3 in the figure.
If the air at the height level WX is saturis less than the SALR but if it is unsaturagreater than the DALR.
The degree of stability or instability depELR curve but also on the height of the co
by the dew point.Refer now to Figures 5.4(a) and 5.4(
represents the air temperature at surface lsample of surface air is raised by solar radiaNote that the values of T, V and the ELR ardifferent.
First now consider Figure 5.4(a). The air through its environment cooling at the DAthe condensation level (CL) at which heiwarmer than the surrounding air, will contSALR, and so becoming increasingly unstareach to a ver y great height.
Comparing Figures 5.4(a) and 5.4(b), it values of T, V and the ELR remain unchangeis relatively low hence the condensation
M A R I T I M E M E T E O R O L O G Y
8/19/2019 Maritime Meteorology
http://slidepdf.com/reader/full/maritime-meteorology 51/266
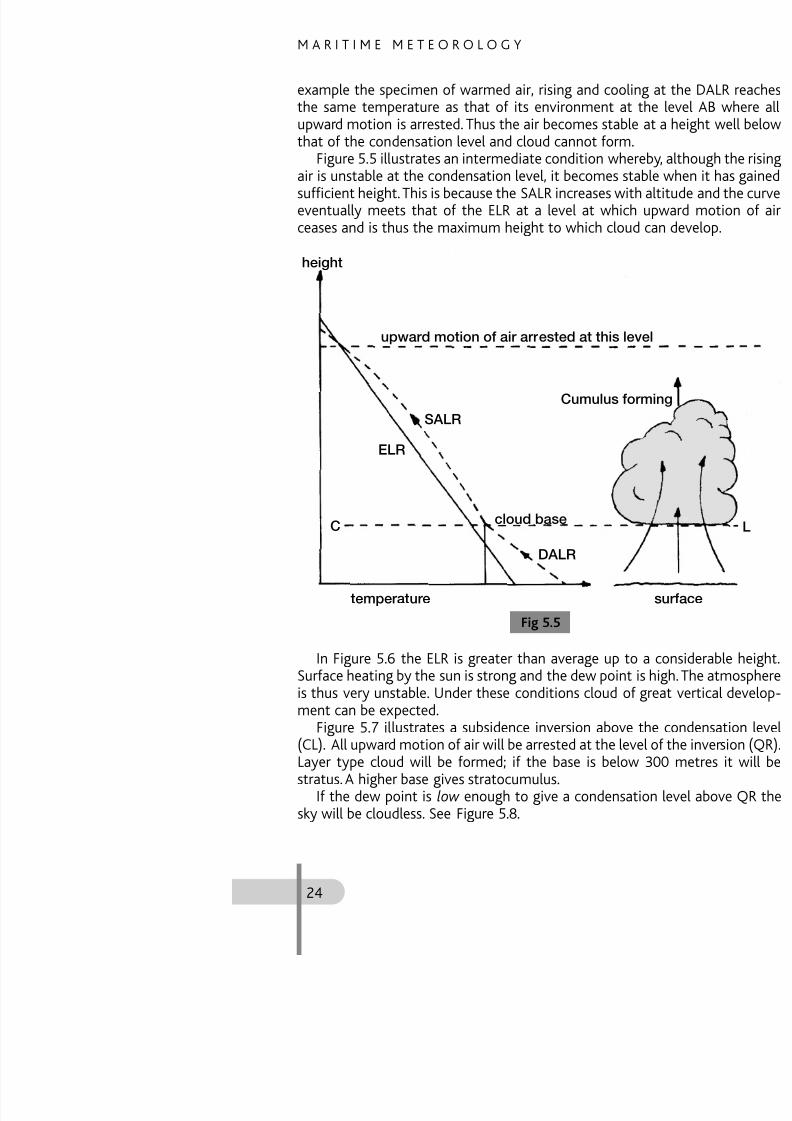
example the specimen of warmed air, risinthe same temperature as that of its envir
upward motion is arrested. Thus the air becthat of the condensation level and cloud ca
Figure 5.5 illustrates an intermediate conair is unstable at the condensation level, it sufficient height. This is because the SALR ineventually meets that of the ELR at a lev
ceases and is thus the maximum height to
Fi 5 5
upward motion of air arreste
height
SALR
ELR
C
C
cloud base
DAL
temperature
C L O U D F O R M A T

8/19/2019 Maritime Meteorology
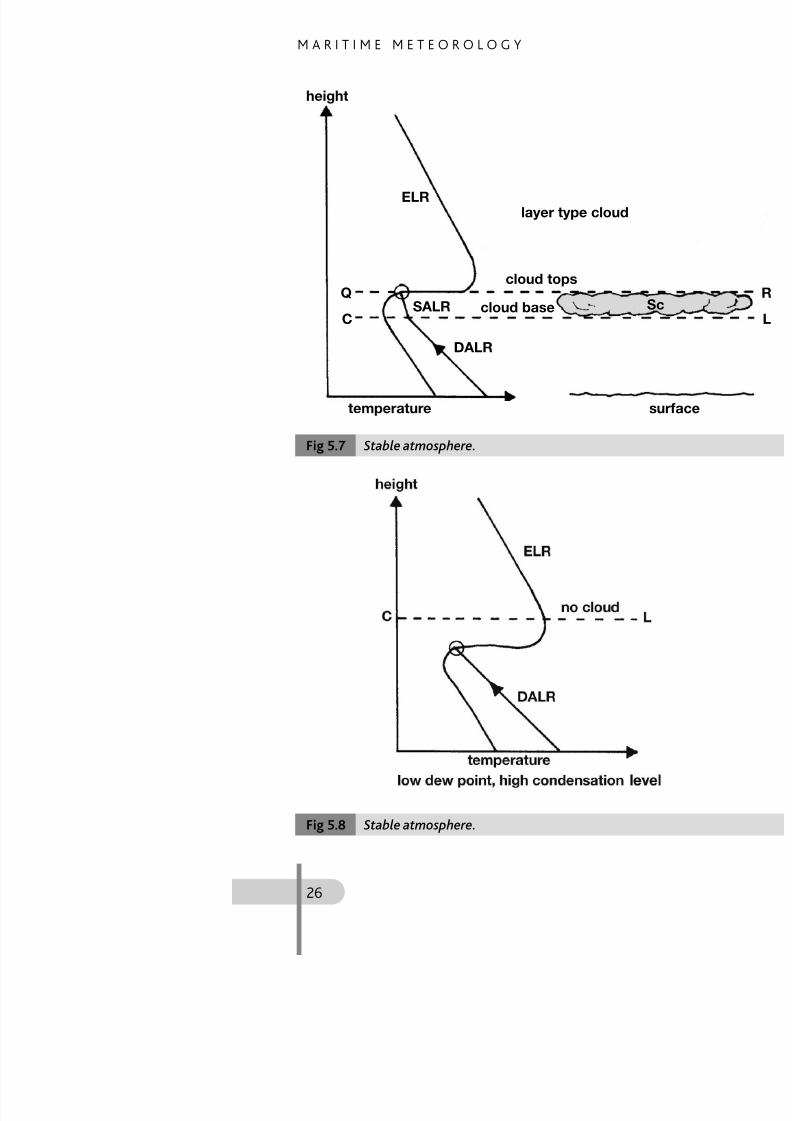
http://slidepdf.com/reader/full/maritime-meteorology 52/266
In stable atmosphere the cloud formed wil
low stratus. Fairly dry air gives a higher, smSee Photos 7 and 8.In unstable atmosphere cloud will be cu
instability the greater the amount of cumu
Unstable atmosphere.Fig 5.6
M A R I T I M E M E T E O R O L O G Y
8/19/2019 Maritime Meteorology
http://slidepdf.com/reader/full/maritime-meteorology 53/266
Stable atmosphere.Fig 5.7
height
temperature
Q
C
ELRlayer t
SALR
cloud top
cloud base
DALR
C L O U D F O R M A T
8/19/2019 Maritime Meteorology
http://slidepdf.com/reader/full/maritime-meteorology 54/266
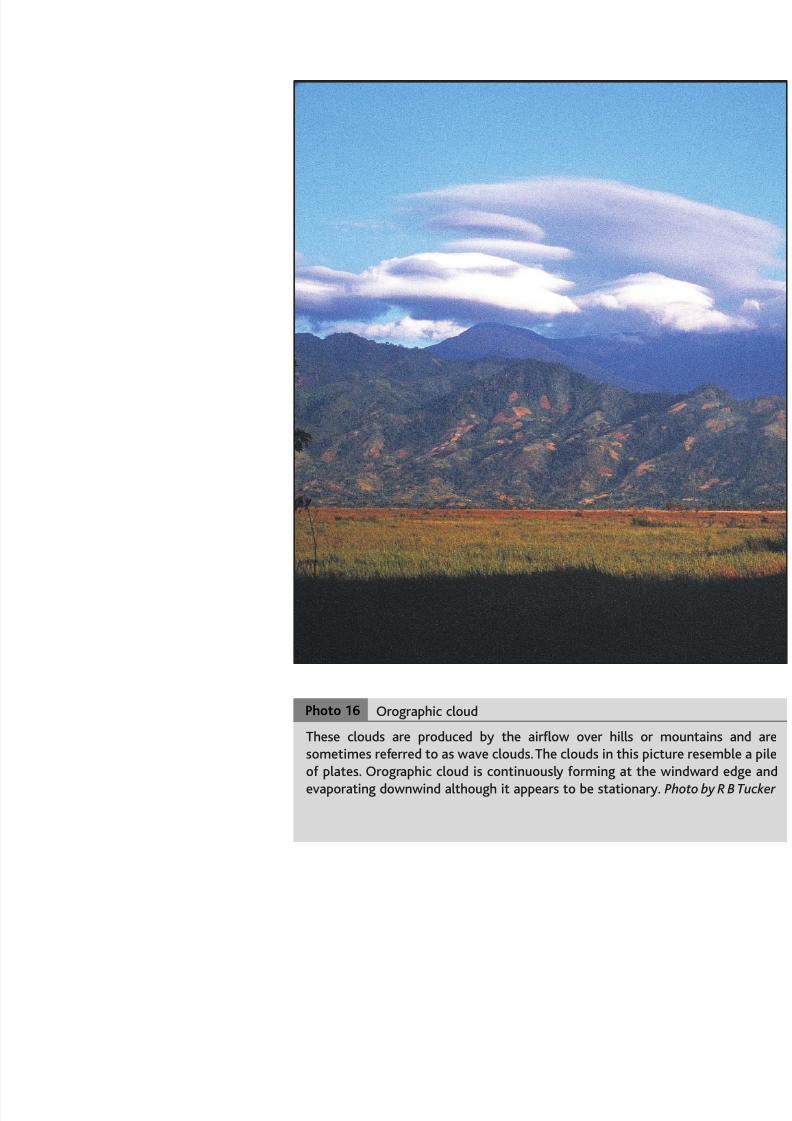
3 Orographic uplift occurs when an airstror barrier of hills and is forced upward
stable or unstable. Cloud will not formcondensation level. Orographic cloud candepending on whether the rising air is scondensation level.
A very well known orographic stratoften forms on Table Mountain, Cape T
from over the sea. This cloud covers the down on the lee side for some distanevaporation after adiabatic warming. A Gibraltar.
Orographic uplift of warm moist air of which is deposited on the windward
mountains. In such cases the weather ondry. For example, with a westerly airstrecold wet weather on the West Coast, it weather on the East Coast. This is calChinook in Glossary.)
4 Frontal uplift operates mainly within de
More often than not the cloud structutype, whereas cumuliform cloud is a cFrontal uplift is fully explained in Chapt
5 Uplift resulting from convergent windinto an area exceeds the horizontal oupwards mechanically. Except in arid
associated with much cloud and precipitand centres of depressions.
M A R I T I M E M E T E O R O L O G Y
8/19/2019 Maritime Meteorology
http://slidepdf.com/reader/full/maritime-meteorology 55/266
1 Define the following terms: water point, saturated air, unsaturated air,
2 What are hygroscopic nuclei and howof condensation in the atmosphere?
3 Adiabatic lapse rates
Distinguish between thermal and dyin the atmosphere.
4 The SALR averages about half the vasurface.(a) What is the value of the DALR?(b) Explain why the SALR increases w
exceed the DALR.
5 Environmental lapse rates(a) What is the average ELR within (b) What is a surface inversion? De
is commonly formed.
6 How is an inversion at height broug7 What is an isothermal layer?
8 Cloud formation. Name and describuplift of air.
9 Summarise the physical processes w
10 Atmospheric stability and instabiDraw simple temperature v heightunstable air. (Values for temperatuSt t h t l d t i t
QUESTIO

8/19/2019 Maritime Meteorology
http://slidepdf.com/reader/full/maritime-meteorology 56/266
In meteorology ‘precipitation’ is a generwater deposit which are derived from the catmosphere. It includes rain, drizzle, snow,
the more common concept of the term; brime and glazed frost which are, more ofte‘not strictly precipitation’. Meteorologists hydrometeors.
Cloud, fog and mist are not classed as pThe difference between rain and drizzle
relatively very small (diameter between 0.2fall slowly and gently from low based humidity is high beneath the cloud base before reaching the surface.
Rain and drizzle
Formation
Raindrops vary in size but they are all laparticles of which clouds are composed; t
PRECIPITATION6
M A R I T I M E M E T E O R O L O G Y
Wh t th f ti i i

8/19/2019 Maritime Meteorology
http://slidepdf.com/reader/full/maritime-meteorology 57/266
Whatever the formation process rain is nappreciable vertical extent. The greater the
larger the raindrops. Thus drizzle may fall frWhen the droplets are large and heavy
motion of air they will commence to fall. will continue to increase in size due to colluntil they fall as rain from the base of the
Some evaporation takes place in the w
cloud base; if the falling drops are large enwill reach the surface.The dark vertical or trailing streaks of
base of a cloud, and which do not reacfallstreaks.
Classification of rainThere are three main types:
1 Convectional rain
Associated with unstable atmosphere, highrate in the lower levels due to strong
particularly during the hottest hours of theSea surface temperatures undergo very the course of a day (see Chapter 2), but relatively very warm sea surface will oftenin the form of isolated showers, sometimespecially in tropical regions.
2 Orographic rainThis occurs when a moisture-laden airstremountains, and is thus forced to rise to helevel. It is usually heaviest on the weathe

8/19/2019 Maritime Meteorology
http://slidepdf.com/reader/full/maritime-meteorology 58/266
Snow and sleet
Formation
When water vapour condenses at temperforms minute ice crystals which, during theup a growth of feathery crystals forming sn
The size of snowflakes depends on temthe ice crystals do not unite to form snowlower levels of the cloud where the temperthe temperature the smaller the snow flake
For snow to reach the ground, air temlower than 3.5°C (38°F). Above about 3°C mixture of snow and rain or of melting sndepends mainly on the temperature of the
In very cold weather heavy snowfall canHeavy snow can also seriously affect visibil
Hail
Hail falls from cumulonimbus cloud in the
shapes and is often associated with thundeFormation
Vigorous convection currents may carryGlossary) up to a height where ice crystalsstrong updrafts. The ice particles grow in sizthe supercooled water drops which freeze in
pellets of white opaque ice (called soft haenough they will commence to fall and con
On entering the lower levels of the cloulittle above 0°C (32°F) they may encou
M A R I T I M E M E T E O R O L O G Y
Si f h il t

8/19/2019 Maritime Meteorology
http://slidepdf.com/reader/full/maritime-meteorology 59/266
Size of hailstones
On reaching the surface the size of hailstoextent of the cloud in which they are upcurrents within it. Usually they measure In some hot, moist regions of the world haiweighing 1 to 2 kg have been reported.
Glazed frost
This, as the name suggests, is a layer of iwhen surface temperatures are below 0°C ‘cold spell’.
Rain or drizzle falling from the cloud freeze immediately on contact with the co
coating everything with smooth clear ice.This form of ice can also be produced objects. The term ‘black ice’ is also used toon a road surface, the temperature of whconfused with black frost (see Glossary).
Sea spray The most dangerous form of icing encountefreezing onto the vessel. Ice from this sourcan pose a severe threat to stability, partiweight will reduce a vessel’s freeboard and problems with lifesaving appliances, antenn
frozen.Sea water freezes at about –2°C (28.5°this, sea spray landing on the superstructurice. Significant amounts of spray are not
h F 5 d th t f i i i

8/19/2019 Maritime Meteorology
http://slidepdf.com/reader/full/maritime-meteorology 60/266
Hoar frost
A deposit of thin ice crystals or frozen dew have fallen below both dew point and 0°C
RimeWhen suspected water droplets of fog stelephone wires, ship’s masts, rigging anbelow 0°C they freeze on impact forming
A good example of ice accretion

8/19/2019 Maritime Meteorology
http://slidepdf.com/reader/full/maritime-meteorology 61/266
A thunderstorm is one of the more spectapotential dangers to the mariner are its soreduce visibility to zero; sudden squalls of
radio communications (known as ‘atmosphof damage to magnetic compasses if the event). The causes of a thunderstorm’s formmore violent when the weather is relativelyranean, for example, a violent thunderstocreating serious difficulties for any ship t
dangerous to a small vessel, especially if shthunderstorms may occur at any time of thfront, due to cold air undercutting warmeroccasion in any case.
Causes of thunderstorms
The conditions necessary for the formation
Cumulonimbus cloud with precipitatioi h
THUNDERSTOR7
Given the necessary conditions, as abov

8/19/2019 Maritime Meteorology
http://slidepdf.com/reader/full/maritime-meteorology 62/266
Given the necessary conditions, as abov
High surface temperature. Little surface wind. ‘Trigger action’, such as:
(a) Horizontal convergence of surface (b) Orographic uplift of moist air.(c) Frontal uplift, eg a cold front.
(d) Insolation over land.(e) Advective heating or (f) Any combination of the above.
Heavy rain and hailThe formation of hail is described in Chaprain, which is also a frequent feature of thsimilar processes within the cumulonimalthough often present within the cumulreach the ground on all occasions.
Lightning and thunder
The intense activity within a Cb cloud reselectrical charges. Scientific investigations hthunder cloud is charged with positive elenegative. Near the base there is often a sma
Lightning flash
This is an electric spark on a gigantic scale, (estimated to be millions of volts) which ta
M A R I T I M E M E T E O R O L O G Y
sound of the explosive report has to trav

8/19/2019 Maritime Meteorology
http://slidepdf.com/reader/full/maritime-meteorology 63/266
p plightning path to the observer and there m
Light travels very rapidly and can be ttaneously, but the sound travels at 335 msecond). The distance to a thunderstorm cthe time in seconds between seeing the fsound. The distance in miles is found bydistance in kilometres is found by dividing
When the lightning stroke takes place beclear space between two clouds, its main visible to the eye and is called forked liobscured by cloud, so that the emitted lilightning.
There are various theories as to the meof charges within a Cb cloud. Most of thembut it is thought that several of the chargiin addition, there are other electrical proceunderstood.
Types of thunderstorm
Heat thunderstormsThese develop over land in warm, moist surface heating and convection. Surface airobserver positioned in advance of the storagainst the wind). In temperate latitudes ton late afternoons or evenings of war
Mountainous islands in the tropics are espe
Coastal thunderstorms
This type can occur in any season, by day o
8/19/2019 Maritime Meteorology
http://slidepdf.com/reader/full/maritime-meteorology 64/266

8/19/2019 Maritime Meteorology
http://slidepdf.com/reader/full/maritime-meteorology 65/266
General characteristics
Bad visibilityBad visibility may be due to the presence i(a) visible moisture in the form of liquid
which is invisible) or(b) solid particles such as dust, smoke or se
Good visibilityGood visibility is favoured by air temperaunderlying surface and by strong winds.
Terminology
When the horizontal visibility lies betweenmist or haze are used – the former only wh
to the presence of moisture and the latter wfog is applied when the visibility, irrespect(about 0.5 nautical mile).
VISIBILITY8
Types of fog

8/19/2019 Maritime Meteorology
http://slidepdf.com/reader/full/maritime-meteorology 66/266
Types of fog
In order of the most likely frequency at sea
Advection or sea fog Frontal fog Radiation fog Arctic sea smoke
Advection fog
This is the most widespread type likely to bby relatively warm air being cooled by flow
latter will be below the dew point of the abe between 4 and 16 knots (between ForThere are only certain localities where suchOne is off the Grand Banks of Newfoundlacauses a decrease in sea temperature. Theflowing over this is cooled below its dew p
The English Channel is often affected by winds reach the British Isles from the AzoreIn ocean regions, well away from shallo
face temperature changes very little throuGenerally the daily change in sea surface t
It is possible to estimate the likelihood o
vations of air temperatures, wind directioknowledge of sea temperatures to be expecOcean Routeing Charts give information fo
M A R I T I M E M E T E O R O L O G Y
Frontal or mixing fog

8/19/2019 Maritime Meteorology
http://slidepdf.com/reader/full/maritime-meteorology 67/266
Frontal or mixing fog
This may occur along the boundary when twUsually associated with either a warm fronmeets warm moist air; hence it is normallylatitudes. It is caused by the evaporationwhich in turn cools the air through which i
Radiation fogThis forms over land, most frequently durinland, especially if it is damp and marshy aclear skies. Under these conditions the lanthe air close to the ground, possibly to belobreeze blowing (up to 5 knots), this will ca
to the surface and condensation in the forwind will cause the cooling to be diffused the dew point will not be reached.
Since cold air is heavier than warm avalleys. Although it never actually forms oland for several miles but seldom extends f
Cloudy skies overnight will reduce the eor even re-radiate heat back to the surfacunder these conditions.
Radiation fog will be most dense aroufairly rapidly as the land warms.
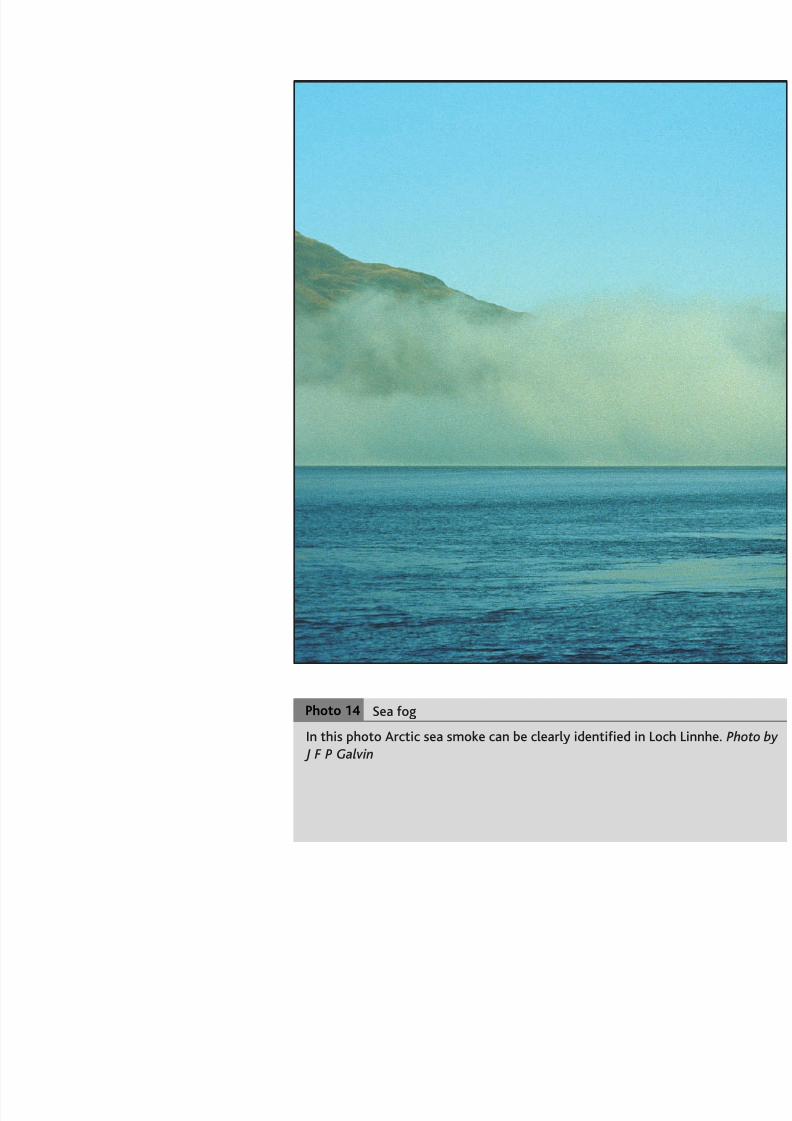
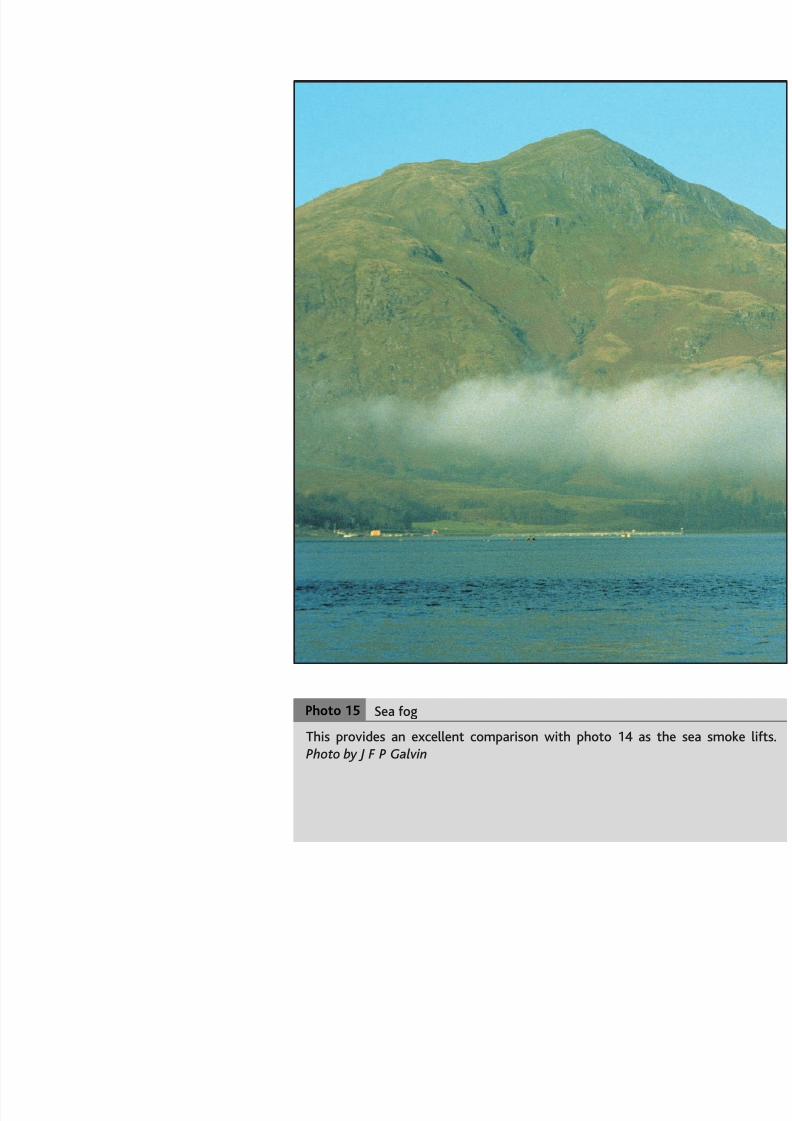
Arctic sea smoke

8/19/2019 Maritime Meteorology
http://slidepdf.com/reader/full/maritime-meteorology 68/266
Arctic sea smoke
This is a type of fog occurring close to the cold – probably at least 9°C below the sea stion takes place from the relatively warm condensation takes place, giving the effect of
It is most common in Arctic and Antarctalso occur off the eastern coasts of contine
and over inland seas and lakes. This is onassociated with strong winds since it requi
Mist, dust and haze
Visibility which is impaired but is more tha– when caused by water droplets and when
95%. When caused by smoke or dust particCauses of the latter range from forest fi
dust or sand storms which may be experiesuch as off the West African coast or off theblow off the land.
Sand storms may extend up to 100 miles
problem for the mariner.
Sound signals in fog
The very conditions which create fog maydirection from which another ship’s fog sstrength. The watchkeeper must therefore attempting to estimate either the distancedirection.
Use of radar in fog
M A R I T I M E M E T E O R O L O G Y
QUESTIO
8/19/2019 Maritime Meteorology
http://slidepdf.com/reader/full/maritime-meteorology 69/266
1 Differentiate between fog, mist and h
2 What are the necessary conditions fo
3 Good visibility is favoured by a large is this so?
4 Describe the conditions which are moradiation fog.
5 (a) In which seasons does radiation fwhy.
(b) How may radiation fog affect the
6 At what time of day is radiation fog
why.7 Describe the nature and topograph
favourable for the formation and per
8 Discuss the effects of smoke on visib
9 Define the term ‘advection’.
10 What are the conditions necessary fo
11 What is the cause of Arctic sea smok
Q

8/19/2019 Maritime Meteorology
http://slidepdf.com/reader/full/maritime-meteorology 70/266
Atmospheric pressure
Atmospheric pressure at any level (height abof air which lies above that level. It follows, height increases; for example, atmospheric p5,500 metres (18,000 feet) is generally abou
Surface pressure at any one point varie1,012 hPa at sea level.
Units of barometric pressurePressure may be expressed in ‘inches’ or ‘cethe height of a column of mercury (under is required to balance atmospheric pressuris expressed in hPa or millibars.
Isobars
An isobar is a line, drawn on a weather charequal barometric pressure. Isobars are spacdepending on the scale of the chart. The
bl t g i d fi it t
ATMOSPHERIC AND WIND9
M A R I T I M E M E T E O R O L O G Y
Relationship between wind direction and
Th h i t l di t f t

8/19/2019 Maritime Meteorology
http://slidepdf.com/reader/full/maritime-meteorology 71/266
The horizontal pressure gradient force acts
is not the only force acting upon the air. Ththis produces an effect upon the motion of at the Earth’s surface. The path of the air ain the northern hemisphere and to the Calculation of this effect is simplified by usforce, to represent the effect of the Earth’s
At heights of 600 metres or more abovsurface friction can be ignored. If the isopressure gradient force is balanced by the
wind blows parallel to the isobars (see Figu
Fig 9.1
A T M O S P H E
Buys Ballot’s Law
If in the northern hemisphere an observer

8/19/2019 Maritime Meteorology
http://slidepdf.com/reader/full/maritime-meteorology 72/266
If, in the northern hemisphere, an observer
his right hand than on his left (see Figure 9southern hemisphere.
In latitudes within 5° of the equator the wind flows straight across the isobars and
Relationship between pressure gradient
The pressure gradient is the change in pdistance is measured perpendicular to thegradient the closer the isobars and the strodescribed as steep when the isobars are closwidely spaced.
The geostrophic wind speed
This may be found by means of a geostrophweather chart, or else by means of a scale
M A R I T I M E M E T E O R O L O G Y
At the surface the angle between the wnature of the surface over which the wind

8/19/2019 Maritime Meteorology
http://slidepdf.com/reader/full/maritime-meteorology 73/266
nature of the surface over which the wind
about 10° to 15° over the sea.Diurnal variation of wind speed at the su
This is caused by diurnal variation in convecconvection currents are strongest, the retdiffused through a greater depth of turbuleThus the reduction in surface wind force is l
of turbulence is shallow, the retarding effecforce is less. The diurnal variation of wind s
Effect of temperature on surface
Fig 9.4

8/19/2019 Maritime Meteorology
http://slidepdf.com/reader/full/maritime-meteorology 74/266
M A R I T I M E M E T E O R O L O G Y
661 ⁄ 2° cold
8/19/2019 Maritime Meteorology
http://slidepdf.com/reader/full/maritime-meteorology 75/266
Fig 9.6
231 ⁄ 2°
661 ⁄ 2°
231 ⁄ 2°
cold
Temperate
Temperate
WARM
N pole
High
High
High
Low
Low
60°N
35°N
35°S
0°
A T M O S P H E
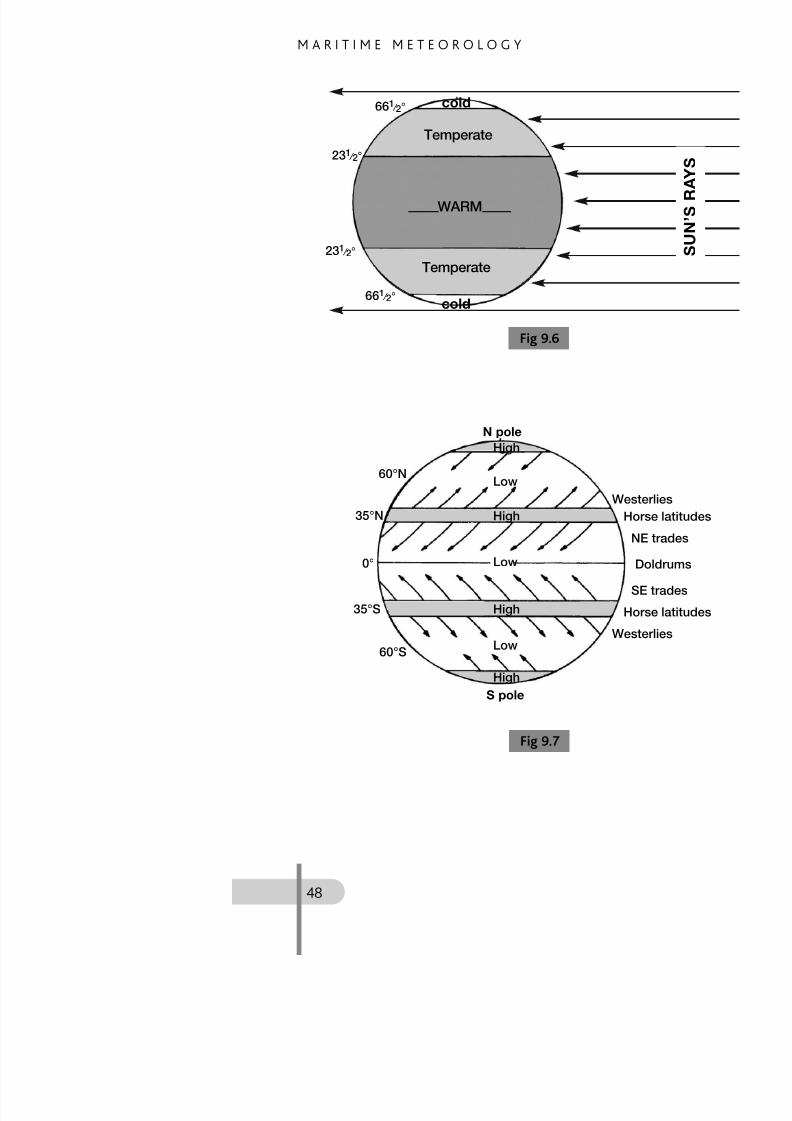
Wind circulation on the Earth
The idealised wind pattern illustrated in Fig
8/19/2019 Maritime Meteorology
http://slidepdf.com/reader/full/maritime-meteorology 76/266
The idealised wind pattern illustrated in Fig
to the presence of the continental land matemperature variations over the continsignificant in the northern hemisphere. Thtotal land area in comparison to the greacirculation more nearly conforms to the id
World pressure distribution and pFigures 9.8 and 9.9 show the mean distpressure for the months of January and Julythough much broken up in the summerrecognisable in both figures, with the highsthe oceans. These oceanic highs move nor
annual movement of the sun. Take specialAsia and compare the general flow of isobathe North Atlantic and North Pacific. Beashow mean pressures for their respectivdistribution locally on any particular day different from those illustrated.
The prevailing winds of the ocean
The prevailing winds of the oceans conformseason and follow Buys Ballot’s Law. Thehemisphere, show a similarity to those desare, however, only mean winds and consilocally from time to time. Ignoring, for the mIndian Ocean, there is a definite clockwiseNorth Pacific and North Atlantic, and an anP ifi d S th Atl ti Th f tfl
M A R I T I M E M E T E O R O L O G Y

8/19/2019 Maritime Meteorology
http://slidepdf.com/reader/full/maritime-meteorology 77/266
A T M O S P H E

8/19/2019 Maritime Meteorology
http://slidepdf.com/reader/full/maritime-meteorology 78/266
M A R I T I M E M E T E O R O L O G Y
however, that in the South Atlantic the SE the equator throughout the whole year.

8/19/2019 Maritime Meteorology
http://slidepdf.com/reader/full/maritime-meteorology 79/266
Winds of the temperate zonesWesterly winds predominate on the polewthe winds of the temperate zones are sudirection and force, because they are in thedepressions and anticyclones which generasouthern hemisphere the westerlies blow
consistency and frequently attain gale forRoaring Forties.
The Intertropical Convergence Zone (ITC
This band of convergence is due to the mesouthern hemispheres. This fluctuates seaso
small in some areas of the ocean and very separation between the NE and SE Tradeeastern sides of the Atlantic and Pacific Ocvariable winds and calms are known ascharacterised by very heavy convectionastormy areas are easily identified on sateNorth Atlantic remain north of the equato
the western sides of the oceans the Trade wone another and finally become easterly in
Monsoons
Large land masses become heated in summ
chapter, pressure becomes low over the landtakes place in winter. The resulting wind circtheir particular seasons and are calledmonsoons occur over southern and eastern
A T M O S P H E

8/19/2019 Maritime Meteorology
http://slidepdf.com/reader/full/maritime-meteorology 80/266
M A R I T I M E M E T E O R O L O G Y

8/19/2019 Maritime Meteorology
http://slidepdf.com/reader/full/maritime-meteorology 81/266
The south-west monsoon season is fromthe Indian Ocean it blows as a strong wind
A T M O S P H E

8/19/2019 Maritime Meteorology
http://slidepdf.com/reader/full/maritime-meteorology 82/266
its long passage over the warm sea it picksgives very heavy orographic rain on the cyclones occur in the Indian Ocean andbeginning and end of the south-west mons
In the China Sea this summer monsooOcean and the rainfall is comparatively slbetween south and east rather than southparticularly in October.
In northern winter a large anticyclone is east monsoon, which blows from October tthe summer monsoon), extends over the Ncrosses the equator gradually backing to th‘north-west monsoon’. In the North India
usually brings fine and clear weather. Alongthe pressure gradient is steep and the winds in the China Sea and along the South Chinweather with mist or fog occur. From Februfor over a week. The local name for these and Glossary.)
When reading the following refer to Figurpressure distribution for January and July,
Northern Australia and Indonesia. Windnorth-westerly in summer.
West coast of Africa – Gulf of Guinea. AJune to September The effect extends fr
Examples of other
M A R I T I M E M E T E O R O L O G Y
Land and sea breezes
8/19/2019 Maritime Meteorology
http://slidepdf.com/reader/full/maritime-meteorology 83/266
The principal wind systems of the worldvarious reasons but due mainly to the uneqsea. Land and sea breezes (a diurnal effect) opronounced in countries where solar heatinin temperate latitudes during warm summ3 and may extend 10 to 15 miles on eitherthey sometimes reach Force 5 and may be
The most favourable conditions for lanthat is with clear skies and very light windsmonths the land heats up rapidly during thThe warm air over the land rises and is replasea. This sea breeze generally becomes apwarm weather may commence earlier if co
At night the process is reversed; the tempeappreciably, whereas the land cools rapidly down. The air, cooled by contact with thheavier and gravitates down the slope of ththe sea is displaced by the land breeze andback to the land, thereby completing the c
weaker than the sea breeze, but its effect catrying to make port under sail. In tropical ais almost routine.
Being local and temporary, land and seato the general pressure gradient. If the exisunfavourable it will completely mask the lawind force along the coast may be considerfavourable .
(See Anabatic and Katabatic winds in th
A T M O S P H E
Local win

8/19/2019 Maritime Meteorology
http://slidepdf.com/reader/full/maritime-meteorology 84/266
The following list gives the names and lwinds’. A brief description of each is given
Bise Southern France
Bora Eastern Adriatic
Crachin China SeaEtesians Aegean Sea
Föhn Swiss Alps. The same effect occurs
Haar Eastern Scotland and eastern parts
Harmattan North-west Africa
Kaus Persian Gulf
Khamsin Egypt and North African coast
Kharif Gulf of Aden
Leste Madeira and North Africa
Levanter Strait of Gibraltar Leveche South-east coast of Spain
Libeccio Northern Corsica
Maestro Adriatic Sea
Marin Gulf of LyonsMistral North-west coast of Mediterrane
Norther Gulf of Mexico
M A R I T I M E M E T E O R O L O G Y
QUESTIO

8/19/2019 Maritime Meteorology
http://slidepdf.com/reader/full/maritime-meteorology 85/266
1 What is the relationship between win(a) Surface level and(b) In the free atmosphere?
2 (a) Account for the diurnal variation of (b) Why is it negligible over the sea?
3 Define:(a) The geostrophic wind.(b) The gradient wind.
4 Describe and explain, with the aid of a atmospheric pressure and wind circulsurface temperatures in adjacent regio(a At the surface.(b) At upper levels.(c) Give two notable examples.
5 Write notes on the following:(a) Trade winds.(b) Winds of the temperate zones.
6 Describe the characteristic weather of7 In which regions of the Atlantic and
located?
8 Land and sea breezes:(a) Explain how they are caused.(b) In which middle-latitude season are(c) What type of pressure system is m
ment? Why?(d How might a sea breeze modify t
d l l f h
8/19/2019 Maritime Meteorology
http://slidepdf.com/reader/full/maritime-meteorology 86/266
Introduction
Whenever the wind blows over the surfaceforce of the wind creates waves in the wawind, the higher will be the waves. In thedepends also upon the depth of the watebeen blowing and the ‘fetch’ which is the diover which the wind has blown. All this harrangement for the mariner because, as enables him to estimate the force of the w
Sea waves and swell
Waves caused directly by the wind blowiknown as sea waves. By contrast, swell wtime beforehand by winds blowing in an are
In the vicinity of the observer both the cucalm but there may be experienced a distinwave length in proportion to its height. Theor simply swell. They often have an oily ap
SEA AND SW10
For any individual wave it can be shown th
Length L in metres = 1.56 x Period T2
d k d
M A R I T I M E M E T E O R O L O G Y

8/19/2019 Maritime Meteorology
http://slidepdf.com/reader/full/maritime-meteorology 87/266
Speed C in knots = 3.1 x Period T
For example, given a period of 10 secondmetres and its speed will be 31.0 knots.
The steepness of a wave is described by The height is not specifically related to th
steepness exceeds about 1 in 13 the wave
Wave trochoids
Although each wave has a forward motionsurface moves in a circular orbit of whichheight (see Figures 10.1 (a) and (b)). The re
of each particle is forward and at the trowave’s motion. Below the surface the wadiminishing in size with the depth until, atthere is practically no motion due to thedescribed as a trochoid. Quite simply, a troctraced out if some kind of marker were to b
if the wheel was then rolled along a flat sillustrated in Fig 10.1 (a) would be produce
This shows in elevation a cross-sectnumbered arrows indicate the motion of a the surf ace, as the wave form progresses10.1(b) shows that the cork describes a circ
from its mean position at the centre of the rapidly with depth.
Wave complications

8/19/2019 Maritime Meteorology
http://slidepdf.com/reader/full/maritime-meteorology 88/266
Wave groups
Wind-generated waves travel in groups, w
overtaking smaller waves. This fact is impseas. The behaviour of a vessel depends to and pitch.
When the period of roll is less than the p
A simple wave form.Fig 10.1(a)
Resulting motion of a cork on thFig 10.1(b)
M A R I T I M E M E T E O R O L O G Y
Wave dimensions
A f i d f 2 d ld hh d d h l h

8/19/2019 Maritime Meteorology
http://slidepdf.com/reader/full/maritime-meteorology 89/266
A wave of a period of 2 seconds would havthe period were 10 seconds the length wwaves could be expected to have maximu12 metres respectively. A long swell, howeva period of 15 seconds and length of abou0.3 metres or so. The maximum wave heig
The size of waves depends also on the d
are short and steep but if the wind continuthey gradually become longer, and their heRoaring Forties for example are generated virtually unlimited fetch.
Ocean waves in shoaling water
When an ocean wave comes into shallow the wave length, its speed and length is resame, but the wave breaks when the depth approaching a beach at an oblique angle a so that the advancing edge or front becimportant to remember that in relatively sthe North Sea and the Baltic, although the wdimensions, they are at times steep and sh
Tsunami
These waves were also known as tidal wav
tides. Their cause is sudden, large-scale moviolent motion caused by earthquakes, vwhich are produced have small heights aocean and travel very rapidly away from t
Investigate http://www.tsunami.noaa.govand their effects.
id l

8/19/2019 Maritime Meteorology
http://slidepdf.com/reader/full/maritime-meteorology 90/266
Tidal streams
A tide flowing against the wind (weather tup and break at the crest. A lee tide tends t
Tidal races can be hazardous as the seas areas are indicated on charts and in sailing d
arrive from several directions with little wexperienced in some tidal races (eg the Pocan make it very difficult to con low-powe
Freak waves
When swell and waves are moving in diffewaves may arrive simultaneously at one unusual height in an otherwise moderatsimilar manner will produce what has been
Very steep and dangerous waves are sowesterly winds off the east coast of Souvicinity of the Aghulas Current and its insh
are still continuing into the apparent compships, including large bulk carriers, which it icause.
Information about wave performance ifollowing purposes:
1 To assist in the preparation and issue o
Practical value of

8/19/2019 Maritime Meteorology
http://slidepdf.com/reader/full/maritime-meteorology 91/266
SWELL WAV
Description

8/19/2019 Maritime Meteorology
http://slidepdf.com/reader/full/maritime-meteorology 92/266
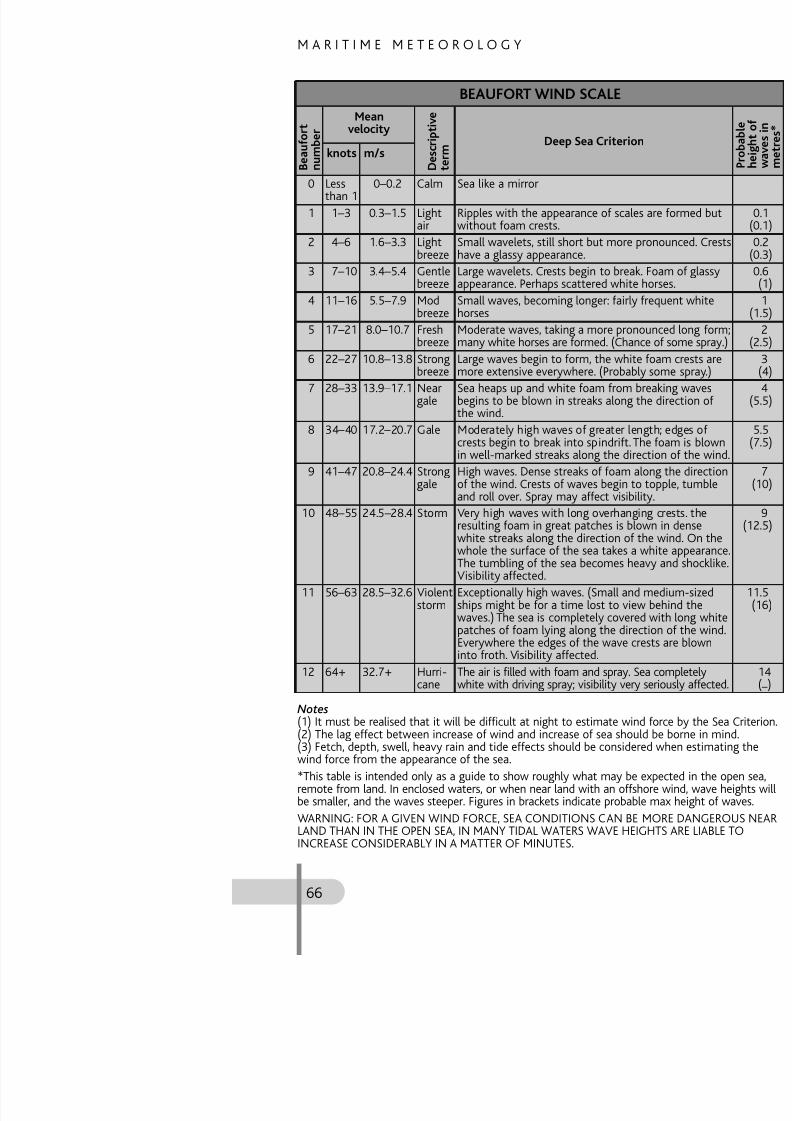
The Beaufort scale
This was first produced by Admiral Beaufodistinguished and long-serving hydrographepractical means of estimating the force of thsea. Originally the categories were relatedvarious categories of sailing ships of the perioconditioned man-of-war could just carry ssails’. Although these criteria no longer appeBeaufort for the same wind strength – ‘Larfoam crests are more extensive everywhere.
Watchkeepers should thoroughly fami
Wind speeds are stated for a height of 10 m
State of sea photographs for esti
0 No swell1 Short or medium
Weak 2 Long3 Short
4 Medium Moderate5 Long6 Short7 Medium High8 Long
G
}
}}
M A R I T I M E M E T E O R O L O G Y
BEAUFORT WIN
Mean
velocity Deefor
t
ber rip t i v e
8/19/2019 Maritime Meteorology
http://slidepdf.com/reader/full/maritime-meteorology 93/266
velocity Deeknots m/s
0 Lessthan 1
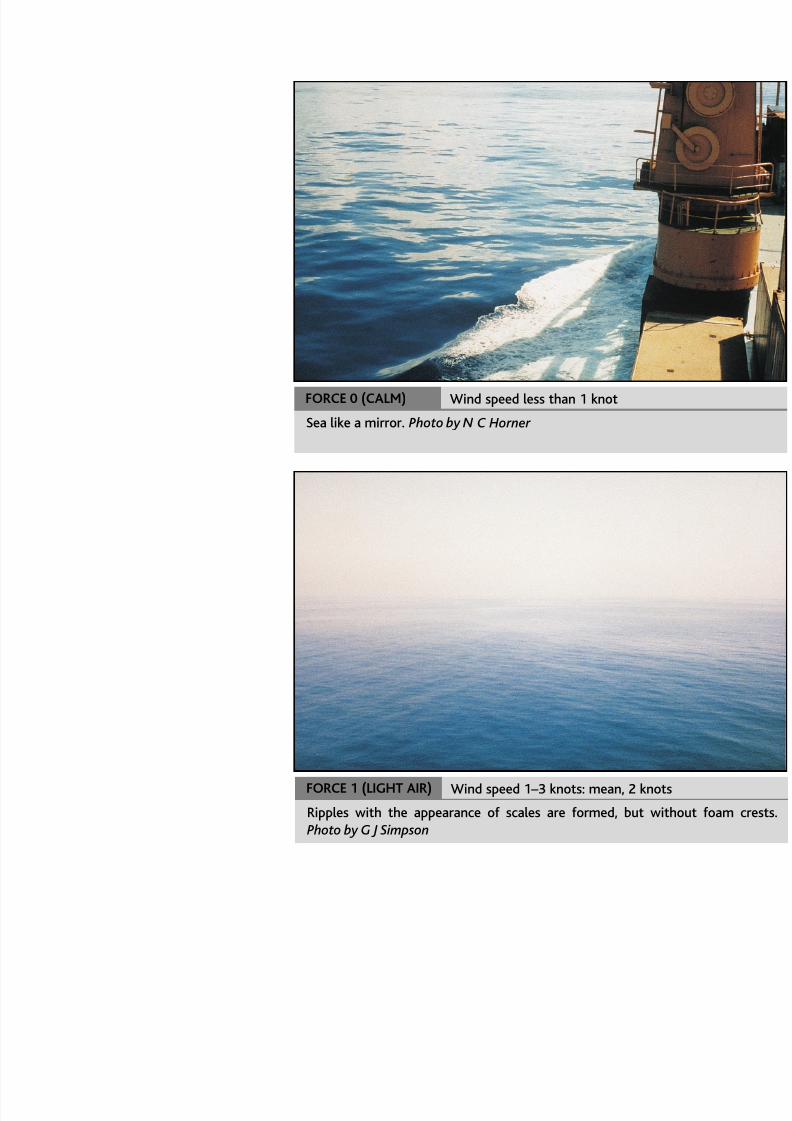
0–0.2 Calm Sea like a mirror
1 1–3 0.3–1.5 Lightair
Ripples with the appewithout foam crests.
2 4–6 1.6–3.3 Lightbreeze
Small wavelets, still shave a glassy appeara
3 7–10 3.4–5.4 Gentlebreeze
Large wavelets. Crestsappearance. Perhaps s
4 11–16 5.5–7.9 Modbreeze
Small waves, becominhorses
5 17–21 8.0–10.7 Freshbreeze
Moderate waves, takimany white horses are
6 22–27 10.8–13.8 Strongbreeze
Large waves begin to more extensive every
7 28–33 13.9–17.1 Near gale
Sea heaps up and whbegins to be blown inthe wind.
8 34–40 17.2–20.7 Gale Moderately high wavecrests begin to break
in well-marked streak9 41–47 20.8–24.4 Strong
galeHigh waves. Dense stof the wind. Crests ofand roll over. Spray m
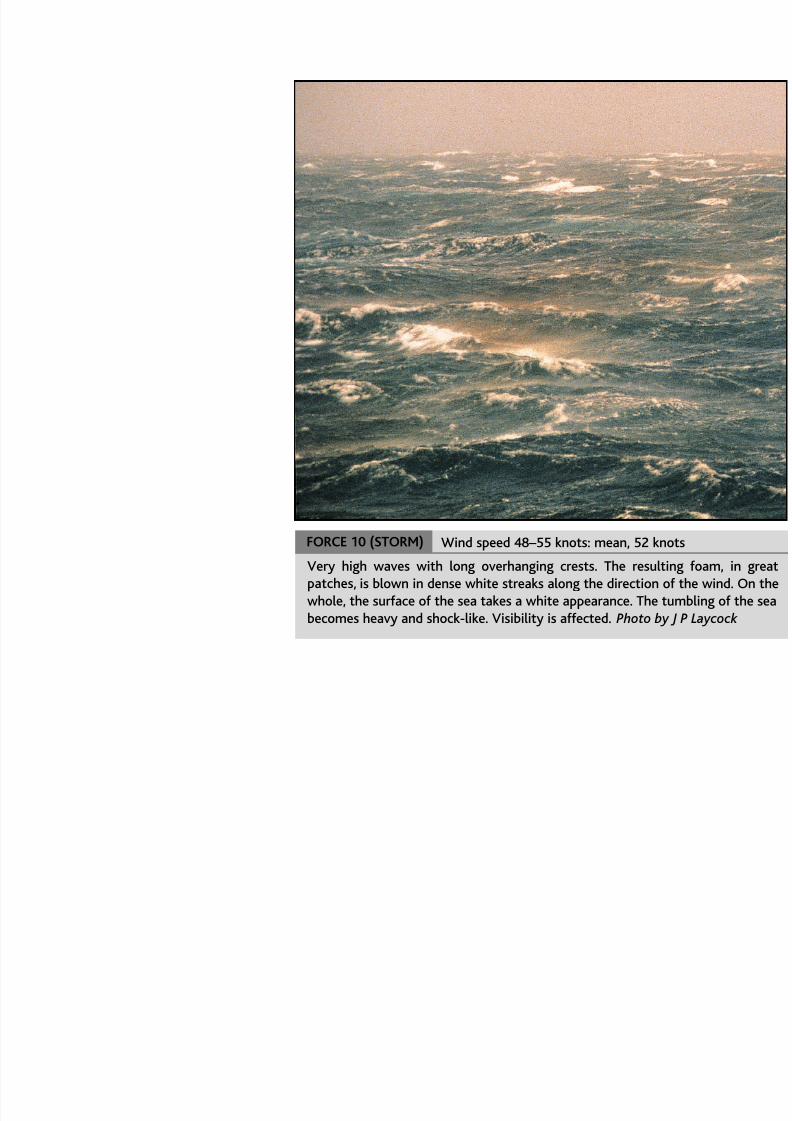
10 48–55 24.5–28.4 Storm Very high waves withresulting foam in greawhite streaks along thwhole the surface of
The tumbling of the sVisibility affected.
11 56–63 28.5–32.6 Violentstorm
Exceptionally high waships might be for a twaves ) The sea is com
B e a u f o r
n u m b e r
D e s c r i p
t e r m
Very few ships carry an anemometer, and twind aboard a moving ship. What is neededand the Beaufort scale provides the best observation

8/19/2019 Maritime Meteorology
http://slidepdf.com/reader/full/maritime-meteorology 94/266
observation.The line of sight at right angles to the w
true direction of the wind.Both these observations are relatively ea
on a dark night, especially with light windsexperience and common sense are needed
face or wetted finger, first of all to determrelative wind. If the ship’s speed is (say) 15there is a 15 knot wind from right aft. If th15 knots from abeam, then the true wind(fresh breeze). This can be solved fairly simbeing the ship’s course and speed, another
relative wind, the third side will be the dir(See Marine Observer’s Handbook, suppliedto all British Selected ships and containingtrue wind by inspection.)
Woods Hole Oceanographic Institutehttp://www.whoi.edu/ which offers a great d
1 Define each of the following terms inPeriod, Height, Speed.
2 If the wave period (an average of seve5.4 seconds, find its approximate speeknots. Length L = 44 metres.)
QUESTIO

8/19/2019 Maritime Meteorology
http://slidepdf.com/reader/full/maritime-meteorology 95/266
A I R M A S S E S A N
but from the sub-tropical belts. An airstreawind belts is classified as equatorial air. Thmaritime or continental; the former originin character, the latter flowing from dry la

8/19/2019 Maritime Meteorology
http://slidepdf.com/reader/full/maritime-meteorology 96/266
, g yimportant to remember that the historycharacteristics.
The table of Air Mass Classification giveof the world can occasionally act as a sour
Characteristics of an air massThe characteristics of an air mass are gover
1 The ORIGIN which determines tempera
2 The PATH which determines the modsurface. As an air mass moves away fro
characteristics of the surface over whicmoving over a cold sea will pick up moin the layers near the surface.
3 The AGE of an air mass determines characteristics will penetrate.
Modifications to the surface temperature
mass.
CLASSIFICATION OF
Type Abbreviation
Arctic maritime air
Arctic continental air
Am or mA
Ac or cA
M A R I T I M E M E T E O R O L O G Y
Air mass weather
Air mass characteristics are based on th
Cold air mo ing o er a arm s rface

8/19/2019 Maritime Meteorology
http://slidepdf.com/reader/full/maritime-meteorology 97/266
Cold air moving over a warm surface
1 Becomes heated at the surface by conta
2 The warmed air rises, not bodily but in vcurrents), through the colder environmecurrents will go depends on a number Chapter 4.
3 The greater the temperature differencunderlying surface the more vigorous w
4 If the rising air goes high enough and tcumuliform cloud will appear and, with
some precipitation, characteristically in Figure 11.1.)
5 This is called unstable air because vespecially when the air is humid.
6 An unstable air mass is favourable for go
Warm air moving over a cold surface1 Becomes cooled at the surface by conta
2 Surface friction causes turbulent mixingThis diffuses the cooling upwards from a
8/19/2019 Maritime Meteorology
http://slidepdf.com/reader/full/maritime-meteorology 98/266
Wind speed less thaFORCE 0 (CALM)
Sea like a mirror. Photo by N C Horner

8/19/2019 Maritime Meteorology
http://slidepdf.com/reader/full/maritime-meteorology 99/266
Wind speed 4–6FORCE 2 (LIGHT BREEZE)
Small wavelets, still short but more prappearance and do not br eak. Photo by G Ba

8/19/2019 Maritime Meteorology
http://slidepdf.com/reader/full/maritime-meteorology 100/266
Wind speeFORCE 4 (MODERATE BREEZE)
Small waves, becoming longer; fairly frequen

8/19/2019 Maritime Meteorology
http://slidepdf.com/reader/full/maritime-meteorology 101/266
Wind speed 2FORCE 6 (STRONG BREEZE)
Large waves begin to form; the white everywhere. There is probably some spray. P

8/19/2019 Maritime Meteorology
http://slidepdf.com/reader/full/maritime-meteorology 102/266
Wind speed 34–40 knotsFORCE 8 (GALE)
Moderately high waves of greater length; spindrift. The foam is blown in well marke
wind. Photo by W A E Smith
8/19/2019 Maritime Meteorology
http://slidepdf.com/reader/full/maritime-meteorology 103/266
Wind speed 48–55 knFORCE 10 (STORM)
Very high waves with long overhanging cpatches, is blown in dense white streaks alowhole, the surface of the sea takes a white becomes heavy and shock like Visibility is a

8/19/2019 Maritime Meteorology
http://slidepdf.com/reader/full/maritime-meteorology 104/266
Wind speeFORCE 11 (VIOLENT STORM)
Exceptionally high waves. (Small and medilost to view behind the waves.) The sea is patches of foam lying along the direction othe wave crests are blown into froth Visibil

8/19/2019 Maritime Meteorology
http://slidepdf.com/reader/full/maritime-meteorology 105/266
Wind speed greaFORCE 12 (HURRICANE)
The air is filled with foam and spray. The sspray; visibility is very seriously affected. Ph
A I R M A S S E S A N
(1,500 feet) or more depending on the sof the surface.
3 This colder, denser, heavier air forms a said to be stable because it offers resist(S Ch 4 )

8/19/2019 Maritime Meteorology
http://slidepdf.com/reader/full/maritime-meteorology 106/266
(See Chapter 4.)
4 If the air contains enough moisture a layof the turbulence layer. (See Figure 11.2are likely to be clearer.
5 Fog can form in light winds if the tempdew point temperature of the air. Types oin Chapter 8.
6 Poor visibility is favoured by a stable air
Details of specific air mass types
Fig 11.2
COLD SURF
M A R I T I M E M E T E O R O L O G Y
Polar continental (Pc) air
In winter this is a very cold stable airstreamchange takes place during its passage over be expected but, when such an air mass surface evaporation and warming take p

8/19/2019 Maritime Meteorology
http://slidepdf.com/reader/full/maritime-meteorology 107/266
surface, evaporation and warming take pcumuliform cloud, wintry showers may oteristics of polar maritime air. For example, North America becomes polar maritime air the Atlantic Ocean.
In summer the polar continental air mait moves over land which is warmer than asurface heating over long distances, it becomwhich, if it then moves over a cool sea, becfog or low stratiform cloud may form.
Arctic maritime (Am) air
Originates over ice and snow surfaces aBecause of its low temperature the moistpicked up over the sea as warming takes pbecomes similar to that of polar maritimintense in character, because the differenceis more marked than in polar maritime air.form and squally showers of rain or hail oc
Arctic continental (Ac) air*
This is similar in character to polar contine
Tropical maritime (Tm) air
Warm and very moist air moving into highewhich becomes progressively cooler. Awidespread advection fog, or low stratifortered. Orographic rain at high coastlines
A I R M A S S E S A N
the sea its temperature is higher than thasome moisture is picked up, there is generabecause convection is arrested at a low l
originating in desert regions may carry quamiles, thus hazy conditions are not uncom
8/19/2019 Maritime Meteorology
http://slidepdf.com/reader/full/maritime-meteorology 108/266
ymass. (See Figures 11.3 and 11.4.)
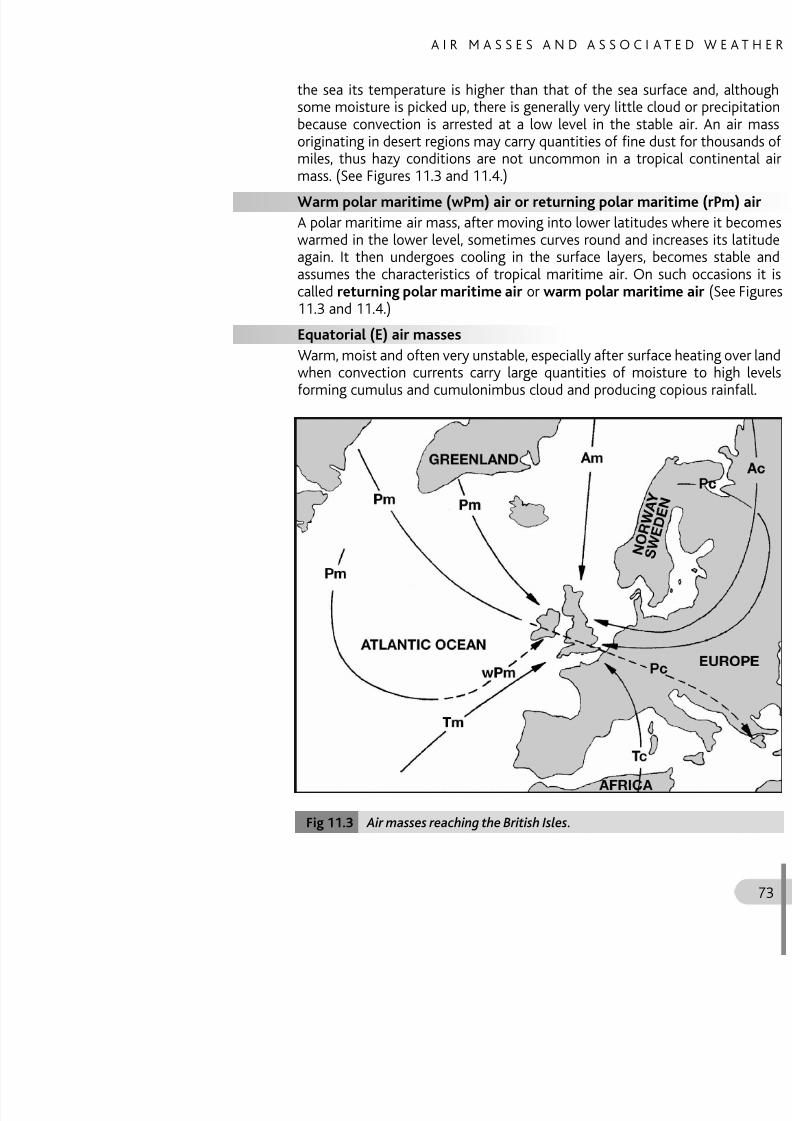
Warm polar maritime (wPm) air or retur
A polar maritime air mass, after moving int
warmed in the lower level, sometimes curvagain. It then undergoes cooling in the sassumes the characteristics of tropical macalled returning polar maritime air or wa11.3 and 11.4.)
Equatorial (E) air masses
Warm, moist and often very unstable, especwhen convection currents carry large quaforming cumulus and cumulonimbus cloud
M A R I T I M E M E T E O R O L O G Y

8/19/2019 Maritime Meteorology
http://slidepdf.com/reader/full/maritime-meteorology 109/266
A I R M A S S E S A N
1 Define the term air mass.
2 In which parts of the world are the prinf d?
QUESTIO

8/19/2019 Maritime Meteorology
http://slidepdf.com/reader/full/maritime-meteorology 110/266
found?
3 Describe the characteristics of the foonly: Pm, Pc, Am, Ac, Tm, Tc, E.
4 Describe the weather generally assotemperate latitudes when moving ove(a) The sea and increasing latitude.(b) Hot land in summer.(c) Cold land in winter.
5 Describe the typical characteristics
latitudes.6 Describe the path taken by a Pm air m
Isles from the Atlantic Ocean as a wPm
7 Classify an air mass whose source regDescribe its initial characteristics and
it moves eastwards across the Atlantic
ISOBARIC PA12

8/19/2019 Maritime Meteorology
http://slidepdf.com/reader/full/maritime-meteorology 111/266
Out of seven characteristic isobaric pattweather systems which are fundamental – – the remainder being either outward extenarea between them.
These seven distinctive isobaric forms a
Depression Anticyclone Secondary depression Trough Ridge or wedge Col Straight isobars
Depressions, fronts and anticyclones are chapters.
( )
12
8/19/2019 Maritime Meteorology
http://slidepdf.com/reader/full/maritime-meteorology 112/266
especially near the centre of the system, governed mainly by the steepness of the pcontent of the surface air, but there are oth
Despite the availability of official weatmariner to be able to recognise the precuknow the weather sequence, shift of wind, eapproach, passage and retreat of a well def
of the ship may well depend on such knowThe term depression is commonly appli
outside the tropics but may also be used to
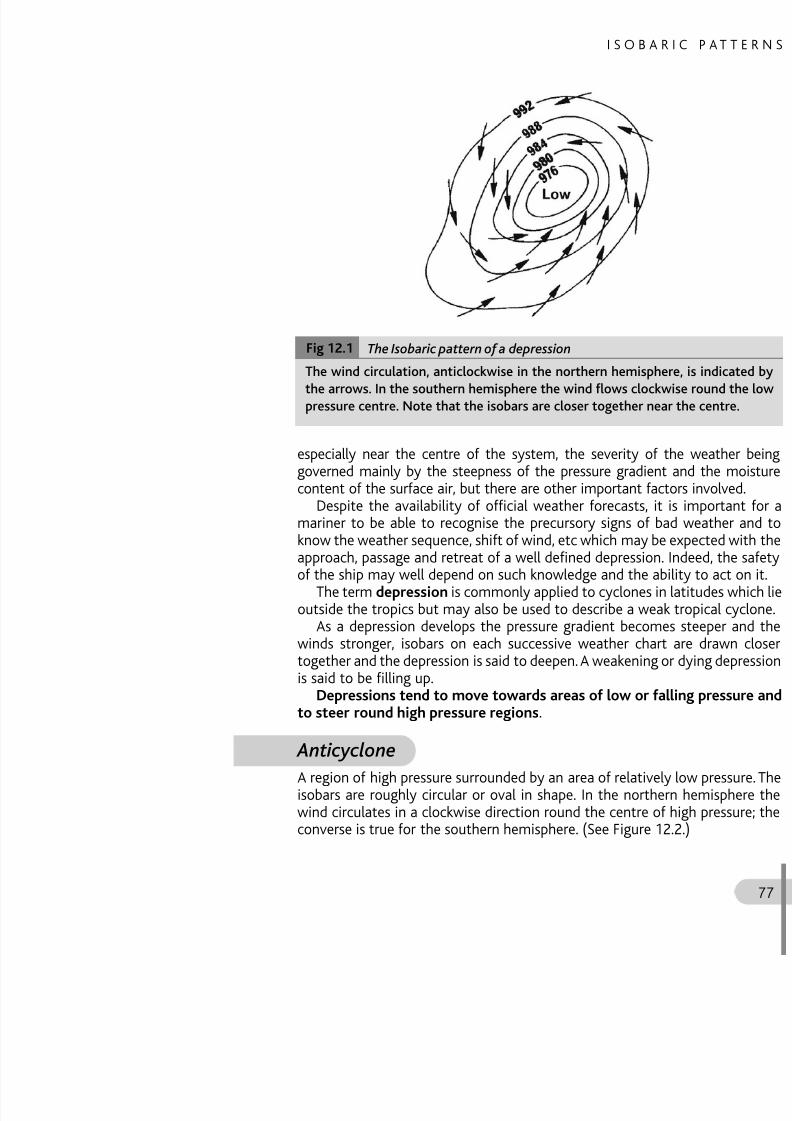
The Isobaric pattern of a depressioThe wind circulation, anticlockwise in the n
the arrows. In the southern hemisphere the
pressure centre. Note that the isobars are cl
Fig 12.1
M A R I T I M E M E T E O R O L O G Y

8/19/2019 Maritime Meteorology
http://slidepdf.com/reader/full/maritime-meteorology 113/266
General characteristics
The pressure gradient is slight, winds are
usually quiet, dry and settled. Land and sea especially during the warmest months of th
In summer the weather is generally dryouter portions of the system it is often clo
In winter the weather may be one of tw
(a)Cloudless sky with sharp frosts at nigh(b)The sky completely covered by stratu
misty weather may persist for some d
Anticyclone
The wind circulation, clockwise in the north
arrows. Note that the isobars are more widpressure and that the surface wind tends to
Fig 12.2
of the primary. The secondary in Figure 12pressure at its centre than the primary secondary depressions often develop inthan their primaries.

8/19/2019 Maritime Meteorology
http://slidepdf.com/reader/full/maritime-meteorology 114/266
Trough of low pressure
Primary and secondary depressionFig 12.3
M A R I T I M E M E T E O R O L O G Y

8/19/2019 Maritime Meteorology
http://slidepdf.com/reader/full/maritime-meteorology 115/266
Ridge (or wedge) of high pressure.Fig 12.4
Ridge (or wedge) of high pressur
A wedge-shaped extension of an anticyclone
(See Figures 12.4 and 12.6.) The isobars assthe axis of the ridge. It is generally assocanticyclone often having light winds along

8/19/2019 Maritime Meteorology
http://slidepdf.com/reader/full/maritime-meteorology 116/266
anticyclone, often having light winds along the isobars are sharply curved generally mo
M A R I T I M E M E T E O R O L O G Y
Col
An area of indeterminate pressure located
which are arranged alternately. (See Figuresciated with light variable winds, often thundmisty in winter. In Figure 12.5 the wind ci

8/19/2019 Maritime Meteorology
http://slidepdf.com/reader/full/maritime-meteorology 117/266
misty in winter. In Figure 12.5 the wind cishown by arrows. It is easy to see why the w
Straight isobars
An atmospheric pressure distribution in whparallel straight lines across a large area. outlying portion of a large and distant dep
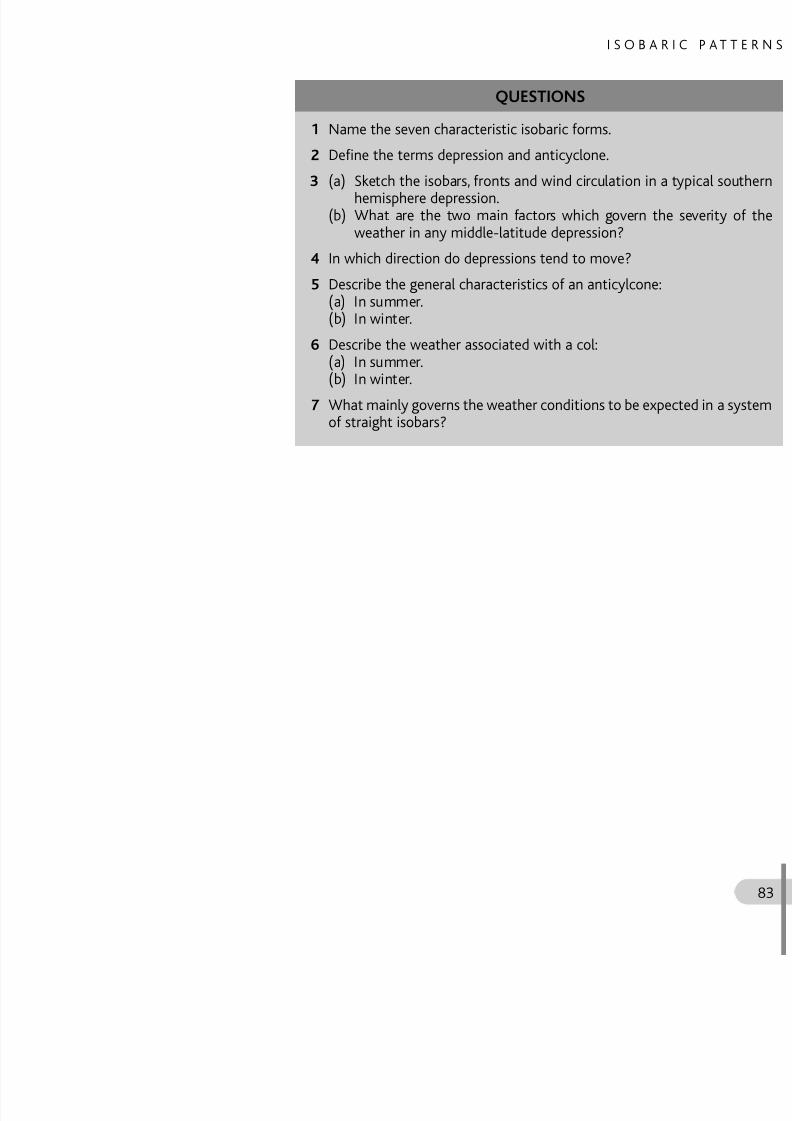
1 Name the seven characteristic isobari
2 Define the terms depression and antic
3 (a) Sketch the isobars fronts and win
QUESTIO
8/19/2019 Maritime Meteorology
http://slidepdf.com/reader/full/maritime-meteorology 118/266
3 (a) Sketch the isobars, fronts and winhemisphere depression.
(b) What are the two main factors weather in any middle-latitude de
4 In which direction do depressions tend
5 Describe the general characteristics of(a) In summer.(b) In winter.
6 Describe the weather associated with
(a) In summer.(b) In winter.
7 What mainly governs the weather conof straight isobars?
FRONTS ANDEPRESSION13

8/19/2019 Maritime Meteorology
http://slidepdf.com/reader/full/maritime-meteorology 119/266
Before proceeding with this chapter it is essebeen read and understood .
Air mass boundaries
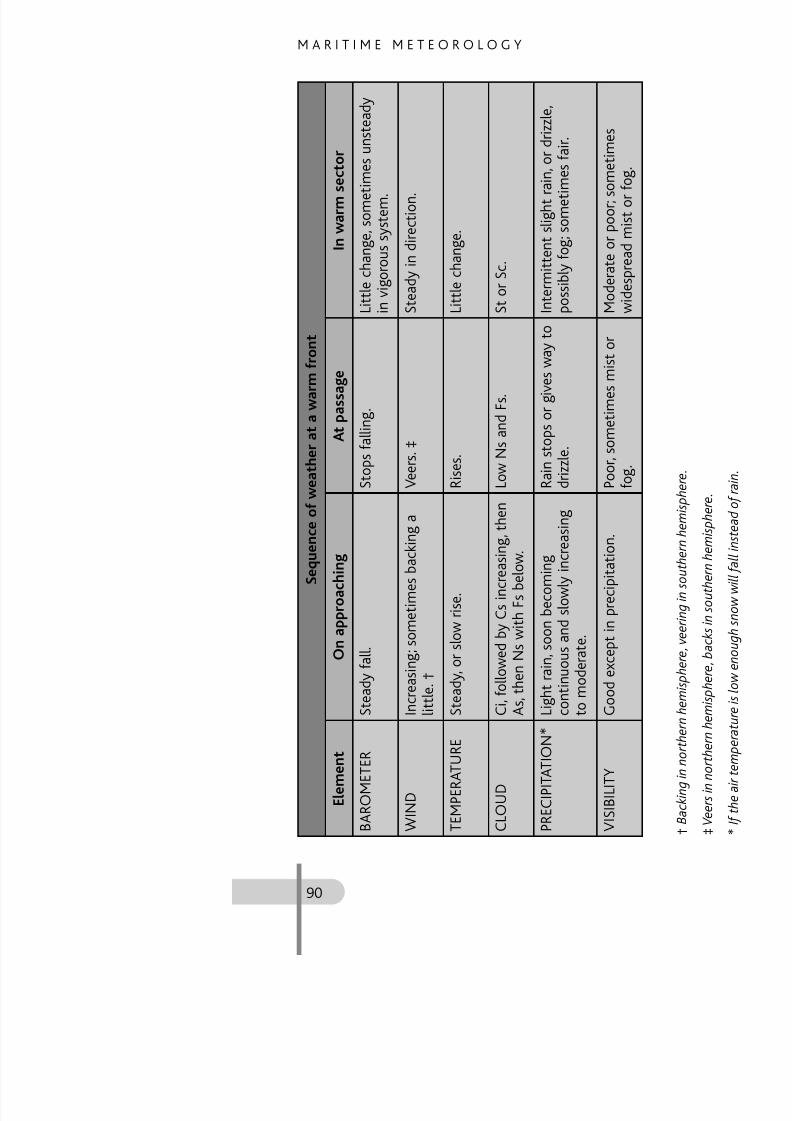
When two air masses of differing charactebut remain separated by a boundary called the air masses does take place but only alonarrow zone of transition often referredboundary is represented on the weather ch
When two airstreams with different temwarmer air tends to override the colder, dentends to undercut the lighter warm air. (Se
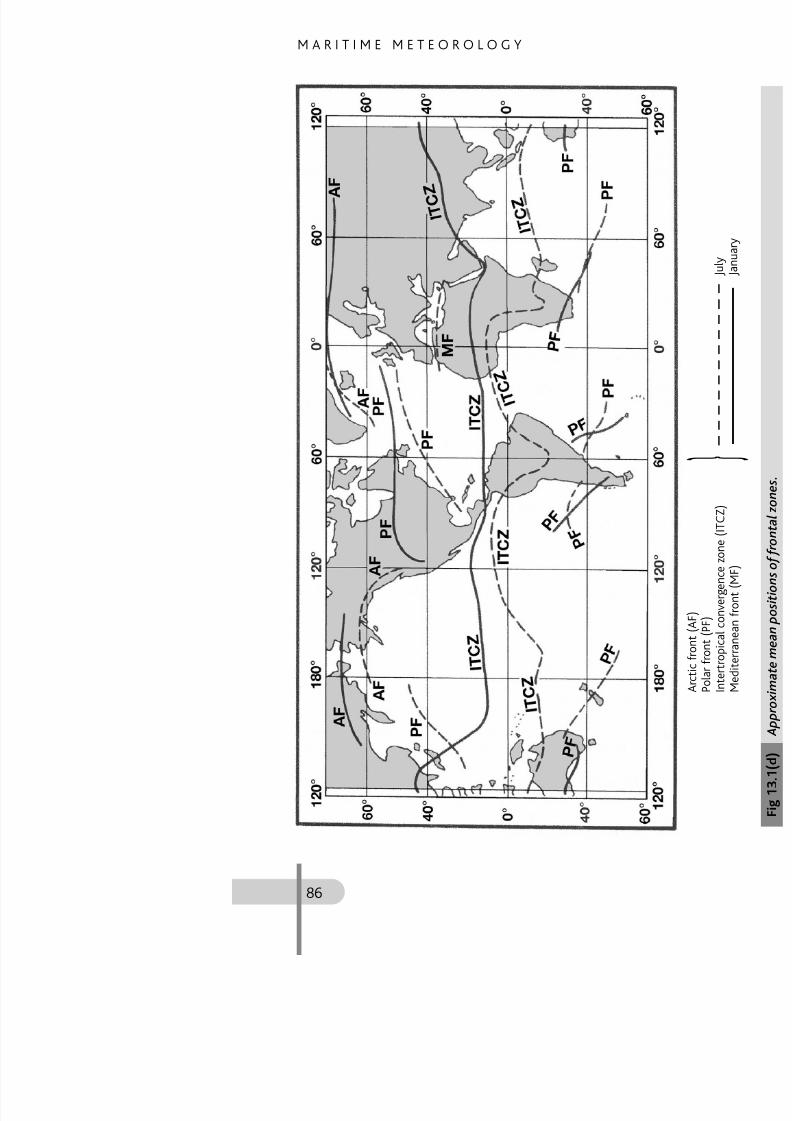
The main frontal zones
The positions of frontal zones marking the b
masses fluctuate constantly whilst their mewith the seasons.
See Figure 13.1 (d) and compare the me
13
F R O N T S A N D

8/19/2019 Maritime Meteorology
http://slidepdf.com/reader/full/maritime-meteorology 120/266
Fig 13.1(a
Vertical section across polar frFig 13.1(b)
M A R I T I M E M E T E O R O L O G Y
8/19/2019 Maritime Meteorology
http://slidepdf.com/reader/full/maritime-meteorology 121/266
F R O N T S A N D
The Mediterranean front
The Mediterranean front exists only in winacross the Mediterranean, separating polaEurope and tropical continental air from N
The intertropical convergence zone (ITC
h l l

8/19/2019 Maritime Meteorology
http://slidepdf.com/reader/full/maritime-meteorology 122/266
The intertropical convergence zone lies witof separation between the NE and SE Tradopposite hemispheres. It was formerly know
term has fallen into disuse, because the greatly in their characteristics and it bears The ITCZ crosses and recrosses the equa
north in the summer. Due to the very lhemisphere the greater part of its length (inequator. Its range of movement is small oveover the continents. Areas of horizontal conday to day in both position and activity cloudy showery weather. (See Figure 13.1 (
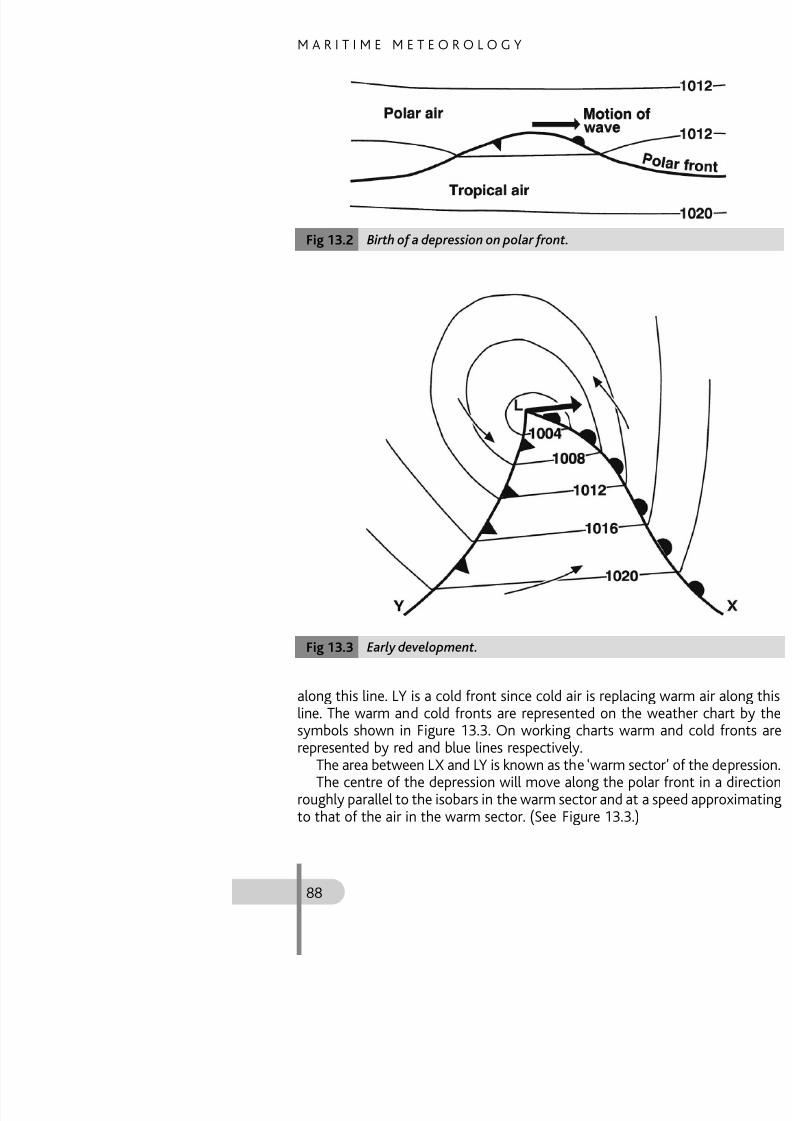
Frontal theory of formation of de
Within the temperate zones cold air flow
warm air moving from sub-tropical regions. a frontal surface which slopes upward overwhich varies from 1 in 40 to 1 in 200. (See
The polar front tends to remain inactivmasses flow parallel to one another but whforced upwards over the cold frontal surfa
of much cloud and precipitation and oftento the formation and development of a frevents is described in the following paragra
Under s itable conditions a small a e
8/19/2019 Maritime Meteorology
http://slidepdf.com/reader/full/maritime-meteorology 123/266
F R O N T S A N D
u s a c e

8/19/2019 Maritime Meteorology
http://slidepdf.com/reader/full/maritime-meteorology 124/266
q u e n c e
a t w a r m
a n
d c o
l d
f r o n
t s s h o u l
d
b e
s t u d i e d
i n
d 1 3
. 5 , r e s p e c
t i v e
l y .
I t i s
i m p o r t a n
t t o r e m
e m
b e r
t h a
t t h e
c h f o l l o w s c a n o n
l y b e
g e n e r a
l ; e v e r y
d e p r
e s s i o n a n
d e v e r y
n o r a i n
a t a
l l , o
t h e r s m a y
h a v e p r e c
i p i t a t i o
n f a r
i n e x c e s s o f
u r e s
d o n o
t a
l w a y s c o n
f o r
m t o
t h e c
l a s s i c e
x a m p
l e s
g i v e n .
A l t o s t r a t u s
A l t o s t r a t u s C
i r r o s t r a t u s
C i r r u
W a r m f
r o n t s u r f a
M A R I T I M E M E T E O R O L O G Y
s e c t o r
t i m e s u n
s t e a d y
r a i n , o r d r i z z l e ,
i m e s f a i r
8/19/2019 Maritime Meteorology
http://slidepdf.com/reader/full/maritime-meteorology 125/266
S e
q u e n c e o f w e a t h e r a t a w a r m f r
o n t
p r o a c h i n g
A t p a s s a g e
I n w a r m
S t o p s f a l l i n g .
L i t t l e c h a n g e , s o m e t
i n v i g o r o u s
s y s t e m .
e t i m e s b a c k i n g a
V e e r s . ‡
S t e a d y i n d
i r e c t i o n .
r i s e .
R i s e
s .
L i t t l e c h a n g e .
C s i n c r e
a s i n g , t h e n
h F s b e l o w .
L o w
N s a n d F s .
S t o r S c .
b e c o m i n g
s l o w l y
i n c r e a s i n g
R a i n
s t o p s o r g i v e s w a y t o
d r i z z l e
I n t e r m i t t e n t s l i g h t r
p o s s i b l y f o g ; s o m e t i
F R O N T S A N D

8/19/2019 Maritime Meteorology
http://slidepdf.com/reader/full/maritime-meteorology 126/266
A l t o s t r
a t u s
A l t o c u m u
l u s
C u m u l o n i m b u s
o r
C u m u l u s
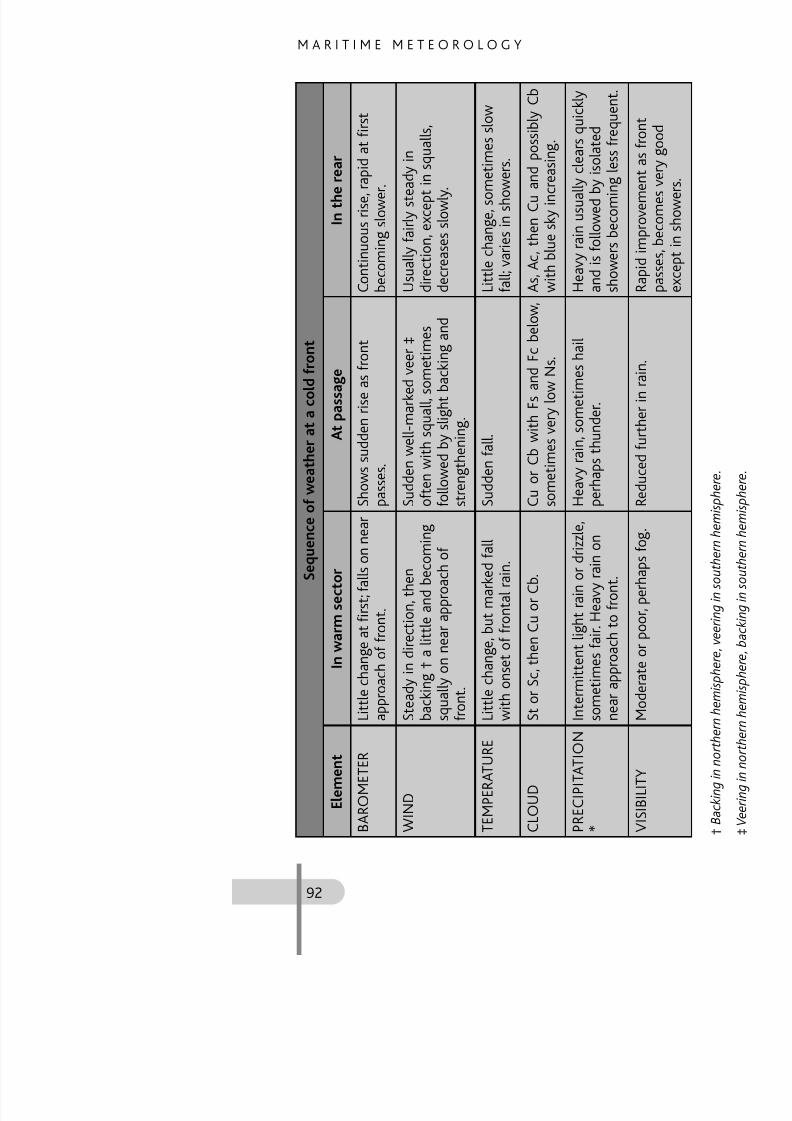
8/19/2019 Maritime Meteorology
http://slidepdf.com/reader/full/maritime-meteorology 127/266
F R O N T S A N D
The occluding of a depression
The cold front advances faster than the wa
commencing at the tip of the warm sector front until the occluding process has beenhas been lifted off the ground. Figures 13.occluding process. Note that the symbol fo

8/19/2019 Maritime Meteorology
http://slidepdf.com/reader/full/maritime-meteorology 128/266
occluding process. Note that the symbol fothose used for warm and cold fronts. Orepresented by a purple line.
M A R I T I M E M E T E O R O L O G Y

8/19/2019 Maritime Meteorology
http://slidepdf.com/reader/full/maritime-meteorology 129/266
Maturity and dissolution of a dep
The energy to develop and sustain an activefrom the supply of air in the warm sector. Thsector will usually continue to deepen and
often during the early stages of occlusion. the speed and direction of movement of thof the air in the warm sector, instead it beco
Fig 13.7
F R O N T S A N D

8/19/2019 Maritime Meteorology
http://slidepdf.com/reader/full/maritime-meteorology 130/266
Pressure tendency and Isallobar in Glo
Fig 13.8(a
Vertical section across warm ocFig 13.8(b)
COLD
WARM
A B C
M A R I T I M E M E T E O R O L O G Y
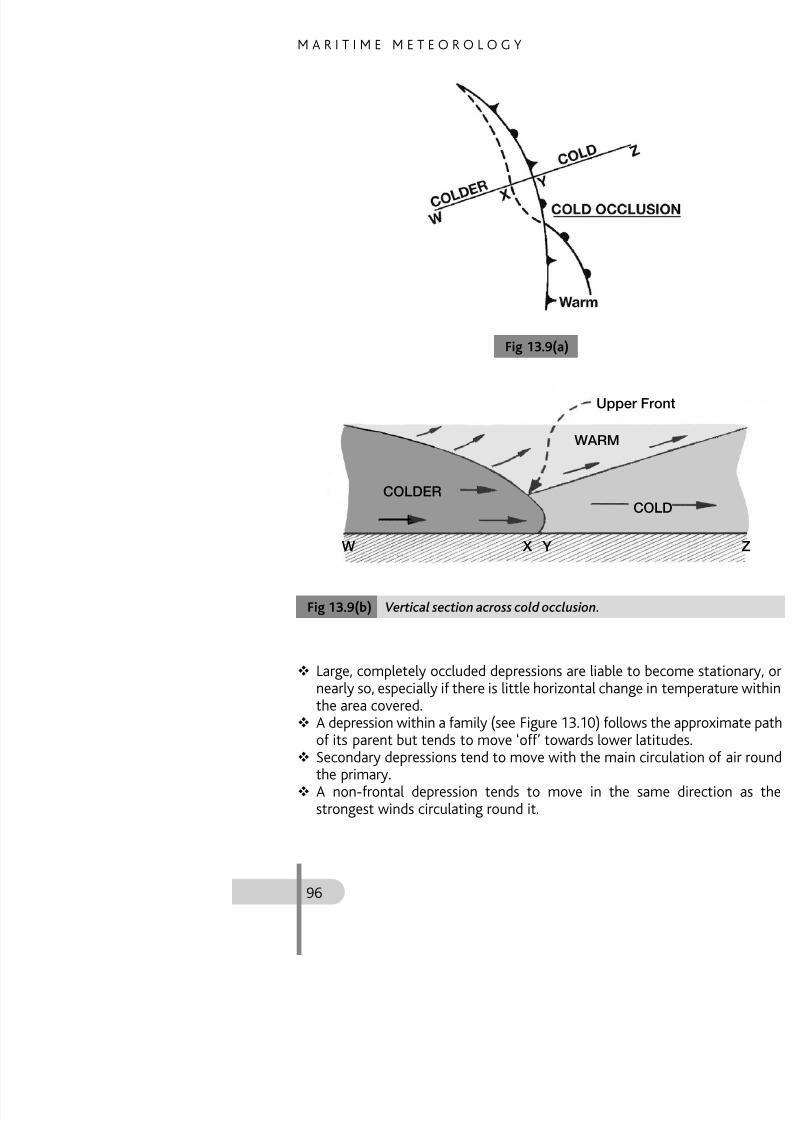
8/19/2019 Maritime Meteorology
http://slidepdf.com/reader/full/maritime-meteorology 131/266
Fig 13.9(a
Vertical section across cold occlFig 13.9(b)
COLDER
W X Y
F R O N T S A N D
The future movement of a depres
This can be estimated by ‘extrapolation’. Th
continue as shown by a succession of synobe taken into consideration, eg the bullet p
A ‘family’ of depressions
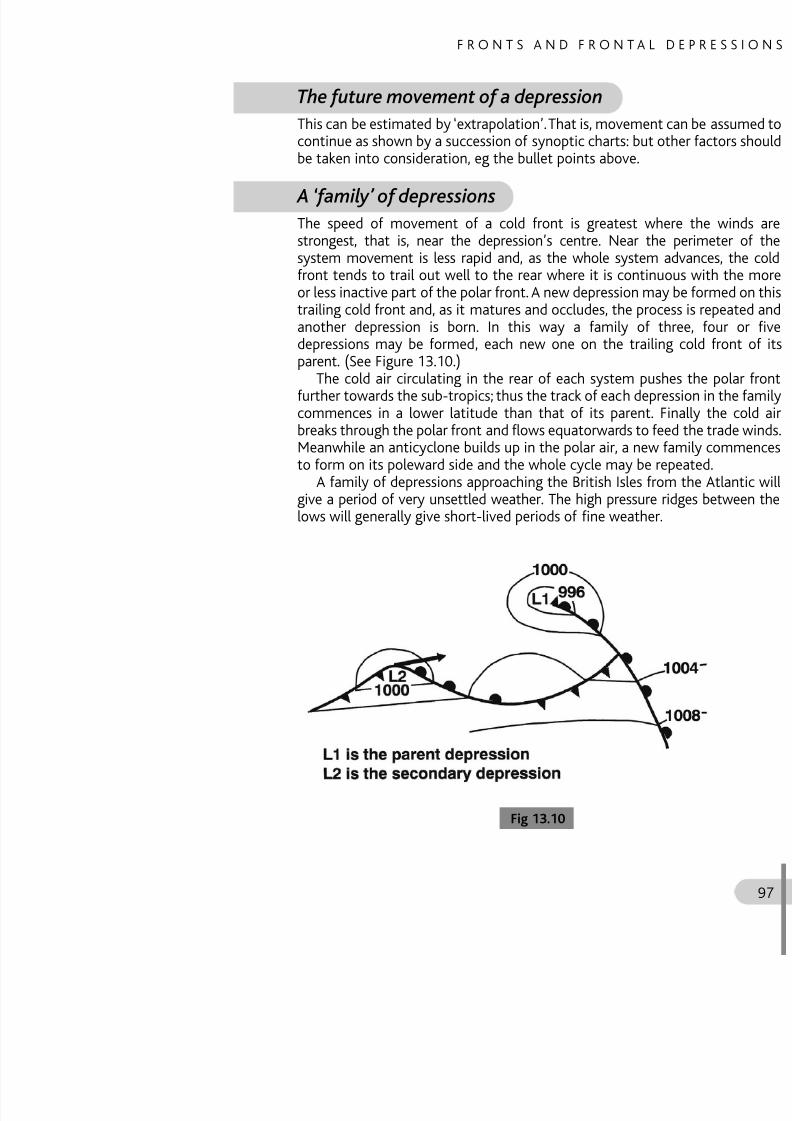
8/19/2019 Maritime Meteorology
http://slidepdf.com/reader/full/maritime-meteorology 132/266
f y f p
The speed of movement of a cold frontstrongest, that is, near the depression’s csystem movement is less rapid and, as thefront tends to trail out well to the rear whor less inactive part of the polar front. A newtrailing cold front and, as it matures and ocanother depression is born. In this waydepressions may be formed, each new on
parent. (See Figure 13.10.)The cold air circulating in the rear of e
further towards the sub-tropics; thus the tracommences in a lower latitude than thatbreaks through the polar front and flows eqMeanwhile an anticyclone builds up in the
to form on its poleward side and the wholeA family of depressions approaching thegive a period of very unsettled weather. Thlows will generally give short-lived periods

8/19/2019 Maritime Meteorology
http://slidepdf.com/reader/full/maritime-meteorology 133/266
F R O N T S A N D
Movement of secondary depress
Secondaries have a tendency to move wi
primary centre. Their speed of movement iin the primary circulation. As a secondarycentre of the primary and eventually absorsecondary develops to about the same size
t ( hi h t th f ‘d b b ll

8/19/2019 Maritime Meteorology
http://slidepdf.com/reader/full/maritime-meteorology 134/266
centres (which together form a ‘dumb-bellabout one another – anticlockwise in the
which form at the occlusion point (Figure the warm sector isobars and sometimes to
M A R I T I M E M E T E O R O L O G Y
1 Name the three main frontal zones an
2 Describe the ITCZ and its associated w
3 Draw simple diagrams, in vertical crosscold air masses at:
( ) A f t
QUESTIO

8/19/2019 Maritime Meteorology
http://slidepdf.com/reader/full/maritime-meteorology 135/266
(a) A warm front.(b) A cold front. Indicate the movem
4 Draw the international symbols used o(a) A warm front.(b) A cold front.(c) An occlusion. How would you kn
direction the fronts are moving?
5 Describe, with the aid of sketches of
growth and development (up to the eapolar front depression.
6 Tabulate the sequence of cloud, wind, w you would expect to encounter whilsunoccluded frontal depression in the Nthe south of the centre, through the w
7 Show, by means of simple sketches in vof the warm and cold air masses at:
(a) A cold occlusion.(b) A warm occlusion.
8 Describe how the movement of a de
tendencies.9 Sketch isobars and fronts in a ‘family
sphere). Describe briefly its formation

8/19/2019 Maritime Meteorology
http://slidepdf.com/reader/full/maritime-meteorology 136/266
M A R I T I M E M E T E O R O L O G Y

8/19/2019 Maritime Meteorology
http://slidepdf.com/reader/full/maritime-meteorology 137/266
Surface heating causes the air to expa This, in turn, gives high pressure at uppe Divergence from the upper high cause
the air column and a fall in barometric Warm air over the island readily ascend
level. Moist air from over the sea surface flo
feeds the ascending air.
Formation of lows and highs.Fig 14.1
N O N

8/19/2019 Maritime Meteorology
http://slidepdf.com/reader/full/maritime-meteorology 138/266
Most thermal lows give heavy showperiods of continuous bad weather. Beware
An instability (polar depression).Fig 14.2
M A R I T I M E M E T E O R O L O G Y
frontal depression. Orographic depressionsgeographical locations. They often form tassociated with the region near Genoa in n
southwards across the Alps.
QUESTIO

8/19/2019 Maritime Meteorology
http://slidepdf.com/reader/full/maritime-meteorology 139/266
1 Describe the formation of:(a) A thermal depression.(b) An orographic depression.
2 Describe the formation and weathedepression.
ANTICYCLO15
8/19/2019 Maritime Meteorology
http://slidepdf.com/reader/full/maritime-meteorology 140/266
The horizontal motion of the air in an anticproperties.
An area of convergence is one in which tthan the horizontal outflow at the same le
which the horizontal outflow exceeds thmotions are accompanied by compensator
Formation
Convergence at upper level increases twithin a limited area. This causes basurface.
In the northern hemisphere the surfround the high pressure area with theacross the isobars towards areas of low
This outflowing surface air is replavertically from above. The downward‘subsidence’.
M A R I T I M E M E T E O R O L O G Y
inversion and is a very stable condition, inarrested at a low level. Since ascending aiformation of cloud and rain, it follows tha
is generally associated with fine dry weath
Types of anticycloneAnticyclones can be classified into two t

8/19/2019 Maritime Meteorology
http://slidepdf.com/reader/full/maritime-meteorology 141/266
anticyclones. The classification is based upair.
Cold anticyclones
Cold anticyclones are ones in which thesurrounding area. They build up over large Siberia where the pressure may reach 1,05over the continent of North America.
The process of formation is the reverse tdescribed therefore as a thermal highthrough a long period in a cold region. Thecontracts vertically leaving a deficiency of aresultant inflow increases the total quantitbarometric pressure increases at surface lecold air produced is very shallow and lies inthis level the air is at ‘normal’ tempanticyclones do not appear on higher level
Upper
Low
WARM Cold
In late winter, a ridge of high pressure progive easterly winds over the British Isles anintensely cold weather. If the air is dry th
frosty but if enough moisture is picked updull and foggy.
Transitory cold anticyclones
These commonly form within a polar ml tit d d i th f f il f d

8/19/2019 Maritime Meteorology
http://slidepdf.com/reader/full/maritime-meteorology 142/266
latitudes and in the rear of a family of ddevelop into intense centres when they m
the summer such systems are generally shAn anticyclone or ridge separating s
normally moves with the depressions.In winter, near coasts where the air is m
the subsidence inversion and accumulatesanticyclonic gloom, particularly in and nea
conditions artificial light is sometimes neceto carry on with normal work indoors. Inlaat night can cause intense radiation coolifrost or radiation fog.
Warm anticyclones
These are anticyclones in which the surfacebut at higher levels the air in these anticsurrounding environment at correspondiidentified on charts through the full depcyclones are formed by the air motion in t
Permanent warm anticyclones
These are the oceanic highs in the sub-trostable and the weather is generally fine visibility. Their average seasonal movemen
M A R I T I M E M E T E O R O L O G Y
Temporary warm anticyclones
These may reach Great Britain as ridges mof the Azores high, or sometimes as separa
then break off from the main system. Infeature of summer than winter and can pe
Temporary warm anticyclones may alssubsidence within a temporary cold high wperiod.
8/19/2019 Maritime Meteorology
http://slidepdf.com/reader/full/maritime-meteorology 143/266
pA warm high often gives bright fine weat
There is a possibility of sea fog at any timeand early summer. In autumn and winter bring radiation fog.
1 Describe (with the aid of a diagram) upper convergence.
2 Describe, in sequence, the processes wanticyclone.
3 Differentiate between warm and cold
4 Explain how a large anticyclone may gmovement of a depression.
5 Describe the general properties of an
QUESTIO
TROPICAL R
STORMS16

8/19/2019 Maritime Meteorology
http://slidepdf.com/reader/full/maritime-meteorology 144/266
A tropical revolving storm (TRS) is a distursmaller in size than a temperate latitude dintensity; the isobars are nearer to true csteep and there are no fronts.
WMO now categorises tropical disturbstrength of the winds associated with the
Tropical depression Beaufort FModerate tropical storm Beaufort FSevere tropical storm Beaufort F
Hurricane Beaufort F
These storms can blow with incredible furyextreme violence and destructive capaciexperience. The near vicinity of the centre dangerous and dramatic weather conditiooccur in all oceans but are extremely rare i
The following notes are only general anTRS i diff t i d t i i t
M A R I T I M E M E T E O R O L O G Y
pre-existing or ‘seedling’ disturbances such or clusters of clouds associated with the In
Tracks
After forming, tropical cyclones generally or south-westerly, according to hemisphabout 20° or more of latitude and then mthe northern hemisphere and south-east recurvature which is the most western po

8/19/2019 Maritime Meteorology
http://slidepdf.com/reader/full/maritime-meteorology 145/266
recurvature which is the most western povertex . (Do not confuse with vortex whic
broad pattern of movement is b y no merratic. (See Figures 16.1 to 16.4.)
The tracks vary considerably and ddistribution existing at the time. They tsubtropical anticyclone. An area of high psufficient intensity, cause the storm to cha
the subtropical highs cause a correspondingaverage latitude of the vertex.
T R O P I
Figures 16.2, 16.3 and 16.4 show some storms. Note that recurvature sometimesstorm will curve right round so as to form
continue along the original path. If two stointeract and rotate around each other.When a storm crosses the coast onto d
rapidly from lack of moisture, but not alcyclones sometimes move across India and
f h i t l b il bl

8/19/2019 Maritime Meteorology
http://slidepdf.com/reader/full/maritime-meteorology 146/266
a fresh moisture supply becomes availablcross the land into the Bay of Bengal.
Some storms reach into temperate latitincreased in size and lost much of their origthe general characteristics of a temperatefronts, or they may become absorbed in thThe lifetime of a tropical cyclone may vafortnight.
NORT
Trop
80°
M A R I T I M E M E T E O R O L O G Y
4 0 °
0 °
8 0 °

8/19/2019 Maritime Meteorology
http://slidepdf.com/reader/full/maritime-meteorology 147/266
P A C I F I C O C E A N
6 0 ° E
1 6 0 ° W
1 2 0 °
T R O P I

8/19/2019 Maritime Meteorology
http://slidepdf.com/reader/full/maritime-meteorology 148/266
I N D I A N O C E A N

8/19/2019 Maritime Meteorology
http://slidepdf.com/reader/full/maritime-meteorology 149/266
T R O P I

8/19/2019 Maritime Meteorology
http://slidepdf.com/reader/full/maritime-meteorology 150/266
Cloud sequence
In a TRS the cloud sequence is normally
cumulus fractus, scud and nimbostratus uwill be a partly clear sky.
Weather
Very heavy rain is a feature of all tropical revto fall as light rain at a distance of about 1the centre approaches, torrential rain, hu
violent squalls and sudden shifts of windthunder and lightning. The sea becomes exfroth and flying spray which mingles with visibility is thus very seriously impaired. Thethis weather close to the centre, will drown
Large seaworthy ships are liable to be
ditions and may sustain heavy damage.As the edge of the eye passes the winceases the seas become mountainous an
Fig 16.
M A R I T I M E M E T E O R O L O G Y
faster than the storm itself and, not infreqresults in disastrous flooding on the coast. days before the arrival of the storm – tha
500 miles away – and continues to rise unfrom the area. The rise of water may be inthe predicted level. The coastal flooding is low lying and when the storm tide arrives
Size of tropical cyclones
8/19/2019 Maritime Meteorology
http://slidepdf.com/reader/full/maritime-meteorology 151/266
Diameters vary from 50 to 1,000 miles and
500; more often than not they are over 10its area as it progresses along its path.
Seasons
These storms develop during the warmest min late summer and early autumn of the a
areas the storms tend to occur at the inter-Formation of tropical cyclones
As yet, the process of the formation ounderstood but research continues and sknown to be favourable are given below.
(a) It is essential that a weak cyclonic short time beforehand; this can ocEarth’s rotation is effective (ie never
(b) An adequate supply of moisture in a(see Chapter 4). The sea surface tem(80°F). These essential conditions exhottest seasons.
(c) Little change in wind direction withh
T R O P I
W o r s t m o n t h s
m o n s o o n : M a y a n
d J u n e ,
d N o v e m
b e r
c t o b e r a n
d N o
v e m
b e r
a n
d S e p
t e m
b e
r

8/19/2019 Maritime Meteorology
http://slidepdf.com/reader/full/maritime-meteorology 152/266
n a m e
S e a s o n
W
J u n e
t o N o v e m
b e r
S e p
t e m b e r
y r a r e
A p r i l
t o J u l y
a n
d
S e p
t e m
b e r t o
J a n u a r y
C h a n
g e o
f m
O c t o
b e r a n
d
A p r i l
t o D e c e
m b e r
b u
t h a v e b e e n
r e c o r d e
d i n a
l l m o n
t h s
J u n e , J u l y , O
c
( B a
g u i o s
n e s )
A l l m o n
t h s ( m a
i n l y J u l y t o
N o v e m
b e r )
J u l y , A u g u
s t a
J u n e
t o N o v e m
b e r
S e p
t e m b e r
is found mostly in the Caribbean, while atextends to the Cape Verde Islands. The tracposition and extent of the permanent Nort
to the American coast a storm may perhathe Caribbean and cross the United Statehurricanes recurve to the north and east ranticyclone. Most of the southern coast of tby these storms. It is not uncommon for a coastline well beyond New York. The averag
M A R I T I M E M E T E O R O L O G Y

8/19/2019 Maritime Meteorology
http://slidepdf.com/reader/full/maritime-meteorology 153/266
y gis about 300 miles per day and their avera
worst month (September) the average hurricane force during an 80 year period wa
Arabian Sea
The areas in which these cyclones originatDuring the SW monsoon (April to July) it is
65°–75°E); in the NE monsoon season it mIsles (9°–14°N, 70°–75°E). Occasional stoBay of Bengal via Sri Lanka. The tracks of their average rate of progress is about 7 kseason (May/June and October/Novemberan average of one storm every two years.
Bay of BengalThe birthplace of these cyclones is also govtends to move with the sun. During the SWsomewhere near the Nicobar Islands (6°–916°N in June; in the NE monsoon season tabout 12°N by November. Some typhoo
enter the Bay via the Thai/Malay Peninsulaof Bengal tend to go to the NW and N; theastward In each of the worst months (O

8/19/2019 Maritime Meteorology
http://slidepdf.com/reader/full/maritime-meteorology 154/266
sometimes they reach the Australian coasbetween 10 and 15 knots. In the worst moduring a 105 year period, the average numone per month every two years.
Diurnal variation of atmosphericof the approach of a TRS
See Chapter 17.
M A R I T I M E M E T E O R O L O G Y
8/19/2019 Maritime Meteorology
http://slidepdf.com/reader/full/maritime-meteorology 155/266
p
1 Draw an annotated diagram of a TRS isobars, wind arrows, track, vertex, eysemicircles, trough.
2 Discuss in general terms the followistorms: latitude of origin, tracks, latitgradient, wind force and direction, spswell.
3 The process of the formation of trop
understood. Describe those conditionto the formation of these storms.
4 In which semicircle of a TRS do the sta reason for your answer.
5 Describe the winds, weather and statewould probably experience with the a
TRS. Assume the storm’s eye is 200 mit will pass over the observer’s positio
QUESTIO
AVOIDANCE
WORST EFFE17

8/19/2019 Maritime Meteorology
http://slidepdf.com/reader/full/maritime-meteorology 156/266
Warning signs
In any locality during the tropical revolvingmust exercise constant vigilance to ensurethe path of a storm. Fortunately nature prothe meteorological services ashore broadca(see Admiralty List of Radio Signals Vol 3)and/or other sources.
The mariner’s aim must be to avoid gehere again nature provides these storms w
have enabled the evolvement of guidance ‘of serious trouble.
Except for the behaviour of the barometsigns, if taken alone, is only an uncertain inBarometer, swell, sky, etc, must be conside
Natural warnings
The barometer In temperate latitudes alarge, rapid and very irregular daily change
M A R I T I M E M E T E O R O L O G Y
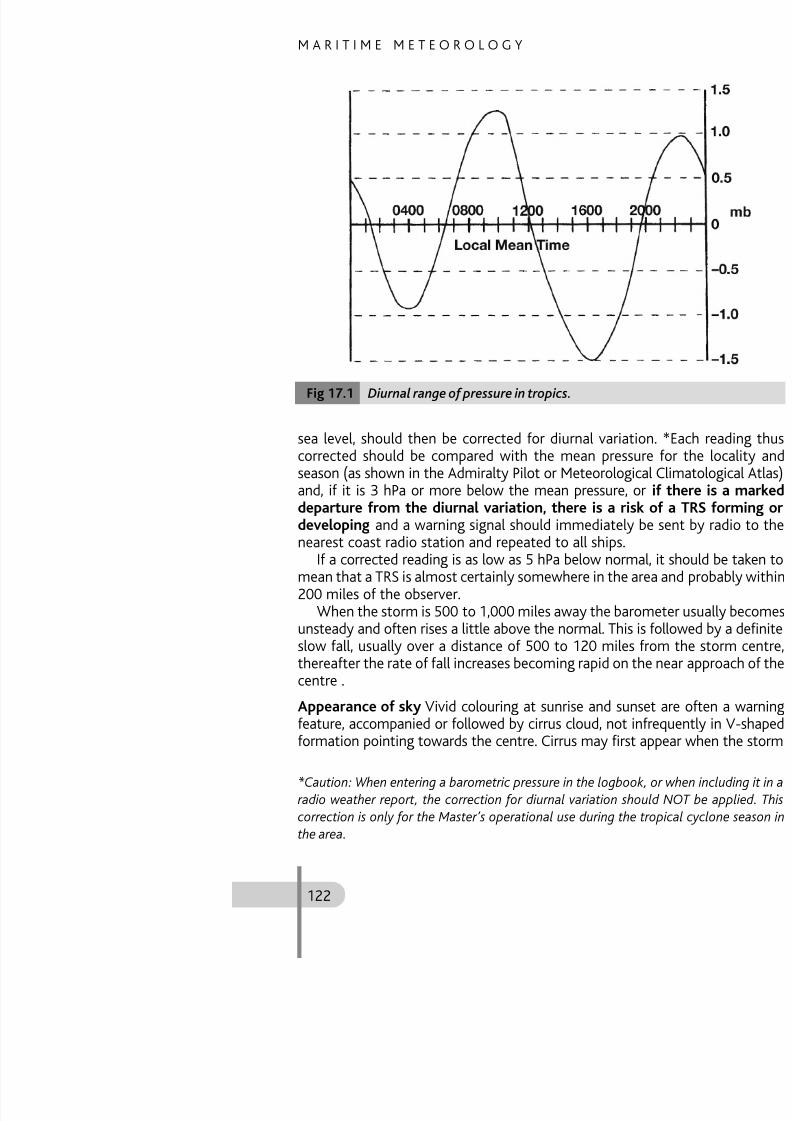
8/19/2019 Maritime Meteorology
http://slidepdf.com/reader/full/maritime-meteorology 157/266
sea level, should then be corrected for dicorrected should be compared with the m
season (as shown in the Admiralty Pilot or Mand, if it is 3 hPa or more below the meandeparture from the diurnal variation, thdeveloping and a warning signal should imnearest coast radio station and repeated to
If a corrected reading is as low as 5 hPa
mean that a TRS is almost certainly somew200 miles of the observer.When the storm is 500 to 1,000 miles aw
Diurnal range of pressure in tropicsFig 17.1
A V O I D A N C E O F T H E W
is from 300 to 600 miles away and is oftenthe early stages of development. Later thercumulus fractus and scud.
Swell There will be a long swell coming froprovided there is no land intervening betswell travels faster than the storm and usand sometimes 1,000 miles from the cenwarning sign.
Visibility Exceptionally good visibility freq
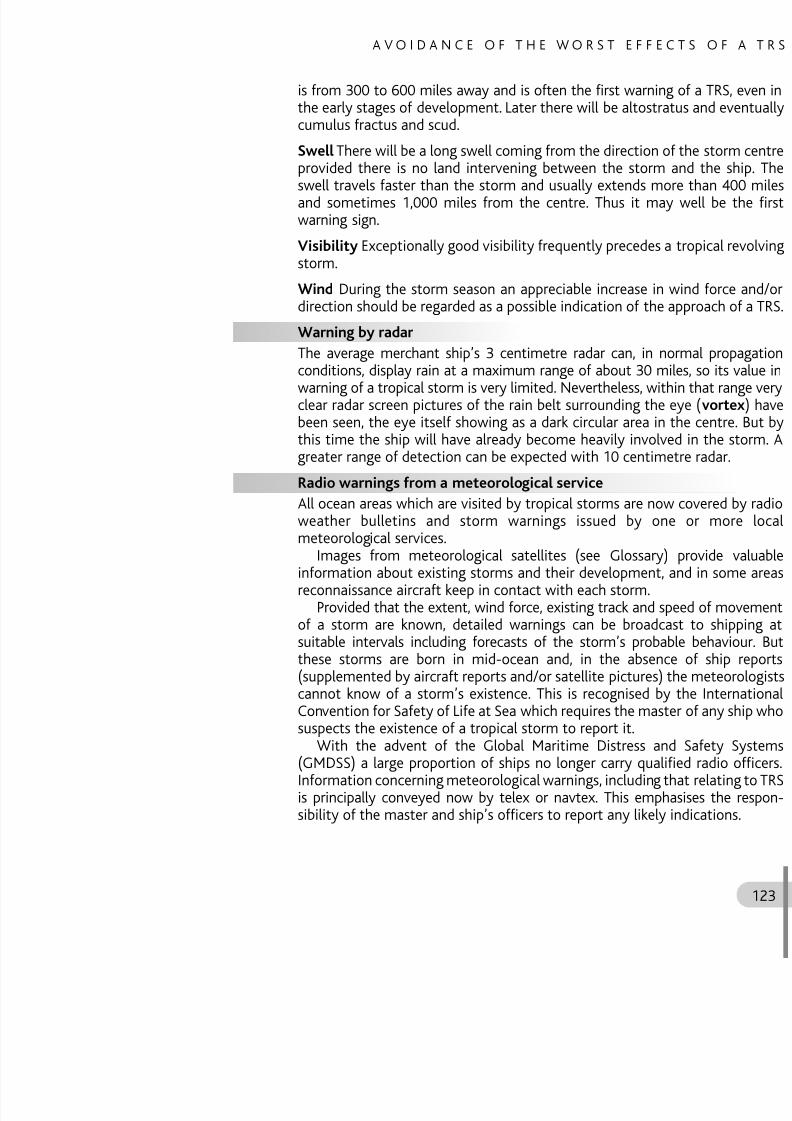
8/19/2019 Maritime Meteorology
http://slidepdf.com/reader/full/maritime-meteorology 158/266
Visibility Exceptionally good visibility freq
storm.
Wind During the storm season an apprecdirection should be regarded as a possible i
Warning by radar
The average merchant ship’s 3 centimetre
conditions, display rain at a maximum rangwarning of a tropical storm is very limited. Nclear radar screen pictures of the rain belt been seen, the eye itself showing as a darthis time the ship will have already becomgreater range of detection can be expected
Radio warnings from a meteorological s
All ocean areas which are visited by tropicweather bulletins and storm warningsmeteorological services.
Images from meteorological satellitesinformation about existing storms and thereconnaissance aircraft keep in contact wit
Provided that the extent, wind force, exi
M A R I T I M E M E T E O R O L O G Y
Master’s action when storm susp
Article 35 of the International Conventionsafety message to be sent as soon as possand broadcast to shipping in the vicinity. S
Storm warningTyphoon seems to be developing. 0840 GBarometer corrected 1,000 hectopascals

8/19/2019 Maritime Meteorology
http://slidepdf.com/reader/full/maritime-meteorology 159/266
p
Wind NW Force 4. Moderate westerly swknots.
Similar reports should be sent at intervals the ship is clear of the storm.
It is in the interest of the reporting shreports be sent also to meteorological authseamanlike precautions should be taken weather.
Practical rules for avoiding the w
As the isobars in a tropical revolving storstorm field has two semicircles which, fo‘dangerous’ and ‘navigable’. (See Figure 17.
The dangerous semicircle
This is the right-hand one in the northern hthe southern latitudes. It is termed dangeroto blow a ship into the path of the advamight recurve and the centre pass over the
A V O I D A N C E O F T H E W
1 Find the bearing of the centre
Use Buys Ballot’s Law (see page 45 and Glothe isobars at an angle of about 45° at the
until nearly parallel with the isobars near centre is on your right in the northern hsouthern hemisphere. Allow about 12 cobarometer reading starts to fall, then 10 poin) and 8 points if it falls 20 hPa (0.6 in) orbe erratic during squalls. The best time for oj t ft ll

8/19/2019 Maritime Meteorology
http://slidepdf.com/reader/full/maritime-meteorology 160/266
just after a squall.
2 Try to estimate the distance from the
As a very rough guide, in the absence ofcentre would probably be about 200 milereading is 5 hPa (0.15 in) below the local n6. If the wind force is 8 the centre is proba
3 Find out in which semicircle the ship
To a stationary observer in either hemisphthe right-hand semicircle and to the left into eliminate the relative motion problem bshould heave-to or stop the ship to findetermine the semicircle .
If the wind veers the ship is in the right-the left-hand semicircle; if it is steady in dthe storm.
The barometer falls ahead of the trouquadrant can also be determined.
4 Try to find the likely path of the stormProvided the ship is either stopped or hovstorm’s probable path can be made by wor
M A R I T I M E M E T E O R O L O G Y
Action to avoid the worst of the s northern hemisphere
Right-hand or ‘dangerous’ semicircle (Fproceed with maximum practical speed wihauling round to starboard as the wind vmake headway, or if the ship is under sail on
Left-hand or ‘navigable’ semicircle (Figu
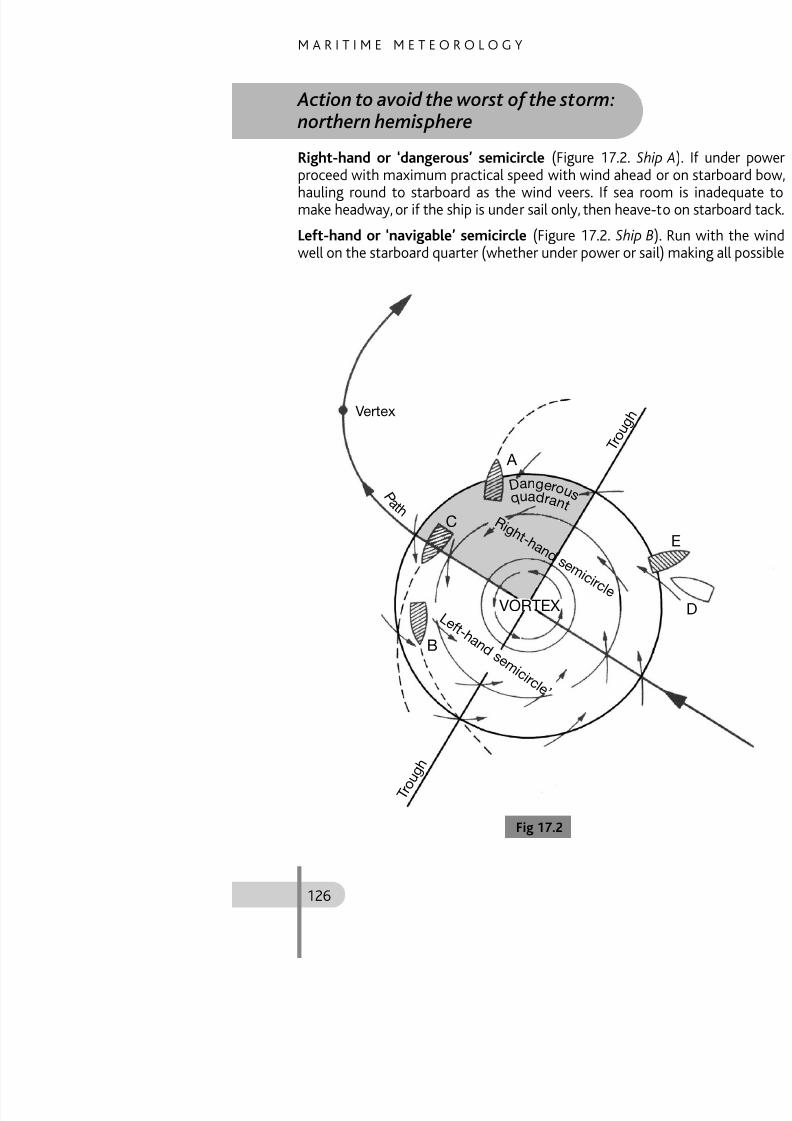
8/19/2019 Maritime Meteorology
http://slidepdf.com/reader/full/maritime-meteorology 161/266
well on the starboard quarter (whether und
Vertex
VORTEX
C
A
P a t h
Dange r o
quad r a n
R i g h t - h a n d s
L
A V O I D A N C E O F T H E W
speed and haul round to port as the wind make headway, heave-to on whichever tunder existing circumstances and condition
In direct path and ahead of storm (Figurestarboard quarter make all possible speeinadequate sea room to do this, it may dangerous semicircle rather than stay in thpossible recurvature.
Vessel overtaking the storm (Figure 17.2.

8/19/2019 Maritime Meteorology
http://slidepdf.com/reader/full/maritime-meteorology 162/266
Vessel overtaking the storm (Figure 17.2.
the fast ships of today. Heave-to; the windbarometer will rise showing that Ship D is insemicircle. She should then get the wind allow the storm to get clear.
If Ship D does not heave-to when the ston course, the barometer will fall and the
lead to an erroneous assumption that she of the trough; if she then proceeds (obeyistarboard quarter she may run into the daoriginal course was converging with the pa
Southern hemisphere – action
Exactly the same principles apply as in thethe wind circulates clockwise the left-hanand the right-hand one is ‘navigable’. Thusship clear of the worst of the storm is diffe
Left-hand or ‘dangerous’ semicircle (Fig
proceed at maximum practicable speed whauling round as the wind backs. If impracon the port tack.
M A R I T I M E M E T E O R O L O G Y
G
T r o u g h
R i g h t - h a n
d o r ‘
s e m i c i r c

8/19/2019 Maritime Meteorology
http://slidepdf.com/reader/full/maritime-meteorology 163/266
Use of safety sectors – additiona
The following procedure is only possible wof the storm’s progress are available (refer
Fig 17.3
Vertex
P a t h
H
F
VORT
L e f t - h a n d
A V O I D A N C E O F T H E W

8/19/2019 Maritime Meteorology
http://slidepdf.com/reader/full/maritime-meteorology 164/266
Ship in harbour
A, C and E are successive position
radio and the expected tracks are A
Fig 17.4
M A R I T I M E M E T E O R O L O G Y
Local peculiarities of tropical sto
China Sea and western North Pacific
If there is a fairly steady south-west or norin the northern part of the China Sea, a typthe reason being that there is no seasocommon; even the south-west monsoon ieast.
South Indian Ocean

8/19/2019 Maritime Meteorology
http://slidepdf.com/reader/full/maritime-meteorology 165/266
South Indian Ocean
An approaching cyclone may be masked bywind approach gale force the ship should beshift.
In all tropical revolving storm areas stor
1 (a) Explain why the ‘dangerous’ anare so named.
(b) Which is the ‘dangerous’ semihemisphere?
2 Explain why, when you find yourcyclone, you should stop your ship action you should take to avoid the
3 (a) On a voyage from Sydney, Auwarning signs of the approach
would estimate the bearing of twhich your ship is located, theyour distance from the vortex.
QUESTIO
A V O I D A N C E O F T H E W
7 (a) What is the average diurnal rangthe tropics?
(b State the local times at whic
pressures occur.(c) When engaged in a voyage wencountered, corrected baromadjusted for local diurnal varbarometric pressure and the locality and month can be found

8/19/2019 Maritime Meteorology
http://slidepdf.com/reader/full/maritime-meteorology 166/266
8 You are in Port Suva, Fiji. A hurricaDescribe the sequence of wind anexperience if the storm subsequentl(a) to the eastwards of your positio(b) to the westwards.
9 You are in the direct path of a typhois insufficient sea room for you to ruWhat action would you take? Expla
10 A ship’s position is in latitude 30°Bermuda to the Bahamas on a coursa hurricane centred over the Florid
State what action should be taken a11 Describe with the aid of a diagram h
to avoid the worst effects of a TRS. about the storm’s progress are being
WEATHER F
FOR THE SEA18

8/19/2019 Maritime Meteorology
http://slidepdf.com/reader/full/maritime-meteorology 167/266
Weather forecasting
The term forecast was coined in its meteowhen he first attempted to anticipate the
warnings in about 1860. It was a wise andtoday with the wide network of observatlong experience, aided by the high speed cweather forecaster can only attain reasoahead. Owing to the frequency at which fattainment is of enormous value for the sa
it is fortunate for the mariner that wind, tha very difficult one to forecast.
The synoptic map
The basic tool of the weather forecaster ismap, which gives a synopsis, or bird’s-eye the existing weather over as wide an areacommunications in particular.
Before Marconi came on the scene only

8/19/2019 Maritime Meteorology
http://slidepdf.com/reader/full/maritime-meteorology 168/266
M A R I T I M E M E T E O R O L O G Y
for example in the United States and the Under the WMO scheme, every radio we
it be for ocean areas or coastal waters, inclabove) and storms (Force 10 and above) wtropical areas, during the cyclonic storm severy early warning of the approach and dwarnings are transmitted at unscheduledroutine bulletins.
Radio bulletins for shipping

8/19/2019 Maritime Meteorology
http://slidepdf.com/reader/full/maritime-meteorology 169/266
Under an international scheme prepared areas are today covered by radio weatherseas. The bulletins are presented in a moreare readily understood, the text being in tand English. In a few cases a simple code mbulletins are in compliance with the Internaat Sea in association with the WMO anmaximum of essential information as briethan one nation issues bulletins for the shandicap: if more than one bulletin gives have more confidence in it. Bulletins for coaby R/T or on domestic broadcast – often acontents are often somewhat briefer. Det
given in the Admiralty List of Radio Signals
Forecasts
Every radio bulletin for shipping, whethecontains, in addition to gale and storm wwind, weather and visibility for the next 2
the area concerned. In some areas (eg off Isub-freezing air temperature is given. Usualstatement of the existing weather system

8/19/2019 Maritime Meteorology
http://slidepdf.com/reader/full/maritime-meteorology 170/266

8/19/2019 Maritime Meteorology
http://slidepdf.com/reader/full/maritime-meteorology 171/266
collecting centre, where they are immedimaps and used for forecasting purposes. Atre-transmitted to other countries and to they are transmitted again for the benefit
for example the United Kingdom has the as the Pacific coast of the USA. The codesuch that a meteorologist of any nationwithout interpretation. Today, the weatheare broadcast in detail by radio facsimile foall countries can easily have available regu
l i l b i ( l d ) d
W E A T H E R F O R E C A S

8/19/2019 Maritime Meteorology
http://slidepdf.com/reader/full/maritime-meteorology 172/266
logical observations (cloud cover, etc) mad
The Selected Ship Scheme
The oceans not only occupy three-quarterthe main source of atmospheric disturbgenerally. Hence the meteorologist has a from ocean areas.
The Selected Ship Scheme is internationthe WMO. Observations are made by thehours, covering barometric pressure, air astrength of wind, wave heights, current weainformation is then coded numerically and
radio stations.Summarised information about makin
instruments used is given in Chapter 25Observer’s Handbook , which is issued free tbe bought from HM Stationery Office. By are providing much-needed help to the m
forecasts for ocean areas.Most Selected Ships make and record in
t b ti d b ti
M A R I T I M E M E T E O R O L O G Y
Earth’s surface. Polar orbiters are in rather lat a height of approximately 850 kilometre
The satellites provide images in both thspectrum. The visible images are dependenEarth’s surface and are therefore not availablatitudes in the ‘winter’ hemisphere are oftare always available since they depend, notemitted by the Earth and its atmosphere.
The satellites also carry equipment senThis information includes measurement of
t t fil

8/19/2019 Maritime Meteorology
http://slidepdf.com/reader/full/maritime-meteorology 173/266
temperature profiles.Information from visible and infra-red i
information on cloud height and type, btemperature. The images can also be used
Global warming
Observations of surface weather conditioresearch into the Earth’s climate. Since ththere has been an increase in public conceestablished that the quantity of carbon diobeen steadily increasing, because this is a msuch as coal, wood and oils, are burnt. Carbpheric gas because it is relatively transparesun but absorbs long-wave radiation from carbon dioxide should raise the mean teprevents some of the outgoing radiation fr
Identifying the effects of global warmclimate is not constant. Over long periods o
due to the changing parameters of the Earaxis. Major volcanic eruptions can put large
h h f h d
global warming would cause less solar radincrease global warming. A rise in temperafrom the ocean and since water vapour is awarming. By contrast, an increase in cloud
incoming solar radiation reflected back towarming.
Practically, the effect of such a rise in teof mean temperature at every place on thebe likely in the general pattern of weather sand seasonal variations. Changes in the
weather would have important effects on a
W E A T H E R F O R E C A S

8/19/2019 Maritime Meteorology
http://slidepdf.com/reader/full/maritime-meteorology 174/266
weather would have important effects on arise in sea level would have important imp
The UK Meteorological Office has ahttp://www.metoffice.gov.uk/. The World useful site that has links to national wthe world. The address is http://www.wm
on sites belonging to newspapers and http://www.bbc.co.uk/.
1 State what you know about the interradio of storm warnings, forecasts ashipping.
2 What is the value to the seafarer of giocean areas in addition to a forecast f
3 Where do you find details about wbroadcast by radio?
4 St t h t k b t di f
QUESTIO
FORECASTIN
MARINER’S 19

8/19/2019 Maritime Meteorology
http://slidepdf.com/reader/full/maritime-meteorology 175/266
When direct and trustworthy forecasts foregularly received by radio from meteoroocean areas are covered today), the shipmhis own forecast but it may well be useful interpret the official forecast better. Therefor operational reasons, to make his own fground of an official forecast) in order to dtake to avoid a weather hazard or maintaiwhich it is essential for him to consult a syand the internet (see Chapter 18) make reto him.
Effective use of a weather map calls contents of Chapters 11 to 15 (inclusive)familiarity with the use of the Climatologicand Sailing Directions (Pilots).
Frontal depressionsThe energy to develop and sustain an amainly from the air in the warm sector T
F O R E C A S T I N G T H E M
Speed of movement
A first approximation is obtained directly fmeasuring the geostrophic wind componen
The speed varies along the front and centre, or wherever the isobars are cloestimated future position of a front on a wponent should be obtained at several poaccording to the ‘rules’.
In Figure 19.1 let the line FF1 represent isobars intersecting the front at points B an
BE is perpendicular to the isobars and

8/19/2019 Maritime Meteorology
http://slidepdf.com/reader/full/maritime-meteorology 176/266
BE is perpendicular to the isobars and scale is inversely proportional to the wind
Similarly the length of BD is inversely component (V) which is obtained by meas
A
C
M A R I T I M E M E T E O R O L O G Y
1 The speed of a cold front is usually abthe geostrophic component. The morfaster it moves.
2 The speed of a warm front is less tgenerally about two-thirds of the gpressure falls ahead of it the faster it m
3 A front which is parallel to the isobars4 When a front is stationary or nearly s
where the pressure is rising towards o
Rules to assist in estimating the
8/19/2019 Maritime Meteorology
http://slidepdf.com/reader/full/maritime-meteorology 177/266
Provided successive weather maps arefront can be easily estimated by extrapoassumed to continue as shown by a surecommended that this method should
consideration should be given to the foregoof a change in the geostrophic wind dusequence of weather maps is very advanta
AnticyclonesFormation and types of anticyclone are de
Intensification and decline
h f l ll
where the pressure is rising towards o5 An occlusion advances roughly with t
component, but there is no definite ru6 An occlusion slows down when appro
Conditions in Glossary) anticyclone.
F O R E C A S T I N G T H E M
Movement of anticyclones
1 Anticyclones are usually slow moving by
2 An anticyclone or ridge between two de
13) travels with the same speed and dir3 An anticyclone formed in a surge of Pm
depression of a family moves with thlatitudes.
4 A warm anticyclone moves slowly and t
5 Anticyclones move from areas of falli

8/19/2019 Maritime Meteorology
http://slidepdf.com/reader/full/maritime-meteorology 178/266
5 Anticyclones move from areas of falliareas of rising tendencies.
6 The centre of an anticyclone tends to mtemperature is falling the fastest.
Winds aloftSome knowledge of the flow patterns in thuseful in estimating the probable moveme
Free atmosphereThe atmosphere above the friction layerlevel, where the air motion is consideresurface friction.
Lower windThe wind at 600 metres, which level can batmosphere.
Terminolo
M A R I T I M E M E T E O R O L O G Y
Vector diagram illustrating thermaFig 19.2
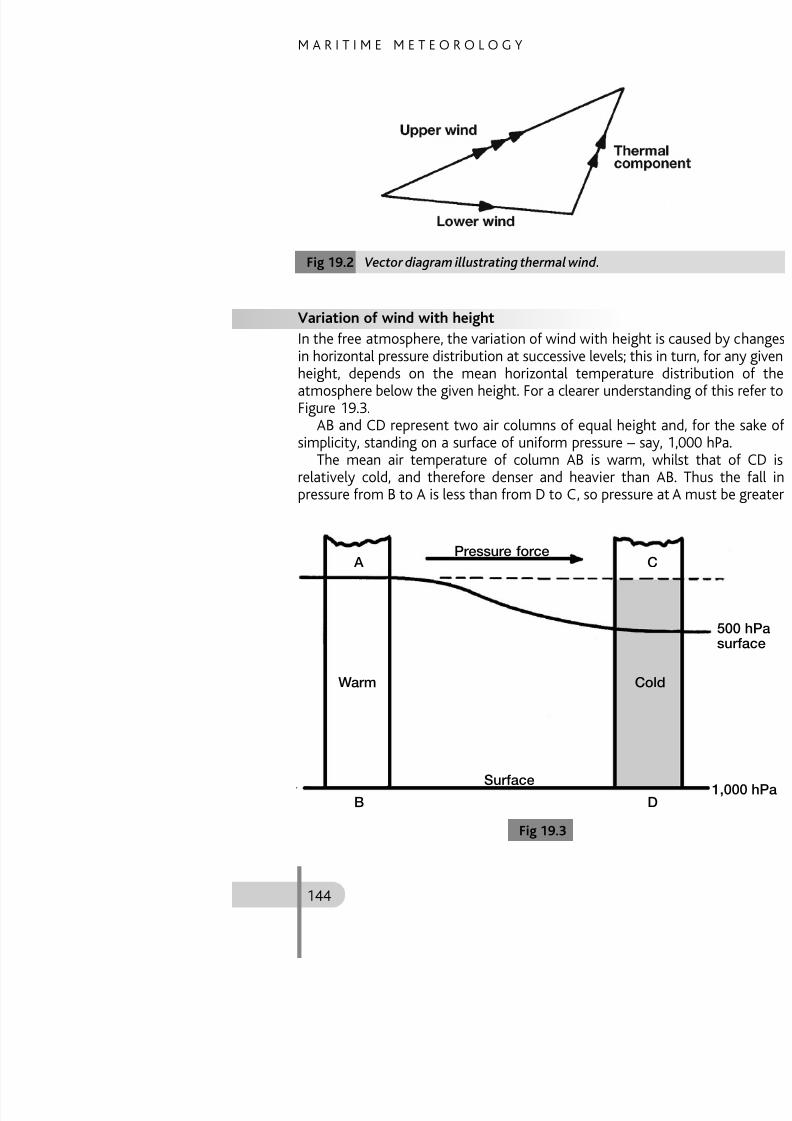
8/19/2019 Maritime Meteorology
http://slidepdf.com/reader/full/maritime-meteorology 179/266
Variation of wind with height
In the free atmosphere, the variation of winin horizontal pressure distribution at succes
height, depends on the mean horizontaatmosphere below the given height. For a cFigure 19.3.
AB and CD represent two air columns osimplicity, standing on a surface of uniform
The mean air temperature of column
relatively cold, and therefore denser and pressure from B to A is less than from D to
g gg
Pressure force A
F O R E C A S T I N G T H E M
than at C. The pressure difference between increases, level for level, as height increase
In areas where the temperature is highalso to be high, and in areas of low temp
tends to be low.The mean temperature of the troposphe
the equator; hence the average thermalspheres (see paragraph on thermal windconditions are more complicated. In very lnot effective and the geostrophic rule, on
is based, does not apply. In addition therebeyond the scope of this book

8/19/2019 Maritime Meteorology
http://slidepdf.com/reader/full/maritime-meteorology 180/266
, pp ybeyond the scope of this book.The main distribution of winds within
easterly winds between the NE and SE tradto 20° of latitude and moves north and sois modified in some regions by monsoon-li
In general, in both hemispheres:
Westerly winds normally increase with Upper winds tend to become increasin Easterly winds normally decrease w
reversal of direction.
Relationship between temperature and
The relationship between temperature andon a synoptic chart, can give a rough guidefollowing ‘rules’:
1 When surface isotherms are parallel t
M A R I T I M E M E T E O R O L O G Y
(b) If lower wind blows from region of hig
Upper winds veer with height in southern hemisphere) and increase a
Upper air chartsToday, with the ever increasing extent of tthe southern hemisphere) and the growinwith facsimile recorders and Internet acces
of upper air charts to the mariner is becomThere are several types of upper air char

8/19/2019 Maritime Meteorology
http://slidepdf.com/reader/full/maritime-meteorology 181/266
ppThere are several types of upper air charthe forecasting of developments at the sumovements of air with greater accuracy anare complicated by small scale weather syeffects.
Constant pressure or contour charts showhich fixed (ie constant) pressures occurheights on a given pressure surface are cadrawn at height intervals of 60 metres, bucharts covering very large areas.
Contour charts are most commonly d1,000, 700, 500, 300, 200 and 100 hPa, of
considered as being the most convenienindication of general windflow is useful insystems at the surface.
Winds flow parallel to the contour lines, win the northern hemisphere and to port i
Wi d d i di tl ti l t t

8/19/2019 Maritime Meteorology
http://slidepdf.com/reader/full/maritime-meteorology 182/266
M A R I T I M E M E T E O R O L O G Y

8/19/2019 Maritime Meteorology
http://slidepdf.com/reader/full/maritime-meteorology 183/266
F O R E C A S T I N G T H E M

8/19/2019 Maritime Meteorology
http://slidepdf.com/reader/full/maritime-meteorology 184/266
M A R I T I M E M E T E O R O L O G Y
1 Describe how you would measure thdrawn on a weather chart. What fasideration when estimating their futur
2 Describe how a comparison of pressuan anticyclone can give indication of athe system.
3 Discuss the movement of anticyclones
(a) In general.(b) Formed in cold Pm air behind the
QUESTIO

8/19/2019 Maritime Meteorology
http://slidepdf.com/reader/full/maritime-meteorology 185/266
(b) Formed in cold Pm air behind the (c) A warm anticyclone.(d) An anticyclone or ridge between tw
4 Of what practical value in forecastingupper levels?
5 Why are upper air charts of value in ththe surface?
6 (a) Which pressure surfaces are comm(b) In which direction does the wind f
7 Discuss circumpolar long waves (Rosscontour chart.
Th l ti hi b t th f
OCEAN SUR
CURRENTS20
8/19/2019 Maritime Meteorology
http://slidepdf.com/reader/full/maritime-meteorology 186/266
The relationship between the surface currsystems is so strong that no book on complete without some description ofknowledge of ocean currents is derived fromofficers in merchant vessels. The navigator
currents because of their effect on the safship at sea. Ocean currents not only affecthem are warm and some cold they have aand weather.
Causes of ocean currentsThe surface currents of the ocean can be divcurrents caused directly by the wind and grthe wind or by density differences in adjacagent which causes the currents; in generasteadier the current.
In the Indian Ocean and China Sea the smonsoons and therefore they vary seasonaother oceans the main surface current circ
hemisphere produces a surface current whithe resultant deflection in the whole body 20.2.) It may appear that only the surfacenavigator, however, it should be appreciated
of water is important for the general circulA gradient current, as its name implies,
slope in the water level. This gradient may(eg against a coastline) or due to a densitbodies of water. One of the most spectagradient current is in the Gulf of Mexico wh
Current piles up the water near the coast Stream but also enhances the Caribbean C
M A R I T I M E M E T E O R O L O G Y

8/19/2019 Maritime Meteorology
http://slidepdf.com/reader/full/maritime-meteorology 187/266
along the coasts of Panama and Colombia Variations in the density of sea water m
difference or a combination of both and whalongside water of a higher density a currNorth Atlantic and Pacific the currents flobasically density currents due to the relativbut assisted by a slight prevalence of north

8/19/2019 Maritime Meteorology
http://slidepdf.com/reader/full/maritime-meteorology 188/266
M A R I T I M E M E T E O R O L O G Y
Current. On the northern flank of the anticythe North Atlantic Drift Current, part of whthe circulation while the remainder swingNorway. The flow of currents from and aro
as can be seen from the chart.North Pacific
In most of this ocean the circulation is Atlantic; a cool south-going current on the equatorial current flowing west on the souKuro Shio in the west, similar to the Gulf Scurrent on the north side. On the extreme area of the China Sea the currents flow

8/19/2019 Maritime Meteorology
http://slidepdf.com/reader/full/maritime-meteorology 189/266
area of the China Sea the currents flow monsoons. As in the North Atlantic, there iin the Arctic area.
North Indian Ocean
The surface currents here are governed entiopen ocean they flow eastwards during westwards during the winter (NE monsoothis ocean, close to the equator, the easflows eastward throughout the year. Close a northerly current in summer and a south
Coast Current, sometimes called the Somalmay have a rate as high as 7 knots.
Southern hemisphere
The surface currents of the South AtlantOcean follow, in general, a regular patternthe periphery of the permanent anticyclon
Each of these oceans has on its eastern
throughout the Mediterranean the saliniincreases and it sinks.
Hence the outflow of this denser watethe Atlantic takes place below the surface
Ocean currentsThe list of currents in the following table shthe pull-out chart near the back of the pattern of ocean currents.
O C
Atlantic Ocean

8/19/2019 Maritime Meteorology
http://slidepdf.com/reader/full/maritime-meteorology 190/266
No Name Average Driftmiles per day
1 N Equatorial 10–40 N
2 Bahama 10–50 N
3 Caribbean Counter Current
10 (average) N
4 Gulf Stream 10–70 W
5 N Atlantic Drift 10–25 W
efan
6 Norwegian W
7 Irminger 9 (average) N
8 E Greenland
W Greenland
6–12 N
ice9 Labrador 5–20 Co
M A R I T I M E M E T E O R O L O G Y
Atlantic Ocean curren
No Name Average Driftmiles per day
18 Brazil InshoreCounter Current
15 (average) CocuRio
19 Southern Ocean 0–30 Ne– can
20 Benguela 10–50 Co

8/19/2019 Maritime Meteorology
http://slidepdf.com/reader/full/maritime-meteorology 191/266
Indian Ocean c
No Name Average Driftmiles per day
19 SouthernOcean drift
As
21 West Australian 14 (average)
2223
EquatorialCounter Equatorial 24 (average) wit
24 Mozambique 0–30 Ne
25 East African coast Ne
NoFe
}
O C
Pacific Ocean c
No Name Average Driftmiles per day
2728
N EquatorialCounter Equatorial 0–40 N
29 S Equatorial 24 (average)
30 Kuro Shio 10–50 W
Pa31 Oya Shio 15–30 Co
}

8/19/2019 Maritime Meteorology
http://slidepdf.com/reader/full/maritime-meteorology 192/266
31 Oya Shio 15 30 Co
32 Tsushima W
33 Liman Co
34 Kamchatka 5–10 Co
35 N Pacific Drift 10–20 W
36 Aleutian 3–7 N
37 Alaskan 6 (average) N
38 Californian 10–30 UCaDse
39 East Australian Very variable0–25 W
M A R I T I M E M E T E O R O L O G Y
1 Discuss the following:(a) Wind-driven currents.
(b) Gradient current.(c) Cold current.
2 Describe the effect of the Earth’s rotat
3 Name and describe the currents of theand give their average daily drifts.
4 Describe the general circulation oMediterranean Sea.
QUESTIO

8/19/2019 Maritime Meteorology
http://slidepdf.com/reader/full/maritime-meteorology 193/266
Mediterranean Sea.
5 (a) Sketch two outline maps of theeastwards to include the China Sea
(b) Illustrate the flow of ocean surface
on one map and for July on the ot6 Describe how ‘upwelling’ is caused a
where it occurs.
7 A drift bottle thrown into the sea onTown was eventually picked up on the
your opinion, the probable track it follocarried it until arrival at its final destin
8 Name and describe the currents, incluwould expect to encounter on a voyagto Rio de Janeiro, via Cape Horn.
Sea ice is partly a meteorological and part
SEA ICE21
8/19/2019 Maritime Meteorology
http://slidepdf.com/reader/full/maritime-meteorology 194/266
There are two kinds of floating ice encountewater; and icebergs, which break off the seaice.
Sea ice is formed in all waters of the frig
parts of the temperate zone in winter, partime it breaks up and spreads into moreAntarctic and western North Atlantic. Icebezone in the North Atlantic area and in botthe Antarctic. In the Antarctic and westernthe temperate zone during springtime.
Physics of sea iceThe physics and development of sea ice aresalt water is lower than that of fresh water higher the salinity the lower the freezing powith a salinity of 35‰ (parts per thousa
(28.5°F), while in the Baltic, where salinity to freeze at 0 3°C (32 5°F) Fresh water sta
The maximum density of fresh water oother hand, sea water with a salinity ofdensity at its freezing point of about –1.5°the temperature of maximum density
formation of sea ice can be a lengthy prohigh salinity.
In some areas, despite very low temperafor the process to be completed and sea icin shallow water where the delay due to co
Development of sea iceThe development of sea ice begins with
M A R I T I M E M E T E O R O L O G Y

8/19/2019 Maritime Meteorology
http://slidepdf.com/reader/full/maritime-meteorology 195/266
p gcrystals called frazil ice. These crystals tendand they give the sea an oily appearance.and congeal to form a greasy or soupy lgrease ice. Alternatively, falling snow crys
stage, shuga ice develops, consisting of across. All the above are classified generapancake ice, consisting of flat pieces, rourim round the edge due to rubbing agaigradually join to form a more or less contthis can also be broken up by wave action.
Young ice eventually thickens and becomgeneric term for all fully developed sea attached to the shore; it varies in thicknesIndividual pieces of pack ice more than 20the pack is termed ‘open’, ‘very open’, ‘closdistance between the floes. Very close pa
Pack ice originating in Arctic or Antarctic wvery uneven due to hummocking (pilint i l i i i th M i ’ H d
of their shape. These bergs are often severa‘plaster of Paris’ white due to trapped air.
Icebergs have only about one eighth ofare thus a menace to shipping. The term g
than one metre in height above the watemetres above the waterline are known asused for larger pieces of ice.
Distribution of sea ice and its seaFigure 21. 1 shows mean and extreme limthe northern and southern hemisphere at description is given in the following para
8/19/2019 Maritime Meteorology
http://slidepdf.com/reader/full/maritime-meteorology 196/266
Admiralty Pilots. The season and intensiconsiderably from year to year, being influrelevant winter and spring and by ocean cu
Grand Banks of NewfoundlandPack ice may be encountered any timeicebergs between April and August. The befrom glaciers on the Greenland coast durinthe east coast are taken by the East GreenCape Farewell and up the west coast by t
they spend the winter trapped in the packswept, together with the bergs calved froGrand Banks area by the Baffin Land andregion is particularly menacing to shipping there in spring and summer. When they gmelt fairly rapidly in the warmer water.
Gulf of St Lawrence and RiverGenerally navigable from end of April until

8/19/2019 Maritime Meteorology
http://slidepdf.com/reader/full/maritime-meteorology 197/266
Denmark Strait
Pack ice may sometimes extend from Gwinter and early spring.
White SeaUsually navigable from July to Septembeusually ice-free, thanks to the effect of the
Baltic Sea
There is much ice normally in the noNovember to May; elsewhere only the coa
affected, in midwinter and early spring.
Black Sea

8/19/2019 Maritime Meteorology
http://slidepdf.com/reader/full/maritime-meteorology 198/266
Liable to have some field ice in midwintecoasts are affected.
North Pacific Ocean
In the area normally frequented by shippinand northern part of the Yellow Sea are affemonths.
Southern Ocean
The coasts of Antarctica are generally surro
icebergs throughout the year, impenetrabmidsummer by specially strengthened vessice extends to about 55°S in places in mrecedes well south of 65°S except off Grahaextreme limit extends north of 50°S in plaapproaches Cape Horn or Cape of Good H
The extreme limit of Antarctic iceberg40°W), while the mean limit is at a maximAt ll b h b i ht d b t
is mostly blue; it is sometimes visible at nice at short distance. A noticeable reductioice to windward. There may sometimes beice. Small isolated chunks of floating ice m
no similar indication of bergs. In all cases good visual lookout during the ice seasonclear dark night but there is always risk oprobably not be seen till very close, espealways reliable with an ice target – particwhen there is any sea clutter. On a foggy
the safest action is to stop the ship till theice season in the western North Atlantic thby the US Coast Guard, keeps watch on
M A R I T I M E M E T E O R O L O G Y

8/19/2019 Maritime Meteorology
http://slidepdf.com/reader/full/maritime-meteorology 199/266
shipping accordingly by radio broadcasts; aiRadio warnings are also issued in Canadian,when necessary.
Reporting of sea ice by shippingThe International Convention of Safety of Lof every ship that sights dangerous ice mshore authorities as soon as possible.
Icing on deck The formation of ice on a vessel’s superstrThese hazards include a reduction in the vlikelihood of capsize if the vessel is heeledAntennae and lifesaving appliances are also
Freshwater ice accretion is due either to
drops which come into contact with the vevessel The weight of the ice added by these
1 (a) Describe briefly the developmenof the following: frazil ice; greas
ice), floes.(b) It is necessary to have some know
correctly interpret ice bulletins. terminology?
2 Compare the icebergs of the northerparticular reference to formation, ca
3 Describe the probable movement calving until final disintegration whe
QUESTIO

8/19/2019 Maritime Meteorology
http://slidepdf.com/reader/full/maritime-meteorology 200/266
g g(a) the east coast of Greenland and(b) the west coast of Greenland.
4 Which of the principal trade routes a
5 Where can you find details regardinfor any particular locality?
6 (a) Define roughly the extreme limfollowing: N Atlantic, S Atlantic,Oceans.
(b) Define roughly the approximate mthe oceans mentioned in (a) abov
7 What action should be taken by tdangerous ice?
8 What special precautions would yowhere you are likely to encounter ice
9 Describe the various signs and pheno
The technique of weather routeing is that and oceanographic information to enable a
WEATHER R22
8/19/2019 Maritime Meteorology
http://slidepdf.com/reader/full/maritime-meteorology 201/266
and oceanographic information to enable aand most economical passage. Climatologiadvantage of favourable permanent and winds and monsoons or prominent ocean c
by shipmasters for hundreds of years. The the quickest. The modern form of weatheof the information derived by meteorologisweather maps in order to avoid the worst osystems of the temperate zones. It seems nto it as ‘synoptic weather routeing’. This m
trying to keep the ship clear of the areas ofare the main cause of speed reduction andher cargo. A rudimentary form of this shipmaster himself nowadays by interpretabroadcast by radio from meteorological sand forecast wind force and wave heightsmaster can arrange to be given regulameteorologists ashore, on a prepayment ba
Valuable advice about climatological rpublication Ocean Passages for the WorldCharts illustrate a compulsory form of clrestrict the draught of ships in certain oce
seasonal weather.
Synoptic weather routeingFormerly, information to enable mariners totransmitted by radio in the form of a numethose plotting, this took a disproportionaresult was also based on reports which wobeforehand. This has been revolutionised maps which are now broadcast by radio by

8/19/2019 Maritime Meteorology
http://slidepdf.com/reader/full/maritime-meteorology 202/266
maps which are now broadcast by radio byservices. These can be received onboard band provide immediate up to date situatsatellite transmissions to be received direc
The master of a ship equipped to recedisposal, at 12-hourly intervals, maps prepforecast wind direction and force with fronand Pacific, wave heights. Armed with thebulletins received by radio, he is better abaction. He is further helped in this by the
ship.
Weather routeing advice from mSynoptic weather routeing from the shorshipowner, a meteorological service or commaster of a ship, on sailing, as to the best
the meteorological situation. They correctas the voyage progresses This technique
M A R I T I M E M E T E O R O L O G Y
The network of observations from meand North Pacific (especially the Atlan
The availability of the high speed ele
ologist. This makes possible the rapidwind speed and wave contours, thus ethan ever before.
The high percentage of merchant shknots. Relatively fast ship speed facilwhen necessary to avoid high wave ar
The availability of information regardisatellite transmissions.
8/19/2019 Maritime Meteorology
http://slidepdf.com/reader/full/maritime-meteorology 203/266
It is reasonable to suppose that a professiofacilities should be able to get more coshipmaster can on his own. The master o
cannot always spend time on weather maphis own routeing to occasions when shore
All authorities which provide weather rbroadly similar methods. The service providship concerned. The first essential step is class of ship that is to be routed, showing
waves of various heights at the light and shown in Figure 22.1. Such curves can be otherwise available, be constructed from daof a new ship, if curves were not prepared ina similar class of ship might be used as a tbeing routed the meteorologist studies h
background of the forecast wind and wavfrom a study of charts prepared with the
18
16
14
12
10
8E E D ( K N
O T S )

8/19/2019 Maritime Meteorology
http://slidepdf.com/reader/full/maritime-meteorology 204/266
when necessary on the basis of further leas
intervals as the voyage progresses. It is weather-routed sends a weather messag
Fig 22.1
6
4
2
0 0 4 8 12 16
WAVE HEIGHT
S H I P S P E 437' x 60' MAX DRAUGHT 2
DIESEL 17 KNOTS
MACHINERY AFT
LOADED DW 7500 TONS
SAILING DRAUGHT
15' FORE 20' AFT
M A R I T I M E M E T E O R O L O G Y

8/19/2019 Maritime Meteorology
http://slidepdf.com/reader/full/maritime-meteorology 205/266

8/19/2019 Maritime Meteorology
http://slidepdf.com/reader/full/maritime-meteorology 206/266

8/19/2019 Maritime Meteorology
http://slidepdf.com/reader/full/maritime-meteorology 207/266
Under certain standard meteorological conradars slightly exceeds the distance of the
h i ht f H j t th
METEOROLO
ASPECTS OF23

8/19/2019 Maritime Meteorology
http://slidepdf.com/reader/full/maritime-meteorology 208/266
same height of eye. However, just as the conditions of low visibility and may be inalso certain meteorological conditions affe
Meteorological phenomena on rSince clouds consist of water droplets, rainradar screen if it is sufficiently heavy. Theradar target it presents and the greater thFortunately the droplets composing fog, m
cause little interference. Showers will appeaconstantly changing, solid targets such as owithin these. Cold fronts in particular may Heavy rain may temporarily cause a reduct
The composition of snowflakes is suchtrouble as heavy rain but this again is go
extent of the snowfall. Solid particles such may also diminish radar range All these
M A R I T I M E M E T E O R O L O G Y
to have their radar range diminished. attenuating echoes on the radar screen is efrom the ship their area has a hard edge.considerable height; this enables the cen
tropical storm to be observed at extreme ror so) and thus helps the mariner to take eNote: Heavy rain can be penetrated by
Standard atmosphereRadar rays are affected by refraction when
of varying density, to a greater extent thamuch smaller wave length. The errors that cdue to this bending of light rays at va
i ti t bl th b i f ‘

8/19/2019 Maritime Meteorology
http://slidepdf.com/reader/full/maritime-meteorology 209/266
navigation tables on the basis of ‘mean ratmosphere with density decreasing regulaidealised state are ignored, except when a
to be present resulting in accurate sights bThe effect of variations in refraction on its range. Normal radar performance, givinweather horizon at the radar’s height of Atmospheric Conditions (Standard Refraconvection and:
A pressure at sea level of 1,013 hPa, d12 hPa per 100 metres.
A temperature at sea level of 15°C, d0.7°C per 100 metres.
A constant relative humidity of 60%.
Th fi l d fi St d d R f
‘h’ is the height of the radar scanner aboveconditions exist mostly in temperate latituand when good mixing of the air is indicaclouds.
Non-standard propagationThe effect of significant variations fromdecrease or increase the effective radar atmospheric density near the surface is letively. It is important for the mariner to
conditions which are likely to affect radunusual performance he might expect fromare more commonly encountered in coasth g i i t t d/ l ti
M E T E O R O L O G

8/19/2019 Maritime Meteorology
http://slidepdf.com/reader/full/maritime-meteorology 210/266
change in air temperature and/or relativecause a change in air density (and refractivwe consider atmospheric changes which o
can draw the following conclusions:
An increase in temperature (which is tdecrease in density and refractive indein radar range.
A fall in temperature will cause the de
in an increase in radar range.
Sub-refraction
A cold air mass moving over a relatively wnear the surface. The result is a decrease in
M A R I T I M E M E T E O R O L O G Y
Super-refractionWarm, dry air moving over a relatively coldsurface, thereby increasing the atmospheri
increase in refraction and radar range. Wheair mass an inversion (see Glossary) mayrefraction may be further intensified if themoisture from the sea surface. These condin tropical latitudes and during spring andzone. In circumstances favourable for supsurface conditions are favourable, low visib
Duct propagationIn extreme conditions of super refraction

8/19/2019 Maritime Meteorology
http://slidepdf.com/reader/full/maritime-meteorology 211/266
In extreme conditions of super-refraction refracted to such an extent that it assumesthan the curvature of the Earth’s surface. O
reflected upwards and onwards, but is thenwater surface again and again in a successionin a ‘radar duct’ close to the surface and can very considerable distances, often causing third traces. Ranges of up to 100 miles cantional targets. This phenomenon is somew
mirages.None of these refraction anomalies has aperformance from the navigator’s viewpointhe extreme radar range, but it is useful to knto be on one’s guard against being taken by
QUESTIO
General principles1 Choice of route must be balanced bet
METEOROLFACTORS O
AN OCEAN 24

8/19/2019 Maritime Meteorology
http://slidepdf.com/reader/full/maritime-meteorology 212/266
time, with emphasis on safety.The direct route is not always the sh
more favourable winds, currents and we
2 The regions, seasons, frequency and tshould be carefully noted.
3 Avoid areas where there are ice hazards ofrequency of fog.
4 Avoid adverse currents and obtain as currents which are favourable.
5 Choose favourable prevailing or seasona
6 There is always the possibility of a long bad weather. Thus it is prudent to planrefuelling, etc.
For coastal passages the navigator is reDirections for the particular passage in que
The Mariner’s Handbook*
This is an invaluable reference book continclude information on tidal movemenmeteorology, including a reference to weatfull range of ice likely to be encountrecommendations and duties when encoun
Monthly Admiralty Routeing ChaMonthly Admiralty Routeing Charts presentessential in route planning and on passage
Ocean currents
M A R I T I M E M E T E O R O L O G Y
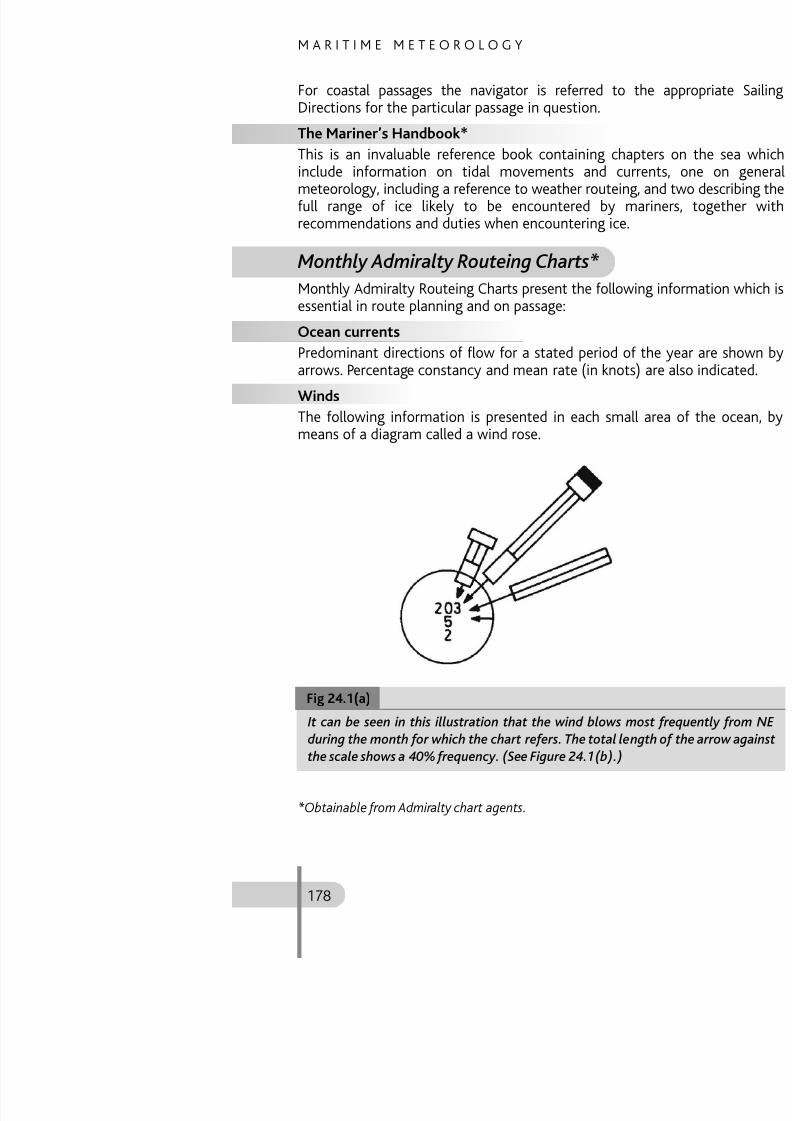
8/19/2019 Maritime Meteorology
http://slidepdf.com/reader/full/maritime-meteorology 213/266
Ocean currents
Predominant directions of flow for a statearrows. Percentage constancy and mean ra
Winds
The following information is presented inmeans of a diagram called a wind rose.
(a) The direction from which the wind month is show by arrows which fly wit
(b) Percentage frequency of each wind vecby the length of the arrow measured ag
chart. (See Figure 24.1 (b).)(c) The force of the wind (Beaufort scale)shading of the arrow shaft. (See Figure
(d) The upper figure in the circle shows Figure 24.1(a).) The middle figure gvariable winds and the lower figure cal
Note: For the purpose of clarity Figures 24to a larger scale than that on the routeing
P L A N
0% 10 20 30

8/19/2019 Maritime Meteorology
http://slidepdf.com/reader/full/maritime-meteorology 214/266
Ice limits
Fig 24.1 (
0% 10 20 30
1–3 4 5–6
Fig 24.1 (
M A R I T I M E M E T E O R O L O G Y
Low visibility
Isopleths show the percentage frequency o
Mean air pressure
Mean pressure for the month is shown by isMean air temperature (°F)
Shown by isotherms printed at 10° interva
Mean sea surface temperatures (°F)
Shown by isotherms spaced at 10° interva
Mean dew point temperatures (°F)Shown by isotherms printed at 4° intervals

8/19/2019 Maritime Meteorology
http://slidepdf.com/reader/full/maritime-meteorology 215/266
1 List the meteorological factors you woplanning a long ocean voyage, and namfor information.
QUESTIO
The importance of being weatheOb i h h i i l
BRIEF NOTEOBSERVATIINSTRUMEN
25

8/19/2019 Maritime Meteorology
http://slidepdf.com/reader/full/maritime-meteorology 216/266
Observing the weather is an essential partwhen on watch a part of the task of keeprecord changes in wind, sea, cloud, visibilismall craft (such as fishing vessels), safety aupon the wind and weather; the same is tpower driven ship. It is no exaggeration to sweather, and the intelligent use of simple mof seamanship.
The making of both instrumental and
recording them at least every four hours in of any significant changes) are a normalduties. It is particularly important to rememhave totally enclosed bridges which can tepractical ‘feel’ of the weather.
Non-instrumental observations
These include:
Instrumental observations
Observations for the ship’s logbook include
Barometric pressure reduced to sea variation is only applied to readingsmaster’s operational use and so this cothe reading recorded in the ship’s logb
Air temperature Sea surface temperature. The metho
temperature should also be recorded.
Observations by selected ships
If the vessel is a selected ship under the W
M A R I T I M E M E T E O R O L O G Y

8/19/2019 Maritime Meteorology
http://slidepdf.com/reader/full/maritime-meteorology 217/266
If the vessel is a selected ship under the Wmore detailed observations are made andmessage is coded using an international c
Ship’s Code and Decode Book Met. 0.509.Selected ships’ reports include barometr
temperature, dew point (determined by tatemperature of the sea surface, for all of whon loan to the ship by the Port Meteorologdistant reading instruments are supplie
readings, the recorders being sited on the b
Points to remember when readin
Aneroid barometer
Tap gently, read, record and check. Correct
Precision aneroid barometer
Example: Height of barometer = 30 feTherefore increase = 30 + 3
Correction 33 = 1.1 hPa30
BarographA barograph is supplied by the Meteorologproduces a continuous graphical record ocalled a barogram. Thus it shows all flubetween the fixed times at which the baro
It consists of a series of flat circular seaexhausted of air and are very sensitive pressure, which either increase or decreasmovements are transmitted by an arrangem
N O T E S O N O B S E R V

8/19/2019 Maritime Meteorology
http://slidepdf.com/reader/full/maritime-meteorology 218/266
y gment of a pen arm. The pen draws an ink trround a revolving drum. The drum revolves
a clock, and one revolution takes one weerecord of all pressure variations are shobarogram is renewed every week when the
The instrument is contained in a glass caclock, renewing the graph, refilling the inkw
The barometric tendencies read from
meteorological logbook and included in thehours. The barograph should be kept at Grthe voyage .
Hygrometer The hygrometer is an instrument for mea
type most commonly used aboard ship (Mordinary thermometers mounted vertically
between wet and dry bulb temperatures. Corate of evaporation is slow and the differthermometers, called ‘the depression of th
The accuracy of the readings depends
mometers, so the screen should be exposewell clear of warm air currents from deck, The data derived from the readings of t
are the relative humidity and dew poinsupplied with the instrument.
Sea thermometersThe sea surface temperature is an importanas it is used for climatological work as weknowledge of the sea temperature is also u
M A R I T I M E M E T E O R O L O G Y
8/19/2019 Maritime Meteorology
http://slidepdf.com/reader/full/maritime-meteorology 219/266
considered in controlling cargo ventilationonset of advection fog.
Wind force and directionAlthough some vessels are fitted with anespeed these are difficult to site on a vesseobstructions. The motion of the vessel alsomethod used is to observe the appearan
compared with a detailed description of thby winds of various forces as given in the Bprepared by WMO. When using this methoother factors which might influence the seafetch, tides and currents, depth and precip
Direction, period and height of se
Visibility In Selected Ships visibility is recorded in kilo0 to 9. When there is no target on the rada
a matter of judgement, having in mind thethe distance from his ship to the horizon wAlthough the horizon method is commontwo miles, it is not always reliable becaurefraction.
On a long ship objects on board of knvisibility is low. At night deteriorating visaround the ship’s navigation lights.
Ocean current observations
N O T E S O N O B S E R V

8/19/2019 Maritime Meteorology
http://slidepdf.com/reader/full/maritime-meteorology 220/266
These are asked for on a voluntary basisnations. The method is to calculate the
position with no current (ie DR positionleeway) and a reliable fix. The result is the sprevious reliable fix.
Abolute humidity(See also Humidity.) The water vapour contvolume, usually in grammes per cubic met
A METEOROLOGIC

8/19/2019 Maritime Meteorology
http://slidepdf.com/reader/full/maritime-meteorology 221/266
Absolute temperature
Temperature expressed in degrees acctemperature scale (freezing point 273 Ktemperature is obtained by adding 100 to
AdiabaticWithout gain or loss of heat – thermallysubjected to increased pressure it undergoif the same body of air is subjected to aexpansional cooling. In both cases, no interthe body of air and the surrounding aichanges thus brought about are said to berises through its environment it undergocooled adiabatically. Conversely, if it sinks,
and is warmed adiabatically.
A M E T
AnalogueA past synoptic chart which closely depictschanges are to be forecast. Synoptic chartsbeen preserved and classified according to
are sometimes helpful as an aid to forecainformation. Meteorological history often rwhich followed an analogue may sometdevelopments in the future.
AnalysisThe process of positioning the fronts an
surface or upper air chart.
Anemometer An instrument for measuring the speed of

8/19/2019 Maritime Meteorology
http://slidepdf.com/reader/full/maritime-meteorology 222/266
Anticyclone (also called a high)
An area of relatively high pressure surroupressure. Characterised on a synoptic charoughly circular or oval in shape. The wind bin the northern hemisphere and counterclo
Anticyclonic gloom
A condition of poor illumination by daystratiform cloud below the subsidence invlikely to occur during quiet winter weathwhere there may be some smoke pollution
Anti-tradesThe prevailing upper winds which blow a(polewards) to that of the trade winds.
M A R I T I M E M E T E O R O L O G Y
Bar The unit of atmospheric pressure, being eq(1 x 10⁵ newtons per square metre).1 bar = 100 centibars = 1,000 hPa (29.53 i
BaraticThe code word used in weather messages toanalysis follow in figure code. The term ishowever; a surface analysis chart broadcacalled a baratic. The word prebaratic refers
Barometric tendencyThe change in barometric pressure which period (usually three hours) before the tim
B f t l

8/19/2019 Maritime Meteorology
http://slidepdf.com/reader/full/maritime-meteorology 223/266
Beaufort scaleA practical means of estimating the force o
the sea. Ranges from a wind force of 0 ‘Cused both by meteorologists when issuinreporting on-the-spot conditions to shore
BiseA cold dry wind which blows from the n
southern France during winter. The cold noaccompanied by heavy cloud.
Black frostA relatively dry air condition in which thfreezing point but remains above the dew hoar frost occurs.
the main flow of air is polewards and, on tblocking situation gives persistent weather
BoraA cold, often dry, north-easterly to easterlyof the Dalmatian Mountains and off the epartly katabatic (qv), strongest and most attains gale force when the pressure distribgradient strong. Often dangerous when it ain the form of violent gusts.
Buys Ballot’s LawIf an observer stands with his back to the win the northern hemisphere, and on his Mariners usually say ‘face the wind, and lonorthern hemisphere and on your left in th
A M E T

8/19/2019 Maritime Meteorology
http://slidepdf.com/reader/full/maritime-meteorology 224/266
northern hemisphere, and on your left in th
ChinookA warm and dry south-west wind blowinRocky Mountains in the USA and Canada. Föhn effect very pronounced, especially in of the snow. (See Föhn.)
Clear ice (See Black ice.)
ClimateThe prevailing and characteristic meteoroopposed to weather which is the state of tclimate of a locality is governed mainly byto large land masses, oceans and temperatlarge scale wind circulations; (d) local topo
M A R I T I M E M E T E O R O L O G Y
ColAn atmospheric pressure distribution locatearranged alternately. Associated with ligthundery in summer and dull or foggy in w
Cold anticycloneOne in which the air temperature at the suis, level for level, colder than in the air surtype, the high pressure is caused mainly sequent high density of the air. Probablycyclone is the winter high of Siberia. A tr
build up in the polar air in the rear of a famcollapse but sometimes persist and, due todence, slowly change into a warm anticycl
Cold front

8/19/2019 Maritime Meteorology
http://slidepdf.com/reader/full/maritime-meteorology 225/266
Cold frontThe line of discontinuity (at the surface
advancing cold air mass is overtaking and u
Cold sector That area of a depression occupied by coldwhole depression after the occluding proce
Cold wallThe sudden line of demarcation separatingCurrent.
Cold waveA period of low temperatures (below the awhich lasts for 24 hours or longer, particul
ment of air within the environment, proviwater vapour.
ConvergenceAn area of convergence is one in which thehorizontal outflow at the same level. In thvertically, Except in arid regions, converassociated with much cloud and precipitatcentres of depressions.
Cordonazos
The local name for a tropical cyclone on th
Coriolis force (See Geostrophic force.)
Crachin
A M E T

8/19/2019 Maritime Meteorology
http://slidepdf.com/reader/full/maritime-meteorology 226/266
CrachinA weather condition which occurs between
and coastal areas from Shanghai to Cape flowing down from the north interacts witair, giving low stratus and drizzle with mist
CyclogenesisThe process whereby a new cyclone or dep
is strengthened.CyclolysisThe disappearance or weakening of an exis
CycloneA relatively very low pressure centre surrouThe wind circulates counterclockwise round
M A R I T I M E M E T E O R O L O G Y
Depression (or low)A central region of relatively low pressurepressure. The wind circulates anticlockwisenorthern hemisphere, and clockwise in the associated with a depression is, typically, winds, much cloud and precipitation. The from about 100 to 2,000 miles in diameter.only to depressions of middle or high lrevolving storms. (See Cyclone.)
Dew
A deposit of water formed by condensation by radiation to a temperature below that ofconditions are a calm night with a clear sky
Dew point

8/19/2019 Maritime Meteorology
http://slidepdf.com/reader/full/maritime-meteorology 227/266
Dew pointThe temperature to which unsaturated air m
and constant water vapour content, in ordecooling usually results in condensation of tpoint.)
Diurnal variationChanges which occur during a day, such
temperature.DivergenceAn area of divergence is one from which ththe horizontal inflow at the same level; tvertical movement (subsidence, when diveassociated with quiet settled conditionsanticyclone is a good example.
Dust stormsOccur mainly in sandy deserts and semi-dethere is an adequate supply of fine dust. Thvery unstable air will carry dust to great hthan 100 metres over a considerable area. Dgreat distances over the sea, causing ‘dust ffrom the coast.
Elements (meteorological)The physical forces of nature which togethemist, etc.
EtesiansThis is the Greek name for the winds whibetween north-east and north-west in theThe weather is usually fine and clear These
A M E T

8/19/2019 Maritime Meteorology
http://slidepdf.com/reader/full/maritime-meteorology 228/266
The weather is usually fine and clear. These heat. They are called the Meltemi by the Tu
EvaporationIn meteorology, the process of changing liq
EyeThe central part of a hurricane.
FaxA method of transmitting and receiving Abbreviation for facsimile.
FetchThe distance which the wind has travelledsame direction.
M A R I T I M E M E T E O R O L O G Y
that at which condensation began. Belowtakes place at the dry adiabatic lapse ratefinishes its descent relatively warm and droriginated in the Swiss Alps, but the effect conditions are suitable. A notable example
Free atmosphereThe atmosphere above the friction layer, ilevel, where the air motion is considered tofriction.
Freezing fogSupercooled (qv) water droplets of fog wobjects, forming rime.
Freezing drizzle or freezing rain
8/19/2019 Maritime Meteorology
http://slidepdf.com/reader/full/maritime-meteorology 229/266
Freezing drizzle or freezing rainSupercooled water drops of drizzle or rain
objects to form glazed frost.
Freezing levelThe height above sea level of the 0°C isoth
Friction layer
The layer of the atmosphere extending frmetres within which the effects of surface f
FrontThe line separating warm and cold air maswhich the sloping frontal surface meets thented by a line on a synoptic chart it is, in
FrostAir frost occurs when the temperature ofmetres above the ground) falls below 0°C. Wwith the ground falls below this temperatu
Frost pointThe lowest temperature to which moist acooled without deposition of ice from wateconstant. At the frost point the vapour is jusfurther cooling the vapour may be depositedsurfaces, as hoar frost. (See Dew point and H
GaleA wind having a speed of between 34 and scale.
A M E T

8/19/2019 Maritime Meteorology
http://slidepdf.com/reader/full/maritime-meteorology 230/266
Gale warning
Gale warnings are issued only when winds oterms severe gale, or gale becoming severeabove are expected. The terms imminent, sobetween 6 and 12 hours, and more than 12
Geopotential
The potential energy per unit mass of aGeopotential height is used rather than a gallow for variations in the Earth’s gravitatio
Geostrophic forceA deflecting force caused by the Earth’s roalways in a direction at 90° to its existing l
the right in the northern hemisphere and
M A R I T I M E M E T E O R O L O G Y
GregaleA strong NE wind experienced in the centrcapable of raising heavy seas which affect in Malta and the east coast of Sicily, occurhigh to the north or north-west and low todays and occasionally for 5 days.
Ground frost (See Frost.)
GustA sudden increase in the strength of the w
much shorter than that of a squall. At sea, raising waves, but squalls may last long enomove along with the squall.
Haar
8/19/2019 Maritime Meteorology
http://slidepdf.com/reader/full/maritime-meteorology 231/266
A wet sea fog which invades eastern Scot
especially during summer.
HailSmall balls or pellets of ice, usually formed
Harmattan
A dry and comparatively cool easterly windduring the dry season (November to Marchthe Sahara, and reduces visibility for many Harmattan decreases southwards.
HazeAtmospheric obscurity caused by the prese
term is limited to conditions of visibility in w
Horse latitudesThe regions of light variable winds, calms anticyclones between latitudes about 30° tnorth and south with the sun.
HumidityAbsolute humidity is the water vapour contunit volume, usually in grammes per cubic of the existing absolute humidity to itemperature, expressed as a percentage.
HurricaneThe term applied to tropical revolving stormWest Indies, Gulf of Mexico, and off the norof Force 12 (64 to 71 knots) on the Beaufo
A M E T

8/19/2019 Maritime Meteorology
http://slidepdf.com/reader/full/maritime-meteorology 232/266
Hurricane wave (or storm wave)
The raising of the level of the sea surface, metres, in a confined region near the centr
Hygrometer Instrument used to measure humidity or d
Hygroscopic nucleiVery minute particles of chemical substanThey are always present in the atmosphenuclei on which condensation of water vaand fog. They consist mainly of salt from sein smoke from industrial and domestic fire
Icelandic low
Intertropical convergence zone (ITCZ)A narrow belt in low latitudes separatingoriginate in different hemispheres. (Formerbut as it bears little resemblance to fronts ois now seldom used.) The zone fluctuates ssun, its range of movement being small ocontinents. Its mean position lies north of Areas of horizontal convergence along thisposition and activity, but are generally convectional rain; for example, the doldrum
Intertropical front (See Intertropical Conv
Inversion (of temperature)An inversion, or negative lapse rate, is said totemperature increases with increasing h
b d h h d
M A R I T I M E M E T E O R O L O G Y

8/19/2019 Maritime Meteorology
http://slidepdf.com/reader/full/maritime-meteorology 233/266
inversion may be caused through radiation
by horizontal movement of warm air over aat height may be caused by the subsidenceair from upper levels. In all cases, it indicamovement of air being arrested at the leve
Isallobar A line on a synoptic chart joining all poiIsallobaric charts are used mainly to assispressure systems; for example, all depressrising tendencies towards areas of fallingtowards isallobaric low).
Isobar
A line of constant atmospheric pressure –
Jet streamA very fast-moving current of air located nthe nature of 1,000 miles in length, 100 tdepth of 3 or more miles. Speed at the cenknots, and may sometimes reach 200 knodeparture from the central core of the strea strong horizontal temperature gradientemperature and high pressure (at upper hemisphere, and on the left in the souther
In temperate latitudes, polar front jet stthe frontal surface. They occur over a wide
jet stream usually persists for several days,little change of position.
Subtropical jet streams occur at a helatitudes 25°–30° in winter, and 40°–50° infairly constant in position; they are very
di 200 k t t
A M E T

8/19/2019 Maritime Meteorology
http://slidepdf.com/reader/full/maritime-meteorology 234/266
exceeding 200 knots are not uncommon.
Kata frontA front where the warm air is sinking down
Katabatic windOn a ‘quiet’ night with a slack pressure inversion resulting from radiation cooling mthe air in contact with the surface becomethe same horizontal level away from the grdown the slope forming a ‘down-slope’ windovercomes adiabatic warming. The effect winter months on mountain slopes where tis long; the resulting katabatic wind may th
daylight. Many local winds such as th
M A R I T I M E M E T E O R O L O G Y
Kharif A strong south-westerly wind which, durindaily from about 2200 until the followfrequently attains gale force during June, Ju
Land and sea breezesThe diurnal variation in sea surface tempcompared to that of the adjacent land. Dusolar radiation, the land becomes warmproduces a pressure gradient near the coas(sea breeze) which is strongest during the
process is reversed; terrestrial radiation coothat of the sea surface, the result is an offusually weaker than the sea breeze, as theover the land.
Sea breezes may extend 15 miles on eitd F 3 i t t l tit d b t

8/19/2019 Maritime Meteorology
http://slidepdf.com/reader/full/maritime-meteorology 235/266
exceed Force 3 in temperate latitudes but
Favourable conditions are clear skies andwinds, being local and transitory, do not coisobars. If the general pressure gradient is sbe completely masked.
Lapse rateThe fall in atmospheric temperature per inrate within the troposphere is about 0.6°C rate varies considerably from day to day ansometimes negative, ie temperature increinversion (qv).
Unsaturated air, when displaced verticallwill cool at the dry adiabatic lapse rate of 1°
cool at the saturated adiabatic lapse rate wh
supplied to sea and land surface by solar evaporation and contained in the atmosphascent or by transportation into cooler latirelease of latent heat, thus raising the temptransfer of heat from tropical to temperate
LesteA hot, dry, southerly wind occurring betwethe north African coast in front of an adva
Levanter
An easterly wind in the Straits of Gibraltacloud, heavy dews, poor or bad visibility, aany time of the year, but is most frequent The Levanter is generally associated with and low pressure to the south-west of GibIt is usually light or moderate in force and
A M E T
8/19/2019 Maritime Meteorology
http://slidepdf.com/reader/full/maritime-meteorology 236/266
It is usually light or moderate in force, and
or so to leeward of the Rock. On occasiodangerous eddies are formed in the lee of
LevecheA hot, dry, sand-and-dust-laden southerly wcoast of Spain. It occurs in front of an advis of ten heralded by a belt of brownish cloalso Scirocco.)
LibeccioThe predominating westerly or south-westcauses high seas and may be accompanpersistent during summer months. In winte
north or north-east. (See Tramontana.)

8/19/2019 Maritime Meteorology
http://slidepdf.com/reader/full/maritime-meteorology 237/266
Mirage, inferior Occurs when the surface air is strongly heaground, and so becomes less dense than thefrom the clear sky are refracted upwards produced is that of an expanse of shimmer
Mirage, superior When the surface is much colder than the a strong temperature inversion is formed. object are bent downwards towards thehorizon may become visible. Sometimes a
real object and occasionally, an upright imimage occurs more often in high latitudes.or subnormal refraction when finding dista
MistA condition of atmospheric obscurity cau
A M E T

8/19/2019 Maritime Meteorology
http://slidepdf.com/reader/full/maritime-meteorology 238/266
A condition of atmospheric obscurity cau
minute water droplets. The term is limitedvisible at distances greater than 1 kilom(1,100–2,200 yards).
MistralA cold dry, strong N or NW wind blowingMediterranean. It occurs usually when thereover France, and low to the south-east. It owinter, when the flow of air over the Gulfdrainage from the French Maritime Alps aRhone Valley.
Mixing fog
Forms along the boundary (mixing zone)
Norther A strong, cool, dry northerly wind which bloAmerica and the western Caribbean. It is mof the year, and is associated with intensAmerica and a depression over the Caribbe
force.
Numerical forecastA forecast produced using a computer mod
Occlusion
Within a frontal depression the cold frontand eventually overtakes it. Thus, advancingair, and the tropical air of the warm sector two polar air masses come together, therecent history) will cause the overtakingretreating air; in both cases, the process is
M A R I T I M E M E T E O R O L O G Y

8/19/2019 Maritime Meteorology
http://slidepdf.com/reader/full/maritime-meteorology 239/266
retreating air; in both cases, the process is
OktaUnit used in reporting cloud amount; it is earea of the sky.
Orographic cloudOrographic cloud is formed when an airstground, is deflected upwards and the constemperature below the dew point of the ri
Ozone layer The layer of the atmosphere where the congreatest. The maximum concentration occu
the Earth’s surface
PrecipitationThe term includes rain, drizzle, sleet, snow, hfrost. Cloud, fog and mist are not classed awhich deposits water on the surfaces wclassified as precipitation.
PressureForce per unit area exerted on a surface byAtmospheric pressure at any level is produlies above that level; hence atmospheric pre
Pressure gradient (horizontal)The change in pressure per unit distanceisobars. It is generally termed steep when slight, slack or flat when they are widelygradient, the greater the wind speed. In thhPa in 30 miles gives a geostrophic wind
A M E T

8/19/2019 Maritime Meteorology
http://slidepdf.com/reader/full/maritime-meteorology 240/266
hPa in 30 miles gives a geostrophic wind
(surface wind speed at sea about 24 knots
Pressure tendencyThe rate of change of pressure with time.change in pressure during the period of observation. Of great practical value in fore
Prognostic chartForecast chart.
Prontour A forecast chart (upper air) showing the cohPa prontour.
Radiation inversion (surface inversion)A layer in which temperature increases with ground. A temperature inversion extendiresulting from a period of nocturnal radiaare: a clear sky at night, and little or no
strengthened if the period of darkness is lo
RadiosondeA small, compact radio transmitter, attacheof obtaining upper air observations: uhumidity. Wind velocities can also be obta
with a radiotheodolite, or by radar echoes fby the balloon.
Relative humidity(See also Humidity.) The ratio of the saturation value at the same temperature,
M A R I T I M E M E T E O R O L O G Y

8/19/2019 Maritime Meteorology
http://slidepdf.com/reader/full/maritime-meteorology 241/266
p ,
RidgeA ridge (or wedge) of high pressure is a tongor high pressure area. It is generally associatof an anticyclone. Ridges travelling eastwardepressions are usually fast-moving, and bring are brief. Ridges extending from contitropical highs, are slower in movement andseveral days.
RimeWhen supercooled water droplets of fogtelephone wires, ship’s masts, rigging an
below 0°C they freeze on impact forming
disposition (which depicts the shape of desystems) and also, when the sky is clear, se
These satellites are especially useful inareas and those land areas where observatiin giving advance warning of tropical cyclon
shared internationally.
SaturationAir is said to be saturated when its relativebe noted that, at sub-freezing temperaturehumidity is higher over water than over
saturated with respect to water is supersat
SciroccoThe local name for a southerly wind in thdesert regions of North Africa, it crosses theoften carries much dust. Blowing over the r
A M E T
8/19/2019 Maritime Meteorology
http://slidepdf.com/reader/full/maritime-meteorology 242/266
g
up moisture and tends to become stable; tha warm, unpleasantly humid wind, often wit
Scotch mistA combination of drizzle and thick mist;Scotland, from whence it derives its naCornwall, where it is known as ‘mizzle’.
Scud (stratus fractus)Ragged-looking low clouds of bad weathbelow rain cloud (nimbostratus) in strong w
Sea breeze (See Land and sea breezes.)
Secondary cold frontA trough of low pressure in the polar air depression. It marks the advance of fresh pois colder than the polar air immediately be
Secondary depressionA small low which forms within the area colarger (primary) depression. It generally cyclonic direction, following the main flosufficiently to completely absorb the primform on a frontal wave and sometimes at th
occluded depression. Non-frontal secondapolar air mass.
ShamalA prevailing NW wind which blows over Oman. Most frequent in summer, when th
M A R I T I M E M E T E O R O L O G Y

8/19/2019 Maritime Meteorology
http://slidepdf.com/reader/full/maritime-meteorology 243/266
NW India. Generally hot, very dry, and assoquantities of dust and fine sand from the early summer it may persist for several wee7, except in winter when it sometimeaccompanied by rain squalls, thunder, and not usually preceded by any marked barom
ShowersRain, hail or snow falling from isolated conduration. The term shower in weatheintermittent or continuous precipitation fro
Sleet
1 In British terminology: ‘Snow and rain fa
SolanoAn easterly or south-easterly wind which band the south-east coast of Spain.
Solar radiation (See Radiation.)
Sounding (meteorological)Observations of atmospheric properties byballoons or rockets.
Southerly buster
The local name for the sudden squally opassage of a well-defined, active cold frontof Australia. The NW wind in advance oppressive. The arrival of the SW wind is ussometimes by thunder and lightning; it comand often blows with gale force for several
A M E T

8/19/2019 Maritime Meteorology
http://slidepdf.com/reader/full/maritime-meteorology 244/266
large and rapid fall in temperature as the fof South America.
Specific heat capacityThe specific heat of a substance is the numtemperature of 1 kg of that substance byhigher than that of any other common subgiven quantity of heat brings about a smallthan of the land.
SquallA sudden, very marked increase in wind spand then suddenly dies down. It is of longe
When using the Beaufort scale for the est

8/19/2019 Maritime Meteorology
http://slidepdf.com/reader/full/maritime-meteorology 245/266
SumatrasViolent thundery squalls which occur in tduring the SW monsoon period. They aresudden shift of wind from a southerly diaccompanied by heavy cumulonimbus clo
temperature.
Supercooled water dropletsWater droplets in the liquid state at tempe
Supersaturation
When the absolute humidity of an air samits existing temperature, the sample is said humidity is greater than 100 per cent. Conin the atmosphere, and so supersaturation degree.
A M E T

8/19/2019 Maritime Meteorology
http://slidepdf.com/reader/full/maritime-meteorology 246/266
Synoptic chartA weather map drawn at a fixed time.
Synoptic stationA place where weather observations are msynoptic chart can be produced.
Tendencies (See Barometric tendency.)
Terrestrial radiation (See long-wave radiat
Thermal depression (thermal low)A surface depression, the formation of wh
adjacent areas Strong surface heating ove

8/19/2019 Maritime Meteorology
http://slidepdf.com/reader/full/maritime-meteorology 247/266
TropopauseThe boundary between the troposphere anfrom about 5 miles at the poles to about 1
Troposphere
The lower layers of the atmosphere boundeby a positive lapse rate, convection currenlayer within which most weather is experie
TsunamiSometimes mistakenly called tidal waves,
earthquakes or other sudden changes in produces waves that propagate away froThese waves can be very destructive.
TurbulenceDisturbed motion of the atmosphere.
A M E T

8/19/2019 Maritime Meteorology
http://slidepdf.com/reader/full/maritime-meteorology 248/266
TyphoonThe local name for a tropical revolving sto
Vapour pressureThe atmosphere is made up of a mixture oproportional to its density. Atmospheric
individual pressures of these gases. That padue to water vapour only is called vapour p
VeeringA clockwise changing of the wind directdescribe changing in an anticlockwise direc
VortexA whirlpool or eddy which tends to drawcentre of a tropical cyclone, tornado or wa
V-shaped trough
A sharply defined cold front, with isobars in
Warm anticycloneOne in which the air temperature, level fsurrounding the whole system. It is the moving of all pressure systems. The sub-tro
A temporary cold anticyclone may sowarm one due to continued subsidence. Thigh remains stationary for a long periodconditions, often dry, fine, sunny and warm
Waterspout
M A R I T I M E M E T E O R O L O G Y

8/19/2019 Maritime Meteorology
http://slidepdf.com/reader/full/maritime-meteorology 249/266
The localised result of exceptionally strongIt forms under a very heavy cumulonimbufunnel shaped cloud descends and reachewhirled into violent commotion, causing abelow the funnel. Some waterspouts may dothers the end of the spout reaches downwrithing column between the sea and cl
usually travels along at a different speed toa few minutes the column assumes a slantabout one third of its height from the surflife cycle of a waterspout usually lasts fromfrom 6 to 60 metres but are usually less this very slow.
Waterspouts are the ocean counterpart
Weather The term generally refers to meteoroloprecipitation, mist, fog, sunshine, etc) at awhich is the prevailing meteorological cond
WedgeA wedge (or ridge) of high pressure isanticyclone, usually between two lows. Ththat of an anticyclone, but is short-livebetween two travelling depressions. A brointense anticyclone may sometimes persis
Wind chill factor The air may feel significantly colder than ita strong wind. The wind chill factor is often effective temperature.
Zonal flow
A M E T

8/19/2019 Maritime Meteorology
http://slidepdf.com/reader/full/maritime-meteorology 250/266
Zonal flowMotion parallel to the parallels of latitude.
One of the main tasks of the shipmaster iscondition at its port of destination. Provcondition, suitably packed and properly stowreal enemy in a well-found ship is a metwaves and adverse winds may delay the shinto a hold, or her violent motion may
METEOROLOGY ANOF CARGO
APPENDIX 1

8/19/2019 Maritime Meteorology
http://slidepdf.com/reader/full/maritime-meteorology 251/266
variations in the temperature and humiddamage. Cargo carried on deck is obviously
In this chapter suggestions are made asdangers. The vast bulk of what was formerlyand this has revolutionised the carriage ofhere applies in a general way to all types
other very specialised cargoes.
Heavy weather
The size and strength of modern ships and design of ventilators are such that only wwater likely to get into the holds. Some shwith heavy rolling and there is the risk of d
atmosphere arise; to prevent accumulationand thus diminish or prevent condensatflammable or noxious gases. To ensure corto understand the relatively simple physicabe taken will depend on the nature of the
prevalent during the voyage; sometimessometimes it is not.
Hygroscopic and non-hygroscop
A non-hygroscopic cargo contains no mtinplates, galvanised sheets and pipes, pogoods. It does not change weight during toff moisture it offers surfaces on whichtemperature is below the dew point of the
Hygroscopic cargoes contain natural moforestry and fisheries and include some cocoa beans might contain 6 per cent
M E T E O R O L O

8/19/2019 Maritime Meteorology
http://slidepdf.com/reader/full/maritime-meteorology 252/266
lumber 20 per cent and wheat 12 per centFor any hygroscopic cargo there is a re
surrounding air is in equilibrium and will from, nor give moisture to, the cargo. Thusbelow this value the cargo will give up movalue then the cargo will absorb moisture
should, in general be ‘dry’ on shipment, whia storage atmosphere damper than 70 temperature remains constant, a cargo ofstorage atmosphere steady at a relativmoisture content, ie at the equilibrium retemperature of 20° (68°F), wheat containin
a relative humidity of 70 per centB i t i littl i t
fruit; consequently the fruit exceeds its optmay deteriorate.
In a loaded hold, temperature differencargo develop as the ship changes lattemperature gradient; some cargoes do no
does. Condensation affecting cargo in holdtemperature and dew point. Such effects arapid sea temperature change, eg off the eaFrancisco, off the Cape Verde Islands and oair at sea is rarely saturated, the average rper cent and 90 per cent.
Moisture that causes damage to cargo incategories: ‘cargo sweat’ and ‘ship’s sweat’.
Cargo sweat
This occurs when the ship proceeds from aand the cargo provides the condensing s
M A R I T I M E M E T E O R O L O G Y

8/19/2019 Maritime Meteorology
http://slidepdf.com/reader/full/maritime-meteorology 253/266
remains relatively warm and dry. Typical ex
1 If a ship is loaded in a temperate port across warmer seas the ship’s steelwork temperature of sea water and atmosphbehind. Soon some part of the cargo isexternal air; if the hold is then ventilatecondensation and later set hard; ventila
2 If canned goods are loaded in winter through the Panama Canal, the goods wthan when loaded, while the outside dew(73°F). The hold should not be venti
moisture in the warm ventilating air wot H thi i l f th
moisture content and temperature. If it casea water and outside air, the dew point othat of the cold steelwork and there will bethan its surroundings, its storage atmospwarmth will cause an upward current to ca
relatively cold deckhead, where its moistuis called ‘ship’s sweat’; the moisture is deriv
To prevent ship’s sweat a hygroscopic cventilated with outside air and stowed socool it (no matter what that air’s dew poicargo), so that the cargo temperature
ventilating air.A simple general procedure to avoid shthe external air is drier than the air leaving when the dew point of the external air is loObtaining the dew point of the external adry thermometer in a screen, exposed oassociated with dew point tables. The dew p
M E T E O R O L O

8/19/2019 Maritime Meteorology
http://slidepdf.com/reader/full/maritime-meteorology 254/266
to measure, but it can be done by using issuing from the hold; a luxurious alteinstruments, fitted in the holds and read onare available, an arbitrary decision has to bethe cargo and the climatic changes likely toshipped from a hot climate to a cold o
cold climate to a warm one, don’t ventilSweat damage in a ship’s hold can be d
within the ship. Cargo stowed near engineheated and, if hygroscopic, give off moistucooler metal goods or ship’s steelwork. Algeneral cargo hold in the near vicinity of a
below the dew point of the hold air and ca
Spontaneous combustion
Some hygroscopic cargoes such as fishmefibres are liable, under certain conditions, tsubject to this danger. The ultimate stage o
an abnormal temperature rise in some parbeing the original cause of the trouble. Earlytemperature may enable remedial ventilatto be done with great care because of the be wiser to shut off all ventilation to th
ContainersTwo types of condensation can affect cocontainer sweat. For condensation to occurand a temperature gradient. The source of tthe package, the dunnage, the container wtime of packing. A temperature gradient
M A R I T I M E M E T E O R O L O G Y

8/19/2019 Maritime Meteorology
http://slidepdf.com/reader/full/maritime-meteorology 255/266
atmosphere and the air inside the containe
Example
A container packed with cartons of cannedhumid atmosphere for some weeks. Doors in the open. The sun heats the roof in dayti
and cargo; the air is thus able to hold morelatively damp cartons. The temperature oso they remain cold and the moisture conthe container roof temperature falls and container and this air deposits moisture ondeposited or if the container is shaken orcargo. Day and night temperature changes A1 1 If the source of moisture within th
with the atmosphere and its moisture conand doors shut the only way outside weattemperature changes. Thus the containhermetically sealed and any condensationproduct of the temperature and relative hu
temperature gradient to the atmosphere o
M E T E O R O L O
HOT
CONTAINER

8/19/2019 Maritime Meteorology
http://slidepdf.com/reader/full/maritime-meteorology 256/266
Fig A1.1
COLD
Any moisture-laden air maycondense on
cooler cargo
Any moisture-laden air maycondense on
cooler skin ofcontainer
Inches – Hectopascals
29 in = 982.1 hPN in = (982.1 NN hPa = (29N ÷
UNITS AND EQUIV
APPENDIX 2

8/19/2019 Maritime Meteorology
http://slidepdf.com/reader/full/maritime-meteorology 257/266
Temperature conversations
C = degrees Celsius (Centigrade)F = degrees FahrenheitA = degrees Absolute
C = (F – 32) x 5/9 F = (C x 9/A = C + 273 C = A – 27
Some useful equivalents
Distance1 i t ti l ti l il 6076 12
Liquids1 litre = 1,000 m
= 1.76 pin1 pint = 0.568 lit1 gallon = 4.544 lit
Pressure1,000 hPa = 29.53 in1 hPa = 0.029531 in = 33.864 h1 lb/in2 = 70.3 gm
U N I T S A

8/19/2019 Maritime Meteorology
http://slidepdf.com/reader/full/maritime-meteorology 258/266
M A R I T I M E M E T E O R O L O G Y
V E D
B A R O M E T R I C
P R E S S U R E F O
R D I U R N A L
0
4 0 0
0 5 0 0
0 6 0 0
0 7 0
0
0 8 0 0
+
0 . 8
+
0 . 0
2 4
+ 0 . 6
+ 0 . 0
1 8
+ 0 . 2
+ 0 . 0
0 6
– 0 . 4
– 0 . 0
1 2
– 0 . 9
– 0 . 0
2 7
1
3 0 0
1 4 0 0
1 5 0 0
1 6 0
0
1 7 0 0
+
0 . 1
+
0 . 0
0 3
+ 0 . 7
+ 0 . 0
2 1
+ 1 . 3
+ 0 . 0
3 8
+ 1 . 5
+ 0 . 0
4 4
+ 1 . 4
+ 0 . 0
4 1
2
2 0 0
2 3 0 0
2 4 0 0
–
0 . 9
–
0 . 0
2 7
– 0 . 9
– 0 . 0
2 7
– 0 . 6
– 0 . 0
1 8

8/19/2019 Maritime Meteorology
http://slidepdf.com/reader/full/maritime-meteorology 259/266
O
B E A P P L I E D T O
T H E O B S E R V
N T H E T R O P I C S
0 1 0 0
0 2 0 0
0 3 0 0
0
– 0 . 1
– 0 . 0
0 3
+ 0 . 3
+ 0 . 0 0
9
+ 0 . 7
+ 0 . 0
2 1
+ +
1 0 0 0
1 1 0 0
1 2 0 0
1
– 1 . 4
– 0 . 0
4 1
– 1 . 1
– 0 . 0 3
2
– 0 . 6
– 0 . 0
1 8
+ +
1 9 0 0
2 0 0 0
2 1 0 0
2
+ 0 . 5
+ 0 . 0
1 5
– 0 . 1
– 0 . 0 0
3
– 0 . 6
– 0 . 0
1 8
– –
absolute humidity 8, 186absolute temperature 186adiabatic heating and cooling 18, 21, 186adiabatic lapse rates 19–25advection 186advection fog 39Agulhas current 156
air masses 68–74 84 186
Bababababa
Be
B
INDEX

8/19/2019 Maritime Meteorology
http://slidepdf.com/reader/full/maritime-meteorology 260/266
air masses 68–74, 84, 186air temperature 7, 183Alaskan current 157Aleutian current 157altocumulus 14–16, photos 5, 6altostratus 14–17, photo 4anabatic wind 186
analogue 187analysis 187anemometer 184, 187aneroid barometer 121–2anticyclone,
development and movement 142–3anticyclone, general
characteristics 77–8, 105–8, 187anticyclone types 105 8
BeBiblblblblBoBrBu
CacaCaca
ca
clouds, frontal 27, 89–92clouds, orographic 27, 204, photo 16coalescence 29, 189col 80–2, 190cold anticyclone 106–7, 190cold front 88, 91–2
cold occlusion 93condensation level 19, 190conditional instability 23–4conduction 190confluence 190convection 190convergence 27, 101–2, 105, 191
conversion tables 222–3Cordonazos 191Coriolis force 44, 109, 191Crachin 57, 191cumulonimbus 14, 15, 34, photo 13cumulus 14–16, photos 11, 12currents, ocean 151–7cyclogenesis 191cyclolysis 191
EaEaEaEl enEq
EqEqEtevey
faFafaFafefofofofo
M A R I T I M E M E T E O R O L O G Y

8/19/2019 Maritime Meteorology
http://slidepdf.com/reader/full/maritime-meteorology 261/266
cyclolysis 191cyclone 116–9, 191cyclostrophic force 191
dangerous semicircleof tropical cyclone 124, 126–8
density 151–2, 159–160
depressions 76, 192depressions,
associated weather 76–7, 89–92depressions,
frontal theory of formation 87–93depressions, movement 94, 97, 140–2depressions, non-frontal 101–4
depressions occlusion of 93 6
fofofofoFöfofo
frefrefrefrefrifrofro
fro
gradient current 151–2gradient wind 45–6, 195greenhouse effect 5, 139Greenland current 155Gregale 196Guinea current 155
Gulf stream 155gust 196
Haar 57, 196hail 31, 35, 196Harmattan 57, 196haze 38, 41, 196
heat transfer 2, 5, 6hectopascals viii, 4, 43, 196height of waves 59–64, 66high see anticyclonehoar frost 33, 196horse latitudes 197humidity, absolute 8, 197humidity, relative 9, 197, 206hurricane 66, photo Force 12, 117, 197
KakakaKaKhKh
Ku
Lalanlaplatlee
LeLeLeLibliglinlololo

8/19/2019 Maritime Meteorology
http://slidepdf.com/reader/full/maritime-meteorology 262/266
hurricane 66, photo Force 12, 117, 197hygrometer 183–4, 197hygroscopic cargoes 217hygroscopic nuclei 11, 197
ice accretion 164ice, development of sea ice 159–160
ice, distribution and seasons of 161–4ice, physics and formation of 159–160ice, warnings and reporting 163–4icebergs 160–1instability, atmospheric see stabilityinstability depression 102–3instruments 181–5
intertropical convergence
lololow
MMM
MmmmmMm
m
ocean currents 151–7Okta 204orographic cloud 204, photo 16orographic depression 103–4Oya shio 157ozone layer 204
pack ice 160Pampero 57, 204pancake ice 160path of TRS 110–3, 125–8period of waves 59–60permanent high 47–9, 107
Peru current 157planetary system,pressure and winds 47–55
planning an ocean passage 177–180polar air 69–74polar front 84–5, 88, 204Portuguese current 155prebaratic 204precipitation 29–33, 205
sasasasaScSc
scsesese
sese
sesesesesesesesese
M A R I T I M E M E T E O R O L O G Y

8/19/2019 Maritime Meteorology
http://slidepdf.com/reader/full/maritime-meteorology 263/266
p p ,pressure, atmospheric 2, 43–57, 205pressure, diurnal variation of 121–2pressure, gradient 43–6, 205pressure, tendency 122, 142, 205pressure, variation with height 4prognostic chart 205
prontour 148, 205propagation, radar 174–6psychrometer see hygrometer
quasi-stationary front 205
radar (meteorological
t f) 41 123 173 6
SeShshshslesm
snSososososoSo
Sumatras 57, 211supercooled water droplets 31, 211super-refraction 176supersaturation 211swell 59, 82, 115, 123synoptic chart 132, 211
synoptic station 211
temperature, diurnal variation 5temperature, sea 7, 30, 40temperature,
variation with height 2, 3, 19–24, 25tendency, barometric 90, 92, 121–2, 188
terrestrial radiation 5–7, 202thermal depressions 101–2, 211thermal wind 143, 211thermometer, wet and dry 183thickness 212thunder 35–6thunderstorms 34–7tidal surge 212tornado 212
vaveVeve
Vi
visvisvo
wawawa
wawawawawawawawawe

8/19/2019 Maritime Meteorology
http://slidepdf.com/reader/full/maritime-meteorology 264/266
track of tropicalrevolving storm 110–113, 125–7
Trade winds 49, 53–4Tramonata 57, 212transfer of heat 2, 5, 6trigger action 35, 212
trochoids, wave 60tropical air 69, 72–3tropical revolving storms 109–119tropical revolving
storms, avoidance 121–130tropical revolving storms, seasons 116–9tropopause 2, 3, 213
t h 2 3 213
weweweweWW
wewwwwww
REEDS MARINE ENGINEERING SERIES
Vol 1 MathematicsVol 2 Applied MechanicsVol 3 Applied HeatVol 4 Naval ArchitectureVol 5 Ship ConstructionVol 6 Basic ElectrotechnologyVol 7 Advanced ElectrotechnologyVol 8 General Engineering KnowledgeVol 9 Steam Engineering Knowledge
Vol 10 Instrumentation and Control SystV l 11 E i i D i

8/19/2019 Maritime Meteorology
http://slidepdf.com/reader/full/maritime-meteorology 265/266
yVol 11 Engineering DrawingVol 12 Motor Engineering Knowledge
Reeds Engineering Knowledge for Deck OffReeds Mathematical Tables and Engineering
Reeds Marine Distance TablesReeds Sextant SimplifiedReeds Skipper’s Handbook Reeds Maritime MeteorologyReeds Marine InsuranceReeds Marine Surveying
R d S T t O ti d E

8/19/2019 Maritime Meteorology
http://slidepdf.com/reader/full/maritime-meteorology 266/266