Marine Harvest Seafood Investor Forum London 19 November 2013.
22
Marine Harvest Seafood Investor Forum London 19 November 2013 Click icon to add picture
-
Upload
kathryn-page -
Category
Documents
-
view
214 -
download
0
Transcript of Marine Harvest Seafood Investor Forum London 19 November 2013.
Marine HarvestSeafood Investor ForumLondon 19 November 2013
Click icon to add picture

Implied protein consumption driven by population growth only
Sources: FAO (2009); FAOstat Food Balance Sheets, United Nations population data; World Population Prospects: the 2012 Revision
Assumption: Constant consumption of protein per capita
3
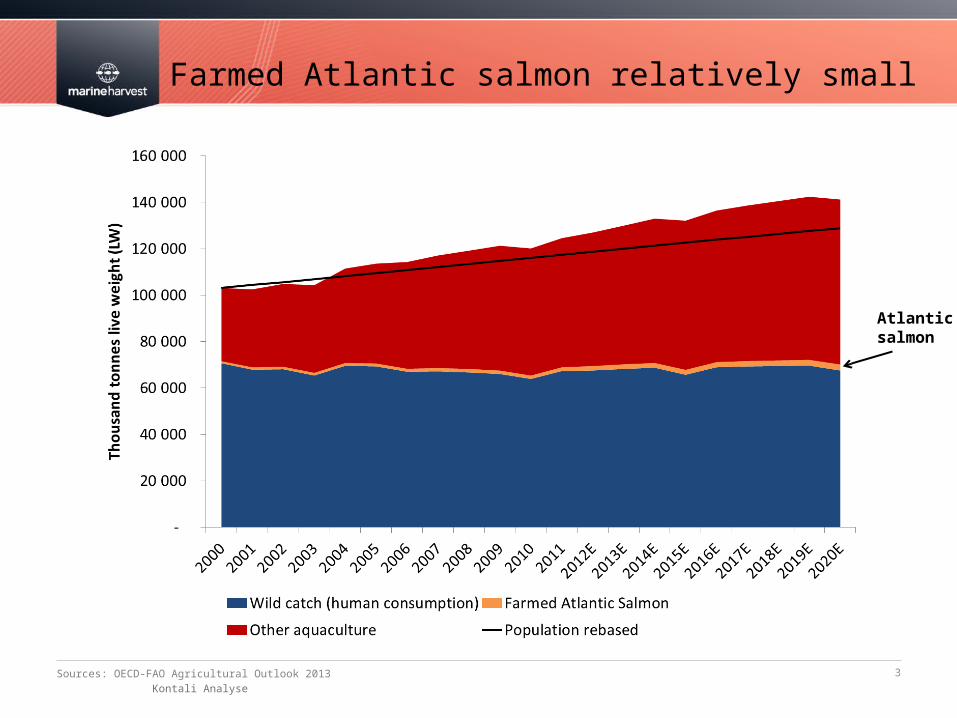
Farmed Atlantic salmon relatively small
Sources: OECD-FAO Agricultural Outlook 2013
Kontali Analyse
Atlantic salmon

4
Large opportunities within aquaculture species
Source: Kontali Analyse

5
Examples of protein co’s and area of potential

6
A unique nutritional package
Proteins:
High quality, easy digestable
proteins
Omega-3:
High content of Omega-3 fatty
acids
Vitamins:
Rich in A, D og B12 vitamins
Mineral:
High content of iodine & selen,
taurin og sterols
7
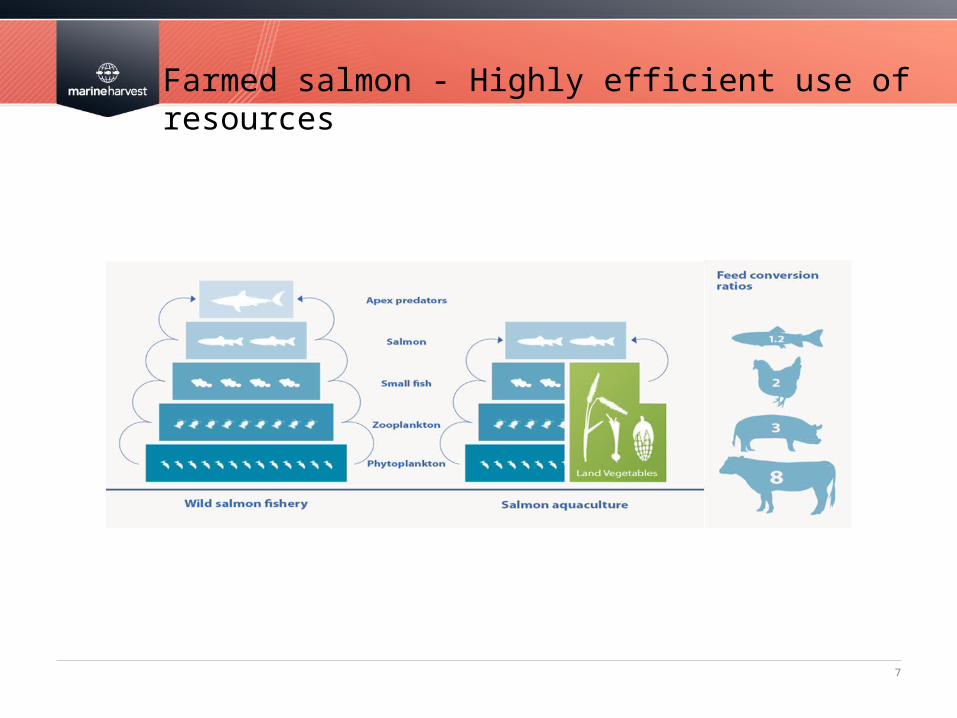
Farmed salmon - Highly efficient use of resources

8
Value CAGR of 8% - Volume CAGR of 6%
9
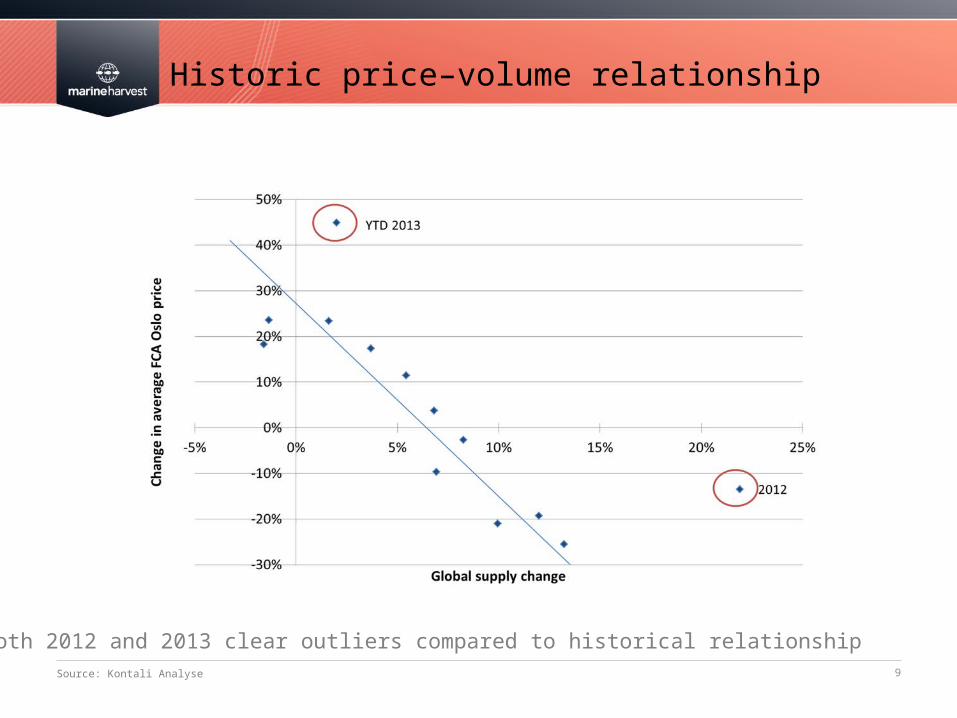
Historic price–volume relationship
Source: Kontali Analyse
Both 2012 and 2013 clear outliers compared to historical relationship
10
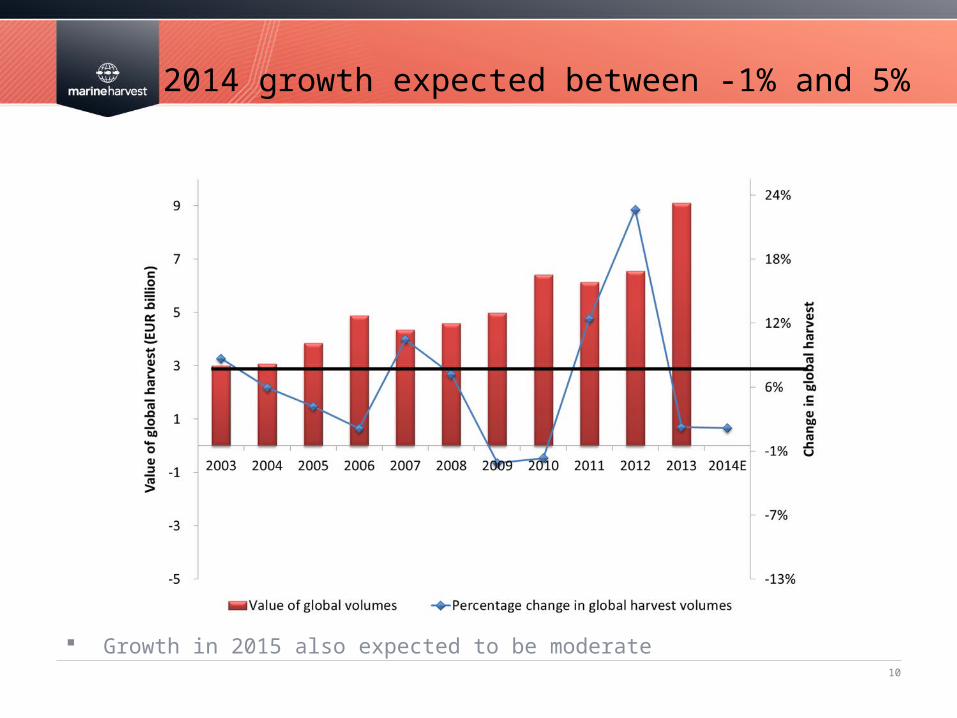
2014 growth expected between -1% and 5%
Growth in 2015 also expected to be moderate

11
Tough biological conditions in Chile….
Weighted average EBIT/kg for selected listed companies in Chile and Rest of World

12
…leads to strong cost increases…
Weighted average EBIT/kg for selected listed companies in Chile
13Source: Sernapesca
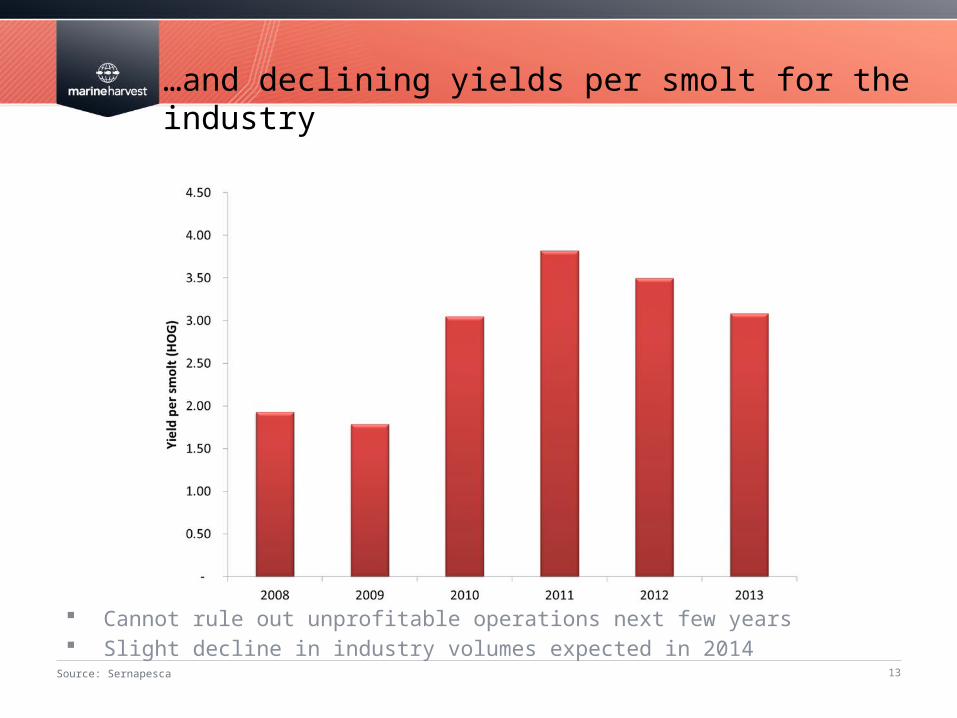
…and declining yields per smolt for the industry
Cannot rule out unprofitable operations next few years Slight decline in industry volumes expected in 2014
14
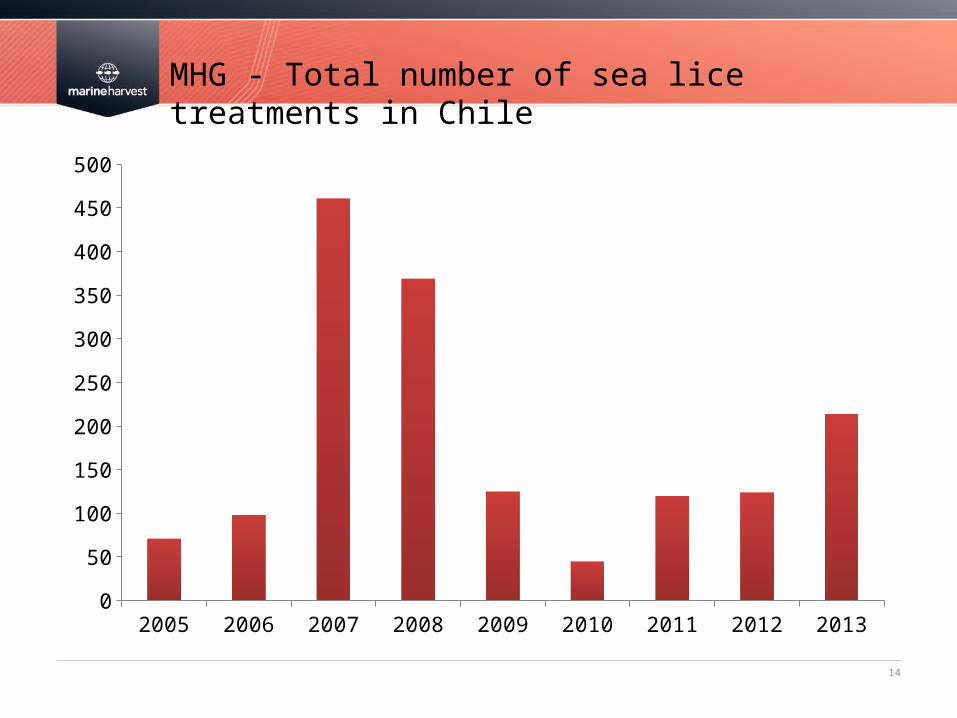
MHG - Total number of sea lice treatments in Chile
2005 2006 2007 2008 2009 2010 2011 2012 20130
50
100
150
200
250
300
350
400
450
500

Initial signals implies more liberal licensing regime Introduction of average Maximum Allowed Biomass constraints Assessment of current licensing system in general
This may lead to increased biological risk and reduced sustainability
Marine Harvest perceives this as a threat due to the industry’s dependency of a well regulated and sustainable framework
Marine Harvest’s recommendation: Continuation of current system with maximum allowed biomass Predictable annual capacity increase of 3-5% for ten years if deemed sustainable Aquaculture Stewardship Council (ASC) certification should be encouraged Establishment of Aquaculture Directorate to secure uniform approach Proceeds from increased capacity directed to host communities
Expectations for new Norwegian government
15

MHG – Leading position across the value chain
16
Feed Farming Sales/VAP
220 thousand tonnes vs. global production of ~2.6m
Marine Harvest business areas
New #1 #1
405 thousand tonnes vs. global production of c.1.85m (22%)
Global sales network
Leading position in VAP
Focus areas:Successful construction and implementation by July 2014
Acquisitive growth in Norway and Chile
Integration of Morpol
Restructuring programme in VAP
Organic growth in VAP
Position:

17
Fish feed project proceeding according to plan
220 thousand tonnes capacity – 60% of MHG requirement in Norway ~NOK 800m investment - Completion July 2014

18
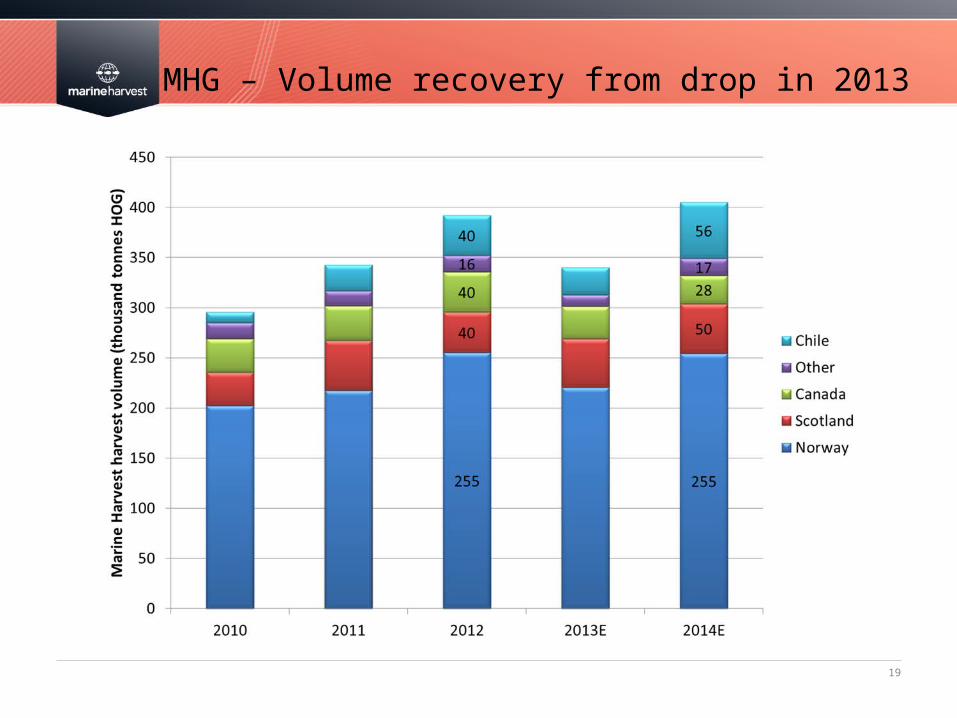
CanadaVolume: 28 000
ChileVolume: 56 000
Faroe IslandsVolume: 9 000
ScotlandVolume: 50 000
IrelandVolume: 8 000
NorwayRegion NorthVolume: 62 000
NorwayRegion MidVolume: 59 000
NorwayRegion WestVolume: 77 000
NorwayRegion SouthVolume: 56 000
Marine Harvest farming regions
19
MHG – Volume recovery from drop in 2013

Marine Harvest sales & marketing structure
20
Europe, Sales & Marketing:• VAP Processing: 60,000MT
finished product, turnover 4,5BN NOK (VAP)
• VAP Production: France, Belgium, Holland, Poland, Czech Rep
• 2500FTE• Sales to retail, food service
and industry• Sales office: France, Belgium,
Spain, Italy, Czech Rep, Norway, Scotland and Ireland
Asia, Sales & Marketing:• Sales 1,1BN NOK. 25,000MT
finished products• VAP Processing: Tokyo &
Shanghai• 115FTE• Sales Office in: Japan, China,
Korea, Taiwan, Thailand and Singapore
America, Sales & Marketing:• VAP Processing: 13,400MT
finished product, turnover 1,0BN NOK
• VAP Processing: USA & Chile• Sales to retail, food service
and industry• 485FTE• Sales Office in: Miami, LA and
Puerto Montt (Chile)
Note: Figures in Europe excluding Morpol
21
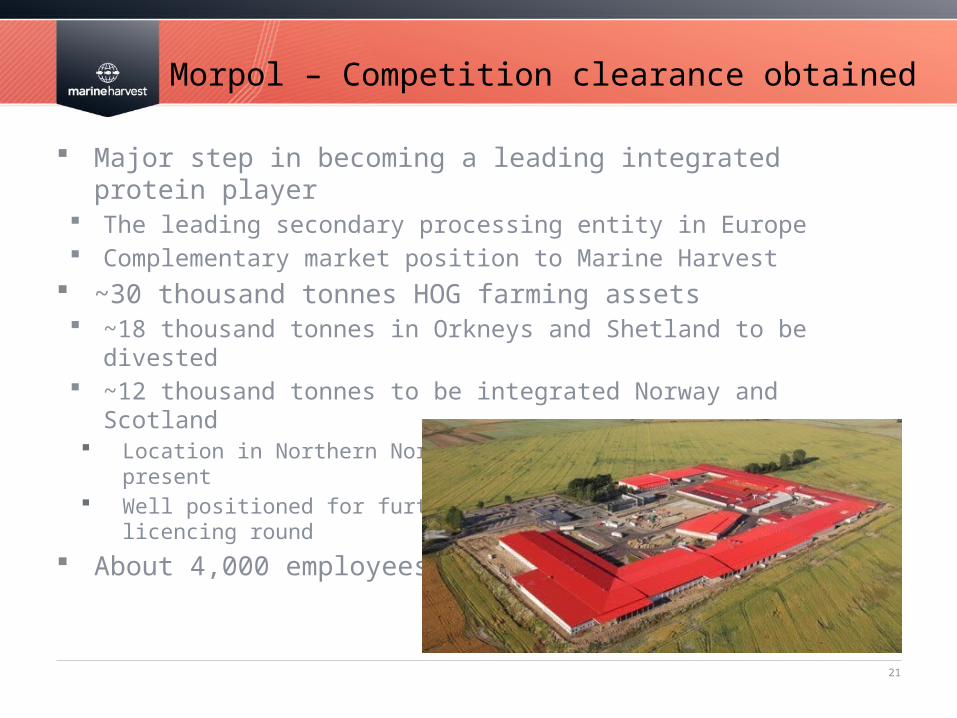
Morpol – Competition clearance obtained
Major step in becoming a leading integrated protein player The leading secondary processing entity in Europe Complementary market position to Marine Harvest
~30 thousand tonnes HOG farming assets ~18 thousand tonnes in Orkneys and Shetland to be divested ~12 thousand tonnes to be integrated Norway and Scotland Location in Northern Norway where MHG is not currently present Well positioned for further licences in this region in 2013 licencing round
About 4,000 employees
22
Outlook
Strong market poses attractive 2014 net cash flow opportunity Forward prices of NOK 38 per kg in 2014 and 35 in 2015 Significantly reduced level of investment
Strategic focus areas Successful development of green-field feed capacity Acquisitions in Norway and Chile Integration of Morpol
Expected impact from the higher than normal investments in 2013 65 000 tonnes increase in 2014 harvest volumes Significant feed capacity in Norway from 2H 2014