Marine and Petroleum Geology Archimerarchimer.ifremer.fr/doc/00139/24981/23102.pdf · Please note...
26
Please note that this is an author-produced PDF of an article accepted for publication following peer review. The definitive publisher-authenticated version is available on the publisher Web site 1 Marine and Petroleum Geology May 2013, Volume 43, Pages 297–309 http://dx.doi.org/10.1016/j.marpetgeo.2013.01.008 © 2013 Elsevier Ltd. All rights reserved. Archimer http://archimer.ifremer.fr Investigation on the geochemical dynamics of a hydrate-bearing pockmark in the Niger Delta Livio Ruffine a, *, Jean-Claude Caprais b , Germain Bayon a , Vincent Riboulot a , Jean-Pierre Donval a , Joel Etoubleau a , Dominique Birot a , Patricia Pignet b , Emmanuelle Rongemaille a , Bertrand Chazallon c , Sylvie Grimaud d , Jérome Adamy d , Jean-Luc Charlou a , Michel Voisset a a IFREMER, Centre de Brest, Unité de Recherche des Géosciences Marines, F-29280 Plouzané, France b IFREMER, Centre de Brest, Unité de Recherche et d’Etude des Environnements Profonds, 29280 Plouzané, France c Laboratoire de Physique des Lasers, Atomes et Molécules (PhLAM), Université Lille 1, UMR CNRS 8523, CERLA FR-CNRS 2416, 59655 Villeneuve d'Ascq, France d TOTAL Oil Company, Pau, France *: Corresponding author : Livio Ruffine, tel.: +33 2 98 22 48 88 ; fax: +33 2 98 22 45 70 ; email address : [email protected] Abstract: A joint industrial project with IFREMER and Total provides insights into the tectonic setting and the geochemistry of a large active pockmark offshore W-Africa in the Niger Delta. The study combines both geophysical (seismic) and geochemical data to infer the dynamics of a 300 m wide pockmark located at 667 m water depth. Two Calypso cores, one at the centre and one outside the pockmark, along with three box-cores, two inside the pockmark and one outside, were collected to study the geochemistry of gas hydrates, carbonates and pore waters. Two seismic lines, a 3D high resolution random line and a 2D high resolution seismic line, provide a good description of the plumbing of the system. The integrated results depict a very active pockmark characterized by several gas charged- bodies, a well identified BSR marking a hydrate accumulation zone, charged from deeper sources via a network of faults. Hydrates and carbonate concretions have been detected inside the pockmark while only the latter has been found outside. The hydrate analyses show that the hydrate-forming gases are of thermogenic origin, albeit overwhelmingly composed of methane. Pore-water analyses reveal the occurrence of anaerobic oxidation of methane coupled with sulphate reduction at shallow depth (∼200 cm). The chloride concentration profile exhibits both values lower than that of seawater which is inherent to hydrate dissociation after core recovery and positive anomalies (values 7% higher than that of seawater background) at the lowermost part of the core. The latter evidence suggests current or recent hydrate formation at this area. The carbonate dating provides additional temporal information and indicates that this pockmark has been active since ∼21 kyr. Highlights ► Seismic surveys and geochemical analyses allow the study of a hydrate-bearing pockmark. ► 2D and 3D seismic shows a BSR, faults and hydrocarbon reservoirs. ► Geochemical analyses highlight AOM-process occurrence and carbonate precipitation. ► Gas source identification was possible and a migration pathway was proposed. ► Carbonate U/Th dating indicates that the large pockmark has been active since 21 kyr. Keywords: Active pockmark ; Anaerobic oxidation of methane ; Gas hydrates ; Carbonates ; Seismic surveys ; Fault system ; U/Th dating
Transcript of Marine and Petroleum Geology Archimerarchimer.ifremer.fr/doc/00139/24981/23102.pdf · Please note...

Ple
ase
note
that
this
is a
n au
thor
-pro
duce
d P
DF
of a
n ar
ticle
acc
epte
d fo
r pub
licat
ion
follo
win
g pe
er re
view
. The
def
initi
ve p
ublis
her-
auth
entic
ated
ver
sion
is a
vaila
ble
on th
e pu
blis
her W
eb s
ite
1
Marine and Petroleum Geology May 2013, Volume 43, Pages 297–309 http://dx.doi.org/10.1016/j.marpetgeo.2013.01.008 © 2013 Elsevier Ltd. All rights reserved.
Archimer http://archimer.ifremer.fr
Investigation on the geochemical dynamics of a hydrate-bearing pockmark in the Niger Delta
Livio Ruffinea, *, Jean-Claude Capraisb, Germain Bayona, Vincent Riboulota, Jean-Pierre Donvala, Joel Etoubleaua, Dominique Birota, Patricia Pignetb, Emmanuelle Rongemaillea, Bertrand Chazallonc,
Sylvie Grimaudd, Jérome Adamyd, Jean-Luc Charloua, Michel Voisseta
a IFREMER, Centre de Brest, Unité de Recherche des Géosciences Marines, F-29280 Plouzané, France b IFREMER, Centre de Brest, Unité de Recherche et d’Etude des Environnements Profonds, 29280 Plouzané, France c Laboratoire de Physique des Lasers, Atomes et Molécules (PhLAM), Université Lille 1, UMR CNRS 8523, CERLA FR-CNRS 2416, 59655 Villeneuve d'Ascq, France d TOTAL Oil Company, Pau, France *: Corresponding author : Livio Ruffine, tel.: +33 2 98 22 48 88 ; fax: +33 2 98 22 45 70 ; email address : [email protected]
Abstract: A joint industrial project with IFREMER and Total provides insights into the tectonic setting and the geochemistry of a large active pockmark offshore W-Africa in the Niger Delta. The study combines both geophysical (seismic) and geochemical data to infer the dynamics of a 300 m wide pockmark located at 667 m water depth. Two Calypso cores, one at the centre and one outside the pockmark, along with three box-cores, two inside the pockmark and one outside, were collected to study the geochemistry of gas hydrates, carbonates and pore waters. Two seismic lines, a 3D high resolution random line and a 2D high resolution seismic line, provide a good description of the plumbing of the system. The integrated results depict a very active pockmark characterized by several gas charged-bodies, a well identified BSR marking a hydrate accumulation zone, charged from deeper sources via a network of faults. Hydrates and carbonate concretions have been detected inside the pockmark while only the latter has been found outside. The hydrate analyses show that the hydrate-forming gases are of thermogenic origin, albeit overwhelmingly composed of methane. Pore-water analyses reveal the occurrence of anaerobic oxidation of methane coupled with sulphate reduction at shallow depth (∼200 cm). The chloride concentration profile exhibits both values lower than that of seawater which is inherent to hydrate dissociation after core recovery and positive anomalies (values 7% higher than that of seawater background) at the lowermost part of the core. The latter evidence suggests current or recent hydrate formation at this area. The carbonate dating provides additional temporal information and indicates that this pockmark has been active since ∼21 kyr.
Highlights
► Seismic surveys and geochemical analyses allow the study of a hydrate-bearing pockmark. ► 2D and 3D seismic shows a BSR, faults and hydrocarbon reservoirs. ► Geochemical analyses highlight AOM-process occurrence and carbonate precipitation. ► Gas source identification was possible and a migration pathway was proposed. ► Carbonate U/Th dating indicates that the large pockmark has been active since 21 kyr.
Keywords: Active pockmark ; Anaerobic oxidation of methane ; Gas hydrates ; Carbonates ; Seismic surveys ; Fault system ; U/Th dating

2
1. Introduction
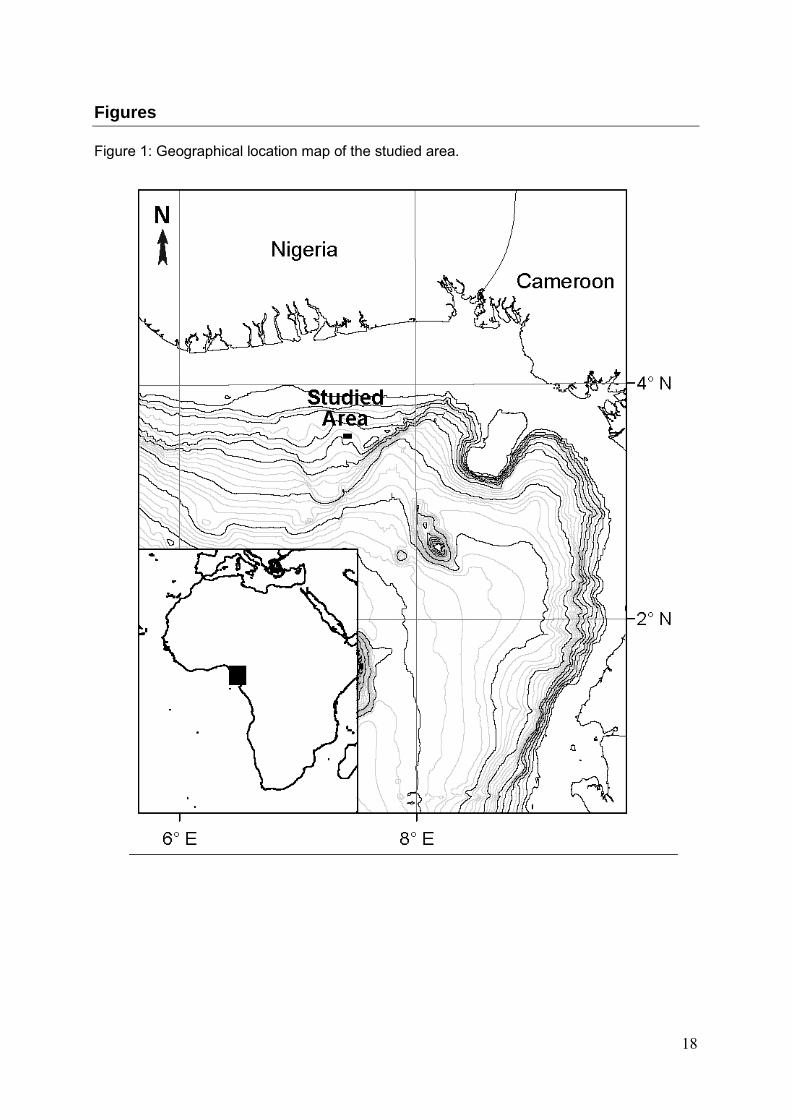
Pockmarks are generally defined as nearly circular depressions resulting from the near-surface sediment deformation on the seafloor (Cathles et al., 2009; Hovland, 1989; Hovland, 2003; Hovland et al., 1997; Hovland et al., 2002; Hovland and Judd, 1988; Hovland et al., 1984). These are dynamic structures generated by fluid migration throughout the sediment. The fluids can be rich in methane, which has either a microbial (biogenic) or a thermogenic origin. For biogenic gas generation, the migration pathway of the gases is short; accordingly the gases can be trapped near their production area as free gas if a geologic cap rock lies at the top. In the case of a thermogenic origin, the gases may contain heavier hydrocarbons. They come from leaking deep subsurface reservoirs and seismic investigations can help in providing a better understanding of the migration pathways to the seabed. Frequently, such a study can even lead to the identification of the reservoirs. Depending on temperature and pressure conditions, pore-water chemical compositions and heat flow pattern of the shallow sediment, methane can either escape upwards to the seafloor then released to the seawater or be trapped as gas hydrates within the Gas Hydrate Stability Zone (GHSZ) (Hustoft et al., 2009; Hustoft et al., 2007; Plaza-Faverola et al., 2012; Rajan et al., 2012). The latter also releases methane to the seawater when it undergoes a destabilisation processes, e.g. dissolution or dissociation (Sultan et al., 2004; Sultan et al., 2010). The discharged methane influences several biogeochemical processes. Pockmarks are often characterized by methane seeps which provide the energy for the development of different chemosynthetic communities (Hovland and Judd, 1988; Menot et al., 2010; Olu et al., 2009). The methane released from seeps could be oxidized by bacterial consortia or archea through a biogeochemical reaction called anaerobic oxidation of methane (AOM) (Boetius et al., 2000; Joye et al., 2004; Orcutt et al., 2004; Treude et al., 2003), which in turn, supply the chemical components for authigenic carbonate precipitations (Feng et al., 2009; Greinert et al., 2002; Greinert et al., 2001; Naehr et al., 2007; Peckmann et al., 2001). Thus, methane seeps, gas hydrate deposits, carbonate precipitations and the presence of chemosynthetic communities are features which could be found on pockmarks and which could influence their morphology, sediment lithology and evolution (Hovland and Judd, 1988; Sultan et al., 2010). Accordingly, investigations of such features by considering both spatial and temporal aspects are key to qualitatively and quantitatively understand their behaviour. The focus of this paper is placed on the description of an area characterized by a large active pockmark. It is located in the Niger Delta, off Nigeria (Figure 1). This study is mainly concerned with the gas and fluid migration pathways as well as the geochemical processes occurring at the studied area. It is based on the geochemistry of pore waters, carbonates and gas hydrates, with emphasis on their inter-relationships. The resulting data are integrated with sediment core analysis and both 3D high resolution and 2D high resolution seismic lines.
2. Geological setting
The studied area is located offshore of the modern Niger Delta, on the west coast of central Africa, in the Gulf of Guinea (Figure 1). The Niger Delta margin is undergoing deformation by gravity-driven tectonics as the sediment fill is laid on a mobile substratum (Bilotti and Shaw, 2005; Briggs et al., 2006; Corredor et al., 2005; Damuth, 1994; Garziglia et al., 2010; Riboulot et al., 2012). This substratum is formed by Early Tertiary overpressurised shale. The mobile shale has been deformed since the Oligocene, forming the major structures of the delta (Hooper et al., 2002; Wiener et al., 2006). The studied area is located on the continental slope, at water depth ranging from 600 to 800 m. It has been defined as a mud-
3
diapir province (Corredor et al., 2005), and is characterized by a variety of seafloor features, especially by numerous circular and sub-circular features (Figure 2A).
3. Materials and methods
3.1. Geophysics
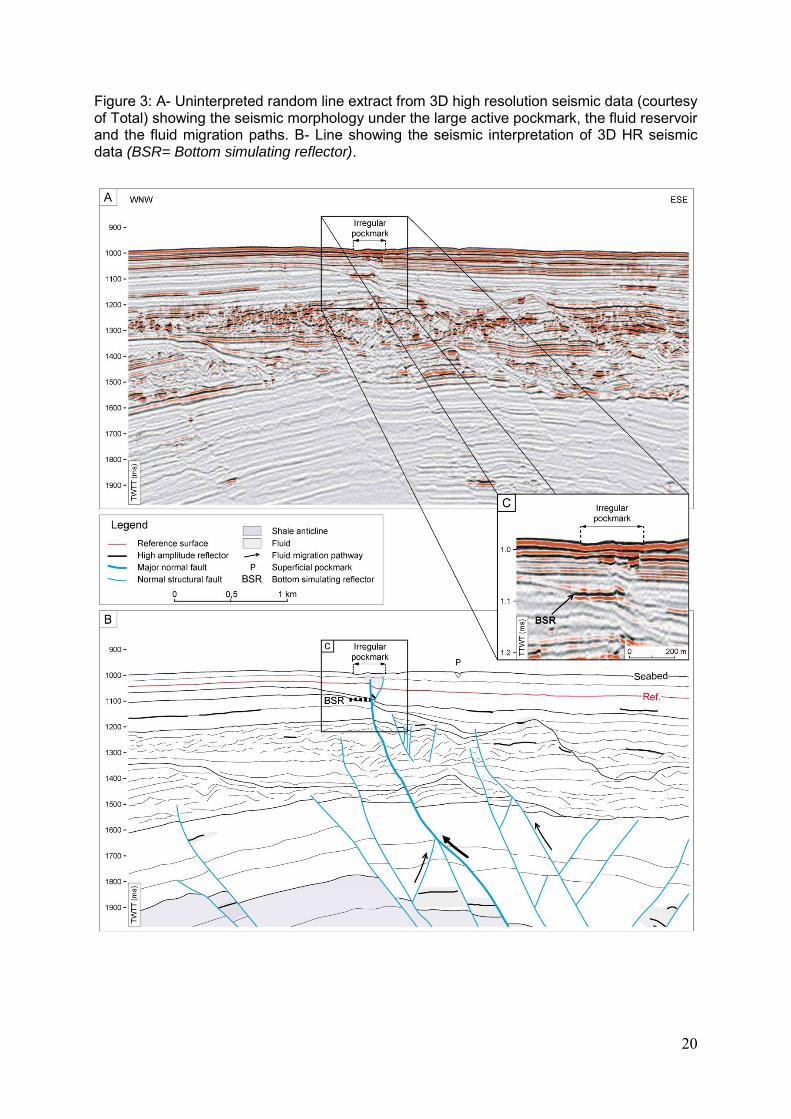
The bathymetric map presented in Figure 2 comes from a derivate bathymetry obtained from seafloor-reflector picking on 3D industrial seismic data. 3D high resolution (HR) seismic data with a vertical resolution of 7 m and a bin size of 6.25 x 12.5 m, and penetration of about 800 ms two-way-time (TWT) were provided by TOTAL (Figure 3). Seismic profiles were interpreted on a work station and the seismic reflector picking was performed with the SISMAGE software developed by TOTAL (Guillon and Keskes, 2004). Details about the data processing can be found elsewhere (Ker et al., 2010). 2D very high resolution (VHR) seismic data (Figure 4) were acquired during the ERIG 3D cruise. For a precise description of the internal architecture of the pockmark, a deep-towed for ultra-high resolution seismic data from the Ifremer SYSIF system (Ker et al., 2010; Marsset et al., 2010) has been used. These data have a vertical resolution of 30 cm, a horizontal resolution of 6 m and a penetration of 100 ms (TWT).
3.2. Sediment sampling
Two piston cores (Calypso) were collected (CS-30 and CS-36) at the studied area as illustrated on Figure 2. The core locations were chosen from multichannel seismic profiles and previous studies of the site. After recovery, the cores were immediately cut into segments of 1 m length and stored at 4 °C prior to sampling. The whole round sediment sections were capped at both ends and transported to the shipboard laboratory for pore-water extraction at 4 °C, then cut lengthwise into archive and working halves. The working halves were used for core logging, prior to being sampled for pore-water extraction. The 10.74 m length core CS-36 was used as reference for it was located well outside the hydrate zone, at ~ 3500 m northeast from the large active pockmark. This core consists mainly of a matrix of clay and silty clay with an inclusion of clayey silt from 1.4 m to 3.9 m. Foraminifera were found along the core and bivalves at ~10 m depth. Core CS-36 is also characterized by the presence of bioclasts from 6 mbsf to its lowermost part and dispersed bioturbation evidences over its entire length. It shows evidences of neither gas hydrates nor carbonate concretions. Core CS-30, with a length of 6.71 m, consists of a unique lithologic unit defined by a matrix of clay and silty clay. The upper 1.5 meters contains a few numbers of foraminifera and bivalves. Carbonate concretions were found at the interval 2 to 3 mbsf while gas-hydrates were located at depths ranging from 4 mbsf to down the core (Figure 5). Fissures and cracks were concentrated in the sediment section between 2 and 4 mbsf. In addition to Calypso cores CS-36 and CS-30, three box-cores (Usnel) were also recovered from the studied area (Figure 2). These cores (USN 12, USN 13 and USN 16) were of about 60 cm length, and contained numerous centimeter-size carbonate concretions. The concretions correspond typically to the „mudclast breccia‟ type carbonate, described previously at other gas hydrate-bearing areas from the Niger Delta margin (Bayon et al., 2007; Rongemaille et al., 2011).
3.3. Pore water analyses
For each core section, pore water has been sampled for chemical analyses using the Rhyzon® soil moisture samplers. This is a capillary-driven system which consists of a hydrophilic, porous polymer tube of 2.5 mm in diameter and 50 mm length. The tube is
4
introduced into the sediment by its capillary-bearing part while it is permanently connected to a vacuum tube of ~10 mL to the opposite end for pore-water collection. The samplings were performed with a resolution of about 20 cm. Alkalinity was measured on ship directly after sampling. The procedure was as follows: 1 mL of pore water was sampled and analysed by direct titration with ultrapure 0.02 N HCl in an open cell. The total dissolved sulphide (TH2S) was determined by colorimetry on board using the colorimetric methylene blue method with adapted dilution (Cline, 1969). The remaining samples were acidified or stabilized with sodium azide when devoted to methane measurements. They were stored in 12 mL vials prior to being analysed onshore for concentration measurement of methane, sulphate, chloride, calcium, magnesium, potassium and sodium. Methane was analysed by the headspace technique using a gas chromatograph (Perichrom 2100) equipped with a flame ionisation detector (FID) connected to a headspace injector (Dani HSS 86.50). Dissolved elements were analysed by ionic chromatography using a Dionex DX-120 instrument equipped with a 4 mm AS-40 auto sampler. The detection limit was 0.1 ppm for all cations. All peak areas were quantified against equivalently diluted International Association for Physical Sciences of Oceans (IAPSO) standard seawater; the latter was analysed at the beginning of each run.
3.4. Geochemistry and U-Th dating of carbonate concretions
The mineralogical and bulk major element composition of selected carbonate concretions was determined by X-ray diffractometry (XRD) and wavelenght dispersive X-ray fluorescence spectrometry (WD-XRF), respectively. The authigenic carbonate samples recovered from pockmark subsurface sediments are composed primarily of aragonite or high-Mg calcite. A minor amount of dolomite was found in the high-Mg rich samples. A few carbonate samples were analysed for stable oxygen and carbon compositions at the LOCEAN laboratory (University of Pierre et Marie Curie, Paris), using an Isoprime mass spectrometer. Details on the 13C and 18O measurements are given in Rongemaille et al. (2011). Age constraints on the formation of the studied carbonate samples were obtained by U/Th dating following the procedures described in Bayon et al. (2009). Selected areas of polished sections for a series of carbonate concretions were drilled using a MicroMill (New Wave Research) microsampling system to try to avoid significant contamination from both detrital (clay-rich areas, silicate minerals) and biological (shell debris, foraminifera) components. Typically, about 1-3 mg of carbonate powder was sampled for each U/Th isotope measurement. Details on the chemical and analytical procedures can be found elsewhere (Bayon et al., 2009a; Bayon et al., 2009b; Rongemaille, 2011; Rongemaille et al., 2011). Briefly, a 229Th-236U spike (Oxford Spike) was added to the carbonate samples prior to digestion with a mixed (3:1) HCl:HNO3 solution. U and Th were purified using anion exchange chromatographic method, after co-precipitation onto Fe-oxyhydroxides. The U and Th concentrations as well as isotopic compositions were determined on a Neptune (Thermo Fisher Scientific) MC-ICP-MS at the Pôle Spectrométrie Océan (Brest, France). The U/Th ages were calculated using an isochron approach to correct for detrital contamination. The sediment end-member used for isochron calculations was defined by analysing three bulk sediment samples from the Niger Delta area yielding (238U/232Th) and (230Th/232Th) ratios of 1.20 ± 0.12 and 1.20 ± 0.15, respectively.
3.5. Gas hydrate analyses
Gas hydrates were massive and up to 5 cm thick (Figure 8). All recovered pieces were stored in liquid nitrogen at 77 K to avoid further decomposition before being analysed in the laboratory. The analysis of the hydrate-bound gases was as follows: small pieces of hydrates were allowed to dissociate in a 20 mL glass tubes which were evacuated afterwards. The gases were extracted from the hydrate samples using a custom-made gas extraction set-up (Charlou et al., 2004) while the hydrate water was collected and stored in a 20 mL glass
5
tube. The resulting gases were transferred into 10 mL glass tubes at a pressure ranging between 2 and 3 bars. Gas composition measurement was carried out at the Laboratoire de Géochimie et Métallogénie of IFREMER. Structural analysis of the hydrate samples and isotopic compositions were performed at the PhLam laboratory and Isolab, respectively. For compositional analysis, the glass tubes were directly connected to a 6-port sampling valve of a 7890A Agilent gas chromatograph coupled with an Agilent 5975C quadrupole mass spectrometer detector (GC-MS). The gas hydrate structure was determined by Raman spectroscopy using a LabRam HR 800 UV (Jobin-Yvon) equipped with a back-illuminated CCD detector. Isotopic measurements were carried out with a gas chromatography-isotope ratio-mass spectrometer (GC-IR-MS). The δ13C values are reported as parts per thousand (‰) relative to the Viennia PeeDee Belemnite Standard (VPDB), and the δD values are reported as ‰ relative to the Vienna Standard Mean Ocean Water (VSMOW). The uncertainty in the gas compositions, δ13C and δD are given as ± 2 %, ± 0.1 to 0.3 ‰ and ± 1 to 3 ‰ respectively. The hydrate water contains both organic molecules and dissolved elements. Its analysis can provide us with further evidences on the origin of the hydrate-bound gases as it allows the identification of organic molecules such as petroleum-reservoir derived compounds or microbial products. They were extracted from the hydrate water and concentrated by means of the Stir Bar Sorptive Extraction (SBSE) method. A complete description of the analytical protocol used here can be found elsewhere (Konn et al., 2009). For the purpose of component identification, the NIST02 library database has been used. Only compounds with a confidence in the identification of at least 90 % have been selected and listed.
4. Results
4.1. Geophysical investigation of the studied area
Figure 2A shows a seafloor characterized by a large number of circular and nearly circular black patches. These represent pockmarks, the shape of which may be influenced by several factors such as gas hydrate formation or dissolution, dewatering, presence of fault systems, buried mass transport deposits as well as fluid seepage from petroleum reservoirs (Hovland, 2003; Hovland et al., 1984; Sultan et al., 2010; Sultan et al., 2011). There is a large pockmark of about 300 m of diameter and 3 m depth. It is located on the northeast flank of a dome at a water depth of ~ 667 m. Figure 2B represents a magnified view of the large pockmark with the location of the investigated cores and the seismic cross-sections (profiles 1 and 2) determined from a 3D HR block. As can be seen in Figures 3A and B, the subsurface structure is characterized by several normal faults. There is a main one coming up from depth within the fold and reaching the near subsurface at the centre of the pockmark where gas hydrates have been recovered. Figure 3A clearly shows a reflector characterized by a negative polarity which represents a Bottom Simulating Reflector (represented in dashed in Figure 3B). It corresponds to the base of the GHSZ. Considering a wave speed of 1500 m.s-1 within the sediment column, the calculated depth for the BSR is of about 75 mbsf. One can also see that the BSR directly intersects the main fault. Two hydrocarbon reservoirs can also be seen, sealed by three normal faults and located at about 675 mbsf. Figures 4A and B represent a magnified view of the large pockmark (the dashed box on Figure 3A). The corresponding picture was made from very high resolution imaging. The anomalies in the amplitudes observed on the pockmark suggest the occurrence of fluids and the signal at the centre is stronger, which probably defines the fluid-surrounded GHSZ. From Figures 4A and B, fluid seems to migrate to the seafloor at the rim of the pockmark. However, neither gas plumes nor intense fluid seepages were seen during the survey.
6
4.2. Pore water geochemistry
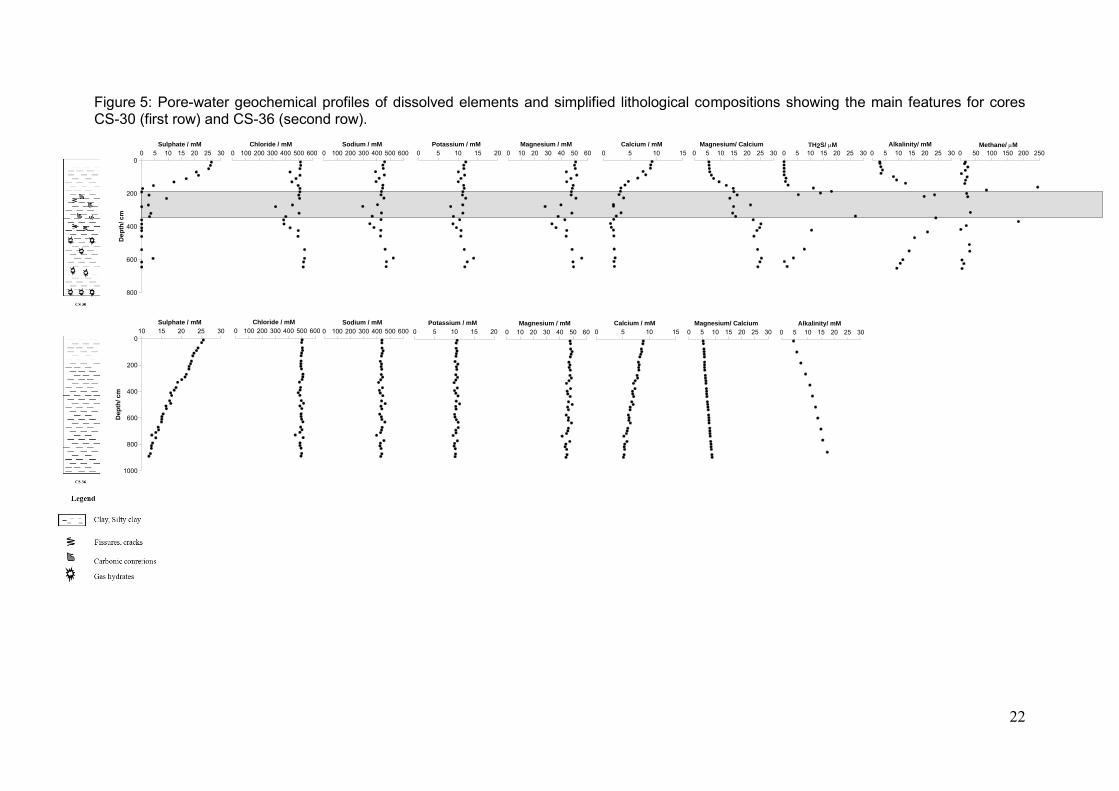
In Figure 5, concentration-depth profiles of methane, sulphate, chloride, calcium, magnesium, potassium, sodium, total sulphide and alkalinity are shown for the studied cores. For core CS-36, the pore-water concentration of all species exhibits linear concentration-depth profiles which are representative of a diffusive dominated process (Boudreau, 1997; Boudreau and Jørgensen, 2001). Sulphate and calcium concentrations decrease slowly with depth from 25 mM to 12 mM and 9 mM to 5 mM, respectively. All others species exhibit a constant concentration profile with a value similar to that of seawater. Pore-water profiles of core CS-30 have a shape very different from those of core CS-36. Overall, there is a scattering on the measured points for all species; however a general trend can be drawn from the dataset. The scattering is the result of gas hydrate dissociation during core retrieval as the core is exposed to decreasing pressure and increasing temperature. Such a core recovery gives rise to potential destabilisation of the hydrates accompanied by fresh water release and therefore leads to the dilution of the pore water surrounding the hydrates. The measured concentrations of chloride, magnesium, potassium, sodium, are significantly lower than that of seawater at the interval 150- 500 cm where carbonates and hydrates have been found. At the lowermost part of the core, chloride concentrations increase up to 550 mM. This is 7 % higher than that of seawater. The same trend is observed for sodium and potassium. Sulphate profile displays a slightly concave up shape with a rapid depletion from the seafloor to the first 200 cm and near-zero values at around 200 cm depth and below. This depth coincides with a zone of high methane concentrations and therefore corresponds to the upper boundary of the Sulphate Methane Transition Zone (SMTZ), which has a thickness of ~150 cm. Interestingly both total alkalinity and total sulphide profiles exhibit an increase in concentrations from the seafloor to the SMTZ-depths where their maximum values are found, then a decrease to the lower part of the core. Such an excellent correlation between sulphate, methane, alkalinity and sulphide concentrations is consistent with anaerobic oxidation of methane coupled with sulphate reduction at the SMTZ (Kastner et al., 2008; Lim et al., 2011; Maignien et al., 2011; Niewohner et al., 1998; Reeburgh, 1976; Regnier et al., 2011; Snyder et al., 2007; Wallmann et al., 2006b). Calcium concentrations decrease strongly to approximately 2 mM in the upper 200 cm of the core, then remained almost constant. Such a calcium profile is indicative of authigenic carbonate precipitation at the SMTZ.
4.3. Geochemical composition of carbonate concretions and U/Th dating
The geochemical data for the studied carbonate concretions are given in Table 1 for the bulk composition, the 13C and the 18O, and in Table 2 for the U/Th analysis. The carbonate samples display a wide range of MgO (from ~ 0.9 to 5.7 wt %) and Sr (from ~ 600 to 8200 ppm) contents, depending on the relative amount of aragonite versus high-Mg calcite. The sum of concentrations for detrital-bound elements (i.e. SiO2, Al2O3, Fe2O3, TiO2, K2O) ranges from about 15 to 30 wt %, which indicates that these authigenic carbonate samples have incorporated significant amounts of sediments upon formation. The measured 13C (between ~-22 and -28 ‰ VPDB) and 18O (between ~ 3.2 and 4.5 ‰ VPDB) bulk carbonate values are similar to those reported for concretions from other pockmark settings in the Niger Delta margin (Rongemaille et al., 2011). U and Th isotope data for carbonate samples are shown in Table 2, with calculated U/Th isochron ages. The calculated ages for the carbonate concretions for USN 12 and USN 13 are ~ 21 kyr and between ~ 5.9 and 7.7 kyr BP, respectively. Two concretions from core CS-30 yielded initial 234U values lower than the Late Quaternary seawater 234U (~ 145 ± 15 ‰; (Henderson, 2002), indicating possible diagenetic and/or contamination issues that could compromise the validity of their calculated U/Th ages (indicated as “nd” in Table 2).
7
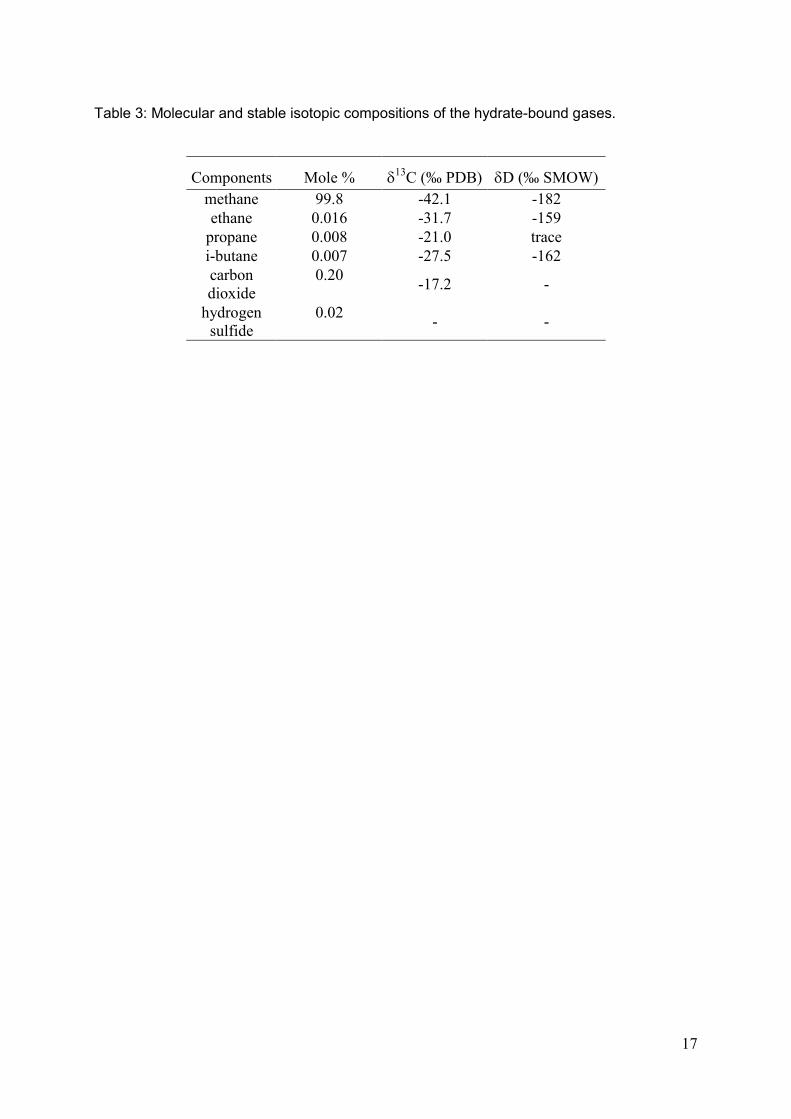
4.4. Gas-hydrate geochemistry
The molecular composition of the hydrate-bound gases is listed in Table 3. The gas hydrates are methane-dominant as this component accounts for 99.8 % of the total composition. The results also show that the analysed samples contain a measurable amount of heavier hydrocarbons (C2 to C4). C1/(C2 + C3) ratio is of ~4150. The abundance of methane is an evidence for the presence of structure I hydrate (Sloan and Koh, 2007). This conclusion has been confirmed by Raman spectroscopy analysis, as shown in Figure 6. The peak at 2902 cm-1 is attributed to C-H stretching of methane and is representative of the methane trapped in the large cage of structure I (Chazallon et al., 2007). The peaks at about 1275 cm-1 and 1375 cm-1 indicate the present of carbon dioxide trapped in the hydrate lattice as well. Those results are well in agreement with previous Raman spectroscopic study carried out on gas-hydrate samples collected in the nearby area during the Neris Cruise (Chazallon et al., 2007). The isotopic compositions of the hydrate-bound gases were determined in order to define their origin. The results are presented in Table 3. The 13C values of methane, ethane, propane, iso-butane and carbon dioxide are -42.1 ‰, -31.7 ‰, -21.0 ‰, -27.5 ‰ and -17.2 ‰, respectively. The D values of methane, ethane and iso-butane are -182 ‰, -159 ‰, -162 ‰, respectively. The analysis of the hydrate-water revealed the presence of toluene, 1-methyl anthracene, 1-methyl naphthalene, 1-6 dimethyl naphthalene and adamantane. These are cyclic or polycyclic molecules which are ubiquitous in petroleum fluids.
5. Discussion
5.1. Evidence of deep fluid sources
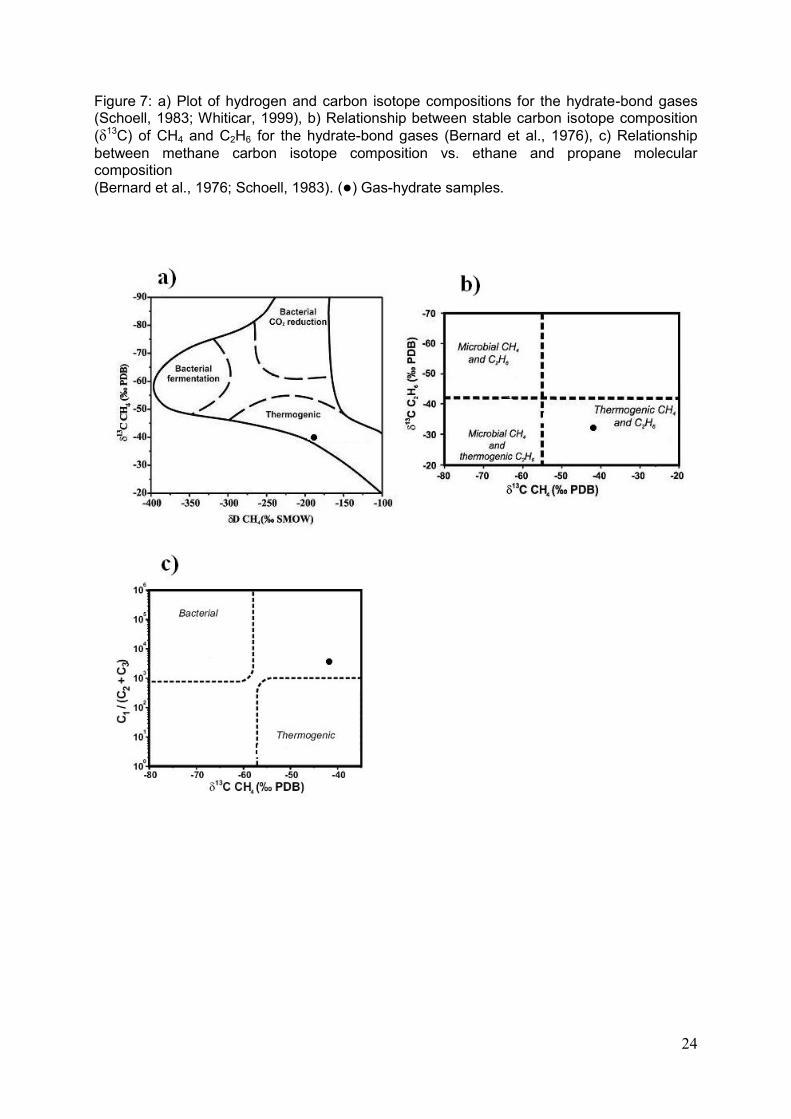
The accumulation of gas hydrates within a zone where temperature and pressure conditions are favourable to their formation depends on the availability of a hydrocarbon source to supply the hydrate-forming gases, the thermal regime of the setting and the chemistry of the pore water. The data presented in Figures 3A and B supports two major conclusions: 1) The large pockmark is characterised by an accumulation of gas hydrates, with a BSR delimiting its stability zone. 2) Several gas-charged bodies are connected to the pockmark through a major fault. Thus, these conclusions argue for a migration of gases and possibly fluids from hydrocarbon reservoirs within the sedimentary succession, through the fault system which supplies the GHSZ at the centre of the pockmark. The geochemical analyses carried out on the hydrate samples in the frame of this study reveal a thermogenic origin for the gases although methane is overwhelmingly present. From a general point of view, gas hydrates are not the more suitable material to be used for discussing the origin of gases as their crystallisation induces molecular fractionation with preferential enclathration of heavier hydrocarbons (Hester et al., 2007; Ruffine et al., 2010; Sassen et al., 2000). However, due to the high-methane content in our samples it is reasonable to assume that the original gas source contains at least as much methane as the hydrates, and even if fractionation has occurred here it will have a negligible effect on the composition. Therefore the isotopic analysis of the hydrate-bound gases can provide fairly realistic evidences on their origin. Stable carbon isotope signature of methane is commonly used to determine of whether or not methane was microbially or thermally produced (Bernard et al., 1976; Chung et al., 1988; Schoell, 1980; Schoell, 1983; Whiticar, 1994; Whiticar, 1999). As shown in Table 3, the 13C and D values for methane in the hydrate samples are -42.1 ‰ and -182 ‰, respectively. This means that the corresponding hydrate-bound gases are primarily of thermogenic origin. In addition, Table 3 shows presence of butane which is produced only by thermogenic processes. The thermogenic origin of the gases is better highlighted in Figure 7 which plots three diagrams on the origin of the methane according to the CD diagram (Schoell, 1983;

8
Whiticar, 1999), the genetic characterization for methane and ethane (Bernard et al., 1976) and the dryness of the gas (Bernard et al., 1976; Schoell, 1983), respectively. Figures 7 a) and b) show that both methane and ethane are well inside the field of thermogenic gases. The presence of cyclic and polycyclic compounds in the hydrate water is in agreement with this interpretation. These molecules were presumably inserted in between the hydrate crystals during their growth or dissolved in the residual free water as they cannot fit into the water lattice. They are the most resistant to biodegradation (Jones et al., 2007; Pallasser, 2000; Sloan and Koh, 2007), therefore are likely to be found in shallow sediment as evidences of deep-reservoir fluid migration. Moreover, the 3D seismic random line provides a good picture of the plumbing of the system, which is made up of normal faults connected with hydrocarbon reservoirs (Figures 3A and B). These faults are in turn related to the major fault which provides the main fluid conduit to the GHSZ (Figure 4). On the other hand, Figure 7 c) plots the hydrate-bound gases above the thermogenic zone, within the transition zone because of its high level of dryness. This region of the diagram is not clearly defined. The high level of dryness may be due to molecular fractionation and/ or biodegradation of reservoir fluid during their migration. A possible contribution of biogenic gases cannot be definitely ruled out (Milkov and Dzou, 2007; Milkov, 2011). Thus, a portion of methane could be generated by methanogenesis at the subsurface level. This can therefore increase the total amount of methane in the migrating gases, and lower its stable carbon isotopic value.
5.2. Geochemical processes associated with the large pockmark
5.2.1. Gas hydrate formation and dissociation Core CS-30 contained a high concentration of hydrates at its lower part. Most of the gas hydrates recovered in the centre of the pockmark were massive (Figure 8). However, a few vein-like sheets of hydrates in between sediment layers have been sampled. At the lowermost part of core CS-30, the sediment intervals where hydrates were not present were dryer than at others locations along the core. Such a high hydrate concentration cannot be generated solely by dissolved gases (Holland et al., 2008; Paull and Dillon, 2001). Negative chloride anomalies (concentrations lower than that of seawater) can be used as proxi in hydrate setting to evaluate their distribution within non-pressurised cores as the pore-water freshening is inherently linked to hydrate dissociation upon recovery (Guan et al., 2009; Malinverno et al., 2008; Ruffine et al., 2012; Torres et al., 2004; Ussler and Paull, 1995). For core CS-30, chloride concentrations lower than that of seawater are mainly found at depths ranging from 300 to 500 cm. This is in good agreement with the observed hydrate distribution presented on the simplified core log (Figure 5). The same behaviour is observed for the magnesium, potassium and sodium profiles. However, Figure 5 also indicates negative anomalies for core CS-30 at depths ranging between 100- 300 cm where sizeable authigenic carbonates were found. This is probably due to fresh water infiltration through the partially liquefied sediment through fissures and cracks. Interestingly, the deviation to high concentrations with chloride concentration values of ~550 mM at the lowermost part of the core is likely a consequent of current or recent hydrate formation as already observed on Hydrate Ridge (Haeckel et al., 2004; Torres et al., 2004). This positive deviation can be correlated with the dry aspect of the sediment observed at the same location. Thus, the formation of massive hydrates nearby would drain the water from the surrounding sediment, enhancing locally the salt concentration of the remaining pore water. The latter will be equilibrated with the seawater over time.
5.2.2. Constraint on the SMTZ and carbonate precipitation At cold seeps, there are two possible reactions responsible for sulphate depletion in shallow sediments: AOM and organic matter oxidation (Berner, 1980; Boudreau and Westrich, 1984;
9
Claypool and Kaplan, 1974; Kim et al., 2007; Wallmann et al., 2006a). In hydrate-bearing setting, methane is released from the hydrates and transported towards the seafloor through an ascending methane-rich fluid (Noethen and Kasten, 2011). A flux of methane is then created, allowing for the development of methane-dependant ecosystems. The pore-water profiles for core CS-36 show a diffusion-dominated process. The slightly concave-down shape for the sulphate and the calcium with values of about 12 mM and 5 mM, respectively, suggests that neither AOM nor advection are occurring at this depth (Figure 5). This is somewhat in coherence with the absence of methane in detectable amount in the pore water. Core CS-30 is characterized by a peak in sulphide and alkalinity as well as an upwards concavity of the sulphate profile with concentration values approaching zero at depths close to 200 cmbsf. Methane concentrations have been measured in pore water below that depth. These evidences are typical of systems where both fluid advection and AOM coupled with sulphate reduction take place at the SMTZ. This reaction produces 1 mole of bicarbonate per mole of sulphate reduced. Above the SMTZ the sulphate reduction is coupled with organic matter oxidation which produces 2 moles of bicarbonates per mole of sulphate reduced. Kastner et al. (2008) have evaluated the contribution of each oxidation process to the sulphate reduction by plotting the cation-adjusted alkalinity versus the sulphate removed (sulphate) from pore water as shown in Figure 9. The resulting graph reveals that our data are line up with a mixing line having a slope of ~1.5. In another word, AOM and organic matter oxidation both accounted for approximately 50 % of the sulphate reduction here. We can reasonably consider here that the hydrate accumulation beneath the SMTZ is the only methane supplier to the AOM reaction. Thus, considering the linear shape of the sulphate profile from ~90 cmbsf to the SMTZ at 200 cm and applying the Fick‟s first law, we are able to estimate the methane flux at the SMTZ as it is balanced by the sulphate flux involves in the AOM:
( )
Where J is the flux (mmol.m-2.yr-1), is the sulphate gradient obtained by linear regression
(mmol.m-2.m-1), D0 and Ds are the seawater and the sediment diffusion coefficient (Boudreau, 1997; Schulz and Zabel, 2000), respectively and is the sediment porosity taken as 0.6. Based on our data, the methane flux value calculated at the SMTZ is of 73 mmol.m-2.yr-1. This value is higher than those calculated at hydrate-bearing setting from the Blake Ridge [7-8 mmol.m-2.yr-1 (Dickens, 2001); 18 mmol.m-2.yr-1
(Borowski et al., 1996)] and within the estimated scales at hydrate provinces off Costa Rica [30- >345 mmol.m-2.yr-1 (Ruppel and Kinoshita, 2000)] and off SW-Taiwan [8- 418 mmol.m-2.yr-1 (Chuang et al., 2010)]. The rapid decrease in calcium concentrations within pore waters, from the seafloor to the SMTZ (Figure 5) is indicative of carbonate precipitation. This is in agreement with the magnesium/ calcium ratio profile presented in Figure 5 as it strongly increases from the seafloor to the SMTZ. Within the pockmark aragonite is the dominant mineral while mainly high-Mg calcite was found outside.
5.2.3. History of the pockmark activity The calculated U/Th ages for our series of carbonate samples indicate that this large pockmark has been active for at least the last 21 kyr. Evidence that these ~21 kyr-old carbonate concretions were recovered from within near surface sediments, close to the seafloor, indicates the absence of any significant sediment accumulation during that period of time. Considering a typical sedimentation rate of about 8 cm per thousand years for this area of the Niger Delta margin (Zabel and Schulz, 2001), one would expect any 21 kyr-old carbonate concretion to be located at sediment depths below the seafloor of about 160 cm, i.e. far deeper than the depth at which the mudclast breccias were collected in the studied
10
box cores. Most likely, such a presence in that sediment interval suggests that on-going pockmark activity related to persistent migration of methane-rich fluids have prevented any significant sedimentation of vertical particle rain at this given site. Dating of additional carbonate samples would be required to provide statistically robust constraints on the timing of fluid seepage and associated carbonate precipitation at the studied pockmark. Nevertheless, evidence that the earliest carbonate dates reported in this study coincide with the last glacial maximum (i.e. ~ 20 kyrs ago), a period when sea-level was more than 100 meter below present-day value, could suggest that reduced hydrostatic pressure at that time led to important release of methane-rich fluids and/or hydrate dissociation, as suggested in previous studies (Feng et al., 2010; Teichert et al., 2003).
6. Conclusion
In the present work, we describe the geochemical dynamics of a large active pockmark using an integrated approach which combines seismic data with pore-water, hydrate and carbonate chemistry data. According to our results, this pockmark is characterized by a GHSZ of at least 75 m thick with a BSR marking its lower boundary within the sediment column. The thermogenic hydrate-bound gases come from gas-charged bodies beneath and migrate through a normal fault network to the GHSZ. Owing to the high methane content, it is not excluded that biogenic methane may account for a portion of the gases. A systematic difference is observed in the chemical composition of pore waters from within and outside the active pockmark. Our data indicate that diffusion is the only transport process for dissolved elements outside the pockmark, whereas inside it diffusion is accompanied with advection of methane and its oxidation coupled with sulphate reduction at shallow depths. The present day methane flux at the SMTZ has been estimated in a straightforward fashion. It is of the same order of magnitude as those calculated for a couple of different hydrate settings on continental margins. Carbonate geochemistry has contributed to the determination of the dominant minerals, and aragonite concretions were predominant inside the pockmark while chiefly high-Mg calcite concretions were found outside. In addition, U/Th dating has pointed out the long period of activity of this pockmark as some carbonate samples have precipitated since 21 kyr, while positive chlorinity anomalies observed for the core recovered at the centre of it indicate recent hydrate formation.
Acknowledgements
The authors would like to thank the Captain and the crew of the R/V Pourquoi Pas for their technical supports. We are also grateful to two anonymous reviewers for their valuable suggestions and their critical remarks, which greatly improved the paper. 7. References
Bayon, G., Henderson, G.M. and Bohn, M., 2009a. U-Th stratigraphy of a cold seep
carbonate crust. Chemical Geology, 260(1-2): 47-56. Bayon, G. et al., 2009b. Multi-disciplinary investigation of fluid seepage on an unstable
margin: The case of the Central Nile deep sea fan. Marine Geology, 261(1-4): 92-104.
Bayon, G., Pierre, C., Etoubleau, J., Voisset, M., Cauquil, E., Marsset, T., Sultan, N., Le Drezen, E. and Fouquet, Y., 2007. Sr/Ca and Mg/Ca ratios in Niger Delta sediments:

11
Implications for authigenic carbonate genesis in cold seep environments. Marine Geology, 241(1-4): 93-109.
Bernard, B.B., Brooks, J.M. and Sackett, W.M., 1976. Natural-gas seepage in the Gulf of Mexico. Earth and Planetary Science Letters, 31(1): 48-54.
Berner, R., 1980. Early diagenesis: A theoretical approach. Princeton Univ Pr. Bilotti, F. and Shaw, J.H., 2005. Deep-water Niger Delta fold and thrust belt modeled as a
critical-taper wedge: The influence of elevated basal fluid pressure on structural styles. Aapg Bulletin, 89(11): 1475-1491.
Boetius, A., Ravenschlag, K., Schubert, C.J., Rickert, D., Widdel, F., Gieseke, A., Amann, R., Jorgensen, B.B., Witte, U. and Pfannkuche, O., 2000. A marine microbial consortium apparently mediating anaerobic oxidation of methane. Nature, 407(6804): 623-626.
Borowski, W.S., Paull, C.K. and Ussler, W., 1996. Marine pore-water sulfate profiles indicate in situ methane flux from underlying gas hydrate. Geology, 24(7): 655-658.
Boudreau, B., 1997. Diagenetic Models and their Implementation, 414 pp. Springer-Verlag, Berlin.
Boudreau, B. and Jørgensen, B., 2001. The benthic boundary layer: Transport processes and biogeochemistry. Oxford University Press, USA.
Boudreau, B.P. and Westrich, J.T., 1984. The dependence of bacterial sulfate reduction on sulfate concentration in marine sediments. Geochimica et Cosmochimica Acta, 48(12): 2503-2516.
Briggs, S.E., Davies, R.J., Cartwright, J.A. and Morgan, R., 2006. Multiple detachment levels and their control on fold styles in the compressional domain of the deepwater west Niger Delta. Basin Research, 18(4): 435-450.
Cathles, L.M., Su, Z. and Chen, D.F., 2009. The physics of gas chimney and pockmark formation, with implications for assessment of seafloor hazards and gas sequestration. Marine and Petroleum Geology, 27(1): 82-91.
Charlou, J., Donval, J., Fouquet, Y., Ondreas, H., Knoery, J., Cochonat, P., Levache, D., Poirier, Y., Jean-Baptiste, P. and Fourre, E., 2004. Physical and chemical characterization of gas hydrates and associated methane plumes in the Congo–Angola Basin. Chemical Geology, 205(3-4): 405-425.
Chazallon, B., Focsa, C., Charlou, J.L., Bourry, C. and Donval, J.P., 2007. A comparative Raman spectroscopic study of natural gas hydrates collected at different geological sites. Chemical Geology, 244: 175-185.
Chuang, P.C., Yang, T.F., Hong, W.L., Lin, S., Sun, C.H., Lin, A.T.S., Chen, J.C., Wang, Y. and Chung, S.H., 2010. Estimation of methane flux offshore SW Taiwan and the influence of tectonics on gas hydrate accumulation. Geofluids, 10(4): 497-510.
Chung, H., Gormly, J. and Squires, R., 1988. Origin of gaseous hydrocarbons in subsurface environments: theoretical considerations of carbon isotope distribution. Chemical Geology, 71(1-3): 97-104.
Claypool, G.E. and Kaplan, I.R., 1974. The origin and distribution of methane in marine sediments. In: Kaplan. I. R. (Eds.) Natural gases in marine sediments: New York, Plenum Press.: 99-139.
Cline, J.D., 1969. Spectrophotometric determination of hydrogen sulfide in natural waters. Limnology and Oceanography, 14(3): 454-458.
Corredor, F., Shaw, J.H. and Bilotti, F., 2005. Structural styles in the deep-water fold and thrust belts of the Niger Delta. Aapg Bulletin, 89(6): 753-780.
Damuth, J.E., 1994. Neogene gravity tectonics and depositional processes on the deep Niger-delta continental-margin. Marine and Petroleum Geology, 11(3): 320-&.
Dickens, G.R., 2001. Sulfate profiles and barium fronts in sediment on the Blake Ridge: Present and past methane fluxes through a large gas hydrate reservoir. Geochimica et Cosmochimica Acta, 65(4): 529-543.
Feng, D., Chen, D. and Roberts, H.H., 2009. Petrographic and geochemical characterization of seep carbonate from Bush Hill (GC 185) gas vent and hydrate site of the Gulf of Mexico. Marine and Petroleum Geology, 26(7): 1190-1198.

12
Feng, D., Roberts, H.H., Cheng, H., Peckmann, J., Bohrmann, G., Edwards, R.L. and Chen, D.F., 2010. U/Th dating of cold-seep carbonates: An initial comparison. Deep-Sea Research Part Ii-Topical Studies in Oceanography, 57(21-23): 2055-2060.
Garziglia, S., Sultan, N., Cattaneo, A., Ker, S., Marsset, B., Riboulot, V., Voisset, M., Adamy, J. and Unterseh, S., 2010. Identification of Shear Zones and Their Causal Mechanisms Using a Combination of Cone Penetration Tests and Seismic Data in the Eastern Niger Delta. Submarine Mass Movements and Their Consequences, 28, 55-65 pp.
Greinert, J., Bohrmann, G. and Elvert, M., 2002. Stromatolitic fabric of authigenic carbonate crusts: result of anaerobic methane oxidation at cold seeps in 4,850 m water depth. International Journal of Earth Sciences, 91(4): 698-711.
Greinert, J., Bohrmann, G. and Suess, E., 2001. Gas hydrate-associated carbonates and methane-venting at Hydrate Ridge: classification, distribution and origin of authigenic lithologies. Geophysical Monograph-American Geophysical Union, 124: 99-114.
Guan, J.N., Liang, D.Q., Wu, N.Y. and Fan, S.S., 2009. The methane hydrate formation and the resource estimate resulting from free gas migration in seeping seafloor hydrate stability zone. Journal of Asian Earth Sciences, 36(4-5): 277-288.
Guillon, S. and Keskes, N., 2004. Sismage and the 3D Visualization at Total., Communication presented at the AAPG International Conference., Cancun, Mexico, 24-27 October
Haeckel, M., Suess, E., Wallmann, K. and Rickert, D., 2004. Rising methane gas bubbles form massive hydrate layers at the seafloor. Geochimica et Cosmochimica Acta, 68(21): 4335-4345.
Henderson, G.M., 2002. Seawater (U-234/U-238) during the last 800 thousand years. Earth and Planetary Science Letters, 199(1-2): 97-110.
Hester, K., Dunk, R., Walz, P., Peltzer, E., Sloan, E. and Brewer, P., 2007. Direct measurements of multi-component hydrates on the seafloor: Pathways to growth. Fluid Phase Equilibria, 261(1-2): 396-406.
Holland, M., Schultheiss, P., Roberts, J. and Druce, M., 2008. Observed gas hydrate morphologies in marine sediments. Paper 5691 presented at the 6th International Conference on Gas Hydrates (ICGH 2008), Vancouver, B. C., Canada, 6-10 July.
Hooper, R.J., Fitzsimmon, R.J., Grant, N. and Vendeville, B.C., 2002. The role of deformation in controlling depositional patterns in the south-central Niger Delta, West Africa. Journal of Structural Geology, 24(4): 847-859.
Hovland, M., 1989. The formation of pockmarks and their potential influence on offshore construction. Quarterly Journal of Engineering Geology, 22(2): 131-138.
Hovland, M., 2003. Geomorphological, geophysical, and geochemical evidence of fluid flow through the seabed. Journal of Geochemical Exploration, 78-9: 287-291.
Hovland, M., Gallagher, J.W., Clennell, M.B. and Lekvam, K., 1997. Gas hydrate and free gas volumes in marine sediments: Example from the Niger Delta front. Marine and Petroleum Geology, 14(3): 245-255.
Hovland, M., Gardner, J.V. and Judd, A.G., 2002. The significance of pockmarks to understanding fluid flow processes and geohazards. Geofluids, 2(2): 127-136.
Hovland, M. and Judd, A., 1988. Seabed pockmarks and seepages: impact on geology, biology, and the marine environment. Graham & Trotman.
Hovland, M., Judd, A.G. and King, L.H., 1984. Characteristic features of pockmarks on the North-Sea floor and Scotian shelf. Sedimentology, 31(4): 471-480.
Hustoft, S., Dugan, B. and Mienert, J., 2009. Effects of rapid sedimentation on developing the Nyegga pockmark field: Constraints from hydrological modeling and 3-D seismic data, offshore mid-Norway. Geochemistry Geophysics Geosystems, 10.
Hustoft, S., Mienert, J., Bunz, S. and Nouze, H., 2007. High-resolution 3D-seismic data indicate focussed fluid migration pathways above polygonal fault systems of the mid-Norwegian margin. Marine Geology, 245(1-4): 89-106.

13
Jones, D., Head, I., Gray, N., Adams, J., Rowan, A., Aitken, C., Bennett, B., Huang, H., Brown, A. and Bowler, B., 2007. Crude-oil biodegradation via methanogenesis in subsurface petroleum reservoirs. Nature, 451(7175): 176-180.
Joye, S.B., Boetius, A., Orcutt, B.N., Montoya, J.P., Schulz, H.N., Erickson, M.J. and Lugo, S.K., 2004. The anaerobic oxidation of methane and sulfate reduction in sediments from Gulf of Mexico cold seeps. Chemical Geology, 205(3-4): 219-238.
Kastner, M., Claypool, G. and Robertson, G., 2008. Geochemical constraints on the origin of the pore fluids and gas hydrate distribution at Atwater Valley and Keathley Canyon, northern Gulf of Mexico. Marine and Petroleum Geology, 25(9): 860-872.
Ker, S., Marsset, B., Garziglia, S., Le Gonidec, Y., Gibert, D., Voisset, M. and Adamy, J., 2010. High-resolution seismic imaging in deep sea from a joint deep-towed/OBH reflection experiment: application to a Mass Transport Complex offshore Nigeria. Geophysical Journal International, 182(3): 1524-1542.
Kim, J.-H., Park, M.-H., Tsunogai, U., Cheong, T.-J., Ryu, B.-J., Lee, Y.-J., Han, H.-C., Oh, J.-H. and Chang, H.-W., 2007. Geochemical characterization of the organic matter, pore water constituents and shallow methane gas in the eastern part of the Ulleung Basin, East Sea (Japan Sea). Island Arc, 16(1): 93-104.
Konn, C., Charlou, J.L., Donval, J.P., Holm, N.G., Dehairs, F. and Bouillon, S., 2009. Hydrocarbons and oxidized organic compounds in hydrothermal fluids from Rainbow and Lost City ultramafic-hosted vents. Chemical Geology, 258(3-4): 299-314.
Lim, Y.C., Lin, S., Yang, T.F., Chen, Y.-G. and Liu, C.-S., 2011. Variations of methane induced pyrite formation in the accretionary wedge sediments offshore southwestern Taiwan. Marine and Petroleum Geology, 28(10): 1829-1837.
Maignien, L., Depreiter, D., Foubert, A., Reveillaud, J., De Mol, L., Boeckx, P., Blamart, D., Henriet, J.P. and Boon, N., 2011. Anaerobic oxidation of methane in a cold-water coral carbonate mound from the Gulf of Cadiz. International Journal of Earth Sciences, 100(6): 1413-1422.
Malinverno, A., Kastner, M., Torres, M.E. and Wortmann, U.G., 2008. Gas hydrate occurrence from pore water chlorinity and downhole logs in a transect across the northern Cascadia margin (Integrated Ocean Drilling Program Expedition 311). Journal of Geophysical Research-Solid Earth, 113(B8).
Marsset, T., Marsset, B., Ker, S., Thomas, Y. and Le Gall, Y., 2010. High and very high resolution deep-towed seismic system: Performance and examples from deep water Geohazard studies. Deep-Sea Research Part I-Oceanographic Research Papers, 57(4): 628-637.
Menot, L., Galeron, J., Olu, K., Caprais, J.C., Crassous, P., Khripounoff, A. and Sibuet, M., 2010. Spatial heterogeneity of macrofaunal communities in and near a giant pockmark area in the deep Gulf of Guinea. Marine Ecology-an Evolutionary Perspective, 31(1): 78-93.
Milkov, A. and Dzou, L., 2007. Geochemical evidence of secondary microbial methane from very slight biodegradation of undersaturated oils in a deep hot reservoir. Geology, 35(5): 455.
Milkov, A.V., 2011. Worldwide distribution and significance of secondary microbial methane formed during petroleum biodegradation in conventional reservoirs. Organic Geochemistry, 42(2): 184-207.
Naehr, T.H., Eichhubl, P., Orphan, V.J., Hovland, M., Paull, C.K., Ussler, W., III, Lorenson, T.D. and Greene, H.G., 2007. Authigenic carbonate formation at hydrocarbon seeps in continental margin sediments: A comparative study. Deep-Sea Research Part Ii-Topical Studies in Oceanography, 54(11-13): 1268-1291.
Niewohner, C., Hensen, C., Kasten, S., Zabel, M. and Schulz, H.D., 1998. Deep sulfate reduction completely mediated by anaerobic methane oxidation in sediments of the upwelling area off Namibia. Geochimica et Cosmochimica Acta, 62(3): 455-464.
Noethen, K. and Kasten, S., 2011. Reconstructing changes in seep activity by means of pore water and solid phase Sr/Ca and Mg/Ca ratios in pockmark sediments of the Northern Congo Fan. Marine Geology, 287(1-4): 1-13.

14
Olu, K., Caprais, J.C., Galeron, J., Causse, R., von Cosel, R., Budzinski, H., Le Menach, K., Le Roux, C., Levache, D., Khripounoff, A. and Sibuet, M., 2009. Influence of seep emission on the non-symbiont-bearing fauna and vagrant species at an active giant pockmark in the Gulf of Guinea (Congo-Angola margin). Deep-Sea Research Part Ii-Topical Studies in Oceanography, 56(23): 2380-2393.
Orcutt, B.N., Boetius, A., Lugo, S.K., MacDonald, I.R., Samarkin, V.A. and Joye, S.B., 2004. Life at the edge of methane ice: microbial cycling of carbon and sulfur in Gulf of Mexico gas hydrates. Chemical Geology, 205(3-4): 239-251.
Pallasser, R., 2000. Recognising biodegradation in gas/oil accumulations through the 13C compositions of gas components. Organic Geochemistry, 31(12): 1363-1373.
Paull, C. and Dillon, W., 2001. Natural gas hydrates: occurrence, distribution, and detection. American Geophysical Union, Washington, DC.
Peckmann, J., Reimer, A., Luth, U., Luth, C., Hansen, B.T., Heinicke, C., Hoefs, J. and Reitner, J., 2001. Methane-derived carbonates and authigenic pyrite from the northwestern Black Sea. Marine Geology, 177(1-2): 129-150.
Plaza-Faverola, A., Bunz, S. and Mienert, J., 2012. The free gas zone beneath gas hydrate bearing sediments and its link to fluid flow: 3-D seismic imaging offshore mid-Norway. Marine Geology, 291: 211-226.
Rajan, A., Mienert, J. and Bunz, S., 2012. Acoustic evidence for a gas migration and release system in Arctic glaciated continental margins offshore NW-Svalbard. Marine and Petroleum Geology, 32(1): 36-49.
Reeburgh, W.S., 1976. Methane consumption in Cariaco Trench waters and sediments. Earth and Planetary Science Letters, 28(3): 337-344.
Regnier, P., Dale, A.W., Arndt, S., LaRowe, D., Mogollon, J. and Van Cappellen, P., 2011. Quantitative analysis of anaerobic oxidation of methane (AOM) in marine sediments: A modeling perspective. Earth-Science Reviews.
Riboulot, V., Cattaneo, A., Berne, S., Schneider, R.R., Voisset, M., Imbert, P. and Grimaud, S., 2012. Geometry and chronology of late Quaternary depositional sequences in the Eastern Niger Submarine Delta. Marine Geology, 319: 1-20.
Rongemaille, E., 2011. Application des terres rares et de la datation U/Th à l'étude des carbonates authigènes de suintements froids: Exemple du delta profond du Niger. PhD Thesis, Université de Bretagne Occidentale.
Rongemaille, E., Bayon, G., Pierre, C., Bollinger, C., Chu, N.C., Fouquet, Y., Riboulot, V. and Voisset, M., 2011. Rare earth elements in cold seep carbonates from the Niger delta. Chemical Geology, 286(3-4): 196-206.
Ruffine, L., Donval, J.P., Charlou, J.L., Cremière, A. and Zehnder, B.H., 2010. Experimental study of gas hydrate formation and destabilisation using a novel high-pressure apparatus. Marine and Petroleum Geology, 27(6): 1157-1165.
Ruffine, L., Fandino , O., Etoubleau, J., Chéron, S., Donval, J.P., Germain, Y., Ponzevera, E., Guyader, V., Dennielou, B., Etiope, G., Gasperini, L., Bortoluzzi, G., Henry, P., Grall, C., Çagatay, M.N., Charlou, J.L. and Géli, L., 2012. Geochemical dynamics of the natural-gas hydrate system in the Sea of Marmara, offshore Turkey. Advances in Natural Gas Technology, ISBN 978-953-51-0507-7: pp. 29-56.
Ruppel, C. and Kinoshita, M., 2000. Fluid, methane, and energy flux in an active margin gas hydrate province, offshore Costa Rica. Earth and Planetary Science Letters, 179(1): 153-165.
Sassen, R., Sweet, S., DeFreitas, D. and Milkov, A., 2000. Exclusion of 2-methylbutane (isopentane) during crystallization of structure II gas hydrate in sea-floor sediment, Gulf of Mexico. Organic Geochemistry, 31(11): 1257-1262.
Schoell, M., 1980. The hydrogen and carbon isotopic composition of methane from natural gases of various origins. Geochimica et Cosmochimica Acta, 44(5): 649-661.
Schoell, M., 1983. Genetic characterization of natural gases. Aapg Bulletin, 67(12): 2225-2238.
Schulz, H.D. and Zabel, M., 2000. Marine geochemistry. Springer. Sloan, E. and Koh, C., 2007. Clathrate hydrates of natural gases. CRC Press.

15
Snyder, G.T., Hiruta, A., Matsurnoto, R., Dickens, G.R., Tomaru, H., Takeuchi, R., Komatsubara, J., Ishida, Y. and Yu, H., 2007. Pore water profiles and authigenic mineralization in shallow marine sediments above the methane-charged system on Umitaka Spur, Japan Sea. Deep-Sea Research Part Ii-Topical Studies in Oceanography, 54: 1216-1239.
Sultan, N., Cochonat, P., Foucher, J. and Mienert, J., 2004. Effect of gas hydrates melting on seafloor slope instability. Marine Geology, 213(1-4): 379-401.
Sultan, N., Marsset, B., Ker, S., Marsset, T., Voisset, M., Vernant, A.M., Bayon, G., Cauquil, E., Adamy, J., Colliat, J.L. and Drapeau, D., 2010. Hydrate dissolution as a potential mechanism for pockmark formation in the Niger delta. Journal of Geophysical Research-Solid Earth, 115.
Sultan, N., Riboulot, V., Ker, S., Marsset, B., Geli, L., Tary, J.B., Klingelhoefer, F., Voisset, M., Lanfumey, V., Colliat, J.L., Adamy, J. and Grimaud, S., 2011. Dynamics of fault-fluid-hydrate system around a shale-cored anticline in deepwater Nigeria. Journal of Geophysical Research-Solid Earth, 116.
Teichert, B.M.A., Eisenhauer, A., Bohrmann, G., Haase-Schramm, A., Bock, B. and Linke, P., 2003. U/Th systematics and ages of authigenic carbonates from Hydrate Ridge, Cascadia Margin: Recorders of fluid flow variations. Geochimica et Cosmochimica Acta, 67(20): 3845-3857.
Torres, M., Wallmann, K., Trehu, A., Bohrmann, G., Borowski, W. and Tomaru, H., 2004. Gas hydrate growth, methane transport, and chloride enrichment at the southern summit of Hydrate Ridge, Cascadia margin off Oregon. Earth and Planetary Science Letters, 226(1-2): 225-241.
Treude, T., Boetius, A., Knittel, K., Wallmann, K. and Jorgensen, B.B., 2003. Anaerobic oxidation of methane above gas hydrates at Hydrate Ridge, NE Pacific Ocean. Marine Ecology-Progress Series, 264: 1-14.
Ussler, W. and Paull, C.K., 1995. Effects of ion-exclusion and isotopic fractionation on pore-water geochemistry during gas hydrate formation and decomposition. Geo-Marine Letters, 15(1): 37-44.
Wallmann, K., Aloisi, G., Haeckel, M., Obzhirov, A., Pavlova, G. and Tishchenko, P., 2006a. Kinetics of organic matter degradation, microbial methane generation, and gas hydrate formation in anoxic marine sediments. Geochimica et Cosmochimica Acta, 70(15): 3905-3927.
Wallmann, K., Drews, M., Aloisi, G. and Bohrmann, G., 2006b. Methane discharge into the Black Sea and the global ocean via fluid flow through submarine mud volcanoes. Earth and Planetary Science Letters, 248(1-2): 545-560.
Whiticar, M.J., 1994. Correlation of natural gases with their sources. In: Magoon, L. B.; Dow, W. G. (Eds), The petroleum System: from Sources to Trap, AAPG Memoir, vol.60: pp 261-283.
Whiticar, M.J., 1999. Carbon and hydrogen isotope systematics of bacterial formation and oxidation of methane. Chemical Geology, 161(1-3): 291-314.
Wiener, R.W., Mann, M.G., Advocate, D.M., Angelich, M.T. and Barboza, S.A., 2006. Mobile Shale Characteristics and Impact on Structural and Stratigraphic Evolution of the Niger Delta. AAPG/GSTT Hedberg conference, Port of Spain, Trinidad & Tobago.
Zabel, M. and Schulz, H.D., 2001. Importance of submarine landslides for non-steady state conditions in pore water systems - lower Zaire (Congo) deep-sea fan. Marine Geology, 176(1-4): 87-99.

16
Tables
Table 1: Bulk composition, mineralogy and O and C isotopes of the carbonates.
Sample Depth (cm)
Dominant mineral SiO2 Al2O3 Fe2O3 MnO CaO MgO K2O Na2O TiO2 P2O5 SO4 LOI Total Sr 13C
18O
USNEL 12#1 surface ara 19.62 7.41 2.62 0.01 33.64 1.20 0.48 0.81 0.39 0.07 2.80 30.14 99.23 5437 -27.85 3.50 USNEL 12#2 surface ara 13.63 5.18 1.73 0.01 40.03 0.90 0.37 0.46 0.26 0.07 1.88 34.42 98.96 8177 USNEL 13 surface ara 13.80 5.86 2.05 0.01 39.50 0.77 0.33 0.64 0.30 0.07 2.08 34.18 99.61 7501 -27.36 3.23
USNEL 16#1 surface HMg 8.92 4.15 2.24 0.02 38.59 5.63 0.20 0.34 0.19 0.15 3.74 36.13 100.44 781 USNEL 16#2 surface HMg 10.23 5.11 2.08 0.02 37.51 5.71 0.31 0.30 0.22 0.15 3.50 35.28 100.58 640 USNEL 16#3 surface HMg 9.28 4.81 1.70 0.04 39.40 4.90 0.32 0.29 0.20 0.22 2.33 36.76 100.37 784 -22.10 4.48 USNEL 16#4 surface ara 12.55 5.29 2.66 0.01 40.06 0.95 0.29 0.57 0.26 0.14 1.85 34.78 99.42 7115
Ara means aragonite and HMg means High-Mg calcite
Table 2: U and Th data for the carbonate samples.
Sample Depth (cm) 238U (ppm) 2 s.e. 230Th (ppt) 2 s.e. (230Th/232Th) 2 s.e. (238U/232Th) 2 s.e.
234U initial 2 s.e Age (ka) 2s.e USN 12 - 1 surface 11.77 0.04 55.137 0.608 3.47 0.05 11.71 0.05 141.9 3.1 21.6 0.4 USN 12 - 2 surface 19.73 0.36 80.733 0.819 4.91 0.05 19.12 0.35 140.2 0.3 21.0 0.6 USN 13 - 1 surface 17.92 0.27 43.487 0.659 2.40 0.03 15.65 0.24 136.6 0.2 7.7 0.4 USN 13 - 2 surface 22.42 0.10 47.564 0.440 2.29 0.02 17.54 0.09 164.6 2.9 6.3 0.2 USN 13 - 3 surface 21.54 0.12 43.327 0.419 2.27 0.02 18.29 0.11 166.4 4.0 5.9 0.2
CS-30 178-180 cmbsf 18.22 0.80 172.179 1.980 11.00 0.10 19.02 0.84 110.6 8.9 nd nd CS-30 277-280 cmbsf 8.36 0.03 71.961 0.979 3.13 0.04 5.90 0.03 126.9 8.2 nd nd
Nd means not determined and s.e. means sigma error.
17
Table 3: Molecular and stable isotopic compositions of the hydrate-bound gases.
Components Mole % 13C (‰ PDB) D (‰ SMOW)
methane 99.8 -42.1 -182 ethane 0.016 -31.7 -159
propane 0.008 -21.0 trace i-butane 0.007 -27.5 -162 carbon dioxide
0.20 -17.2 -
hydrogen sulfide
0.02 - -
18
Figures
Figure 1: Geographical location map of the studied area.

19
Figure 2: Location maps of the studied area: A- Dip map of the studied area (horizontal resolution of 3 m). B- Zoom on the large pockmark (see location in the figure 3B).
20
Figure 3: A- Uninterpreted random line extract from 3D high resolution seismic data (courtesy of Total) showing the seismic morphology under the large active pockmark, the fluid reservoir and the fluid migration paths. B- Line showing the seismic interpretation of 3D HR seismic data (BSR= Bottom simulating reflector).

21
Figure 4: A- 2D very high resolution seismic profile zoom of the upper part of sediment taken from the profile presented in Figure 3 (zone defined by the dashed box). B- Stratigraphic interpretation of the seismic profile showing the large pockmark structure with the location of the major normal fault identified in Figure 3.
22
Figure 5: Pore-water geochemical profiles of dissolved elements and simplified lithological compositions showing the main features for cores CS-30 (first row) and CS-36 (second row).
0 5 10 15 20 25 30Sulphate / mM
800
600
400
200
0
De
pth
/ c
m
0 100 200 300 400 500 600Chloride / mM
0 100 200 300 400 500 600Sodium / mM
0 5 10 15 20Potassium / mM
0 10 20 30 40 50 60Magnesium / mM
0 5 10 15Calcium / mM
0 5 10 15 20 25 30TH2S/ M
0 5 10 15 20 25 30Magnesium/ Calcium
0 5 10 15 20 25 30Alkalinity/ mM
0 50 100 150 200 250Methane/ M
10 15 20 25 30Sulphate / mM
1000
800
600
400
200
0
De
pth
/ cm
0 100 200 300 400 500 600Chloride / mM
0 100 200 300 400 500 600Sodium / mM
0 5 10 15 20Potassium / mM
0 10 20 30 40 50 60Magnesium / mM
0 5 10 15Calcium / mM
0 5 10 15 20 25 30Alkalinity/ mM
0 5 10 15 20 25 30Magnesium/ Calcium

23
Figure 6: Raman spectra of the natural gas-hydrate samples collected on the large pockmark.
0 500 1000 1500 2000 2500 3000 3500 4000 4500
0
100
200
300
400
500
600
700
800
900
1000
Inte
nsity (u
.a.)
Raman shift (cm-1)
1200 1250 1300 1350 1400
-0.5
0.0
0.5
1.0
1.5
2.0
2.5
Inte
nsity (u
.a.)
Raman shift (cm-1)
0 500 1000 1500 2000 2500 3000 3500 4000 4500
0
100
200
300
400
500
600
700
800
900
1000
Inte
nsity (u
.a.)
Raman shift (cm-1)
1200 1250 1300 1350 1400
-0.5
0.0
0.5
1.0
1.5
2.0
2.5
Inte
nsity (u
.a.)
Raman shift (cm-1)
24
Figure 7: a) Plot of hydrogen and carbon isotope compositions for the hydrate-bond gases (Schoell, 1983; Whiticar, 1999), b) Relationship between stable carbon isotope composition (δ13C) of CH4 and C2H6 for the hydrate-bond gases (Bernard et al., 1976), c) Relationship between methane carbon isotope composition vs. ethane and propane molecular composition (Bernard et al., 1976; Schoell, 1983). (●) Gas-hydrate samples.

25
Figure 8: Photos of the natural gas-hydrate samples recovered on the centre of the large pockmark: Massive nodules on the left and vein-like sheets on the right.

26
Figure 9: Plot of cation-adjusted alkalinity vs. sulphate removed relative to seawater for core CS-30. The 1:2 ratio refers to oxidation of organic matter while the 1:1 ratio refers to anaerobic oxidation of methane.
2 :1
1 :1


![Marine Policy Archimerarchimer.ifremer.fr/doc/00183/29415/27776.pdf · discards have been observed on board professional vessels [19]. ... The assessment of discards has also been](https://static.fdocuments.us/doc/165x107/5b90281409d3f2857e8b4a0f/marine-policy-discards-have-been-observed-on-board-professional-vessels-19.jpg)