
MariFuture Development Paper;€¦ · · 2017-03-01Lodicator: The Lodicator is an approved...
18
1 February 2017 marifuture.org Development Paper MariEMS Learning Material - Trim Optimization and 3.2 Hull and Propeller Condition This is the third compilation by Professor Dr Reza Ziarati on the work of the EU funded Erasmus + MariEMS’ partners and material researched by Chief Engineer Mohammed Haque. The material is composed from Chapters 2, 5 and 6 represented as Part 1, 2 and 3 in the following article 3.1 Trim Optimization and 3.2 Hull and Propeller Condition 3.1.1 Introduction Most ships are designed to carry a certain amount of cargo at a designated speed, consuming a certain amount of fuel under a specified trim condition. Loaded or ballast, trim has a significant influence on the resistance of the ship through water. Therefore, optimizing the trim can deliver significant savings. For any given draft and speed, there is a trim condition that gives minimum resistance. Therefore, the vessel optimum trim is a function of draft and speed. A ship’s optimum trim may be established as part of routine operations or through tank testing or use of computational methods. Nowadays, Computational Fluid Dynamics (CFD) methods are extensively used to estimate optimal trim settings for energy efficiency. However, these may require information from ship model tests and /or full scale measurements. Operationally, design or safety factors may preclude the full use of trim optimization. The possibility of trimming a ship should be seen in relation to stability, manoeuvrability and other safety and operational aspects. It is the master or chief officer of the vessel that will ultimately ensure all situations are considered. To ensure best practice, the concern of masters with regard to loading and ballasting aspects needs to be taken into account. 3.1.2 Economic Benefits Trim optimisation has significant economic benefits in terms of fuel savings. These economic benefits will vary from one ship size and type to others. It should be emphasised that even small trim changes can have a large impact on vessel performance. A 2% to 4% reduction potential in fuel consumption is generally referred to in most literatures. However, depending on ship type and operation draft, this number may be higher or lower. Therefore, for energy saving, all possible measures should be tried to help with ensuring that this potential is realised. Sailing just 5-10 centimetres off optimal trim might cause ships to operate at higher fuel consumption levels than normal [Tero Illus, 2012]. There is a bulk of evidences on significant fuel saving potentials due to trim. Ship resistance is altered due to the trim of a vessel through viscous resistance which is a function of the wetted hull surface area. When trim changes, wetted surface area and thereby hull resistance will be affected. By definition, if resistance increases, fuel consumption and emissions also increase. Thus to reduce fuel consumption and emissions, trim needs to be optimised before and during a ship’s voyage through a proper loading of the ship or use of ballast water in order to achieve a floating position that consumes the least propulsion power. Ships normally record their trim before the voyage by directly reading the draft marks. So, considering that the weight distributions on the ship allow trim adjustment, finding the appropriate and optimal floating position before voyage becomes possible (this is referred to as “static trim” when ship is not sailing). However, knowing the exact trim and draught during a ship’s voyage is important. The trim under operational condition is normally referred to as “dynamic trim” and is different from “static trim” due to the impact of ship motion. Its measurement requires real -time readings through sensors and relevant on-board data systems. A vessel with high trim and draught fluctuations (more changes of dynamic trim) during its voyage might benefit more from trim
Transcript of MariFuture Development Paper;€¦ · · 2017-03-01Lodicator: The Lodicator is an approved...

1
February 2017 marifuture.org
Development Paper
MariEMS Learning Material - Trim Optimization and 3.2 Hull and Propeller Condition
This is the third compilation by Professor Dr Reza Ziarati on the work of the EU funded Erasmus + MariEMS’ partners and material researched by Chief Engineer Mohammed Haque. The material is composed from Chapters 2, 5 and 6 represented as Part 1, 2 and 3 in the following article
3.1 Trim Optimization and 3.2 Hull and Propeller Condition
3.1.1 Introduction
Most ships are designed to carry a certain amount of cargo at a designated speed, consuming a certain amount of fuel under a specified trim condition. Loaded or ballast, trim has a significant influence on the resistance of the ship through water. Therefore, optimizing the trim can deliver significant savings. For any given draft and speed, there is a trim condition that gives minimum resistance. Therefore, the vessel optimum trim is a function of draft and speed. A ship’s optimum trim may be established as part of routine operations or through tank testing or use of computational methods. Nowadays, Computational Fluid Dynamics (CFD) methods are extensively used to estimate optimal trim settings for energy efficiency. However, these may require information from ship model tests and /or full scale measurements. Operationally, design or safety factors may preclude the full use of trim optimization. The possibility of trimming a ship should be seen in relation to stability, manoeuvrability and other safety and operational aspects. It is the master or chief officer of the vessel that will ultimately ensure all situations are considered. To ensure best practice, the concern of masters with regard to loading and ballasting aspects needs to be taken into account.
3.1.2 Economic Benefits
Trim optimisation has significant economic benefits in terms of fuel savings. These economic benefits will vary from one ship size and type to others. It should be emphasised that even small trim changes can have a large impact on vessel performance. A 2% to 4% reduction potential in fuel consumption is generally referred to in most literatures. However, depending on ship type and operation draft, this number may be higher or lower. Therefore, for energy saving, all possible measures should be tried to help with ensuring that this potential is realised. Sailing just 5-10 centimetres off optimal trim might cause ships to operate at higher fuel consumption levels than normal [Tero Illus, 2012]. There is a bulk of evidences on significant fuel saving potentials due to trim. Ship resistance is altered due to the trim of a vessel through viscous resistance which is a function of the wetted hull surface area. When trim changes, wetted surface area and thereby hull resistance will be affected. By definition, if resistance increases, fuel consumption and emissions also increase. Thus to reduce fuel consumption and emissions, trim needs to be optimised before and during a ship’s voyage through a proper loading of the ship or use of ballast water in order to achieve a floating position that consumes the least propulsion power. Ships normally record their trim before the voyage by directly reading the draft marks. So, considering that the weight distributions on the ship allow trim adjustment, finding the appropriate and optimal floating position before voyage becomes possible (this is referred to as “static trim” when ship is not sailing). However, knowing the exact trim and draught during a ship’s voyage is important. The trim under operational condition is normally referred to as “dynamic trim” and is different from “static trim” due to the impact of ship motion. Its measurement requires real-time readings through sensors and relevant on-board data systems. A vessel with high trim and draught fluctuations (more changes of dynamic trim) during its voyage might benefit more from trim

2
February 2017 marifuture.org
Development Paper
adjustments than the one with small fluctuations. The following are two real examples of proven savings by trim optimisation:
Containership Example [Tero Illus, 2012]: This case is for a 5,500 TEU container ship over 136 sea days crossing. It was found that the average percentage of propulsion power loss due to non-optimal trimming was 5%, whilst the vessel was on long, trans-oceanic legs, although lower on shorter and more coastal routes. The trim-related saving potential was calculated at 350 tons of HFO for the crossing. Even if operational constraints meant that the ship was only able to follow an optimum trim 80% of the time, 280 tonnes of fuel would still have been saved. Such a saving translates into more than US$ 100,000 reduction in bunker costs for the vessel operator in less than five months.
VLCC Example [Melvin Mathew, 2012]: The results of a study on the impact of trimming on a VLCC showed that VLCCs can benefit significantly from trim optimisation due to their size and rate of daily consumption. The saving is dependent on the rate of use of the suggested optimum trim by the crew. This can be influenced by external conditions, such as extreme weather, as well as the crew’s commitment to apply the trim guidance given to them. This study showed that proper use of trim adjustments, translates into propulsion energy savings of 1.8%, which equates to about 505 tonnes of fuel consumption reduction with saving levels of more than US$ 200,000 annually.
3.1.3 Definitions
Trim: Trim is normally defined as the difference between the aft draft and the forward draft:
Trim = dA - dF
Where: dA Aft draft (m) dF Forward draft (m)
When the trim is positive, it means that the stern of the vessel is more inside the water than forward. Accordingly, positive trim means trim to aft and negative values of trim means trim to forward. The concept of trim is shown in Figure 3.1.3.1.
Figure 3.1.3.1: Concept and definition of trim
Optimum trim: Optimum trim refers to a ship’s trim under which the required propulsive power is minimal for the specific operational speed and draft of the vessel.
Load planning: The ship loading plan specifies the loading levels and how the loads should be distributed in different cargo spaces. The load planning should be done by consideration of corresponding regulations (e.g. load line convention) but above all the ship stability. The process of loading of a ship is with port’s staff and loading superintendents but the master or chief officer is ultimately responsible for all the loading and unloading operations.
Loading computer: A loading computer system is a computer-based system for the calculation and control of ship loading conditions for compliance with the applicable stability requirements and longitudinal and local strength requirements. The ship-board loading computer system consists of software (calculation program) and an appropriate computer (hardware).
Lodicator: The Lodicator is an approved instrument on board which can facilitate the following calculations:

3
February 2017 marifuture.org
Development Paper
1. Cargo stow plan, underdeck & on deck of all types of cargo.
2. Weights distribution to check deck load not exceeded.
3. Draft, Trim, Stability and Strength calculations.
The pre-stowage plan of the container weights are fed in through a disc supplied by the shore planner, which is a great convenience over manual feeding of thousands of containers, their numbers, weights, ports of loading and destination, and type of cargo, if dangerous, reefer, etc.
Even keel: This refers to ship condition when the draft of a ship fore and aft is the same. In other words, even keel refers to zero trim.
Static trim: This refers to a ship’s trim when the ship is in still water (not moving). In this case, it is the difference between aft and forward drafts; mainly dictated by the ship’s cargo, ballast, fuel on board, etc. distributions.
Dynamic trim: This refers to a ship’s trim when the ship is underway and moving. It is different from static trim due to the ship sinkage phenomena. The ship sinks down relative to the still water level when it is underway, due to its forward movement and environmental effects. The level of sinkage is characterised by a dynamic sinkage at the forward and a dynamic sinkage at the aft of the ship. Normally, the forward sinkage is more than the aft sinkage and is a function of ship speed as well. Dynamic trim thus is static trim plus trim changes due to ship sinkage while underway.
3.1.4 Physics of Trim
A ship’s resistances and its trim are closely related to each other. This is due to the fact that trim could change parameters that impact the hydrodynamic performance of a ship. The high impact of trim on ship performance is well known in particular for container ships and RoRo vessels. Large fuel savings are claimed due to changes to the ship trim.
The possible explanations for the relatively large dependencies of ship performance on the trim could be attributed to the following impacts of trim [Force Technology 2011]:
Changes to wave resistance
Changes to wetted surfaces and thereby the frictional resistance.
Changes to form resistance due to transom submergence
Changes to various propulsion coefficients including:
Resistance coefficients
Thrust deduction
Wake fraction
Changes to propulsive efficiencies including:
Relative rotative efficiency.
Propeller efficiency
On fast container ships and RoRo vessels, there is much to be gained by introducing the correct (optimum) trim. However, a reduction in fuel consumption due to changes to trim might be achieved even on tankers and bulk carriers [Force Technology 2011].
Impact of trim on powering requirement

4
February 2017 marifuture.org
Development Paper
There are different methods of determining a ship’s optimum trim. The best results are obtained from self-propulsion tests using a scale model (model tank testing). In self-propulsion tests, not only the changes in hull resistance are investigated and the choice of propeller is examined but also the propulsion coefficients are normally measured. These tests, if performed over a sufficient range of speed and draft, could provide input in identifying optimum trim. Figure 3.1.4.1 shows the parameters that are normally measured under self-propulsion tests.
Figure 3.1.4.1 Trim Optimisation Guidance Table
Alternatively, with today’s accuracy, trim tables based on use of CFD software tool calculations can be comparable to resistance model tests. However, both resistance tests and CFD methods tend to ignore the impact of the propeller; this may have a significant impact on evaluations of vessels with light drafts. To determine the optimum trim, the vessel’s loading conditions need to be investigated in order to find the extreme operational speeds and drafts. A test matrix is then set up; with drafts evenly divided in the test matrix. Typically, the ship is tested at both forward and aft trims depending on the feasibility of the vessel to undergo those trims. Normally, forward trim is often not possible for the lighter drafts due to restrictions in the propeller's submergence. Also, a simple resistance test under light drafts with aft trim, will not give the correct trim indication as the effects of the propeller inflow and submergence that makes a positive contribution to performance are not present. Figure 3.1.4.1 by Lloyd’s Register shows an example of such trim guidance table developed using CFD. As indicated, the ship is converted into a digital model with consideration of both ship hydrodynamics and aerodynamics. This digital model that resembles the full scale ship model is then trimmed at a variety of ship speeds and drafts and corresponding fuel
5
February 2017 marifuture.org
Development Paper
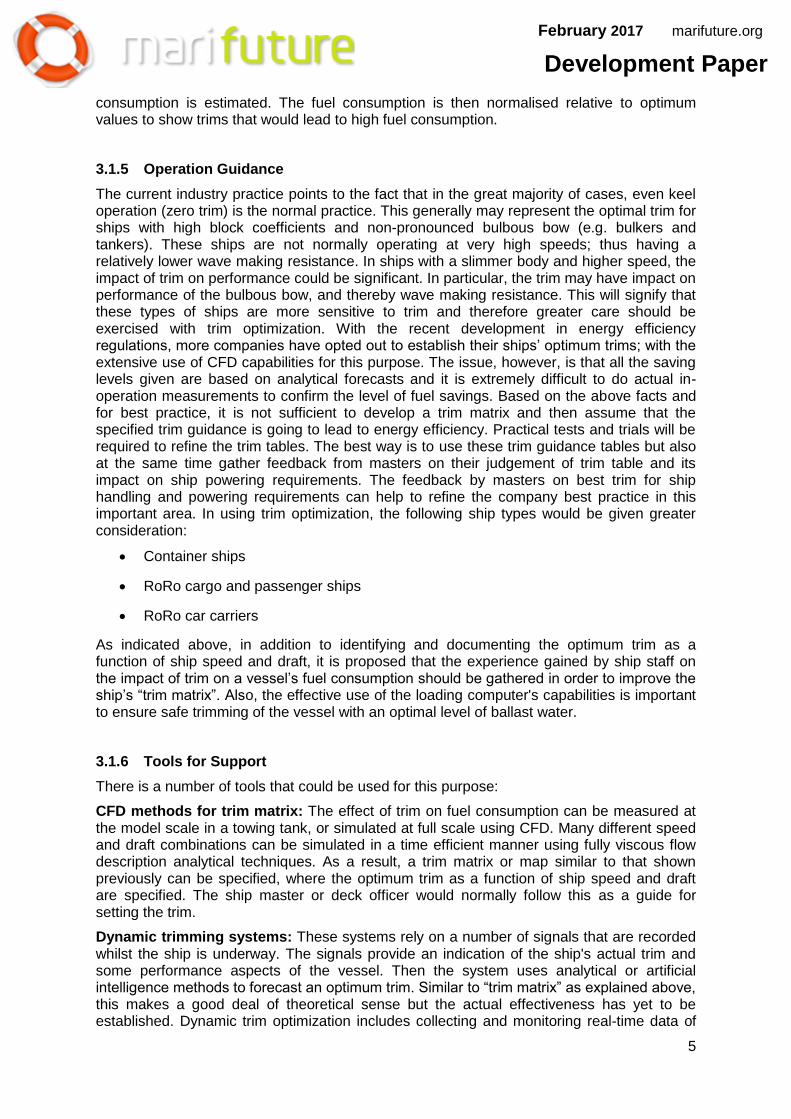
consumption is estimated. The fuel consumption is then normalised relative to optimum values to show trims that would lead to high fuel consumption.
3.1.5 Operation Guidance
The current industry practice points to the fact that in the great majority of cases, even keel operation (zero trim) is the normal practice. This generally may represent the optimal trim for ships with high block coefficients and non-pronounced bulbous bow (e.g. bulkers and tankers). These ships are not normally operating at very high speeds; thus having a relatively lower wave making resistance. In ships with a slimmer body and higher speed, the impact of trim on performance could be significant. In particular, the trim may have impact on performance of the bulbous bow, and thereby wave making resistance. This will signify that these types of ships are more sensitive to trim and therefore greater care should be exercised with trim optimization. With the recent development in energy efficiency regulations, more companies have opted out to establish their ships’ optimum trims; with the extensive use of CFD capabilities for this purpose. The issue, however, is that all the saving levels given are based on analytical forecasts and it is extremely difficult to do actual in-operation measurements to confirm the level of fuel savings. Based on the above facts and for best practice, it is not sufficient to develop a trim matrix and then assume that the specified trim guidance is going to lead to energy efficiency. Practical tests and trials will be required to refine the trim tables. The best way is to use these trim guidance tables but also at the same time gather feedback from masters on their judgement of trim table and its impact on ship powering requirements. The feedback by masters on best trim for ship handling and powering requirements can help to refine the company best practice in this important area. In using trim optimization, the following ship types would be given greater consideration:
Container ships
RoRo cargo and passenger ships
RoRo car carriers
As indicated above, in addition to identifying and documenting the optimum trim as a function of ship speed and draft, it is proposed that the experience gained by ship staff on the impact of trim on a vessel’s fuel consumption should be gathered in order to improve the ship’s “trim matrix”. Also, the effective use of the loading computer's capabilities is important to ensure safe trimming of the vessel with an optimal level of ballast water.
3.1.6 Tools for Support
There is a number of tools that could be used for this purpose:
CFD methods for trim matrix: The effect of trim on fuel consumption can be measured at the model scale in a towing tank, or simulated at full scale using CFD. Many different speed and draft combinations can be simulated in a time efficient manner using fully viscous flow description analytical techniques. As a result, a trim matrix or map similar to that shown previously can be specified, where the optimum trim as a function of ship speed and draft are specified. The ship master or deck officer would normally follow this as a guide for setting the trim.
Dynamic trimming systems: These systems rely on a number of signals that are recorded whilst the ship is underway. The signals provide an indication of the ship's actual trim and some performance aspects of the vessel. Then the system uses analytical or artificial intelligence methods to forecast an optimum trim. Similar to “trim matrix” as explained above, this makes a good deal of theoretical sense but the actual effectiveness has yet to be established. Dynamic trim optimization includes collecting and monitoring real-time data of

6
February 2017 marifuture.org
Development Paper
propeller thrust and manoeuvring rudder angles, weather conditions and sea-state. These data are then analysed constantly and the optimal trim value is calculated and displayed on a real time basis to give advice to the crew on-board.
Loading computers: The change in ship trim is achieved via cargo load planning and a ballasting plan when in port. When underway, the shift of ballast water and fuel between their relevant tanks may be used to adjust trim. During loading, occasionally there are limitations for achieving optimum trim due to the level of cargo and loading limitations that may not allow additional ballast for a proper trim. Nowadays, loading computers provide additional functionality for the representation of trim, optimal trim and also loading options to achieve the optimal trim. Trim linked to a loading computer helps the deck officers to achieve a better loading plan and optimal trim.
3.1.7 Barriers to Trim Optimisation
The good application of trim optimisation can be affected by the following constraints:
Ship loading: The weight distribution on board must be determined in order to allow trim optimization. Therefore, adequate communication between ship and port is paramount. As stated above, the loading computers may be effectively used for safe loading as well as for setting the optimal trim.
Operational risk challenges: This includes the oversight of bending moments and shear forces when practicing trim optimization. In this respect, it should be noted that not all vessels have real time stability assessors or calculators on-board. Additionally, danger to cargo in particular for those ships with deck cargos, is also another constraint.
Real-time bunker and water transfers on-board: The officers on the watch might have incomplete knowledge of the bunker and water (grey/fresh water) transfers on-board. Therefore, they may not be aware of the effects of such activities on the trim. Again this highlights the importance of shipboard communications between deck department and engine department.
Watch changeover: Sometimes the information regarding ballast operations is not passed on during the watch changeover between the crew. Removing of the above barriers requires not only good understanding of the subject and training of ship-board crew and their dedication on best practice but also a continuous improvement approach to the problem for long-term sustainable culture of best practices.
3.1.8 Frequently Asked Questions
In this section, a number of frequently asked questions are raised and a summary of the discussion in this section is provided.
How much trim impacts fuel consumption?
There is no clear cut answer to this important question. Whilst the impact of trim is known to be significant under some conditions or for some ship types, there are no hard facts from ships' actual operations on the exact level of savings that may be made using perceived optimal trim. This is due to the fact that the measurement of savings under real operational conditions is quite difficult to assess. There is ample evidence from model tank tests and CFD analytical methods that show trim has a significant impact on ship fuel efficiency performance.
How does the optimal trim change with ship speed?
The change in optimal trim with ship speed and draft is through its impact on various types of ship resistances. It is quite reasonable to find that the optimal trim varies with ship speed and ship draft but this relationship will vary from ship type to ship type.

7
February 2017 marifuture.org
Development Paper
Is in-passage ship trim different from the trim set when in port?
It is well known that when the ship trim is set to zero during loading (even keel), the ship will give trim by bow due to the impact of ship speed (due to the ship sinkage phenomena). This means that the trim of the vessel while underway is different from its trim while at berth or waiting.
How in practice is trimming done while a ship is underway?
This is done via a shift of ballast water, and in some cases bunker fuel, between alternative tanks and possibly shift of water.
Is optimum trim different for loaded versus ballast conditions?
A ship's hydrodynamic performance under loaded and ballast conditions could be significantly different due to changes in draft and wetted surface area and performance of the bulbous bow. The same is true for trim under loaded and ballast conditions. Therefore, there is a need to have the optimal trim established for various draft levels. Also for ships operating in a variety of loading, and therefore variety of draft conditions, the optimal trim needs to be established for all the working drafts.
How is the trim set / changed?
The change in ship trim is achieved via the proper cargo load planning and ship ballasting plan. The combination is used to achieve the desirable trim. After the loading is complete, ballast water shifting and to some extent bunker fuel shifting between tanks can be used to aid trimming. In any case, it is better that load planning is done by considering the optimal trim as otherwise it may not be possible to trim the ship properly with the use of ballast water only. Based on what has been described in this section, the following may be stated:
Trim could influence ship fuel consumption significantly, with the
evidence showing up to 4% of savings.
Trim impact is the result of changes to ship hydrodynamics and
thereby ship resistances.
For every ship, there is an optimal trim that will give minimal ship
resistances and maximise fuel efficiency.
The optimum trim is a function of ship speed and draft.
For certain ship types, in particular those with higher design speed,
slimmer body, pronounced bulbous bow and flat stern design, trim will
provide more impact.
Optimal trims are established either through extensive model testing
or CFD analytical methods.
To achieve optimal trim, due consideration should be given to ship
loading and its load planning.
Ballast water, and to some extent bunker fuel, may be used to trim
the vessel.
Most loading computers on-board provide functionalities and trim
tables to achieve the desirable ship trim.

8
February 2017 marifuture.org
Development Paper
It is difficult to measure the actual saving levels due to trim while the
ship is underway due to impact of other operational conditions
(speed, draft, weather and sea impacts).
3.1.9 References and further reading
The following list provides references for this section and additional publications that may be used for more in-depth study of topics covered in this section:
1. Tero Illus, 2012 “Taking the guesswork out of trim”, BIMCO bulletin, V107, August
2012.
http://www.eniram.fi/wp-content/uploads/2013/10/2012-08-BIMCO-Taking-guessworkout-of-trim.pdf viewed on 3rd Nov, 2016.
2. Melvin Mathew, 2012 “Trim Optimisation”, MarinLink 2012,
http://www.eniram.fi/wpcontent/uploads/2013/06/News-2013-03-Marine-Link.pdf
Viewed on 3rd Nov, 2016.
3. Force Technology 2011, “Understanding of the physics of trim”, Ship and Offshore
Green
Tech, 2011.
4. Rod Sampson 2008, “Self propulsion tests”, lecture presentation, Newcastle
University, April
http://research.ncl.ac.uk/cavitation/archive/Lecture%2014%20%20Self%20propulsion
%20test.pdf
Viewed on 3rd Nov, 2016
5. Lloyd’s Register 2011, Company factsheet May 2011, www.lr.org viewed on 3rd Nov,
2016.
6. Nikolaj Lemb Larsen 2012, “Understanding the physics of trim”, presentation to
Green Ship
Technology Conference, March 2012. Viewed on 4th Nov, 2016
7. “IMO train the trainer course material”, developed by WMU, 2013. Viewed on 07th
Nov 2016.
8. ABS 2013 “Ship Energy Efficiency Measures, Status and Guidance“,
http://www.eagle.org/content/dam/eagle/publications/2013/Energy%20Efficiency.pdf, viewed on 3rd Nov, 2016.
3.2 Hull and Propeller Condition
3.2.1 Ship Resistance and Hull Roughness
As discussed earlier, the ship resistances due to wetted surface areas are composed of frictional and wave making resistance. Frictional resistance, in particular for slower speed ships, is the primary component of total resistance. A tanker at its design speed will use the majority of its fuel overcoming frictional resistance when sailing in calm water. When the hull

9
February 2017 marifuture.org
Development Paper
moves through the water, water will be dragged along, creating a body of water following the ship and forming what is referred to as a “boundary layer”. In the forward part of the ship this boundary layer will be comparatively thin, but it grows in thickness along the sides of the hull. A boundary layer will form even on completely smooth hull surfaces. Increasing the roughness of the hull surface tends to increase the boundary layer, consequently increasing the frictional drag of the hull. In ship resistance, another major player is the ship speed relative to water close to hull surface. The effect of surface roughness on the resistance depends on the effective speed of the water relative to the hull, and this varies over the hull surface. For example increased surface roughness in the bow area will cause greater resistance than in the aft areas or under the hull bottom because the effective speed of the water will be less. So in reducing the roughness, different part of the ship will have different level of impacts even if their original roughness is the same. The smother the hull, the less resistance the ship will have and thus the faster it will go for the same power output, saving fuel and reducing GHG emissions. Fouling will reduce the smoothness (increase roughness) of the hull and even may add weight to the vessel reducing the cargo carrying capacity. These impacts make the hull roughness and fouling a major issue of control for energy efficiency. Figure 3.2.1.1 shows this relationship between increase in required propulsion power or fuel consumption and hull roughness. It has been suggested that each 10 μm to 30 μm of additional roughness can increase total hull resistance by about 1 percent for full form ships (of course the increase in resistance will be influenced by ship speed as well).
Figure 3.2.1.1 – Typical increase in power/fuel required to maintain vessel speed of a fast fine ship vs increasing hull roughness [International Paint 2004]
It is not uncommon for a new ship to be delivered with surface roughness as low as 75 μm and later in life enter dry-dock with a roughness of 250 μm. Historical records have shown that even with good maintenance practices average hull roughness can increase by 10 to 25 μm per year, depending on the hull coating system, even when fouling is not included [ABS 2013]. Figure 3.2.1.2 shows typical ship increased resistance as a function of time and impact of hull surface improvements due to maintenance efforts.

10
February 2017 marifuture.org
Development Paper
Figure 3.2.1.2 – Changes in ship resistance with time [Monk and Kane]
3.2.2 Causes of Surface Roughness
Hull surface roughness comes in many forms and from many sources which can be broadly categorised as physical or biological. These sources are further grouped based on size as either micro roughness (less than 1 mm) or macro-roughness (greater than 1 mm). The physical micro-roughness can be increased in service by mechanical damage, failure of the applied coating and even improper preparation of the surface and/or improper application of a new coating. Biological roughness (fouling) also has a significant impact on resistance, even at the micro level (slime, algae, barnacle etc.). See Figure 3.2.2.1 for some types of fouling. Predictions based on model tests of a light displacement fine form ship indicate that a light slime covering the entire wetted surface can increase total resistance by 7 to 9 percent. A heavy slime results in a total increase on the order of 15 to 18 percent. Small barnacles and weeds push this up to a 20 to 30 percent increase in total resistance [ABS 2013].
Barnacles

11
February 2017 marifuture.org
Development Paper
Mussels
Green Weeds
Figure 3.2.2.1 - Example of fouling [International Paint]
Biological fouling is a very complex process that depends on factors such as the ship’s loading condition, its operating zones, the effectiveness of anti-fouling paint and environmental conditions. If a ship is constantly moving it will not gather as much marine growth as one that spends long periods in port or at anchor. If a vessel is left static for extended periods it will allow the marine growth, that cause fouling, to attach itself to the hull and propeller which will reduce the speed of the ship and increase the fuel consumption. Hull cathodic protection also tends to work better when the ship is moving.
The main factors that influence hull fouling rates are:
Initial roughness of the hull
Quality of hull coating
Robustness of the coating with respect to mechanical damage

12
February 2017 marifuture.org
Development Paper
The areas of the hull where there is sunlight, along the sides of the hull and near
the waterline.
Temperature of water (colder water generally means less fouling)
The salinity of the water (performance coating will be a function of salinity of
water)
Amount of algae in the water
Ship speed and its operation profile (hull moving, speed, at berth, at anchor,
layby, etc. or static)
Hull maintenance
During the operation of the ship, surface roughness can increase due to cracking and damage to the coating as well as due to corrosion which can also attract marine growth. The growth of organic species will include slime, weed fouling, and barnacles as examples shown in Figure 3.2.3.1. Current antifouling paints tend to last for a maximum period of 3–5 years when the self-polishing coating must be renewed however its performance is reduced gradually over time as explained later. The hull will also require cleaning / brushing that can either be performed by divers or automatically with either the whole hull or just critical parts being targeted. Having a shorter interval between the applications of coatings may therefore reduce energy consumption but there are some problems as the ship will require an additional dry-docking that is very costly.
3.2.3 Hull Roughness Reduction
Taking care of the underwater portions of the hull is all about minimizing roughness. This can be achieved via smooth surface finish, more appropriate paint, more appropriate operation and more appropriate hull and propeller maintenance. In order to minimize a ship’s frictional resistance, the owner must address both physical and biological roughness. There should be a smooth surface to start with and it should be maintained at proper intervals. Mechanical damage and coating failures have to be addressed and fouling has to be controlled. Regardless of what system is selected to manage roughness, care should be taken to make sure the cleaning methodology is compatible with and compliments the coating system. Regardless of the type of coating, it is also worth noting that the amount of fouling can vary greatly with trading pattern and operational profile.
3.2.4 Hull Coatings
There are currently three different coating types in wide usage and they offer different resistance to fouling, have a different impact on hull roughness and have different requirements for cleaning frequency. These are [ABS 2013]
Controlled Depletion Polymer (CDP) – A traditional antifouling type based on
water soluble natural or synthetic pine rosin mixed with a biocide. An insoluble
reinforcing polymer resin is added to create a skeleton to give the rosin better
mechanical properties. The controlled dissolution of the rosin matrix releases the
biocides. Over time a build-up of insoluble materials at the surface in a leached
layer slows the release of biocide and makes recoating difficult. Moving water (or
cleaning) is required to wear off this resin skeleton and release the next layer of
coating and biocide. Typical life before recoating is 3 years, but because of the
build-up of this leached layer and reduced biocide release micro fouling (green
slime or weeds) can become a problem in less than two years. The average hull

13
February 2017 marifuture.org
Development Paper
roughness increase is estimated at about 40 μm per year in surface profile, but
this can vary greatly.
Self-Polishing Copolymer (SPC) – An insoluble metallic or organic synthetic
polymer (e.g. copper-acrylate or silyl-acrylate) that contains a biocide. Through a
chemical reaction – hydrolysis – the polymer becomes soluble. Its subsequent
dissolution releases the biocide. The chemical reaction provides good control of
the rate of dissolution and results in a much thinner leached layer and smoother
surface profile than possible with CDPs. No ship movement is required as there
is no residual ‘skeleton’ and the surface is actually self-smoothing. Five years of
service for high quality systems can be achieved. Average hull roughness
increase is estimated at about 20 μm per year.
Foul-release Coating – A biocide-free coating that uses non-stick properties to
control fouling. It is usually silicone or fluoro-silicone based and designed to shed
any micro or macro growth when the vessel is underway. For slower vessels
(less than 15 knots) this is a challenge for even the best coatings so some ‘soft’
cleaning is usually required to remove the micro fouling. If the vessel is stationary
for some time, barnacles and other macro-size biota can become attached.
Achieving a full release of all fouling through ship speed impact has proven to be
a challenge in some cases. The coating gains some of its effectiveness from its
extremely smooth surface and this must be maintained for best performance.
Roughness in a foul-release coating will reduce its ability to discourage adhesion
and slime/ micro fouling can take hold. Mechanical damage from example from
tugs is especially critical for these types of coatings requiring special care in
operations as the damaged parts has no fouling protection. Average hull
roughness increase is estimated at 5 μm per year, but this is based on a very
limited service experience.
The factors that govern the type of underwater hull coating that may be applied to a ship are;
1. Cost: The more effective anti-fouling coatings tend to be more expensive.
2. Speed of vessel: Fast vessels such as HSC tend to have harder coatings.
3. Fresh-water or salt-water: The coating quality should be chosen accordingly.
4. Compatibility: Some coatings cannot be used on top of others due to adverse
physical and
chemical interactions.
5. National regulations: Some types of anti-fouling paints are banned in certain
countries.
6. Area of operation: Severity of fouling in area vessel is trading, some sea areas are
much worse
than others.
When searching for the best hull coating, it is important to consider a coating that provides a smooth surface that can be reasonably maintained in its smooth state, and that prevents adhesion of fouling organisms. Also, the coating must be applied properly, monitored and managed to maintain its best qualities. If done correctly, the right coating upgrade can offer significant fuel saving improvement. In general, application of a good high-quality coating can yield an average reduction of up to 4% in propulsion fuel consumption. Reducing an already rough hull to smoother one (via getting rid of fouling, surface blasting, etc.) and applying advanced coating even can provide 10-12% decrease in fuel cost. A full blast to

14
February 2017 marifuture.org
Development Paper
remove surface roughness and application of prime, anti-corrosive and high quality antifouling coating can cost about US $10/m2. This converts for a VLCC to about US $300,000 [ABS 2013] Since the banning of TBT (Tributyltin) based on “The International Convention on the Control of Harmful Anti-fouling Substances on Ships, 2001”, most anti-fouling coatings are self-polishing copper and tin based paints but it should be borne in mind that some countries are either banning or considering banning the use of copper based paints in certain areas particularly in inland waters. Biocide-free silicon-based coatings are also available but their market share is very small due to their high cost. These coatings are commonly referred to as “foul-release coatings” as they have a soft surface onto which it is difficult for most organic growth to hold. Research has shown that these new coatings are equally as effective as TBT-based systems but there is still some debate and not everyone is totally convinced. In general, the more advanced products do yield better results, however if a particular ship operating in a particular area, is getting fouled up faster with one product, it is worth considering changing to a different one. It is also worth talking to other ship operators in the same area and asking which product works best for them, as they can give unbiased advice which one may not get from an original vendor.

15
February 2017 marifuture.org
Development Paper
3.2.5 Hull Cleaning
Regular in-service cleaning to remove fouling organisms is clearly beneficial unless it is carried out in a way that results in a damaged coating or a ‘roughed’ up surface. From a fuel efficiency point of view, the emphasis should be on hull and propeller “roughness” management and not just on the control of “fouling”.
In the case when only partial cleaning is possible due to operational circumstances, the hull areas should be cleaned in the following order to provide the best performance enhancement:
• Forward third of hull.
• Remainder of hull working from forward to aft with emphasis on areas which have
more exposure to light.
A proactive approach that pre-empts any type of widespread macro fouling is always recommended simply because the cost of having such fouling present outweighs the cost of cleaning by a very large margin. Regular cleaning of micro-fouling is also often cost effective if the proper cleaning technique is used so that the surface roughness is not degraded and coating material is not removed. For best results, the scheduling of cleaning should be based either on monitoring of performance indicators (like power versus speed) or on regular pre-cleaning inspections. In both cases a threshold is established that identifies when cleaning is economically justified. For visual inspections the threshold includes the percentage of the hull surface that is fouled and the type of fouling. Regular inspection, photographs and roughness measurements would be a prudent way to monitor the impact of cleaning and the condition of the coating. Use of underwater cleaning techniques and equipment should be done with care and with due consideration to original coating as well as amount of fouling. For example, removal of macro size fouling is difficult to be done without removing a significant amount of paint. If the antifouling is applied in different colour layers then these colours can be used to monitor paint removal during cleaning. In general, SPCs have a thinner leached layer than CDPs so the cleaning should use a less aggressive technique. Cleaning of foul-release coatings should only be done with a light touch and soft pads. In all cases, the advice of paint manufacturer should be followed, cleaning aspects should be reviewed with the cleaning company and condition before and after documented with good underwater photography of the cleaned surface. Cleaning a light slime can yield up to 7-9% reduction in propulsion fuel consumption. Cleaning a heavy slime could give 15-18% and cleaning of a macro heavy fouling up to 20-30%. Hull cleaning by divers can cost about US $1.5 to 2.5 in the Far East. This could convert to US $50,000 for a full hull cleaning for a VLCC based on ABS’s guide written in 2013. Of course, there is always no need to do a full hull cleaning, thus reduce the time and cost of hull cleaning but everything must be carried out with due care for the preservation of the coat system; otherwise things may give negative results.
Other aspects
Regulations: When planning for hull cleaning, it is also important to be aware of other regulatory instruments that govern the coating system. The IMO at its MEPC meeting in July 2011 adopted, as a voluntary instrument, the MEPC.207 (62) resolution on “Guidelines for the Control and Management of Ships’ Biofouling to Minimize the Transfer of Invasive Aquatic Species”. This asks for a Bio-fouling Management Plan and a Bio-fouling Record Book to be on-board. It is clear that while the proposed regulations undoubtedly will lead to added cost for ship maintenance and operation, it can also reduce the hull drag and fuel consumption if it is well managed with consideration for selection and maintenance of best coatings, and as such result in reduced total cost. Also, as indicated, there are local regulations that ban certain type of anti-fouling coatings that also need to be taken into account.
16
February 2017 marifuture.org
Development Paper
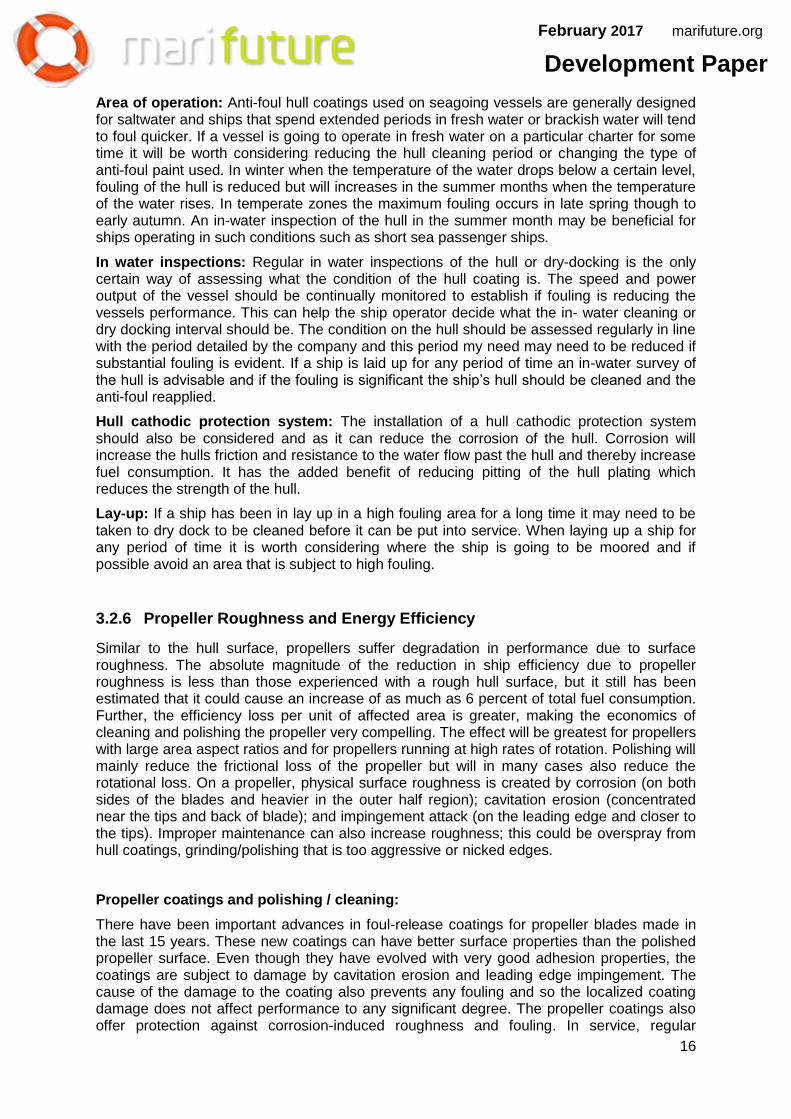
Area of operation: Anti-foul hull coatings used on seagoing vessels are generally designed for saltwater and ships that spend extended periods in fresh water or brackish water will tend to foul quicker. If a vessel is going to operate in fresh water on a particular charter for some time it will be worth considering reducing the hull cleaning period or changing the type of anti-foul paint used. In winter when the temperature of the water drops below a certain level, fouling of the hull is reduced but will increases in the summer months when the temperature of the water rises. In temperate zones the maximum fouling occurs in late spring though to early autumn. An in-water inspection of the hull in the summer month may be beneficial for ships operating in such conditions such as short sea passenger ships.
In water inspections: Regular in water inspections of the hull or dry-docking is the only certain way of assessing what the condition of the hull coating is. The speed and power output of the vessel should be continually monitored to establish if fouling is reducing the vessels performance. This can help the ship operator decide what the in- water cleaning or dry docking interval should be. The condition on the hull should be assessed regularly in line with the period detailed by the company and this period my need may need to be reduced if substantial fouling is evident. If a ship is laid up for any period of time an in-water survey of the hull is advisable and if the fouling is significant the ship’s hull should be cleaned and the anti-foul reapplied.
Hull cathodic protection system: The installation of a hull cathodic protection system should also be considered and as it can reduce the corrosion of the hull. Corrosion will increase the hulls friction and resistance to the water flow past the hull and thereby increase fuel consumption. It has the added benefit of reducing pitting of the hull plating which reduces the strength of the hull.
Lay-up: If a ship has been in lay up in a high fouling area for a long time it may need to be taken to dry dock to be cleaned before it can be put into service. When laying up a ship for any period of time it is worth considering where the ship is going to be moored and if possible avoid an area that is subject to high fouling.
3.2.6 Propeller Roughness and Energy Efficiency
Similar to the hull surface, propellers suffer degradation in performance due to surface roughness. The absolute magnitude of the reduction in ship efficiency due to propeller roughness is less than those experienced with a rough hull surface, but it still has been estimated that it could cause an increase of as much as 6 percent of total fuel consumption. Further, the efficiency loss per unit of affected area is greater, making the economics of cleaning and polishing the propeller very compelling. The effect will be greatest for propellers with large area aspect ratios and for propellers running at high rates of rotation. Polishing will mainly reduce the frictional loss of the propeller but will in many cases also reduce the rotational loss. On a propeller, physical surface roughness is created by corrosion (on both sides of the blades and heavier in the outer half region); cavitation erosion (concentrated near the tips and back of blade); and impingement attack (on the leading edge and closer to the tips). Improper maintenance can also increase roughness; this could be overspray from hull coatings, grinding/polishing that is too aggressive or nicked edges.
Propeller coatings and polishing / cleaning:
There have been important advances in foul-release coatings for propeller blades made in the last 15 years. These new coatings can have better surface properties than the polished propeller surface. Even though they have evolved with very good adhesion properties, the coatings are subject to damage by cavitation erosion and leading edge impingement. The cause of the damage to the coating also prevents any fouling and so the localized coating damage does not affect performance to any significant degree. The propeller coatings also offer protection against corrosion-induced roughness and fouling. In service, regular

17
February 2017 marifuture.org
Development Paper
underwater cleaning and reconditioning of the surface of a propeller is done with a small rotating disk that can easily conform to the complex shapes of the blades without gouging the surface. This tool removes all fouling and produces a fine surface scratch pattern in the range of 1 to 2 μm. This is similar to what would be expected of a newly manufactured blade surface. Any large deformation or damage, especially to the leading edges or tips, should also be repaired and smoothed out [ABS 2013]. The importance of the propeller being clean with a polished smooth surface cannot be over emphasised as the efficiency of any propeller can fall off rapidly if it becomes pitted and covered in marine growth. If the propeller is constantly rotating, there should not be a problem with marine growth but if there is not sufficient cathodic protection or the propeller is allowed to operate close to the surface, then cavitation pitting can be caused as a major problem. Marine growth will tend to accumulate much more when the propeller is not moving such as when the vessel is in port or at anchor. Running the engine every day for a short period can reduce this build-up if this is possible with not so much excessive fuel use. Preventive maintenance can be taken by polishing and applying coating to the propeller to reduce the build-up of marine growth and regular in-water surveys to inspect the propeller for damaged, pitting and marine growth. It has been estimated that polishing a roughened propeller surface may result in a decrease in fuel consumption of up to 3%. Cleaning and polishing of the propeller can generally lead up to 6% improvement in fuel consumption. Divers can clean a 5 bladed and 10 m diameter propeller in about 3-4 hours for a cost of about US $3,000 in the Far East. In Europe the cost could be double as high. These numbers are quoted from ABS guidelines that are written in 2013, thus subject to inflation and market forces.
3.2.7 Condition-Based Hull and Propeller Maintenance
Maintaining a clean hull and propeller as advised above lead to significant fuel consumption reduction. The major questions are:
1. What are the optimal timing for hull and propeller cleaning?
2. What the best routine for cleaning to safeguard the integrity of existing paint system.
3. What is the time to apply a new coating and which one?
Condition-based hull and propeller maintenance tries to give an answer for item 1. Knowing when to clean the hull and the propeller is the goal of condition-based surface maintenance.
This can be done in two ways:
• Measure/observe actual hull and propeller roughness/fouling and compare with
baseline values that indicate when cleaning should be done.
• Use performance analysis packages that track changes in fuel consumption,
shaft power and main engine power to identify degrading surface conditions.
The first method is based on a direct assessment of the actual surface condition which must be done by divers in port. By correlating the roughness and degree of fouling to losses in efficiency and increases in fuel consumption, the owner can make an economic decision on when hull cleaning and/or propeller polishing should be done. For second method and a proper ship performance assessment, it is necessary to evaluate the speed power curve and for this purpose, the ship’s speed though the water without the effects of weather, tides or currents should be established. This is very difficult to calculate accurately, particularly on an actual voyage, as these environmental factors may vary significantly a bit over the duration of the voyage. In such a condition, the best option would be to conduct performance monitoring in the form of periodic speed trials over a set distance, in both direction and in calm water. However, this is not always possible and thus limits the use of analytical methods. The use of performance monitoring systems is attractive because it measures fuel consumption directly and while underway without the need for special arrangements in port.

18
February 2017 marifuture.org
Development Paper
As stated, the impact of environmental condition on fuel consumption can be significant, thus it is necessary to isolate the effects of these parameters on fuel consumption. This is most reasonably done by collecting records of fuel consumption in controlled or at least repeatable voyage conditions. The data then has to be either normalised to remove effects of draft, trim, wind and waves, or compared with similar conditions in earlier tests. These approaches to performance monitoring have been in use for many years and there are quite a few vendors and products that endeavour to perform this function. Nevertheless, it remains difficult to use these methods to reliably discern the small gains or losses in efficiency due to light fouling that are now often the threshold for cleaning decisions. With these methods it is also not possible to separate the propeller condition from the hull condition. In summary, the use of performance monitoring tools is generally recommended along with accurate fuel consumption measurement techniques, but these should not be relied on exclusively to indicate when hull cleaning and propeller polishing are necessary. Thus, on a more practical aspect of condition monitoring, regular visual inspections that is supplemented by long-term records of coating types that has been applied, records of past roughness and fouling patterns. These added to performance data can be used to choose the best way to confidently maintain the condition of these critical surfaces. This is an all-inclusive approach to hull and propeller condition monitoring, as none of the above techniques on its own can provide the full answer to this important question.
3.2.8 References
1. “IMO train the trainer course material”, developed by WMU, 2013. Viewed 8th Nov
2016.
2. ABS 2013 “Ship Energy Efficiency Measures, Status and Guidance“,
http://ww2.eagle.org/content/dam/eagle/publications/2013/Energy%20Efficiency.pdf,
viewed 9th Nov 2016.
3. International Paint 2004, “Hull Roughness Penalty Calculator”, publication 2004,
http://www.international-marine.com/literature/hrpc_folder_paper.pdf
4. Munk, T and Kane D, “Technical Fuel Conservation Policy and Hull And Propeller
Performance”, Royal Institute of Naval Architects Design and Operation of Tankers
Conference, June 2011.
5. International Paint “Coatings Technology: What Is Fouling?,
http://www.international-marine.com/PaintGuides/WhatIsFouling.pdf
Viewed 9th Nov 2016.
6. MEPC.207(62) resolution on “Guidelines for the Control and Management of Ships’
Biofouling to Minimize the Transfer of Invasive Aquatic Species”, 2011.


![[XLS]engineeringstudentsdata.comengineeringstudentsdata.com/downloads/2017/2017... · Web view2017. 2017. 2017. 2017. 2017. 2017. 2017. 2017. 2017. 2017. 2017. 2017. 2017. 2017. 2017.](https://static.fdocuments.us/doc/165x107/5b037ece7f8b9a0a548c409a/xlseng-view2017-2017-2017-2017-2017-2017-2017-2017-2017-2017-2017-2017.jpg)


![[XLS] of applications... · Web view10/16/2017 10/16/2017 12/4/2017 12/4/2017 12/4/2017 12/4/2017 12/4/2017 12/4/2017 12/4/2017 12/4/2017 12/4/2017 2/10/2017 2/10/2017 9/2/2017 12/7/2017](https://static.fdocuments.us/doc/165x107/5b0243937f8b9a89598f584c/xls-of-applicationsweb-view10162017-10162017-1242017-1242017-1242017.jpg)


