
Margaret E. Kruk, MD, MPH Associate Professor of Global ...
10
Margaret E. Kruk, MD, MPH Associate Professor of Global Health Harvard T.H. Chan School of Public Health
Transcript of Margaret E. Kruk, MD, MPH Associate Professor of Global ...

Margaret E. Kruk, MD, MPHAssociate Professor of Global Health
Harvard T.H. Chan School of Public Health
Study aims• To describe variation in observed clinical
quality of two primary care – antenatal care and care for sick children – in 7 countries• To analyze the factors that explain variation
Understanding unnecessary variation in quality of care can yield insights into appropriate targets of intervention
2
Study sample• Nationally representative health system
surveys were conducted using comparable tools in Kenya, Malawi, Namibia, Rwanda, Senegal, Uganda, and the United Republic of Tanzania between 2006 and 2015• Facility audit, provider interviews, and direct
observation of clinical care• First antenatal care visits and all sick child visits
at non-hospital health facilities
3

Methods• Clinical quality: proportion of essential clinical
actions completed out of 8 items for ANC and 9 items for sick-child care in the domains of history, examination, diagnostic tests, and counseling and management• Multilevel random intercept model (visits
within facilities) of quality with country fixed effects as well as facility, provider, and visit-level factors
4

Results• 2,638 ANC visits, 11,814 sick child visits• 80% public facilities• 75% of ANC visits and 49% sick-child visits to
nurses• Facilities scoring between 50% and 75% on
inputs to quality care (infrastructure, equipment, management)• Average quality: 62.2% in ANC, 54.5% in sick-
child care
5
Highly variable care
Bull World Health Organ 2017;95:408–418| doi: http://dx.doi.org/10.2471/BLT.16.175869412
ResearchPrimary care in sub-Saharan Africa Margaret E Kruk et al.
of 2594 first antenatal care visits and 11 402 clinical consultations for children younger than 5 years were fully observed in primary-care facilities. These visits were to 3902 unique providers (1077 for antenatal care and 3144 for sick-child care; 319 providers were observed in both services).
Of the visits for antenatal care, 430 (16.7%) were by teenage women and over half (1268; 52.9%) by those present-ing late for the first visit at that facility (Table 3). Of the observed sick-child visits, 4073 (35.1%) were for infants; the average child presented with close to three symptoms. Three-quarters of antenatal visits and almost half of sick-child visits were handled by nurses; only 74 (2.8%) of antenatal visits but 3565 (30.5%) of sick-child visits were dealt with by physicians or clinical/associ-ate medical officers. Overall, 11 387 of 14 452 (78.8%) of patient visits were to public health-care facilities.
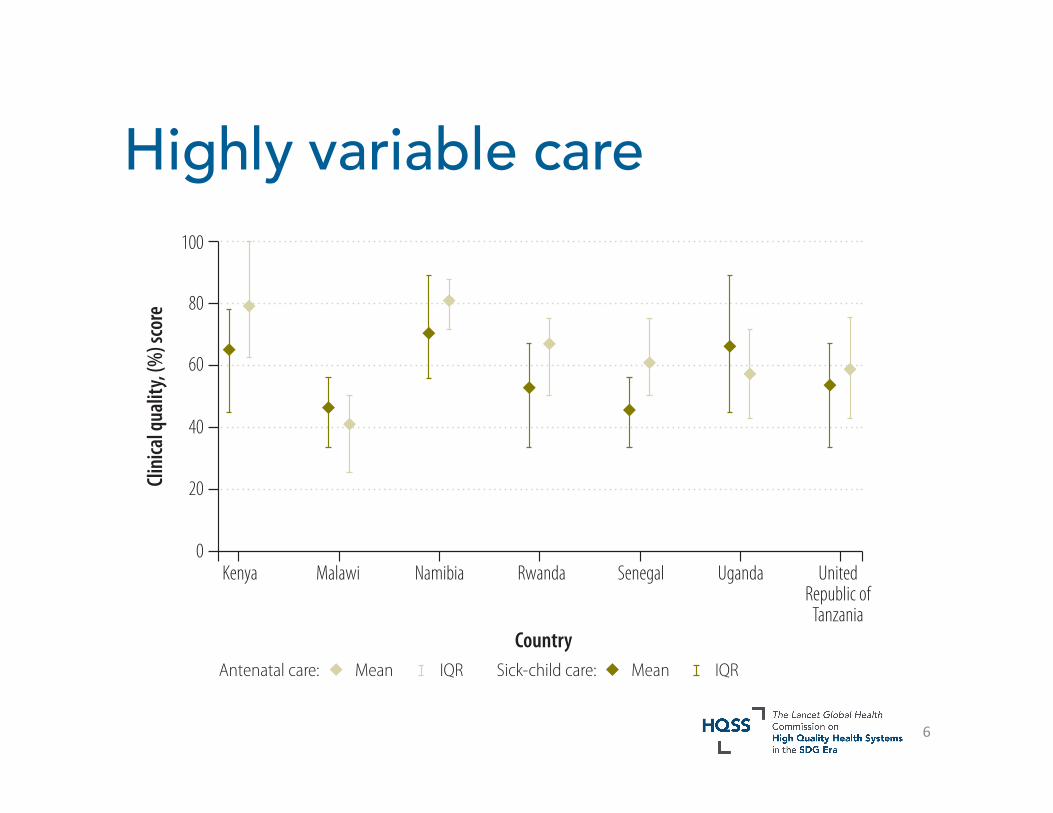
Overall quality of care was low, with a mean score of 62.2% (IQR: 50.0 to 75.0) for antenatal visits and 54.5% (IQR: 33.3 to 66.7) for sick-child care visits. Quality varied considerably across the countries surveyed, as shown in the comparison of quality scores by country in Fig. 1. The quality of care for pregnant
women was typically higher than for sick children. Fig. 2 displays the variance in clinical quality when providers were grouped according to quartiles of aver-age quality by country. Variability within quartiles was not consistently associated with average quality: both poor and good providers displayed considerable variability.
Table 4 presents the results of the fully adjusted, multivariable, random intercept regression models. The ana-lytical sample included 2173 antenatal visits (83.8%) and 10 646 sick-child visits (93.4%) with complete data on covariates. For antenatal care, higher-risk women received significantly worse care than other women (−1.9 percentage points out of 100 for teenage mothers and −1.6 percentage points for late first visits). Within providers, the only significant association was underperfor-mance, relative to nurses, of the small number of clinicians providing antenatal care (−8.3 percentage points difference). Quality of care scores were higher at private facilities (4.5 percentage points better than public facilities), at facilities with more staff (2.0 percentage points increase for each doubling of staff per bed), and at facilities with better infra-structure and equipment (differences
of 9.8 and 16.5 percentage points for a score of 1 versus 0 on these indices). Using Malawi as the reference, the six other countries had significantly higher antenatal care quality, with differences up to 33.4 percentage points for Kenya and 32.5 percentage points for Namibia, the two highest income countries in this study. The intra-class correlation in the unadjusted model was 81.4%, indicat-ing relatively low variability in quality of care within providers (i.e. between visits).
Results for quality of sick-child care differed in several ways (Table 4). Higher-risk children, i.e. infants and those with more symptoms, received better care (differences of 2.0 and 2.6 percentage points, respectively) than other children. Physicians provided similar quality of care relative to nurses, with assistants and aides significantly worse than nurses (−3.1 percentage points). More-experienced providers provided significantly higher quality care. Of facility characteristics, only private facilities and better manage-ment practices were significantly as-sociated with higher quality of care. All other countries except Senegal provided higher quality care on average than Malawi, notably Namibia and Uganda (> 20 percentage points higher). The intraclass correlation in the unadjusted model was 59.0%, evidence of moderate between-visit variability in providers’ quality of care.
Overall, the full models explained 37% of the total variance in antenatal care and 20% of the variance in sick-child care. Over 80% of explained vari-ance in each service was due to the coun-try variable. Only facility characteristics for antenatal care (19% of explained variance) and visit characteristics for sick-child care (10% of explained vari-ance) contributed meaningfully to the model’s explanatory power. Findings for both services were largely unchanged in sensitivity analysis excluding first observations. Variance estimates and sensitivity analysis are available from the corresponding author.
Fig. 3 depicts the scope for im-provement in quality in each country. Enabling providers to provide quality of care at their own peak performance would result in gains of over 5% in ante-natal care quality and 10% in sick-child care quality. Bringing all visits up to the standard of the top quartile of facilities would result in linear increases of over
Fig. 1. Range of clinical quality observed at visits for antenatal and sick-child care in Kenya, Malawi, Namibia, Rwanda, Senegal, Uganda and the United Republic of Tanzania, 2006–2014
Clini
cal q
ualit
y, (%
) sco
re
100
80
60
40
20
0
Mean MeanIQR IQRAntenatal care: Sick-child care:
Country
Kenya Malawi Namibia Rwanda Senegal Uganda UnitedRepublic of
Tanzania
IQR: interquartile range.Notes: Data were obtained from service provision assessment surveys of health facilities in each country (survey year range: 2006–2014). Data points show the mean and IQR clinical quality score of visits for each country. Quality scores are the percentage of recommended clinical actions done by health-care providers at the visit (eight items for antenatal care, nine for sick-child care); mean and IQR are calculated across all observed visits per country. Data for Kenya, for example, indicate that in an average visit, a provider completed 79.2% of items (6.3 of 8) for antenatal care and 64.9% of expected items (5.8 of 9) for sick-child care.
6

7
Bull World Health Organ 2017;95:408–418| doi: http://dx.doi.org/10.2471/BLT.16.175869414
ResearchPrimary care in sub-Saharan Africa Margaret E Kruk et al.
and 59.0% for sick-child care) stemmed from differences in quality of care across providers (including their country and clinic factors), individual providers also gave different care to different patients.
Patient and visit factors were influential in explaining the quality of sick-child care in particular. Care quality was higher for younger and sicker children. Antenatal care was weaker for teenage
patients and those presenting after 24 weeks of pregnancy (potentially due to prior antenatal care). While a patient’s specific presentation and case severity can alter providers’ clinical actions in a consultation, the items included in our quality indexes represented basic medi-cal procedures that should have been done for all patients.42
The best performance by provid-ers and clinics in each country sug-gest considerable scope for national improvement in quality. All countries in this study could make large gains in quality if providers performed at their best and if all facilities performed at the level of the top quarter of clinics. The visit-to-visit variation within in-dividual providers may be decreased by better adherence to guidelines and intensive supervision to promote more consistent performance of essential functions.
This analysis has several limitations. Although direct observation is the gold standard of clinical quality measure-ment, it is subject to the Hawthorne effect and observer error. We did not find evidence that the Hawthorne effect materially influenced the intra-provider variation within the relatively small number of observations per provider.35 However, we cannot rule out mistakes in the observers’ recording of clinical care contributing to between-visit variance; some researchers consider between-visit variation a nuisance parameter reflect-ing statistical noise.43 Our quality indices were defined based on items asked in all service provision assessment sur-veys and matched with evidence-based guidelines. While other items could be added to provide a more complete as-sessment of quality, these indices repre-sent a minimal level of quality. We were not able to link the process of clinical care to patient outcomes. Measurement of provider and facility characteristics differed across the service provision as-sessment surveys. For example, we were not able to investigate differences within classifications of nurses due to lack of disaggregated data in some countries. The data did not contain contextual factors that may contribute to variation in the processes of care, such as local epidemiology, and community factors that may influence clinic performance, such as accountability charters or strong local district management. To limit the role of such factors in this analysis, we constructed quality metrics limited to
Table 4. Results of multilevel regression models of clinical quality observed at visits for antenatal and sick-child care in Kenya, Malawi, Namibia, Rwanda, Senegal, Uganda and the United Republic of Tanzania, 2006–2014
Characteristic Quality coefficienta (95% CI)
Antenatal care (n = 2173)b Sick-child care (n = 10 646)b
Visit variablesAfternoon visit −0.2 (−1.8 to 1.3) −0.5 (−1.5 to 0.4)Educational attainment above secondary school
0.6 (−0.9 to 2.1) −0.9 (−1.7 to −0.03)
First antenatal visit ≥ 24 weeks −1.6 (−2.7 to −0.5) N/ATeenage antenatal patient −1.9 (−3.5 to −0.4) N/AAge of sick child < 12 months N/A 2.0 (1.4 to 2.7) 12–60 months N/A Ref.Complaints per sick child N/A 2.6 (2.3 to 2.8)Provider variablesCadre Physician/clinical officer −8.3 (−13.4 to −3.1) 0.7 (−1.3 to 2.6) Nurse/midwife Ref. Ref. Nursing assistant/aide/other −3.2 (−6.8 to 0.5) −3.1 (−5.0 to −1.2)Graduated > 5 years before −1.2 (−3.6 to 1.3) 1.8 (0.6 to 3.1)Supportive environment −2.8 (−7.3 to 1.7) 0.3 (−2.1 to 2.7)Facility variablesManaging authority Government Ref. Ref. Private 4.5 (1.2 to 7.8) 3.0 (1.4 to 4.7)Services in facility (natural log of service count)
2.0 (−4.4 to 8.4) −0.2 (−2.8 to 2.5)
Staff per bed (natural log of staff per bed)
2.9 (1.0 to 4.7) 0.2 (−0.8 to 1.1)
Infrastructure index 9.8 (0.7 to 18.8) 2.9 (−2.0 to 7.8)Equipment index 16.5 (8.5 to 24.4) 2.6 (−0.1 to 5.3)Management index −1.9 (−9.3 to 5.6) 4.9 (1.2 to 8.7)CountryKenya 33.4 (28.4 to 38.4) 15.7 (12.6 to 18.8)Malawi Ref. Ref.Namibia 32.5 (27.8 to 37.1) 26.0 (23.4 to 28.7)Rwanda 23.2 (18.6 to 27.9) 6.5 (3.9 to 9.1)Senegal 18.8 (13.5 to 24.0) 1.2 (−1.2 to 3.6)Uganda 14.4 (9.2 to 19.6) 22.1 (18.8 to 25.3)United Republic of Tanzania 18.5 (13.4 to 23.7) 8.9 (6.4 to 11.4)Intercept 22.4 (3.1 to 41.7) 30.0 (22.5 to 37.5)Total variance 330.4 397.6Provider variance 232.5 (206.9 to 261.3) 204.5 (191.2 to 218.7)Residual variance 98.0 (84.3 to 113.8) 193.1 (185.2 to 201.3)
CI: confidence interval; N/A: not applicable; Ref.: reference category.a Quality coefficient is the expected difference in visit quality (scale 0 to 100) given a 1 unit difference in the
exposure, holding all other covariates constant.b n is the number of observations with complete data on covariates.
Notes: Data were pooled from service provision assessment surveys of health facilities in each country (survey year range: 2006–2014). All standard errors are clustered by facility. Information on indices (e.g. provider support, infrastructure) is in the notes to Table 3. Intraclass correlation between visits for providers in the unadjusted model was 81.4% for antenatal care and 59.0% for sick-child care.
Full models

Facility, provider, visit factors explained limited amount of variation• 19% of variation in ANC and 41% in sick-child care
due to within-provider differences in care• Full models explained only 37% of variance in ANC
and 20% in sick-child care; over 80% of explained variance due to country fixed effect.• ANC quality was lower among physicians and
clinical officers, higher in private clinics and in facilities with better infrastructure and equipment. • But being in Uganda was linked to 30% better care
while better infrastructure was associated with 3% better care
8

Discussion• Understand why
countries produce such different levels of quality• How to standardize
sick child care among providers• Assess best
performers
9
Bull World Health Organ 2017;95:408–418| doi: http://dx.doi.org/10.2471/BLT.16.175869 415
ResearchPrimary care in sub-Saharan AfricaMargaret E Kruk et al.
only the most essential clinical func-tions. In future, it would be valuable to assess more aspects of compliance with WHO guidelines32,33 on clinical care for mothers and infants. Finally, the service provision assessment contains observa-tions for only a few services. Whether quality differs for other primary-care services should be explored.
Analysis of variations in quality of care processes can lay the groundwork for quality improvement.44 Equipment, staffing and management factors af-fected quality of care and these provide concrete areas for improvement. How-ever, the substantial variation in qual-ity of care across the study countries after accounting for these measured factors should prompt examination of national standards for professional education of health-care providers and health-system policies to support quality care. The finding that quality also varied across clinics in the same country and even among consultations done by the same provider suggests that identifying and replicating local best practices will be valuable. Efforts are under way to design better models of antenatal care and to test innovations in primary care.45–47
The first step to closing the qual-ity gap is to measure it. Governments of lower-income countries that want to enhance their health outcomes and provide better services to citizens can use these data as a baseline for improve-ment. Global partners should support the means to fund comparative analy-ses, develop efficient measures, assist in improving of routine information systems, and train local health system researchers. Reaching the SDGs will require a shared commitment to this new agenda. ■
Competing interests: None declared.
Fig. 3. How clinical quality would change if all providers performed at their highest observed level and at the level of the highest quartile of facilities in Kenya, Malawi, Namibia, Rwanda, Senegal, Uganda and the United Republic of Tanzania, 2006–2014
Observed Provider’s highest quality Best 25% facilities
Country
Country
Clini
cal q
ualit
y, (%
) sco
reCli
nica
l qua
lity,
(%) s
core
100
80
60
40
20
0
100
80
60
40
20
0Kenya Malawi Namibia Rwanda Senegal Uganda United
Republic of Tanzania
Kenya Malawi Namibia Rwanda Senegal Uganda UnitedRepublic of
Tanzania
Antenatal care
Sick-child care
Notes: Data were obtained from service provision assessment surveys of health facilities in each country (survey year range: 2006–2014). The three bars represent: (i) the level of quality of care measured in this study; (ii) the predicted quality if all consultations were at the provider’s highest quality visit; and (iii) the predicted quality if all consultations were done to the same standard as the top 25% of primary-care facilities in the country.
ملخصالتباين في مستوى جودة خدمات الرعاية الأولية المقدمة في أوغندا وجمهورية تنزانيا المتحدة ورواندا والسنغال وكينيا
وملاوي وناميبياللملاحظة يخضع فيما التباين على المؤثرة العوامل تحليل الغرض من جودة الرعاية المقدمة في مرحلة ما قبل الولادة والرعاية المقدمة للمرضى من الأطفال داخل منشآت الرعاية الأولية في سبع دول
أفريقية.من مستمدة الوطني المستوى على تمثيلية بيانات جمعنا الطريقة في الخدمة توفير حيث من الصحية للمنشآت تقييمية مسوح أوغندا وجمهورية تنزانيا المتحدة ورواندا والسنغال وكينيا وملاوي ووفقًا .)2014-2006 المسح: لسنوات الزمني )المدى وناميبيا
لجودة مؤشرات أنشأنا العالمية، الصحة منظمة لبروتوكولات تدابير الرعاية المقدمة في مرحلة ما قبل الولادة )الزيارات الأولى( والزيارات الخاصة بالمرضى من الأطفال. وقيَّمنا العوامل الوطنية والعوامل المرتبطة بالمنشأة والمرضى والجهات الموفرة للخدمة والتي قد تفسر التباين في مستوى جودة الرعاية المقدمة، حيث استخدمنا نماذج تحوّف منفصلة متعددة المستويات فيما يتعلق بمستوى الجودة
لكل نوع من أنواع الخدمات.
Quality measures
Bull World Health Organ 2017;95:408–418| doi: http://dx.doi.org/10.2471/BLT.16.175869410
ResearchPrimary care in sub-Saharan Africa Margaret E Kruk et al.
Covariates
To construct an explanatory model for observed quality, we drew on Rowe’s framework for explaining the perfor-mance of health-care workers.34 This framework includes factors related to patients, providers and facilities, as well as the broader health system and community context.34 We identified covariates in the data that corresponded to the key constructs in the Rowe frame-work at the visit, provider, facility and country levels.
Visit-level covariates included: p a t i e n t ’s a g e ( t e e n a g e w o m a n [age < 20 years] at antenatal care visits; infant [age < 12 months] at sick-child visits), educational attainment of the caregiver present at the visit, and case complexity (late first visit [≥ 24 weeks gestation] for antenatal care; num-ber of complaints for sick children). Patient-level data came from patient exit interviews and observations. We identified afternoon visits to assess the influence of time of day on provider performance.
For health-care providers, three measures were available: cadre (physi-cian, nurse, or nursing assistant/other), experience (completed preservice train-ing > 5 years previously) and supportive environment. Physicians included medi-cal doctors as well as clinical officers and associate medical officers (paraprofes-
sionals with authority to diagnose and treat routine illness). Nursing classifica-tions varied too much across countries to consistently distinguish these fur-ther; the category of nurse included all midwives. The final category included nursing aides, assistants and any other personnel (e.g. counsellors and social workers). Providers were considered to have a supportive environment if they reported at least one of the following: clear job description, knowledge of op-portunities for promotion or availability of performance incentives.
Facility covariates included: owner-ship (private versus government) and measures of general service provision readiness (number of services provided; number of clinical staff per bed [small facilities without beds were assigned a value of one to permit comparison of staffing with larger facilities]; equipment availability; facility infrastructure; and facility management practices). For the last three measures we created indices composed of multiple items; details are available from the corresponding author. We calculated the natural log of the number of services offered by the facility and staff per bed for easier interpreta-tion of the results. Finally, as this was a pooled analysis of all seven countries, we used an indicator variable for country as a proxy for national factors that may influence quality.
Statistical analysis
To compare quality across countries, we calculated mean and interquartile range (IQR) for antenatal care and sick-child care quality. For each process quality score and explanatory covariate, we estimated the mean and standard deviation (SD), weighted based on cli-ent sampling weights. Bivariate analyses were then performed for quality on each covariate. Variables were included in the final model if they were statisti-cally significant at the P < 0.10 level for at least one type of visit (antenatal care or sick-child visits) or were conceptu-ally important. We estimated two-level random intercept regression models with visits nested within providers for each service. The large proportion of clinics with a single provider prevented construction of a three-level model (visit, provider and clinic). Estimates of between-provider difference thus include both facility differences and provider differences. Malawi served as the reference category as it was the poorest country in this study (Table 1). To test the impact of the Hawthorne effect on the results (a change in behav-iour as a result of being observed35), we conducted sensitivity analysis without the first observation per provider within each service. More details are available from the corresponding author.
We calculated the percentage of variation in quality explained by the covariates as the difference in variance between the adjusted model and the null model divided by the null model variance. We quantified the explained variance for each group of covariates (country, facility, provider and visit) by progressively adding blocks of variables to the multilevel random intercept mod-els. Regression analyses are unweighted due to adjustment for factors associated with respondent selection; models are clustered by facility.
All statistical analyses were carried out using Stata version 14.1 (Stata-Corp, College Station, United States of America).
ResultsAcross the seven countries, 4613 of 4798 sampled facilities were success-fully assessed (96.1%); 2902 of these facilities were primary-care facilities with at least one clinical observation in antenatal or sick-child care. A total
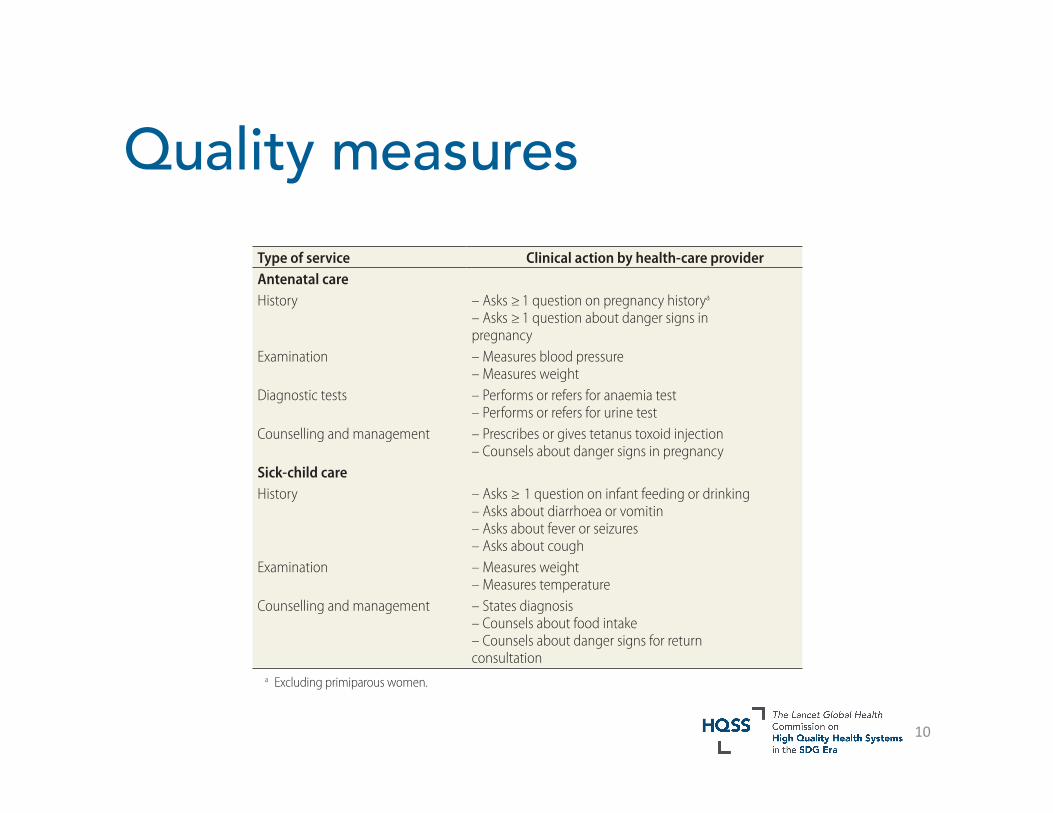
Table 2. Components of clinical quality indices for antenatal and sick-child care services
Type of service Clinical action by health-care providerAntenatal careHistory – Asks ≥ 1 question on pregnancy historya
– Asks ≥ 1 question about danger signs in pregnancy
Examination – Measures blood pressure – Measures weight
Diagnostic tests – Performs or refers for anaemia test – Performs or refers for urine test
Counselling and management – Prescribes or gives tetanus toxoid injection – Counsels about danger signs in pregnancy
Sick-child careHistory – Asks ≥ 1 question on infant feeding or drinking
– Asks about diarrhoea or vomitin – Asks about fever or seizures – Asks about cough
Examination – Measures weight – Measures temperature
Counselling and management – States diagnosis – Counsels about food intake – Counsels about danger signs for return consultation
a Excluding primiparous women.
10

![[Weis Margaret] Margaret Weis Tracy Hickman](https://static.fdocuments.us/doc/165x107/577ccf101a28ab9e788ec9e0/weis-margaret-margaret-weis-tracy-hickman.jpg)


