Marfin s.r.l. CODE OF ETHICS s.r.l. CODE OF ETHICS Contents DEFINITIONS 4 REFERENCES 7

A n n u a l R e p o r t
2009A n n u a l R e p o r t
2009

Prepared in accordance
with the International Financial
Reporting Standards
The financial report has been translated from the
original financial report that has been prepared in the
Greek language. In the event that differences exist
between this translation and the original Greek language
financial report, the Greek language financial statements
will prevail over this document.
February 2010
Annual financial statements as at 31 December 2009

1. Statement of comprehensive income 4
2. Statement of financial position 5
3. Statement of changes in Equity 6
4. Statement of cash flows 7
5. Board of Director’s report for the year 2009 8
6. General Information 11
7. Basis of preparation 12
7.1 Statement of compliance 12
7.2 Basis of presentation 12
7.3 New accounting principles 12
7.4 Estimates 15
8. Basic Accounting Principles 16
8.1 Foreign currency transactions 16
8.2 Investments in Financial Instruments 16
8.3 Property, Plant and Equipment 16
8.4 Intangible assets 17
8.5 Cash and cash equivalents 17
8.6 Impairment of financial assets 17
8.7 Financial liabilities 18
8.8 Employee benefits 19
8.9 Provisions 20
8.10 Leased agreements 20
8.11 Offsetting financial instruments 20
8.12 Interest income and expenses 20
8.13 Fees and commisions 21
8.14 Net trading income 21
8.15 Income Tax and Deferred Tax 21
8.16 Share Capital 21
9. Management estimations and assumptions 22
MARFIN FACTORS & FORFAITERS
ANNUAL REPORT 2009
2
Contents

10. Notes to the Financial Statements 23
10.1 Net interest income 23
10.2 Net fee and commission income 23
10.3 Net trading income 23
10.4 Other income-expenses 24
10.5 Staff costs 24
10.6 Administrative expenses 25
10.7 Impairment of advances and receivables 25
10.8 Taxes 26
10.9 Cash and cash equivalents 26
10.10 Cash advances to Factoring customers 27
10.11 Non recourse Factoring 28
10.12 Forfaiting Portfolio 28
10.13 Intangible Assets 30
10.14 Property, Plant and Equipment 31
10.15 Deferred Tax 32
10.16 Other assets 32
10.17 Due to banks 33
10.18 Dept securities in issue and other borrowed funds 33
10.19 Non recourse Factoring liabilities 34
10.20 Provision for post-employment benefits 34
10.21 Other provisions 35
10.22 Other liabilities 35
10.23 Share capital 35
10.24 Reserves 36
11. Related parties transaction 37
12. Fair value of financial assets and liabilities 38
13. Financial risk management 39
13.1 Credit risk 39
13.2 Interest rate risk 42
13.3 Currency risk 43
13.4 Liquidity risk 45
13.5 Operational risk 46
14. Capital Adequacy 47
15. Contingent liabilities 48
16. Subsequent events 49
17. INDEPENDENT AUDITORS’ REPORT 50
MARFIN FACTORS & FORFAITERS
ANNUAL REPORT 2009
3
Contents

(amounts in ú) Note 2009 2008
Interest and similar income 10.1 7.301.162 9.979.848
Interest and similar expense 10.1 -3.699.623 -7.007.860
Net interest income 10.1 3.601.539 2.971.988
Fee and commission income 10.2 3.229.765 2.581.587
Fee and commission expense 10.2 -330.246 -435.611
Net fee and commission income 10.2 2.899.519 2.145.976
Net trading income / expenses 10.3 0 0
Other income 10.4 -32.623 110.972
Operating income 6.468.435 5.228.936
Staff costs 10.5 -2.059.377 -2.207.557
Administrative expenses 10.6 -974.567 -1.061.546
Depreciation and amortization 10.13 & 10.14 -102.775 -119.313
Impairment of advances and receivables 10.7 -1.923.799 -1.198.834
Profit (Loss) before taxes 1.407.917 641.685
Taxes 10.8 -685.982 -280.937
Profit (Loss) after Taxes (∞) 721.936 360.748
Other comprehensive income and expense (μ) 0 0
Other comprehensive income and expense after Tax (∞)+(μ) 721.936 360.748
Profit (Loss) after taxes per share 0,19 0,10
Athens, March 4th 2010
The Chairman The Chief Executive The Manager The Manager
Ôf the Board Officer and Vice President of the Finance of Accounting
of Directors Ôf the Board of Directors Department Department
Konstantinos π. Vassilakopoulos Panagiotis D. Papatheodorou George Sourgiadakis Aggelos Simonetatos
I.D. No ª 310696 I.D. No ™ 573982 I.D. No ∞∂ 107169 License No. 3601
MARFIN FACTORS & FORFAITERS
ANNUAL REPORT 2009
4
Statement of comprehensive income1.

(amounts in ú) Note 2009 2008
ASSETS
Cash and cash equivalents 10.9 3.342.448 1.681.430
Advances to customers 10.10 240.479.066 172.727.714
Non recource factoring assets 10.11 12.720.260 14.342.111
Forfaiting receivables from customers 10.12 19.668.948 42.114.078
Intangible assets 10.13 73.042 50.492
Property plant & equipment 10.14 353.122 425.500
Deferred tax asset 10.15 37.747 37.747
Other assets 10.16 583.133 193.311
Total Assets 277.257.765 231.572.383
LIABILITIES
Banks & financial institutions 10.17 112.933.367 75.120.434
Debt securities in issue and other borrowed funds 10.18 132.633.625 126.256.449
Non recource factoring liabilities 10.19 14.070.505 14.342.111
Provision for post employment benefits 10.20 58.849 46.190
Other provisions 10.21 158.000 58.000
Deferred tax liability 10.15 63.310 63.310
Current tax 511.689 289.920
Other liabilities 10.22 1.814.333 1.147.156
Total liabilities 262.243.679 217.323.570
Share capital 10.23 10.870.300 10.870.300
Reserves 10.24 467.588 400.187
Retained earnings 3.676.199 2.978.326
Total equity 15.014.086 14.248.814
Total equity and liabilities 277.257.765 231.572.383
MARFIN FACTORS & FORFAITERS
ANNUAL REPORT 2009
5
Statement of financial position2.

(amounts in ú) Share Statutory Other Retained Total
Capital Reserves Reserves earnings Net Equity
Balance as at January 1, 2008 10.870.300 182.946 161.429 2.617.578 13.832.254
Net profit/(loss) for the year 360.748 360.748
Total results recognised in 2008 360.748 360.748
Stock Options 55.812 55.812
Balance as at December 31, 2008 10.870.300 182.946 217.241 2.978.326 14.248.814
Balance as at January 1, 2009 10.870.300 182.946 217.241 2.978.326 14.248.813
Net profit/(loss) for the year 721.936 721.936
Total results recognised in 2009 721.936 721.936
Statutory reserve 24.063 -24.063 0
Stock Options 43.337 43.337
Balance as at December 31, 2009 10.870.300 207.009 260.578 3.676.199 15.014.086
MARFIN FACTORS & FORFAITERS
ANNUAL REPORT 2009
6
Statement of changes in Equity3.

(amounts in ú) 2009 2008
Cash flows from operating activities
Profit/Loss before taxes 1.407.917 641.685
Adjustments for non-cash items
Depreciation 102.775 119.313
Impairment loss and provisions 1.923.799 1.198.834
Other provisions 100.000 58.000
Employee benefits 55.996 313.200
Transfer to investing activities -798.963 -1.118.750
2.791.524 1.212.282
Changes in operating assets
Loans and advances to banks
Forfaiting portfolio 23.244.093 30.991.575
Loans and advances to customers -68.053.300 -50.063.540
Other Assets -389.822 12.942
Changes in operating liabilities
Due to Banks 44.190.110 26.840.759
Due to Customers -271.606 -5.946.254
Other Liabilities 667.178 -2.004.315
Net cash flow from operating activities before taxes 2.178.177 1.043.450
Tax paid -464.213 -125.452
Net cash flow from operating activities 1.713.965 917.997
Cash flows from investing activities
Purchase of Assets -52.946 -102.654
Sale of assets 0 0
Net Cash flows from Investing Activities -52.946 -102.654
Total net Cash Flows 1.661.019 815.343
Net cash flow increase (decrease) 1.661.019 815.343
Cash and cash equivalents, opening balance 1.681.430 866.086
Cash and cash equivalents, closing balance 3.342.448 1.681.430
MARFIN FACTORS & FORFAITERS
ANNUAL REPORT 2009
7
Statement of cash flows4.

To the annual General Assembly of the shareholders of “Marfin Factors & Forfaiters S.A.”
Dear shareholders,
We hereby present information concerning the Company’s activity during the financial year 2009.
General OverviewLast year has been characterized quite peculiar with regards to international business. In essence, there was no
business or industry that was not affected, while it led some to serious restructuring. Even though Marfin Factors
& Forfaiters did not remain unaffected by the international crisis, we have nevertheless succeded in achieving
increased profitability in 2009 results through a most suitable management process. We have stood by our
clients; we have extended and managed the existing collaborations based on their changing needs. At the same
time, we have continued to service the needs of the marked with complex, specially structured financing
solutions. This effort has paid off by increased turnover, close to ú 1 billion in forfeited receivables, thus proving
in action the increased trust of the market towards our company.
Financial Position and resultsIn 2009, Marfin Factors & Forfaiters bought and managed receivables increased by 23.2% in comparison to the
previous year, significantly higher that the average of the Greek market (increase of approximately 8-10%). This
increase came mainly from domestic factoring; whole turnover came to ú 794m, increased by 32% in
comparison with 2008. In this specific service product, major sectors of the Greek market are represented, such
as wholesale food products, clothing, automobiles, electrical, electronics and technology, manufacturing, courier
services, fish farms, advertising, media etc. Even though the general market tendency showed decrease in sales,
something that was further confirmed by our clients’ turnover, the increased revenue of Marfin Factors &
Forfaiters was based both on the systematic expansion of existing collaborations (turn over of more debtors by
creditor, new products), as well as to new clientelle.
During 2009, Greek exports noted significant decrease, thus affecting departments of international factoring of
most companies. The International factoring of our company developed its business, accomplishing increased
turnover by 12% as compared to that of 2008. This result was based on our intensive efforts through new export
collaborations and better exploitation of existing, as well as on the strengthening of our import markets, through
the systematic relations development with factoring companies of exporting countries. This targeted activity lead
Marfin Factors & Forfaiters into the 3rd place in the greek market’s international factoring, holding a total market
share of 15.33% (data from Factors Chain International), while in the import sector it ranked 2nd, holding a 40%
market share and achieving increase of 57,6% reaching ú 43.20 m in total as compared to ú 27.42m in 2008.
Due to the international financial situation and the ambiguity that continued to define international markets
during 2009, the company continued to apply the policy of business decrease of secondary forfaiting mainly,
thus causing the turnover from this specific business segment to barely reach ú 13.3m compared to ú 44.2m
in 2008 and ú 100.6m in 2007.
The Advance balances of the company at 31.12.2009 amounted to ú 260.15m, increased by 21.1% as
compared to 2008.
The Net Operating Turnover amounted to ú 6.5m while the Profit before Taxes to ú 1.4m, increased by 23.7%
Î·È 119% respectively.
MARFIN FACTORS & FORFAITERS
ANNUAL REPORT 2009
8
Board of Director’s report for the year 20095.

The net commission revenue, which constitutes a basic course index for factoring companies, increased by 35%,
reaching ú 2.89m, while the net interest revenue noted an increase of 21.2% and amounted to ú 3.6m. thus
resulting in a 27% increase of Gross Turnover. On an Operating Results level, (ú 3.35m) the increase reached
79%. Provisions are significantly lower due to the write-off or previous years’ receivables (before 2007) and
constitute 1.22% of the company’s total open receivables. The Net Profit before taxes increased to ú 1.40m in
2009 compared to ú 0.64m in 2008. It is also noted that despite the negative situation in the markets, the
Serbian Branch Office was actively operated in September 2009, after the return to a fairly normal local market.
On an index level, the ratio of Operating Expenses to Operating Revenue (Cost-to-Income ratio) was restrained
to 48.7% against a previous 64.8%.
Risk ManagementThe risk management policy of the company, as well as its exposure to market risk, interest rate risk,
counterparty risk, liquidity risk and operational risk are being described analytically in the relative section of the
Notes to Financial Statements. The company has limited foreign currency and its assets do not include bills or
real estate property.
Transactions with related partiesAll transactions with related parties, are being carried out within the frame of the usual business processes,
performed according to market terms and conditions, and are being approved by the authorized officers of the
Company. These transactions are presented in the respective notes to the Financial Statements, the most
important one being that of loan transactions with the parent company Marfin Egnatia Bank which covers 100%
of the company’s loan payables.
ProspectsIn 2010, the company aims to achive a further increase of turnover, as a higher rate than that of the market,
thus increasing simultaneously its market share. The company also aims to further develop and enhance the
branch office in Serbia, as well as to reinforce its relations with foreign Factors and increase business of
international Factoring, despite estimated decrease of Greek exports in 2010, through better positioning in
selective sectors of export activities.
Post balance sheet eventsThe tax audit for fiscal years 2007-2008 was completed in February, imposing additional taxes and penalties
corresponding to the provision of accounting differences included in previous years’ taxes (see note 10.8).
MARFIN FACTORS & FORFAITERS
ANNUAL REPORT 2009
9

StatementThe members of the Board of Directors state that the attached company financial statements for the fiscal period
starting from 1st of January 2009 and ending on 31st of December 2009, which were prepared according to
effective International Accounting Standards and the International Financial Reporting Standards, fairly depict
the assets and the liabilities, the equity as well as the profit and loss of the company and that the Board of
Directors annual report clearly depicts in a fair way the development, the performance and financial position of
Marfin Factors & Forfaiters including the description of the most significant risks and uncertainties that the
company faces.
Athens, March 4 2010
By commission of the Board of Directors
Panos Papatheodorou
Managing Director & Vice-Precident BoD
MARFIN FACTORS & FORFAITERS
ANNUAL REPORT 2009
10

«MARFIN FACTORS & FORFAITERS S.A.» (former LAIKI FACTORING S.A. and from now on “the Company”),
has its domicile in Greece, and has been registered in the Societes Anonymes Register under number
41316/01/μ/981428.
The company is a member of the “MARFIN EGNATIA BANK S.A.” group. The Marfin Egnatia Bank group of
companies mainly operates in the financial sector providing a broad range of financial services to companies and
individuals.
Δhe Company’s main purpose is to conduct recourse and non-recourse Factoring operations in Greece and
abroad. The branch in Serbia is already operating and the expansion of its operations to other countries of South-
East Europe in the near future is a primary goal for the Company.
The Company makes business in the field of domesic and international Factoring with or without recourse as
well as Forfaiting in cross border transactions.
The Company’s head office is in Marousi 20, Kifisias Avenue.
ManagementAccording to the General Assembly of the shareholders on 26.10.2010 the body of the Board of Directors was
reorganized as follows:
The Chairman (Non executive member): Konstantinos π. Basilakopoulos
The Vice Chairman (Executive member): Panagiotis D. Papatheodorou
Executive members: Dimitrios ∞. Zouzoukis
Non executive members: Dionysios ∫. Papatheodorou
Efthymios T. Bouloutas
Kyriakos D. Mageiras
Heracles G. Kounadis
The auditors of the annual financial statements are as follows:
Regular: John G. Leos (SOEL Reg. No 24881)
Deputy: Athena ∫. Moustaki (SOEL Reg. No 28871)
Of the auditing firm: Grant Thornton S.A. (SOEL Reg. No 127)
MARFIN FACTORS & FORFAITERS
ANNUAL REPORT 2009
11
General Information6.

7.1 Statement of complianceThe financial statements of the Company have been prepared in accordance with International Financial
Reporting Standards (I.F.R.S) and all amendments which have been adopted by the European Union. The
financial statements were approved for publication by the Board of Directors on 4 March 2010 and are subject
to final approval of the Ordinary Assembly of the shareholders.
7.2 Basis of presentationThe financial statements are presented in euro which is the reported currency and they are prepared on a historic
cost basis.
7.3 New accounting principlesThe current financial statement were prepared in full compliance with the International Financial Reporting
Standards (IFRS) as well as the amendments that have been adopted by the European Union, whose adoption
is mandatory for the preparation of the financial statements covering the periods after 1.1.2009.
The accounting principles followed by the Company for the preparation of its annual Financial Statements as at
31/12/2009, are consistent to those described in the publicized financial statements for the year ended as at
31/12/2008, taking into account the following amendments to International Accounting Standards and new
Interpretations issued by IASB whose application is mandatory as starting from 1/1/2009.
(i) Standards, amendments and interpretations effective from January 1st 2009
The Company adopted for first time the following standards, amendments and interpretations were issued:
(a) IAS 1: (Revised) “Presentation of Financial Statements”:
IAS 1 has been revised to enhance the usefulness of information presented in the financial statements. The
revised standard prohibits the presentation of items of income and expenses (that is “non-owner changes in
equity”) in the statement of changes in equity, requiring “non-owner changes in equity” to be presented
separately from owner changes in equity. Entities can choose whether to present one performance statement
(the Statement of Comprehensive income) or two statements (the Income Statement and Statement of
Comprehensive Income). The Company has elected to present one Statement.
(b) IAS 23: (Revised) "Borrowing Costs" (effective from January 1st, 2009):
The revised standard requires that an entity capitalises borrowing costs directly attributable to the acquisition,
construction or production of a qualifying asset (an asset for which a significant period of time is required in
order to become ready for use or sale) as part of asset’s cost.
(c) IAS 32: (Amendment) “Financial Instruments: Presentation and IAS 1 Presentation of Financial
Statements (Amendment), (effective from January 1st, 2009):
The amendment to IAS 32 requires certain puttable financial instruments and obligations arising on liquidation
to be classified as equity if certain criteria are met:
Financial instruments which provide the right to the owner to claim their payment.
Means or components of means impose a liability to the Company to provide to a third party portion
of the equity in case of liquidation.
MARFIN FACTORS & FORFAITERS
ANNUAL REPORT 2009
12
Basis of preparation7.

(d) IAS 39: “Financial instruments: Recognition and Measurement (effective from July 1st, 2009):
This amendment clarifies how the principles that determine whether a hedged risk or portion of cash flows is
eligible for designation should be applied in particular situations. This amendment does not impact the
Company’s financial statements.
(e) IFRS 7: “Financial instruments: Disclosures” (amended in March 2009), (effective from January 1st, 2009):
The amendment requires enhanced disclosures about fair value measurement and liquidity risk.In particular, the
amendment requires disclosure of fair value measurement through a three level hierarchy. The adoption of the
amendment had no significant impact on the Company’s financial statements.
(f) IFRS 8: "Operating segments", (effective from January 1st, 2009):
The new IFRS requires a “management approach” to the Group’s presentation of financial information under
segment reporting. Information disclosed is basically information that the Management uses for internal
reporting so as to assess the productivity of segments, as well as the manner in which resources are allocated.
Such reporting might differentiate from information used during the preparation of the balance sheet and the
income statement. Furtheremore, the standard requires that explanatory notes on the basis of preparation of
segment reporting, as well as traces to entries in financial statements should also be disclosed.
(g) IFRS 2: “Share-based Payment: Vesting Conditions and Cancellations (Amendment), (effective from
January 1st, 2009):
This amendment clarifies that only service conditions and performance conditions are vesting conditions, while
all other features need to be included in the grant date fair value.The adoption of the amendment had no impact
on the Company’s financial statements.
(g) IFRIC 13 “Customer Loyalty Programmes”, (effective from July 1st, 2009):
IFRIC 13 is applied on customer loyalty programmes. This Interpretation addresses the accounting by entities that
provide their customers with incentives to buy goods or services by providing awards (called ‘award credits’ in the
Interpretation) as part of a sales transaction. This interpretation is not relevant to the Company’s operations.
(h) IFRIC 15 “Agreements for the Constriction of Real Estate”, (effective from January 1st, 2009):
This interpretation addresses the diversity in accounting for real estate sales. Some entities recognize revenues
in accordance with IAS 18 (i.e. when risks and rewards in the real estate are transferred) and others recognize
revenue as the real estate is developed in accordance with IAS 11. The interpretation clarifies which standard
should be applied to particular. This interpretation is not applicable to the Company’s activities.
(i) IFRIC 16 “Hedges on a Net Investment in a Foreign Operation”, (effective for annual periods beginning on
or after 1st October 2008):
This interpretation applies to an entity that hedges the foreign currency risk arising from its net investments in
foreign operations and qualifies for hedge accounting in accordance with IAS 39. The interpretation provides
guidance on how an entity should determine the amounts to be reclassified from equity to profit of loss for both
the hedging instrument and the hedged item. This interpretation is not applicable to the Company’s activities.
(j) IFRIC 18: “Transfers of Assets from Customers”, (effective for annual periods beginning on or after 1st July 2009):
IFRIC 18 is aimed at clarifying the requirements of IFRSs pertaining to agreements under which an entity
receives from a client a segment of fixed assets that the entity shall use either when a client constitutes a part
of a network or a client shall obtain constant access to provision of goods or services (such as, for instance,
provision of electricity or water). The IFRIC is applied mainly to utility entities and is not applicable to the
Company’s activities.
MARFIN FACTORS & FORFAITERS
ANNUAL REPORT 2009
13

(ii) New standards, amendments and interpretations that are not yet effective
(a) IFRS 3: “Business Combinations” (Revised) and IAS 27 “Consolidated and Separate Financial Statements”
(Amended), (effective for annual periods beginning on or after 1st July 2009)
The revised IFRS introduces a number of changes in the accounting for business combination which will impact
the amount of goodwill recognized, the reported results in the period that an acquisition occurs, and future
reported results. Such changes include the expensing of acquisition related costs and recognizing subsequent
changes in fair value of contingent consideration in the profit and loss. The amended IAS 27 requires that a
change in ownership interest of a subsidiary to be accounted for as an equity transaction. Furthermore the
amended standard changes the accounting for losses incurred by the subsidiary as well as the loss of control of
a subsidiary. The adoption of the revised standards will have no significant impact on the Company’s financial
statements.
(b) IFRS 9: “Financial Instruments”, (effective for annual periods beginning on or after 1st January 2013)
IFRS 9 is the first part of Phase 1 of the Board’s project to replace IAS 39. The IASB intends to expand IFRS 9
during 2010 to add new requirements for classifying and measuring financial liabilities, derecognition of
financial instruments, impairement and hedge accounting. IFRS 9 states that financial assets are initially
measured at fair value plus, in the case of a financial asset not a fair value through profit and loss, particular
transaction costs. Subsequently financial assets are measured at amortised cost or fair value and depend on the
basis of the entity’s business model for managing the financial assets and the contractual cash flows
characteristics of the financial assets.
IFRS 9 prohibits reclassifications except in rare circumstances, when the entity’s business model changes. In
this case, the entity is required to reclassify affected financial assets prospectively. IFRS 9 classification
principles indicate that all equity investments, should be measured at fair value.
However management has the option to present in other comprehensive income unrealized and realized fair
value gains and losses on equity investments that are not held for trading. Such designation is available on initial
recognition on an instrument-by –instrument basis and is irrevocable. There is no subsequent recycling of fair
value gains and losses to profit and loss: however dividends from such investments will continue to be
recognized in profit and loss. IFRS 9 removes the cost excemption for unquoted equities and derivatives on
unquoted equities but provides guidance on when cost may be an appropriate estimate of fair value. IFRS 9 can
not be early adopted, as it has not been endorsed by the E.U.
(c) IFRIC 17 ”Distribution of Non-Cash Assets to Owners”, Owners (effective for annual periods beginning on
or after 1st July 2009.
When an entity announces distribution of non-cash assets to owners, it shall recognize a liability for the
distributed dividends. The Interpretation provides guidelines pertaining to when an entity shall recognize
dividends payable, how they shall be measured and how it shall account for the difference between the carrying
amount of distributed assets and the carrying amount of the dividends paid in case the entity settles dividends
payment. The Interpretation is not applicable to the Company’s activities.
MARFIN FACTORS & FORFAITERS
ANNUAL REPORT 2009
14
7.4 EstimatesThe preparation of the financial statements in conformity with IFRS requires management to make judgments,
estimates and assumptions that affect the reported amount of assets and liabilities, income and expenses. Actual
results may differ from these estimates.
The estimates and associated assumptions are based on historical experience and various other factors that are
believed to be reasonable under the circumstances, the results of which form the basis of making judgments
about carrying values of assets and liabilities that are not readily apparent from other sources.
The estimates and underlying assumptions are reviewed on an ongoing basis. Deviations to accounting estimates
are recognized in the period in which the estimate is revised if the revision effects only that period, or in the
period of the revision and future periods if the revision affects both the current and future periods.
MARFIN FACTORS & FORFAITERS
ANNUAL REPORT 2009
15

The basic accounting principles that were adopted for the preparation of financial statements are as follows:
8.1 Foreign currency transactionsTransactions in foreign currencies are translated to Euro the reporting currency at the foreign exchange rate ruling
at the date of the transaction.
Monetary assets and liabilities denominated in foreign currencies, at the balance sheet date are translated to
Euro at the foreign exchange rate ruling at that date. Foreign exchange differences arising on translation are
recognized in the income statement.
Foreign exchange income and expense from the consolidation of the branch office do not significantly affect the
financial statements.
8.2 Investments in Financial Insruments
(a) Loans and advance to customers
i. Classification
The Company’s financial assets are classified into two categories which are “Advances to Factoring clients” and
“Forfaiting portfolio”.
“Advances to Factoring clients” consist of two subcategories, “Recourse Factoring” and “Non-recourse
Factoring”.
ii. Recognition
Advances are recognized whenever cash is disbursed to the beneficiates of such credit.
iii. Initial Measurement
Financial assets are measured initially at fair value plus transaction costs.
iv. Measurement after the initial
After the initial measurement the financial assets are measured at amortized cost using the effective rate
method.
v. Derecognition
A financial asset is derecognized when the Company loses control on contractual rights that comprise the
financial instrument. This occurs when the rights to receive cash flows from these have been executed, or when
the company has transferred substantially all the risks and rewards of the assets.
8.3 Property, Plant and EquipmentProperty, plant and equipment are stated at cost less accumulated depreciation and accumulated impairment
losses. Depreciation is charged to the income statement on a straight-line basis over the estimated useful lives
of property, plant and equipment. Land is not depreciated.
MARFIN FACTORS & FORFAITERS
ANNUAL REPORT 2009
16
Basic Accounting Principles8.
The estimated useful lives are as follows:
Improvements on non owned properties: over the duration of the lease contract or the estimated
useful life, whichever is the shortest
Furniture and other equipment: 5 years
Computer hardware and software: 3-4 years
Transportation means: 6-7 years
Property, plant and equipment are reviewed for impairment whenever events or changes in circumstances
indicate that the carrying amount at cost may not be recoverable. An asset’s carrying amount is written down
immediately to its recoverable amount if the asset’s carrying amount is greater than its estimated recoverable
amount. The recoverable amount is the higher of the asset’s fair value less costs to sell and value in use.
Subsequent costs are included in the assets carrying amount or recognized as a separate asset, as appropriate
only when it is probable that future economic benefits associated with the item will flow to the Company, and
their cost can be measured reliably. Repairs and maintenance are charged to the income statement during the
financial period in which they take place.
Gains and losses on disposals are determined by comparing proceeds with carrying amounts. These are included
in the income statement.
8.4 Intangible assetsIntangible assets include Company’s software and are stated at cost less accumulated depreciation and
accumulated impairment losses.
Amortization is charged to the income statement on a straight-line basis over the estimated useful life of the
software, which is between 3 to 4 years.
8.5 Cash and cash equivalentsCash and cash equivalents include monetary assets with an original maturity of three months or less, such as
cash balance and amounts due from financial institutions.
8.6 Impairment of financial assetsThe Company assesses at each balance sheet date whether there is objective evidence that a financial asset or
group of financial assets is impaired. A financial asset or group of financial assets is impaired and impairment
losses are incurred and only, and only if there is objective evidence of impairment as a result of one or more
events that occurred after the initial recognition of the asset (a ‘loss event’) and that loss event (or events) has
an impact on the estimated future cash flows of the financial asset or group of financial assets that can be
reliably estimated. Objective evidence that a financial asset or group of assets is impaired includes data that
comes to the attention of the Company about the following loss events:
MARFIN FACTORS & FORFAITERS
ANNUAL REPORT 2009
17

i. Significant financial deterioration of the issuer or obligator;
ii. A breach of contract, such as a default or delinquency in meeting payments;
iii. Strong probability that the borrower will enter bankruptcy stage or other financial restructuring;
iv. Observable data indicating that there is a measurable decrease in the estimated future cash flows
from a group of financial assets since the initial recognition of those assets, although the decrease
cannot yet be identified with the individual financial assets in the group, including:
adverse changes in the payment status of customers; or
national or local economic conditions that correlate with defaults on the assets in a group.
If there is objective evidence that an impairment loss on factoring advances carried, the amount of the loss is
measured as the difference between the assets' carrying amount and the present value of estimated future cash
flows (excluding future credit losses that have already been incurred) discounted at the financial asset's original
effective interest rate. The carrying amount of the asset is reduced through the use of an allowance account and
the amount of the loss is recognized in the income statement. If the factoring advance has a floating interest
rate, the discount rate for measuring any impairment loss is the current effective interest rate determined under
the contract.
The calculation of the present value of the estimated future cash flows of a collateralised financial asset reflects
the cash flows that may result from foreclosure less costs for obtaining and selling the collateral, in case the
foreclosure cannot be carried out.
If, in a subsequent period, the amount of the impairment loss decreases and the decrease can be related
objectively to an event occurring after the impairment was recognized, the previously recognized impairment loss
is reversed by adjusting the allowance account. The amount of the reversal is recognized in the income
statement.
When an advance or receivables is uncollectable, it is written off against the related provision for
advance/receivable impairment. Such advances or receivables are written off after all the necessary procedures
have been completed and the amount of the loss has been determined. Subsequent recoveries of amounts
previously written off are recognized in the income statement.
8.7 Financial liabilitiesFinancial liabilities are measured initially at fair value plus transaction costs. Subsequently they are stated at
amortized cost which occurs by the use of the effective interest method. Any difference between the initial
proceeds and the redemption value is recognized in the income statement, using the effective interest method.
Due to banks, obligations to customers (Non-Recourse Factoring Liabilities) and debt securities in issue are
classified in this category.
MARFIN FACTORS & FORFAITERS
ANNUAL REPORT 2009
18

8.8 Employee benefitsShort-term benefits: Short-term benefits to personnel (except for termination of employment benefits) in cash
and kind are recognized as an expense when considered accrued. Any unpaid amount is recognized as a liability,
whereas in case the amount already paid exceeds the benefits’ amount, the entity identifies the excessive
amount as an asset (prepaid expense) only to the extent that the prepayment shall lead to a future payments’
reduction or refund.
Retirement Benefits: Benefits following termination of employment include lump-sum severance grants, pensions
and other benefits paid to employees after termination of employment in exchange for their service. The
Company’s liabilities for retirement benefits cover both defined contribution schemes and defined benefit plans.
i) Defined contribution plans
For defined contribution plans, the Company pays contributions to publicly administered pension insurance
funds (i.e. Social Security Foundation) and therefore the Company has no obligation to pay further contributions
if the fund does not hold sufficient assets to pay all employees the benefits relating to pension obligations. The
regular contributions constitute net periodic costs for the year in which they are due and as such they are
included in line 'staff costs' of the Income Statement.
ii) Defined benefit plans
The Company’s defined benefit plan regards the legal commitment to pay lump-sum severance grant, pursuant
to L.2112/1920. Typically defined benefit plans define an amount of pension benefit that an employee will
receive on retirement, usually dependent on one or more factors such as years of service and compensation. The
liability recognized in the balance sheet for defined benefit plans is the present value of the liability for the
defined benefit less the plan assets’ fair value (reserve from payments to an insurance company), the changes
deriving from any actuarial profit or loss and the service cost. The defined benefit commitment is calculated on
an annual basis by an independent actuary with the use of the projected unit credit method.
The present value of the liability which incurs from the defined benefit plan is calculated by discounting the
future cash outflows with the long-term Greek bonds’ rate.
Actuarial profits and losses form part of the Company’s commitment to grant the benefit and of the expense
which shall be recognized in the income statement. The adjustments’ outcome based on historical data, if below
or above a 10% accumulated liability margin, is recognized in the income statement within the expected
insurance period of the plan’s participants. The service cost is directly recognized in the income statement except
for the case where plan’s changes depend on employees’ remaining years of service. In such a case, the service
cost is recognized in the income statement using the fixed method during the maturity period.
Employment Termination Benefits: Benefits due to employment termination are paid when employees step
down prior to the retirement date. The Company recognizes these benefits upon committing itself that it
terminate employees’ employment according to a detailed plan for which there is no withdrawal possibility.
Remuneration based on Equity Instruments: The Group, through the Parent Company Marfin Popular Bank,
grants the personnel stock options for the acquisition of Parent Company shares. These benefits are settled by
issuing new shares from the Parent Company, on the condition that the employee fulfils certain vesting
conditions linked to his/her performance and exercises his/her options.
Services rendered by employees are measured according to the fair value of the options granted on the grant
MARFIN FACTORS & FORFAITERS
ANNUAL REPORT 2009
19

date. Option fair value is calculated by using a widely accepted option-pricing model and taking into account
the share’s closing price on grant date. Options’ fair value, following their issue, is readjusted in case there is a
modification in the plan favorable for employees. Employees’ services residual value is recognized as an expense
in the income statement by equal credit amount Èn equity, in the share premium account. The relative amount
is divided throughout the vesting period and is calculated on the basis of the number of options set to vest in
each year.
8.9 ProvisionsProvisions are recognized when the Company has a present legal or constructive obligation as a result of past
events, it is probable that an outflow of resources embodying economic benefits will be required to settle the
obligation, and reliable estimates of the amount of the obligation can be made.
Contingent liabilities that cannot possibly incur cash flows are also disclosed, unless they are immaterial.
8.10 Leased agreementsFinancial assets and liabilities are offset and the net amount is reported in the balance sheet when there is a
legally enforceable right to offset the recognized amounts and there is an intention to settle on a net basis, or
realize the asset and settle the liability simultaneously. Offsetting income with expenses is allowed only if they
are part of the same entry.
8.11 Offsetting financial instrumentsFinancial assets and liabilities are offset and the net amount is reported in the balance sheet when there is a
legally enforceable right to offset the recognized amounts and there is an intention to settle on a net basis, or
realize the asset and settle the liability simultaneously. Offsetting income with expenses is allowed only if they
are part of the same entry.
8.12 Interest income and expensesInterest income and expense is recognized in the income statement on an accrual basis for all interest-bearing
instruments, using the effective interest method. The effective interest rate is the one that discounts exactly the
estimated future cash inflows or outflows during the estimated life of the financial instrument or, wherever
deemed appropriate, during a shorter period, on the basis of the net carrying value of the financial asset or
liability. In order to calculate the effective rate, cash flow estimation takes into account the terms of the financial
instrument agreement, but not any future losses from credit risk.
Calculation includes the fees and the basis points paid or collected by the contracting parties and which
constitute an integral part of the effective interest rate, transaction costs, and other premiums and discounts.
MARFIN FACTORS & FORFAITERS
ANNUAL REPORT 2009
20

8.13 Fees and commisionsFee and commission income are recognized on an accrual basis when the relevant service has been provided
unless they influence the effective interest rate.
8.14 Net trading incomeNet trading income comprises gains less losses related to Factoring receivables.
8.15 Income Tax and Deferred TaxThe income tax charge involves current taxes, deferred ones and the differences of preceding financial years’ tax audit.
Income tax is recognized in the financial year’s income statement, except for the tax on transactions recognized
directly in equity, in which case it is recognized accordingly to equity. To assess the annual tax charge, all the
required adjustments on the accounting result are taken into account in order to establish the final taxable
income.
The current income taxes include short-term liabilities or claims vis-à-vis fiscal authorities pertaining to the
payable taxes on the year’s taxable income and any additional income taxes regarding previous financial years.
Current taxes are measured on the basis of tax rates and fiscal regulations in force during the corresponding
financial years, based on the yearly taxable profit.
Deferred taxes are the taxes or the tax relieves from the financial encumbrances or benefits of the financial year
in question, which have been allocated or shall be allocated to different financial years by tax authorities.
Deferred income tax is provided by using the liability method which is determined by the temporary differences
arising between the tax bases of assets and liabilities and their carrying amounts in the financial statements.
However, the deferred income tax is not accounted for if it arises from initial recognition of an asset or liability
in a transaction other than a business combination that at the time of the transaction affects neither accounting
nor taxable profit or loss.
Deferred tax assets and liabilities are measured at the tax rates that are expected to apply to the period when
the asset is realized or the liability is settled, based on tax rates (and tax laws) that have been enacted or
substantively enacted by the balance sheet date. In case it is not possible to clearly determine the time needed
to invert the temporary differences, the tax rate to be applied is the one in force on the financial year after the
balance sheet date.
Deferred income tax assets are recognized to the extent that it is probable that future taxable profit will be
available against which the temporary differences can be utilized.
Most of the changes in the deferred tax assets or liabilities are identified as a part of tax charges in the income
statement.
8.16 Share CapitalOrdinary shares are classified as equity. Incremental costs directly attributable to the issue of new shares or
options are shown in equity as a deduction, free of tax, from the proceeds.
MARFIN FACTORS & FORFAITERS
ANNUAL REPORT 2009
21

The preparation of financial statements in accordance with the I.F.R.S. requires estimates and assumptions
being made by Management during the implementation of the Company’s accounting policies.
The following areas are affected by Management’s estimates and assumptions:
Impairement of Financial assetsFinancial assets and liabilities fair value calculation for which there are no published market prices requires the
use of specific measurement techniques. Fair value calculation calls for various kinds of assessments. The most
important ones involve assessment of various risks an instrument is subject to, such as credit risk, interest rate
risk, currency risk etc.
In the following part the segments in which estimates and assumptions by Management have a significant effect
are assessed:
a. Credit risk provisions
The Company continuously examines total Factoring advances and receivables and Forfaiting prepaid receivables
in order to decide whether their value is impaired or not.
This decision requires an exercise of significant judgment, through which the Company assesses, along with
other factors, whether a fair value of an asset is below cost, a fact that constitutes an objective evidence of
impairment.
b. Estimates on fair value of financial instruments
Financial assets and liabilities fair value calculation for which there are no published market prices requires the
use of specific measurement techniques. Fair value calculation calls for various kinds of assessments. The most
important ones involve assessment of various risks an instrument is subject to, such as credit risk, interest rate
risk, currency risk etc.
c. Defined benefit plans
The liability recognized in the balance sheet for defined benefit plans is the present value of the liability for the
defined benefit less the plan assets’ fair value (reserve from payments to an insurance company), the changes
deriving from any actuarial profit or loss and the service cost. The defined benefit commitment is calculated on
an annual basis by an independent actuary with the use of the projected unit credit method.
d. Income Tax
The Company is subject to income tax in the countries in which it operates. In order to establish the current and
deferred tax, as presented in the balance sheet, significant assumptions are required. For specific transactions
and calculations the ultimate tax determination is uncertain. The Company recognizes liabilities for anticipated
tax issues based on estimates of whether additional taxes will be due. Where the final tax outcome of these
matters is different from the amounts that were initially recorded, such differences will impact the income tax
and deferred tax provisions in the period in which such determination is made.
MARFIN FACTORS & FORFAITERS
ANNUAL REPORT 2009
22
Management estimations & assumptions9.
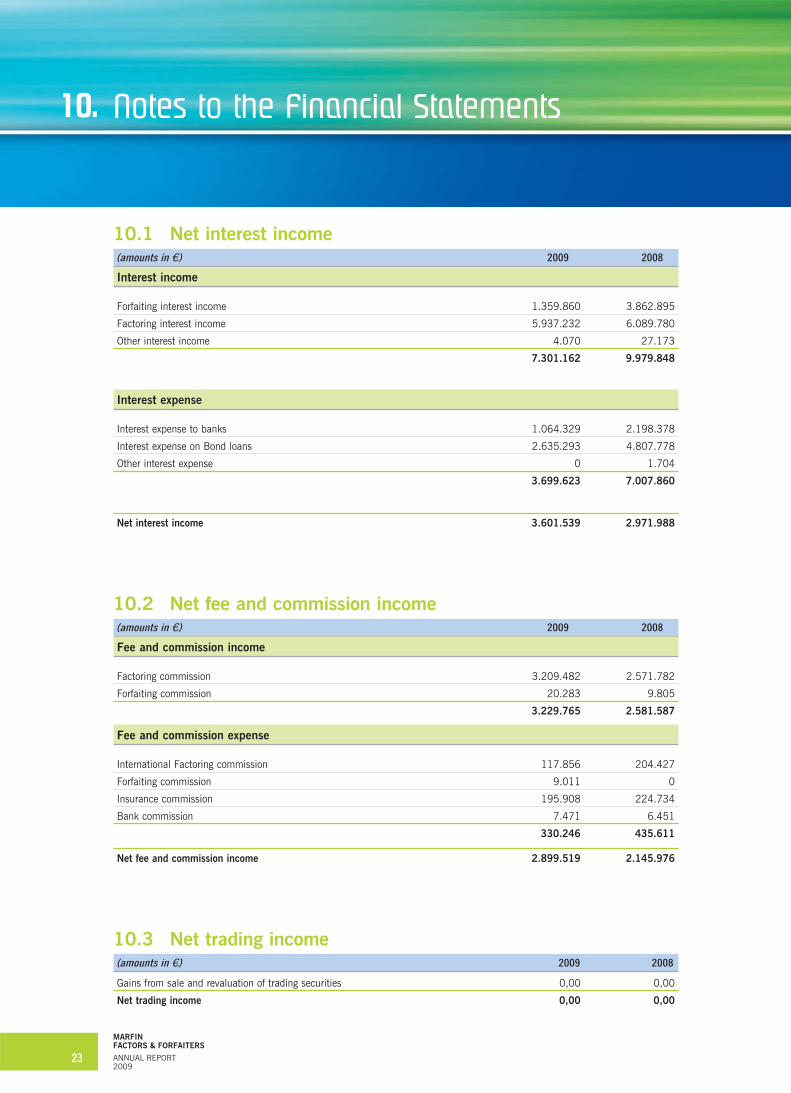
10.1 Net interest income(amounts in ú) 2009 2008
Interest income
Forfaiting interest income 1.359.860 3.862.895
Factoring interest income 5.937.232 6.089.780
Other interest income 4.070 27.173
7.301.162 9.979.848
Interest expense
Interest expense to banks 1.064.329 2.198.378
Interest expense on Bond loans 2.635.293 4.807.778
Other interest expense 0 1.704
3.699.623 7.007.860
Net interest income 3.601.539 2.971.988
10.2 Net fee and commission income(amounts in ú) 2009 2008
Fee and commission income
Factoring commission 3.209.482 2.571.782
Forfaiting commission 20.283 9.805
3.229.765 2.581.587
Fee and commission expense
International Factoring commission 117.856 204.427
Forfaiting commission 9.011 0
Insurance commission 195.908 224.734
Bank commission 7.471 6.451
330.246 435.611
Net fee and commission income 2.899.519 2.145.976
10.3 Net trading income(amounts in ú) 2009 2008
Gains from sale and revaluation of trading securities 0,00 0,00
Net trading income 0,00 0,00
MARFIN FACTORS & FORFAITERS
ANNUAL REPORT 2009
23
Notes to the Financial Statements10.

10.4 Other income-expenses(amounts in ú) 2009 2008
Foreign exchange differences -94.542 33.072
Forfaiting trading income 24.118 44.373
Other income 34.801 33.527
Other Income -32.623 110.972
10.5 Staff costs(amounts in ú) 2009 2008
Wages and salaries -1.327.977 -1.278.946
Defined benefit plan expense – Social security contributions -271.380 -247.642
Employee benefits -219.364 -470.557
Provision for post employment benefits -12.678 -12.684
Stock options plan expense -43.337 -55.812
Employee insurance expenses -25.952 -26.908
Vehicle leases -64.786 -62.186
Other expenses -93.903 -52.823
Staff costs -2.059.377 -2.207.557
The number of employees as at the end of the year was 41 (2008: 41)
Some 2008 figures have been reclassified for comparability reasons, having however no significant effect on
financial statements or accounts presented above.
Share based payments
In May, 2007 the Management of the parent company Marfin Popular Bank prepared a stock option provision
plan to the employees of all the companies of the Group, based on the as at 5/4/07 decision of the Extraordinary
General Assembly of its shareholders. Based on the criteria that were established, the options in question are
provided gradually within the five year period of 2007-2011. The Options with an exercise price of ú 10 on the
parent company’s shares and maturity date December 15, 2011 can be exercised by the holders during the
years 2007 to 2011.
The fair value of the options provided to the personnel has been measured as at the provision date based on the
estimation model of Black & Scholes from specialists of the parent Company MARFIN EGNATIA BANK S.A.
The employees of Marfin Factors & Forfaiters can exercise these options, if they want to. During this annual
period no option was exercised.
The total fair value of all the options provided that burden the results of the year 2009, was computed as that
of ú 43.337,04 (2008: ú 55.812,00).
MARFIN FACTORS & FORFAITERS
ANNUAL REPORT 2009
24
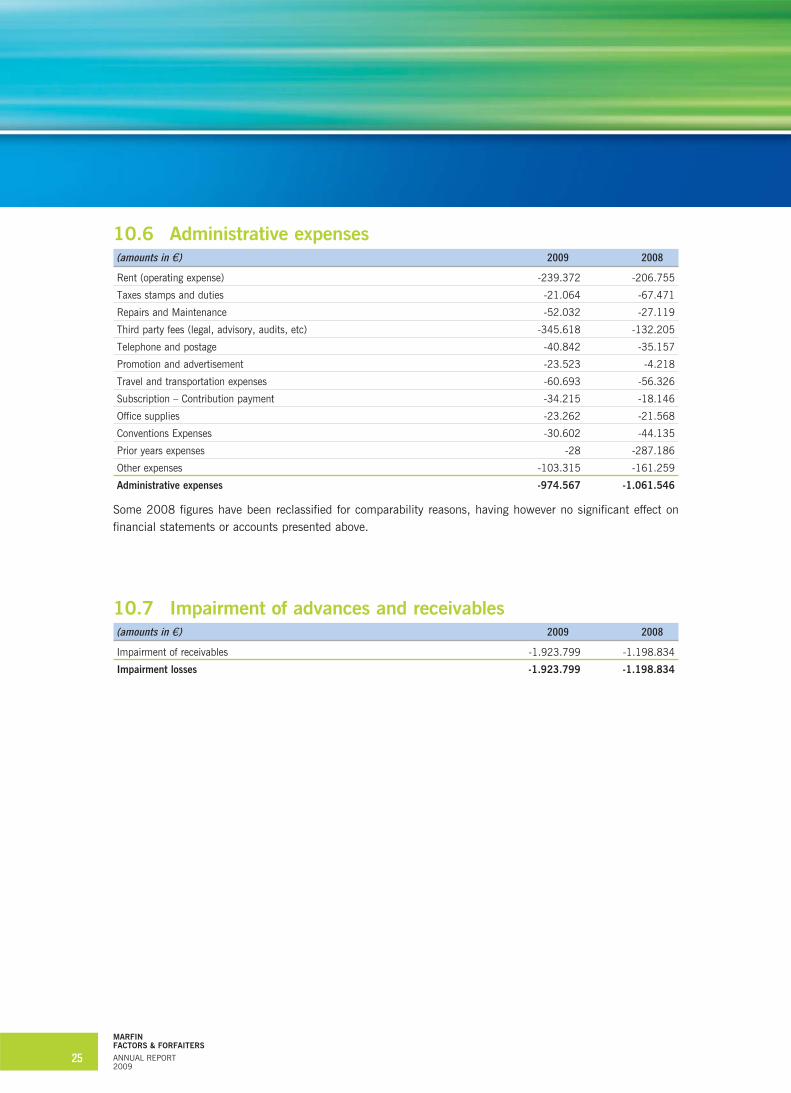
10.6 Administrative expenses(amounts in ú) 2009 2008
Rent (operating expense) -239.372 -206.755
Taxes stamps and duties -21.064 -67.471
Repairs and Maintenance -52.032 -27.119
Third party fees (legal, advisory, audits, etc) -345.618 -132.205
Telephone and postage -40.842 -35.157
Promotion and advertisement -23.523 -4.218
Travel and transportation expenses -60.693 -56.326
Subscription – Contribution payment -34.215 -18.146
Office supplies -23.262 -21.568
Conventions Expenses -30.602 -44.135
Prior years expenses -28 -287.186
Other expenses -103.315 -161.259
Administrative expenses -974.567 -1.061.546
Some 2008 figures have been reclassified for comparability reasons, having however no significant effect on
financial statements or accounts presented above.
10.7 Impairment of advances and receivables(amounts in ú) 2009 2008
Impairment of receivables -1.923.799 -1.198.834
Impairment losses -1.923.799 -1.198.834
MARFIN FACTORS & FORFAITERS
ANNUAL REPORT 2009
25

10.8 Taxes(amounts in ú) 2009 2008
Income Tax -511.689 -289.920
Prior years income Tax -174.292 -28.764
Deferred tax 37.747
Income tax -685.982 -280.937
The information concerning the deferred tax is provided in note 10.15.
The reconciliation of the effective tax rate is as follows:
(amounts in ú) % 2009 % 2008
Profits before tax 1.407.917 641.685
Tax based on tax rate 25% -351.979 25% -160.421
Not deductable expenses 11% -159.710 19% -120.516
Prior years income Tax 12% -174.292
Income tax 49% -685.982 44% -280.937
In Greece, the results reported to the tax authorities by an entity are provisional and subject to revision until
such time as the tax authorities examine the books and records of the entity and the related tax returns are
accepted as final. Therefore entities remain contingently liable for additional taxes and penalties, which may be
assessed upon such examination.
10.9 Cash and cash equivalents(amounts in ú) 2009 2008
Deposits in Banks 3.342.238 1.681.240
Cash 210 190
Cash and cash equivalents 3.342.448 1.681.430
MARFIN FACTORS & FORFAITERS
ANNUAL REPORT 2009
26

10.10 Cash advances to Factoring customers(amounts in ú) 2009 2008
Building and Construction companies 857.633 1.628.213
Manufacturing companies 26.710.431 25.188.667
Commercial companies 139.207.884 128.844.828
Services companies 9.928.030 11.911.959
Shipping and Maritime companies 3.681 2.145.420
Agriculture 36.707.995
Transportation 9.854.476
Other 19.223.355 6.853.223
Total Advances to customers 242.493.487 176.572.310
Less: Impairment loss 2.014.421 3.844.596
Advances to customers 240.479.066 172.727.714
Provisions account movements
(amounts in ú) 2009 2008
Balance brought forward 3.844.596 3.202.883
Impairment 1.218.000 1.198.834
Recovered amounts -139.201
Write-off -2.908.975 -557.120
Balance as at 31/12/2009 2.014.421 3.844.596
(amounts in ú) 2009 2008
Short-term advances 241.415.529 175.874.421
Long-term advances 1.077.958 697.889
242.493.487 176.572.310
MARFIN FACTORS & FORFAITERS
ANNUAL REPORT 2009
27

10.11 Non recourse FactoringFactored receivables without recourse are trade receivables that the Company has purchased from third parties
(customers/sellers) during its ordinary course of operation. The Company manages the whole account and
collects these receivables from the various buyers, without however having the right of recourse to the seller, in
the case that the buyer has a financial inability to meet his debt. The respective amounts and their analysis for
the financial period ended at December 31st 2009 and December 31st 2008 are shown in the following table.
(amounts in ú) 2009 2008
Domestic non recourse Factoring 4.460.184 8.533.193
Imported non recourse Factoring 8.260.076 5.808.918
Total 12.720.260 14.342.111
(amounts in ú) 2009 2008
Short-term accounts 12.720.260 14.342.111
Long-term accounts - -
12.720.260 14.342.111
10.12 Forfaiting Portfolio(amounts in ú) 2009 2008
Forfaiting advances to customers 8.805.630 42.114.078
Forfaiting advances to customers under revision for impairement 11.708.318
Total Forfaiting Portfolio 20.513.948 42.114.078
Less: Impairment loss 845.000
Total Forfaiting Portfolio 19.668.948 42.114.078
Provisions account movements
(amounts in ú) 2009 2008
Balance brought forward
Impairment 845.000
Write-off
Balance as at 31/12/2009 845.000 0
(amounts in ú) 2009 2008
Short-term amounts 6.541.678 20.553.415
Long-term amounts 13.972.270 21.560.663
20.513.948 42.114.078
MARFIN FACTORS & FORFAITERS
ANNUAL REPORT 2009
28

Forfaiting is a form of an export trading credit in which the Forfaiter purchase assets from the exporter, without
recourse, at 100% of its value, at full discount. Under the Forfaiting agreement, the exporter, or a Forfaiter sells
to MARFIN Factors & Forfaiters a trade receivable evidenced by a commercial drafts, such as Bill of Exchange,
Promissory Note and Letter of Credit, usually accompanied by a bank guarantee for the foreign buyer. The seller
is only responsible for the actual existence of the transaction. These receivables have a medium-long term
maturity (from 6 months up to 5 years) and can be exchanged between Forfaiting companies in the secondary
market. The total value of the forfaiting assests on the 31st of December 2009 amounted ú 19.668.947,70
while in 2008 the respective value was ú 42.114.077,95.
Forfating receivables under impairment include receivable from banks in Kazakhstan for which an international
effort for debt restructuring is in process. The debt restructuring negotiations are expected to finalize within the
first half of 2010. Upon completion of the process, the aforementioned receivables are expected to be
substituted with a new set of assets that could not be defined at the time of preparation of the financial
statements. The impairment test of the aforementioned receivables has been performed with the information
available and according to management estimates until the date of the publication of the financial statements.
MARFIN FACTORS & FORFAITERS
ANNUAL REPORT 2009
29

10.13 Intangible Assets(amounts in ú) Software Total
Acquisition Cost
Balance as at 1 January, 2008 484.261 484.261
Additions 28.417 28.417
Disposals
Balance as at 31 January, 2008 512.678 512.678
Acquisition Cost
Balance as at 1 January, 2009 512.678 512.678
Additions 47.200 47.200
Disposals
Balance as at 31 January, 2009 559.878 559.878
Accumulated amortization
Balance as at 1 January, 2008 440.538 440.538
Amortization 21.648 21.648
Disposals - -
Balance as at 31 January, 2008 462.186 462.186
Accumulated amortization
Balance as at 1 January, 2009 462.186 462.186
Amortization 24.650 24.650
Disposals - -
Balance as at 31 January, 2009 486.836 486.836
Carrying amounts
As at 1 January, 2008 43.723 43.723
As at 31 January, 2008 50.492 50.492
As at 1 January, 2009 50.492 50.492
As at 31 January, 2009 73.042 73.042
MARFIN FACTORS & FORFAITERS
ANNUAL REPORT 2009
30

10.14 Property, Plant and Equipment(amounts in ú) Improvements Furniture PPE
on third party and construction
property equipment projects Other Total
Acquisition Cost
Balance as at 1 January, 2008 352.992 291.038 476 4.610 649.116
Additions - 40.331 1.863 29.804 71.997
Disposals - - - - -
Balance as at 31 January, 2008 352.992 331.368 2.339 34.414 721.114
Acquisition Cost
Balance as at 1 January, 2009 352.992 331.368 2.339 34.414 721.114
Additions - 1.884 3.862 0 5.746
Disposals - - - - -
Balance as at 31 January, 2009 352.992 333.253 6.201 34.414 726.860
Depreciation
Balance as at January 1, 2008 20.828 178.138 - 173 199.140
Annual depreciation 39.074 54.225 - 3.175 96.474
Decreases -
Balance as at 31 December, 2008 59.902 232.363 - 3.348 295.614
Depreciation
Balance as at January 1,2009 59.902 232.363 - 3.348 295.614
Annual depreciation 39.074 34.385 - 4.665 78.124
Decreases -
Balance as at 31 December, 2009 98.976 266.748 0 8.013 373.738
Amounts in the Balance Sheet
As at 1 January, 2008 332.164,17 112.899,26 476,30 4.437,13 449.976,86
As at 31 December, 2008 293.090,13 99.005,08 2.339,30 31.065,67 425.500,18
As at 1 January, 2009 293.090,13 99.005,08 2.339,30 31.065,67 425.500,18
As at 31 December, 2009 254.016,09 66.504,37 6.201,00 26.400,27 353.121,73
MARFIN FACTORS & FORFAITERS
ANNUAL REPORT 2009
31
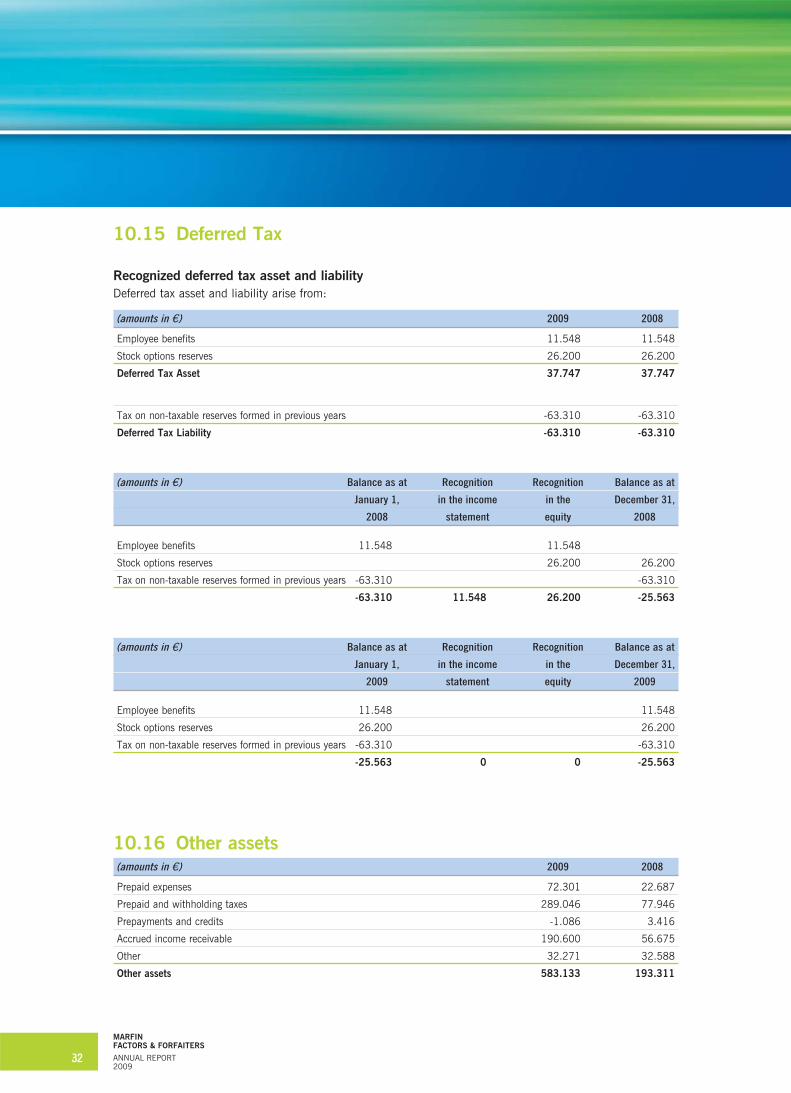
10.15 Deferred Tax
Recognized deferred tax asset and liability
Deferred tax asset and liability arise from:
(amounts in ú) 2009 2008
Employee benefits 11.548 11.548
Stock options reserves 26.200 26.200
Deferred Tax Asset 37.747 37.747
Tax on non-taxable reserves formed in previous years -63.310 -63.310
Deferred Tax Liability -63.310 -63.310
(amounts in ú) Balance as at Recognition Recognition Balance as at
January 1, in the income in the December 31,
2008 statement equity 2008
Employee benefits 11.548 11.548
Stock options reserves 26.200 26.200
Tax on non-taxable reserves formed in previous years -63.310 -63.310
-63.310 11.548 26.200 -25.563
(amounts in ú) Balance as at Recognition Recognition Balance as at
January 1, in the income in the December 31,
2009 statement equity 2009
Employee benefits 11.548 11.548
Stock options reserves 26.200 26.200
Tax on non-taxable reserves formed in previous years -63.310 -63.310
-25.563 0 0 -25.563
10.16 Other assets(amounts in ú) 2009 2008
Prepaid expenses 72.301 22.687
Prepaid and withholding taxes 289.046 77.946
Prepayments and credits -1.086 3.416
Accrued income receivable 190.600 56.675
Other 32.271 32.588
Other assets 583.133 193.311
MARFIN FACTORS & FORFAITERS
ANNUAL REPORT 2009
32

10.17 Due to banks(amounts in ú) 2009 2008
Due to banks 112.933.367 75.120.434
Total liabilities 112.933.367 75.120.434
The Company’s liabilities to Banks refer to the Company’s liabilities to the parent company, Marfin Egnatia Bank.
10.18 Dept securities in issue and other borrowed funds(amounts in ú) 2009 2008
Bonds 132.633.625 126.256.449
Dept securities in issue and other borrowed funds 132.633.625 126.256.449
The Company has contracted six bond loans, three of which (A-C) with its parent company Marfin Egnatia Bank
and the other three (D-F) with its parent company Marfin Egnatia Bank and IBG.
A) A bond amounting to EUR 18,000,000 was issued on December, 2006. It has an interest
rate based on a three-month Euribor (3M) (Year average 1,225%) and maturity three years.
It has been fully paid off during 2009.
B) A bond amounting to Euro 40,000,000 was issued on August, 2007. It has an interest rate
of one-month Euribor (1M) (Year average 0,894%) and maturity two years. It has been fully
paid off during 2009.
C) A bond amounting to USD 13,740,000 was issued on August 2007. It has an interest rate
of one-month Libor/USD (1M) (Year average 0,334%) and maturity two years. It has been
fully paid off during 2009.
D) A bond amounting to EUR 50.000.000 was issued on May, 2008. It has an interest rate of
one-month Euribor (1M) (Year average 0,894%) and maturity two years.
E) A bond amounting to USD 20.000.000 was issued on December, 2008. During 2009
another USD 10.000.000 were added to the existing USD 20.000.000,00. It has an interest
rate of one-month Libor/USD (1M) (Year average 0,334%) and maturity two years. In 2009
the Company paid off USD 18.200.000,00. The effective exchange rate on December 31,
2008 was (1,4406) and the bond was measured at EUR 12.633.624,88.
F) A bond amounting to EUR 70.000.000 was issued on March 2009. It has an interest rate
of one-month Euribor (1M) (Year March-December 0,7%) and maturity two years.
MARFIN FACTORS & FORFAITERS
ANNUAL REPORT 2009
33

10.19 Factoring liabilities The liabilities to customers refer to the Company’s obligations of the third parties, due to its ordinary course of
operation. Such liabilities have been created by the purchase of receivables for which the Company has the right
to manage and collect from the buyer, without however having the right to pursue collection from the seller in
the case that the buyer is unable to pay his debt. The respective amounts and their analysis for the financial
period ended at December 31st 2009 and December 31st 2008 are shown in the following table.
(amounts in ú) 2009 2008
Domestic non recourse Factoring 5.140.343 8.533.193
Imported non recourse Factoring 8.473.032 5.808.918
Domestic recourse Factoring 241.440
Domestic recourse Factoring 215.690
Total 14.070.505 14.342.111
(amounts in ú) 2009 2008
Short-term amounts 14.070.505 14.342.111
Long-term amounts - -
14.070.505 14.342.111
10.20 Provision for post-employment benefits(amounts in ú) 2009 2008
Obligation as at 1st January 46.190 31.802
Expenses recognized in income statement 12.659 14.388
Obligation as at December 31st 58.849 46.190
(amounts in ú) 2009 2008
Expenses recognized in income statement
Service costs (payroll and staff cost) 10.393 12.684
Interest and related expenses 2.285 1.704
12.678 14.388
Principal actuarial assumptions used for 2009 and 2008 were as follows:
2009 2008
Discount rate 5.50% 5.50%
Salary increases 4.00% 4.00%
MARFIN FACTORS & FORFAITERS
ANNUAL REPORT 2009
34
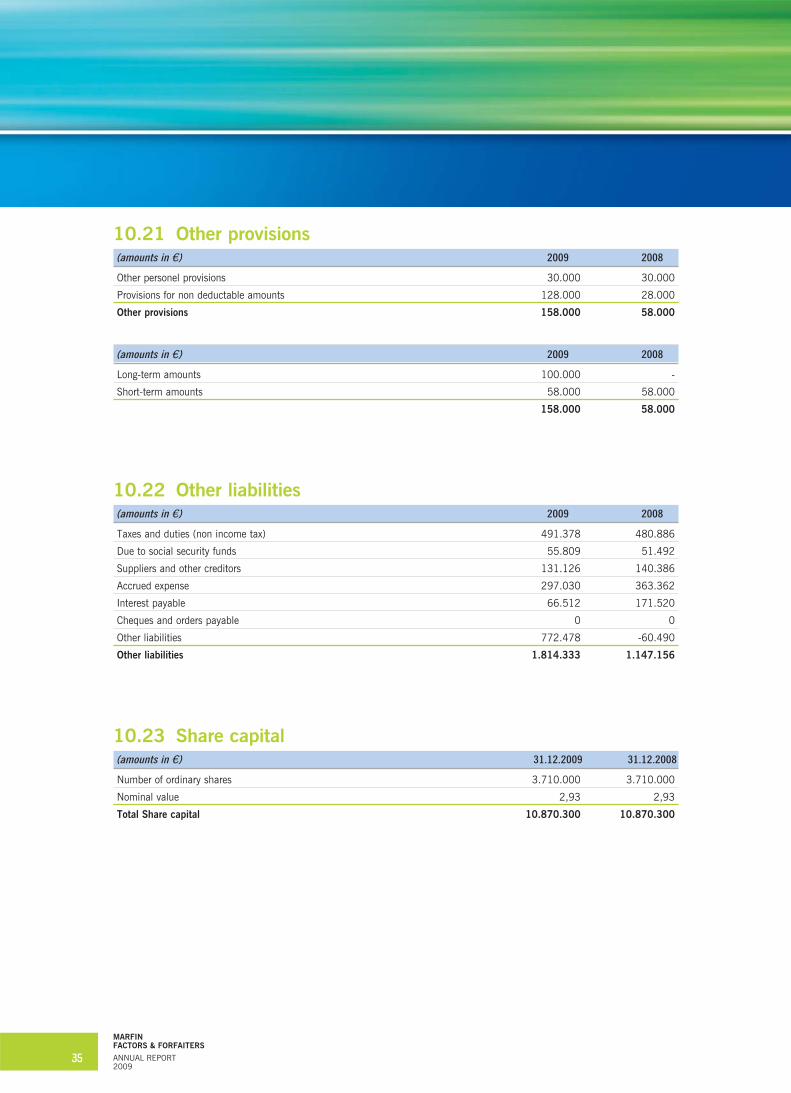
10.21 Other provisions(amounts in ú) 2009 2008
Other personel provisions 30.000 30.000
Provisions for non deductable amounts 128.000 28.000
Other provisions 158.000 58.000
(amounts in ú) 2009 2008
Long-term amounts 100.000 -
Short-term amounts 58.000 58.000
158.000 58.000
10.22 Other liabilities(amounts in ú) 2009 2008
Taxes and duties (non income tax) 491.378 480.886
Due to social security funds 55.809 51.492
Suppliers and other creditors 131.126 140.386
Accrued expense 297.030 363.362
Interest payable 66.512 171.520
Cheques and orders payable 0 0
Other liabilities 772.478 -60.490
Other liabilities 1.814.333 1.147.156
10.23 Share capital(amounts in ú) 31.12.2009 31.12.2008
Number of ordinary shares 3.710.000 3.710.000
Nominal value 2,93 2,93
Total Share capital 10.870.300 10.870.300
MARFIN FACTORS & FORFAITERS
ANNUAL REPORT 2009
35

10.24 Reserves(amounts in ú) 2009 2008
Statutory reserve 207.009 182.946
Untaxed reserves 981 981
Reserves from specially taxed income (1999) 55.847 55.847
Reserves from specially taxed income (2000) 10.739 10.739
Reserves from specially taxed income (2001) 1.705 1.705
Reserves from discounts on one-off tax payments 33.765 33.765
Stock options reserves 148.135 104.798
Special reserves 9.406 9.406
Reserves 467.588 400.187
Statutory reserve: Under the provisions of corporate law, entities are required to transfer 5% of their annual
profits to a statutory reserve until the reserve equals one third of the issued capital. This reserve is not available
for distribution but may be applied to cover losses.
Untaxed reserves: In the event that the reserves are distributed they will be taxed at the rate applicable on the
date of distribution.
MARFIN FACTORS & FORFAITERS
ANNUAL REPORT 2009
36

Group of the parent Marfin Egnatia Bank(amounts in ú) 31.12.2009 31.12.2008
ASSETS
Loans and advances to banks 2.584.114 1.223.100
Total assets 2.584.114 1.223.100
LIABILITIES
Due to Banks 245.566.992 201.376.882
Total liabilities 245.566.992 201.376.882
(amounts in ú) 1.1-31.12.2009 1.1-31.12.2008
INCOME
Interest and similar income 3.704 27.173
Commission income 2.385 84
Total income 6.089 27.257
EXPENSES
Interest and similar expenses 3.609.514 6.805.925
Commission expenses 8.191 192.205
Other expenses 25.943 5.300
Total expenses 3.643.648 7.003.429
Some 2008 figures have been reclassified for comparability reasons, having however no significant effect on
financial statements or accounts presented above.
(amounts in ú) 2009 2008
Key management compensation
Salaries & Social Insurance payments 308.392 301.308
Extraordinary payments 120.000 342.320
Stock options 29.470 38.000
Total 457.862 681.628
MARFIN FACTORS & FORFAITERS
ANNUAL REPORT 2009
37
Related parties transaction11.

The fair value represents the amount for which an asset could be exchanged, or a liability settled, between
knowledgeable, willing parties in an arm’s length transaction. Differences might arise between the carrying
amount and the fair value of financial assets and liabilities.
Receivables and other advances and financial liabilities are presented at amortized cost. The carrying amount
of the aforementioned items, as presented in the financial statements, does not materially differ from their fair
value. In particular:
(a) Cash and cash equivalents
Loans and advances to bank mainly include short tern interbank placements and other collectibles. The fair
value of those placements and collectibles is quite similar to their carrying amount
(b) Recourse Factoring
Recourse Factoring is presented following the deduction of the corresponding provision for impairment. All the
receivables have a fluctuating interest.
(c) Non-recourse Factoring
Non recourse Factoring is measured at amortized cost. All such receivables have a fluctuating interest and are
measured at amortized cost.
(d) Forfaiting Portfolio
Forfaiting portfolio is measured at amortized cost. Such receivables may have a fluctuating interest or a fixed
interest.
(e) Debt securities and other borrowed funds.
All bonds and loans bear fluctuating interest rate. Therefore, the fair value of the bonds is quite similar to their
carrying amount.
MARFIN FACTORS & FORFAITERS
ANNUAL REPORT 2009
38
Fair value of financial assets and liabilities12.

As every credit institution, the Company is exposed to many kind of risks, such as credit risk, currency risk,
interest rate risk, as explained below. Those risks are constantly monitored in various ways in order to avoid
undue risk concentrations. Primarily, they are monitored by the company’s Management, and secondarily by the
relevant Division of the mother Bank, Marfin Egnatia Bank. Below, further information on the description of
extent and nature of financial risks faced by the Company together with the comparative data concerning the
prior period, is presented.
13.1 Credit riskCredit risk is the risk of loss resulting from counter party default, or when counterparty fails to meet their
contractual obligations. The counterparties may be buyers or sellers. The undertaking of credit risk is based on
international recognized practices and Factoring criteria whose purpose is the transparency of transactions and
the recognition of risk.
Credit risk management
The company structures the levels of acceptable credit risk based on the financial analysis of the borrower or
the group of borrowers, their industry, their position in the market and the dispersion of their credit risks.
The company structures the levels of acceptable credit risk based on the financial analysis of the borrower or
the group of borrowers, their industry, their position in the market and the dispersion of their credit risks.
The determination of credit limits and charges to the customers is affected primarily by the type of factoring
service that will be provided. Factoring services are classified in terms of risk, as follows:
Recourse Factoring
In Recourse Factoring the Company has the right to go back to the seller (borrower) to collect its claims. This
way, the credit risk the company assumes against the debtor is mitigated.
Non recourse Factoring
The provision of non-recourse factoring services implies that the credit risk has been assumed by the Factoring
Company, in the case that the debtor (customer) becomes insolvent.
For non-recourse Factoring Services provided to its customers, Marfin Factors & Forfaiters after examining each
case accordingly, obtains insurance coverage for credit risk.
The Company reassesses the credit and advance limits approved on the basis of the customer’s creditworthiness
at regular intervals.
Forfaiting
The aforementioned procedures about Non recourse Factoring apply accordingly to Forfaiting operations with the
substitution, at some cases, of insurance coverage with bank coverage (e.g. avalised Promisory note).
Internationally recognized methods are applied to monitor the creditworthiness of the Bank providing coverage
or/and the debtor.
MARFIN FACTORS & FORFAITERS
ANNUAL REPORT 2009
39
Financial risk management13.

Highest exposure to credit risk prior to calculation of collaterals and other credit risk protection
measures
The table below presents the highest exposure of the Company to credit risk arising from trade receivables as
presented in the balance sheet. As far as the trade receivables presented in the balance sheet are concerned,
the exposure to credit risk equals their carrying amount
(amounts in ú) 2009 2008
Highest exposure
Exposure to credit risk of the Balance Sheet items:
Forfaiting portfolio 20.513.948 42.114.078
Less: Impairement loss -845.000
(a) Total forfaiting Portfolio 19.668.948 42.114.078
(b) Non recourse Factoring 12.720.260 14.342.111
(c) Advances to customers (after provisions)
Construction companies 857.633 1.628.213
Industries 26.710.431 25.188.667
Commercial companies 139.207.884 128.844.828
Service companies 9.928.030 11.911.959
Shipping and Maritime companies 3.681 2.145.420
Agriculture/Fishing 36.707.995
Transportation/Communication 9.854.476
Other 19.223.355 6.853.223
Impairment 2.014.421 -3.844.596
Advances to customers 240.479.066 172.727.714
Total Assets (a+b+c) 272.868.273 229.183.903
Cash advances to customers and non recourse Factoring
The table below presents the nature of advances and receivables of the Company, as well as the non-recourse
Factoring activity.
(amounts in ú) 2009 2008
Advances Non-recourse Advances Non-recourse
to customers Factoring to customers Factoring
Receivables Receivables
Cash advances without delay and impairment (i) 238.323.151 12.720.260 171.331.935 14.342.111
Delayed but not impaired (ii) 1.077.958 0 697.889 0
Impaired (iii) 3.092.378 0 4.542.486 0
Cash advances before provisions 242.493.487 0 176.572.310 0
Provision for impairment 2.014.421 0 3.844.596 0
Total Cash advances after provisions 240.479.066 12.720.260 172.727.714 14.342.111
MARFIN FACTORS & FORFAITERS
ANNUAL REPORT 2009
40

Cash advances and Factoring past but not impaired
The total Cash advances and Factoring receivables past due but not impaired for the year ended on 31st
December 2009 has a maturity over 6 months and is amounted ú 1.077.958. For the year ended on 31st
December 2008 had a maturity over 6 months also and amounted ú 697.889.
Impaired Cash advances
The Company’s estimation of impairment is made on individual basis, taking into account all the parameters
such delays, guarantees etc. The total impaired cash advances as at 31.12.2009 is amounted ú 2.014.420
and is referred to customer’s receivable. The respective amount as at 31.12.2008 was amounted ú 3.844.596
Forfaiting Portfolio
2009 2008
(amounts in ú) Forfaiting portfolio receivables Forfaiting portfolio receivables
At amortized cost 8.805.630 42.114.078
Under revision for impairement 11.708.318 0
Forfaiting portfolio receivables before provisions 20.513.948 42.114.078
Less: Impairement loss 845.000 0
Forfaiting portfolio receivables after provisions 19.668.948 42.114.078
Forfaiting portfolio receivables under revision for impairement
The total balance of Forfaiting portfolio receivables under revision for impairement for the year ended on 31st
December 2009 has a maturity under three months and amounts to ú 11.708.318.
Concentration of credit risk
Geographical segment
The table below presents the carrying amount of financial assets of the Company exposed to credit risk per
geographical segment. For the purposes of the table, the classification of exposure of financial assets per
geographical segment has been conducted based on the country of operation of the counter parties.
(amounts in ú) Greece Other countries Total
2009
Advances to customers (after provision) 239.293.424 1.185.642 240.479.066
Non recourse Factoring assets/receivables 4.460.184 8.260.076 12.720.260
Forfaiting portfolio receivables 2.335.506 17.333.442 19.668.948
Total 246.089.114 26.779.160 272.868.273
The Company is exposed to capital loss risk, due to financial, political and other matters in a particular country
where the funds or cash and cash available of the Company have been placed or invested in various local banks
or credit institutions.
All the countries are assessed in accordance with the economic data and country’s prospects as well as the
credibility assessments by international credit rating organizations (Moody’s, Standard & Poor’s). All limits are
closely monitored by the Market Risk division of Marfin Egnatia Bank.
MARFIN FACTORS & FORFAITERS
ANNUAL REPORT 2009
41

13.2 Interest rate riskInterest rate risk arises from interest rate fluctuations to the extent that interest-earning assets and interest
–bearing liabilities mature or reprise at different times or in different amounts. Such fluctuations may increase
or decrease interest rate margins, leading to a possible reduction in estimated profits.
The company’s policy is to set fixed interest margins to the financial assets and liabilities to manage effectively
the interest risk rate.
The Tables below present assets and liabilities of the Company at their carrying amounts classified based on
interest rate revaluation date as far as fluctuating interest rates are or maturity date as far as fixed interest rates
are concerned.
Fiscal year 2009 - Interest rate risk
(amounts in ú) Interest Up to 1 1-3 3-6 6-12 1-5 Over 5
Free month months months months Years Years Total
ASSETS
Cash 210 210
Cash equivalents 3.342.238 3.342.238
Forfaiting portfolio 620.000 931.423 2.284.364 3.822.910 1.766.932 10.243.318 19.668.948
Advances to customers (after provision) 1.077.958 239.401.108 240.479.066
Non-recourse Factoring assets/receivables 12.720.260 12.720.260
Deferred Tax asset 37.747 37.747
Intangible assets 73.042 73.042
Tangible assets 353.121,73 353.122
Other assets 583.133 583.133
Total assets 15.465.471 4.273.662 241.685.472 0 3.822.910 1.766.932 10.243.318 277.257.765
LIABILITIES
Due to banks 112.933.367 112.933.367
Non recourse factoring Liabilities 14.070.505 14.070.505
Bonds issued and other borrowings 132.633.625 132.633.625
Deferred Tax liabilities 63.310 63.310
Other liabilities 2.542.872 2.542.872
Total liabilities 16.676.687 245.566.992 0 0 0 0 0 262.243.679
Net interest rate gap -1.211.216 -241.293.331 241.685.472 0 3.822.910 1.766.932 10.243.318 15.014.086
Share Capital 10.870.300 10.870.300
Other reserves & retained earnings 4.143.786 4.143.786
Total net equity 15.014.086 0 0 0 0 0 0 15.014.086
MARFIN FACTORS & FORFAITERS
ANNUAL REPORT 2009
42

Fiscal year 2008 - Interest rate risk
(amounts in ú) Interest Up to 1 1-3 3-6 6-12 1-5
Free month months months months Years Total
ASSETS
Cash 190 190
Cash equivalents 1.681.240 1.681.240
Forfaiting portfolio 2.349.286 9.735.903 2.429.889 12.768.162 14.830.838 42.114.078
Advances to customers (after provision) 172.727.714 172.727.714
Non-recourse Factoring assets/receivables 14.342.111 14.342.111
Deferred Tax asset 37.747 37.747
Intangible assets 50.492 50.492
Tangible assets 425.500 425.500
Other assets 193.311 193.311
Total assets 707.240 18.372.637 182.463.617 2.429.889 12.768.162 14.830.838 231.572.383
LIABILITIES
Due to banks 75.120.434 75.120.434
Non recourse factoring Liabilities 14.342.111 14.342.111
Bonds issued and other borrowings 108.256.449 18.000.000 126.256.449
Deferred Tax liabilities 63.310 63.310
Other liabilities 1.541.266 1.541.266
Total liabilities 1.604.576 197.718.994 18.000.000 0 0 0 217.323.570
Net interest rate gap -897.336 -179.346.357 164.463.617 2.429.889 12.768.162 14.830.838 14.248.814
Share Capital 10.870.300 10.870.300
Other reserves & retained earnings 3.378.514 3.378.514
Total net equity 14.248.814 0 0 0 0 0 14.248.814
13.3 Currency riskCurrency risk is the risk from fluctuating value of financial instruments as well as assets and liabilities caused
by changes in currency rates. Foreign currency transactions risk arises from an open position, positive or
negative, which exposes the Company to currency exchange risk. Such risk can be created in the event the
assets are carried in one currency financed by liabilities in another currency or can arise from forwards and
swaps or derivatives including options.
The Company’s policy is to borrow the same amounts and currency with the advances extended to the
customers. The Tables below present the Company’s exposure to currency risk.
The Tables present assets and liabilities of the Company at their carrying amounts classified per currency.
MARFIN FACTORS & FORFAITERS
ANNUAL REPORT 2009
43

Fiscal year 2009 - Currency risk
(amounts in ú)
ASSETS EUR USD CAD GBP Total
Cash 210 210
Cash equivanlents 2.260.795 989.150 2.180 90.113 3.342.238
Forfaiting portfolio 7.783.206 11.885.742 19.668.948
Advances to customers(after provision) 240.479.066 240.479.066
Non-recourse Factoring assets/receivables 12.720.260 12.720.260
Intangible assets 73.042 73.042
Tangible assets 353.122 353.122
Deferred Tax asset 37.747 37.747
Other assets 583.133 583.133
Total assets 264.290.581 12.874.892 2.180 90.113 277.257.765
LIABILITIES EUR USD CAD GBP Total
Due to Banks 112.930.885 2.483 112.933.367
Non recourse Factoring liabilities 14.070.505 14.070.505
Bonds issued and other borrowings 120.000.000 12.633.625 132.633.625
Provisions, contingent liabilities 58.849 58.849
Other provisions 158.000 158.000
Deferred tax liabilities 63.310 63.310
Current income tax 511.689 511.689
Other liabilities 1.814.333 1.814.333
Total liabilities 249.607.572 12.636.107 0 0 262.243.679
Net currency position 14.683.009 238.785 2.180 90.113 15.014.086
Share Capital 10.870.300 10.870.300
Other reserves & retained earnings 4.143.786 4.143.786
Total net equity 15.014.086 0 0 0 15.014.086
MARFIN FACTORS & FORFAITERS
ANNUAL REPORT 2009
44

Fiscal year 2008 - Currency risk
(amounts in ú)
ASSETS EUR USD GBP Total
Cash 190 190
Cash equivanlents 1.577.931 25.890 77.420 1.681.240
Forfaiting portfolio 19.255.638 22.858.440 42.114.078
Advances to customers(after provision) 170.580.306 2.147.408 172.727.714
Non-recourse Factoring assets/receivables 14.342.111 14.342.111
Intangible assets 50.492 50.492
Tangible assets 425.500 425.500
Deferred Tax asset 37.747 37.747
Other assets 193.311 193.311
Total assets 206.463.226 25.031.737 77.420 231.572.383
LIABILITIES EUR USD GBP Total
Due to Banks 73.942.366 1.178.068 75.120.434
Non recourse Factoring liabilities 14.342.111 14.342.111
Bonds issued and other borrowings 103.000.000 23.256.449 126.256.449
Provisions, contingent liabilities 46.190 46.190
Other provisions 58.000 58.000
Deferred tax liabilities 63.310 63.310
Current income tax 289.920 289.920
Other liabilities 1.147.156 1.147.156
Total liabilities 192.889.053 24.434.517 0 217.323.570
Net currency position 13.574.173 597.221 77.420 14.248.814
Share Capital 10.870.300 10.870.300
Other reserves & retained earnings 3.378.514 3.378.514
Total net equity 14.248.814 0 0 14.248.814
13.4 Liquidity riskThe company is exposed daily to liquidity risks arising from the management of its receivables portfolio. The
company maintains sufficient liquidity from the issuance of corporate bonds, which cover the greatest part of its
cash flows. Open borrowing from the parent Company covers the remaining liquidity in the currency that the
necessary cash flows are denominated.
The Tables below analyze liabilities to banks, bonds issued and other borrowed funds in the corresponding
periods as from the remaining period as from the balance sheet date to maturity date.
The presented amounts are contractual non-discounted cash flows.
MARFIN FACTORS & FORFAITERS
ANNUAL REPORT 2009
45

Liquidity risk
2009
(amounts in ú) Up to 1 month 1-3 months 3-12 months 1-5 years Total
LIABILITIES
Due to banks 116.886.035 0 0 0 116.886.035
Non recourse Factoring liabilities 12.720.260 0 0 0 12.720.260
Bonds issued and other borrowings 0 0 63.629.104 72.282.066 135.911.170
Total liabilities 129.606.295 0 63.629.104 72.282.066 265.517.465
2008
(amounts in ú) Up to 1 month 1-3 months 3-12 months 1-5 years Total
LIABILITIES
Due to banks 77.974.792 0 0 0 77.974.792
Non recourse Factoring liabilities 14.342.111 0 0 0 14.342.111
Bonds issued and other borrowings 0 0 0 130.612.640 130.612.640
Total liabilities 92.316.903 0 0 130.612.640 222.929.543
13.5 Operational riskOperational risk is the risk stemming from inadequacy or failure of internal procedures, people and information
systems or events of the external environment, including the legal frame of operation. The company has adopted
the Operational Risk Frame and procedures that the Group applies. There are procedures for identifying,
measuring, managing, follow-up and review of the operational risks while due to the size of the company and
the special-specific purpose of operation, the complexity and the range of the risks is significantly reduced. The
Operational Risk function has been outsourced by the relative department of the parent Company that applies
a wide range action plan covering all divisions of the company.
Recognition and measurement of Operational Risks is mainly performed by risk assessment workshops, a
procedure carried out in phases aiming to cover all divisions of the company. Significant risks that may be
identified are being dealt with specific and case-by-case action plans.
As an additional recognition and estimation tool as well as the containment of risk the use of Key Risk Indicators
has been adopted.
Finally in periodical basis internal reports are being prepared for operational risk issues. The reports cover all
important issues and results of the procedures for risk management and mitigation.
The company’s information systems security is in line with the Information Systems Security Management of the
Group and is being supervised by Information Systems Security Unit of the Risk Management Department of the
parent bank. Information Systems Security Unit is being called to face various technological and business risks
that are being caused by the rapid increase of technological weaknesses as well as the increasing dependency
of the business operations in new applications and systems. The role of the aforementioned department is the
development, operation, maintenance and monitoring of the effectiveness of an integrated Information Safety
program as well as the effective materialization of the necessary mechanisms for protection of privacy, integrity
and availability of data.
MARFIN FACTORS & FORFAITERS
ANNUAL REPORT 2009
46

Central Bank of Greece which is the central monitoring and regulatory body for financing companies in Greece
sets rules by issuing permanent decisions for advances and receivables impairment losses, risk coverage
measurement as well as assets’ coverage in general using suitable provisions and capital adequacy. The
supervisory Equity of companies in accordance with No. 2053.18.3.1992 Decisions of the Governor of Central
Bank of Greece when divided by total risk-weighted assets forms their Capital Adequacy Ratio.
The Capital Adequacy Ratio as at 31/12/2009 and 31/12/2008 is as follows:
(amounts in thousands ú)
2009 Index
Tier I capital items 14.941 10,96
Supervisory body adjustments Δier II + III Capital -1.286
Total supervisory capitals 13.655 10,02
Risk weighted assets 3.12.2009 136.293
2008 Index
Tier I capital items 14.198 15,98
Supervisory body adjustments Δier II + III Capital -881
Total supervisory capitals 13.317 14,99
Risk weighted assets 3.12.2008 88.860
MARFIN FACTORS & FORFAITERS
ANNUAL REPORT 2009
47
Capital Adequacy14.

There are no outstanding legal cases, which may have a major impact on the Company’s financial position.
Unaudited fiscal years by the tax authorities
The Company has been audited for the fiscal years including 2006. As a result, the financial results disclosed
to the tax authorities for the fiscal year 2007 and 2008 are not considered conclusive.
The financial results submitted to the tax authorities for the fiscal years 2007 and 2008 are considered
temporary and can be modified upon inspection of the accounting books by tax authorities. The company
reviews annually the contingent liabilities by the unaudited fiscal years and makes the necessary provisions. The
provisions formed until December 31, 2009 amount to 128.000 ú.
MARFIN FACTORS & FORFAITERS
ANNUAL REPORT 2009
48
Contingent liabilities15.

The tax audit for fiscal years 2007-2008 was completed in February, imposing additional taxes and penalties
corresponding to the provision of accounting differences included in previous years’ taxes (see note 10.8).
MARFIN FACTORS & FORFAITERS
ANNUAL REPORT 2009
49
Subsequent events16.

To the shareholders of «MARFIN FACTORS & FORFAITERS S.A.»
Report on Financial Statements
We have audited the accompanying financial statements of “MARFIN FACTORS & FORFAITERS S.A.” (the
Company) which comprise the balance sheet as at 31 December 2008, and the income statement, statement
of changes in equity and cash flow statement for the year then ended, and a summary of significant accounting
policies and other explanatory notes.
Responsibility of the Management for the Financial Statements
The preparation and fair presentation of the aforementioned financial statement in accordance with International
Financial Reporting Standards, as they were adopted by the European Union, burdens the Company’s
Management. The above responsibility comprises organization, application and maintenance of internal audit
systems concerning the preparation and fair presentation of financial statements free of material misstatement
due to fraud or error.
Responsibility of the Auditor
Our responsibility is to express an opinion on these financial statements based on our audit. We conducted our
audit in accordance with the International Standards on Auditing. Those Standards require that we plan and
perform the audit to obtain reasonable assurance as to whether the financial statements are free of material
misstatement. An audit includes examining, on a test basis, evidence supporting the amounts and disclosures
in the financial statements. The procedures are selected in accordance with the auditor’s judgment and comprise
the assessment of material misstatement risk, due to fraud or error. In order to assess the above risk, an auditor
takes into consideration the internal audit system concerning the preparation and fair presentation of financial
statements, with the objective of designation of auditing procedures on a case basis and not of expressing
opinion on the effectiveness of internal audit systems of the Company. An audit also includes assessing the
accounting principles used and significant estimates made by the Company’s management, evaluating the
overall financial statement presentation.
We believe that the audit data collected by us is sufficient and provides a reasonable basis for our opinion.
Opinion
In our opinion the attached Financial Statements give a true and fair view of the financial position of the
Company as at 31 December 2009, and of the results of its operations as well as of its cash flows for the year
then ended in accordance with International Financial Reporting Standards that have been adopted by the
European Union.
Report on Other Legal and Regulatory Requirements
The information included in the Board of Director’s report, contains all information required by article 43a and
37 of Law 2190/20 and is consistent with the consolidated financial statements.
Athens, March 4th, 2010
Leos G. John
SOEL Reg. No 24881
MARFIN FACTORS & FORFAITERS
ANNUAL REPORT 2009
50
Independent Auditor’s Report17.

Serbia Branch:
Bul. Mihajla Pupina 165e
11000 Belgrade, Serbia
Tel.: +381 11 222 4800
Fax: +381 11 222 4840
e-mail: [email protected]
www.marfinfactors.rs
Belgrade
Thessaloniki Office:
18, Leontos Sofou Str. 54625 Thessaloniki, Greece
Tel.: +30 2310 386370-1
Fax: +30 2310 386375
e-mail: [email protected]
www.marfinfactors.gr
Thessaloniki
Headquarters:
20, Kifissias Ave.
15125 Maroussi-Athens, Greece
Tel.: +30 210 680 3000
Fax: +30 210 680 3070
e-mail: [email protected]
www.marfinfactors.gr
Athens