Marek Gierliński Division of Computational Biology · Biological and technical variability In most...
38
Error analysis in biology Errors, like straws, upon the surface flow; He who would search for pearls must dive below John Dryden (1631-1700) Marek Gierliński Division of Computational Biology Hand-outs available at http://is.gd/statlec
Transcript of Marek Gierliński Division of Computational Biology · Biological and technical variability In most...
Error analysis in biology
Errors, like straws, upon the surface flow; He who would search for pearls must dive below
John Dryden (1631-1700)
Marek Gierliński Division of Computational Biology
Hand-outs available at http://is.gd/statlec

Previously on Errors…
2
• Random variable: result of an experiment
• Probability distribution: how random values are distributed
• Discrete and continuous probability distributions
Gaussian (normal) distribution
• very common • 95% probability within 𝜇 ± 1.96𝜎
Poisson (count) distribution
• random and independent events
• mean = variance • approximates Gaussian for
large 𝑛
Binomial distribution
• probability of 𝑘 successes out of 𝑛 trials
• toss a coin • approximates Gaussian
for large 𝑛
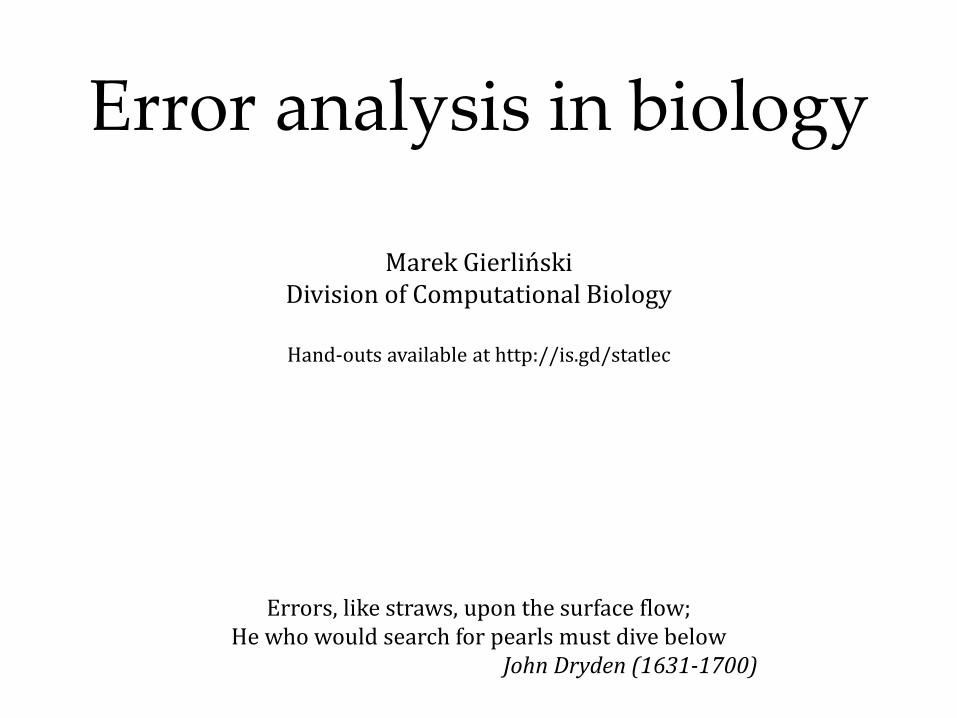
Example
Take one mouse and weight it
Result: 18.21 g
Reading error
Take five mice and find mean weight
Results 18.81 g
Sampling error
These are examples of measurement errors
3

2. Measurement errors
“If your experiment needs statistics, you ought to have done a better experiment”
Ernest Rutherford
5
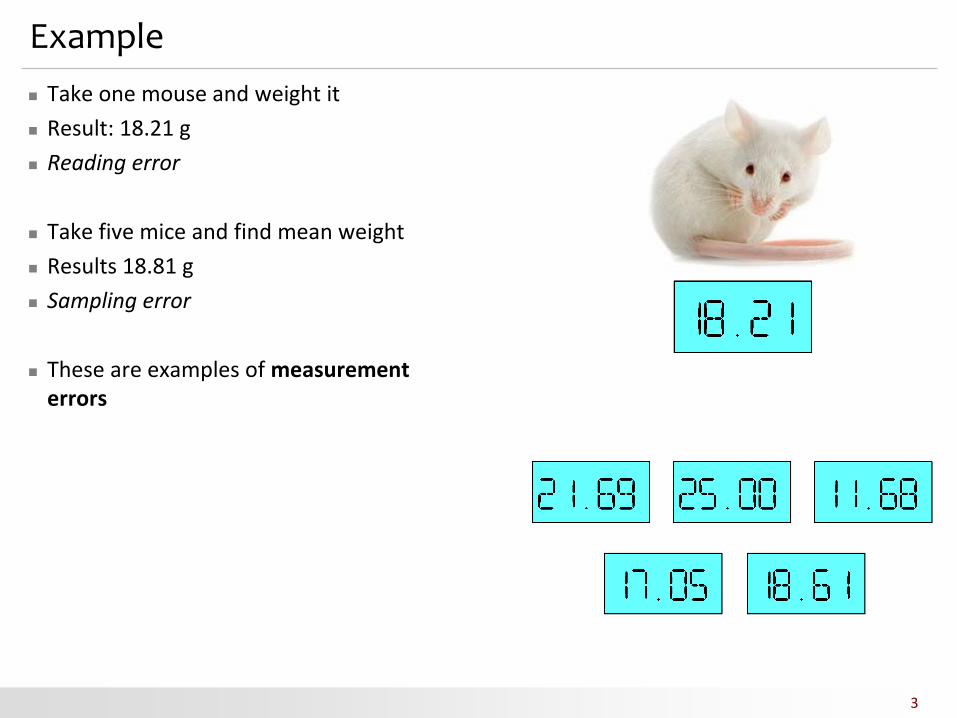
Different types of errors
Systematic errors
Incorrect instrument calibration
Model uncertainties
Change in experimental conditions
Mistakes!
Random errors
Reading errors
Sampling errors
Counting errors
Background noise
Intrinsic variability
Sensitivity limits
Systematic errors can be eliminated in good experiments
You can’t eliminate random errors, you have to live with them. You can estimate (and reduce) random error by taking multiple measurements

6
Random measurement error
Determine the strength of oxalic acid in a sample
Method: find the volume of NaOH solution required to neutralize a given volume of the acid by observing a phenolphthalein indicator
Uncertainties contributing to the final result
volume of the acid sample
judgement at which point acid is neutralized
volume of NaOH solution used at this point
accuracy of NaOH concentration
• weight of solid NaOH dissolved
• volume of water added
Each of these uncertainties adds a random error to the final result
A model of random measurement error
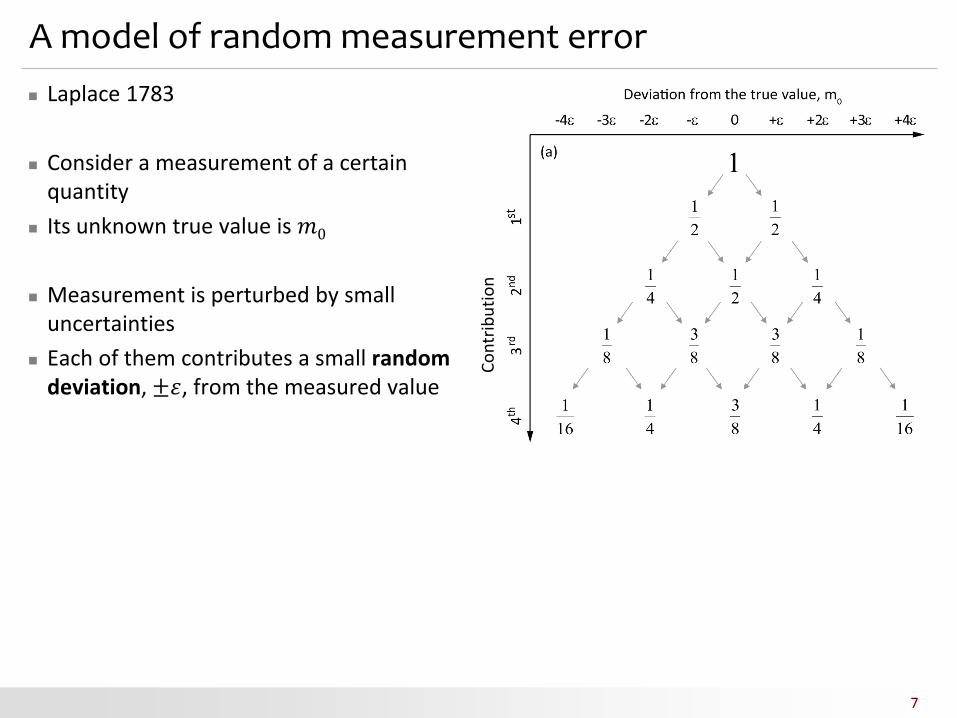
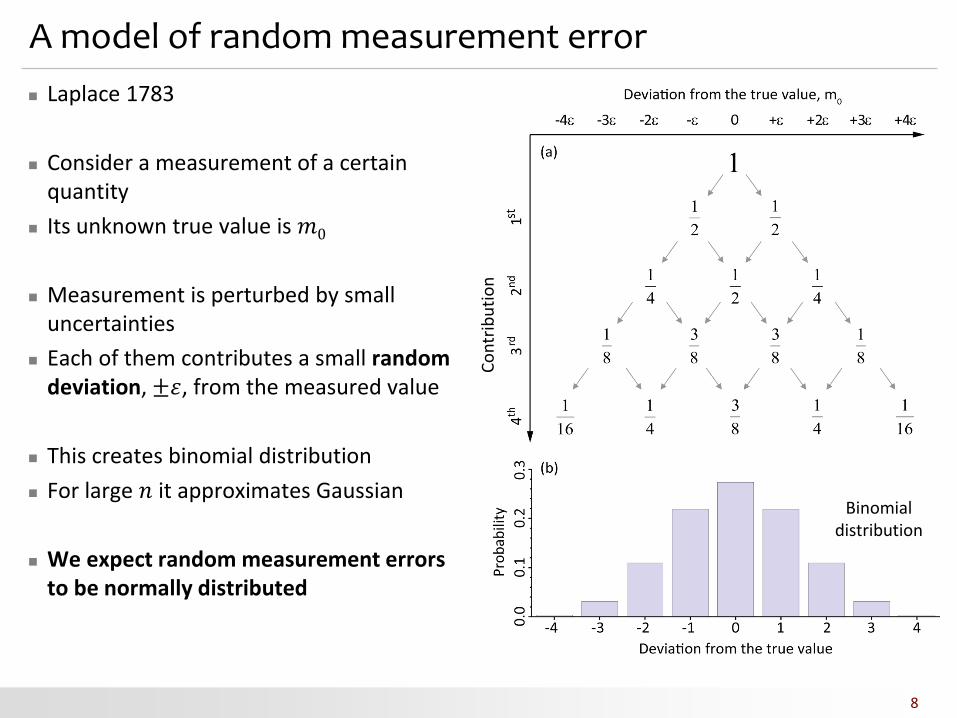
Laplace 1783
Consider a measurement of a certain quantity
Its unknown true value is 𝑚0
Measurement is perturbed by small uncertainties
Each of them contributes a small random deviation, ±𝜀, from the measured value
7
Co
ntr
ibu
tio
n
A model of random measurement error
Laplace 1783
Consider a measurement of a certain quantity
Its unknown true value is 𝑚0
Measurement is perturbed by small uncertainties
Each of them contributes a small random deviation, ±𝜀, from the measured value
This creates binomial distribution
For large 𝑛 it approximates Gaussian
We expect random measurement errors to be normally distributed
8
Binomial distribution
Co
ntr
ibu
tio
n


Biological and technical variability
In most experiments biological variability dominates
It is hard to disentangle the two types of variability
10
Biological variability
Molecular level
Phenotype variability
From subject to subject
Variability in time
Life is stochastic!
Technical variability
Random measurement errors
Accumulation of errors

11
Sampling error
Repeated measurements give us
mean value
variability scale
Sampling from a population
Measure the body weight of a mouse
Sample: 5 mice
Population: all mice on the planet
Small sample size introduces uncertainty
Body weight of 5 mice (g)
Mean (g)
20.38 20.73 23.24 15.39 12.58 18.5
27.48 12.52 21.95 12.54 21.19 19.1
14.73 16.37 28.21 21.18 13.48 18.9
12
Reading error
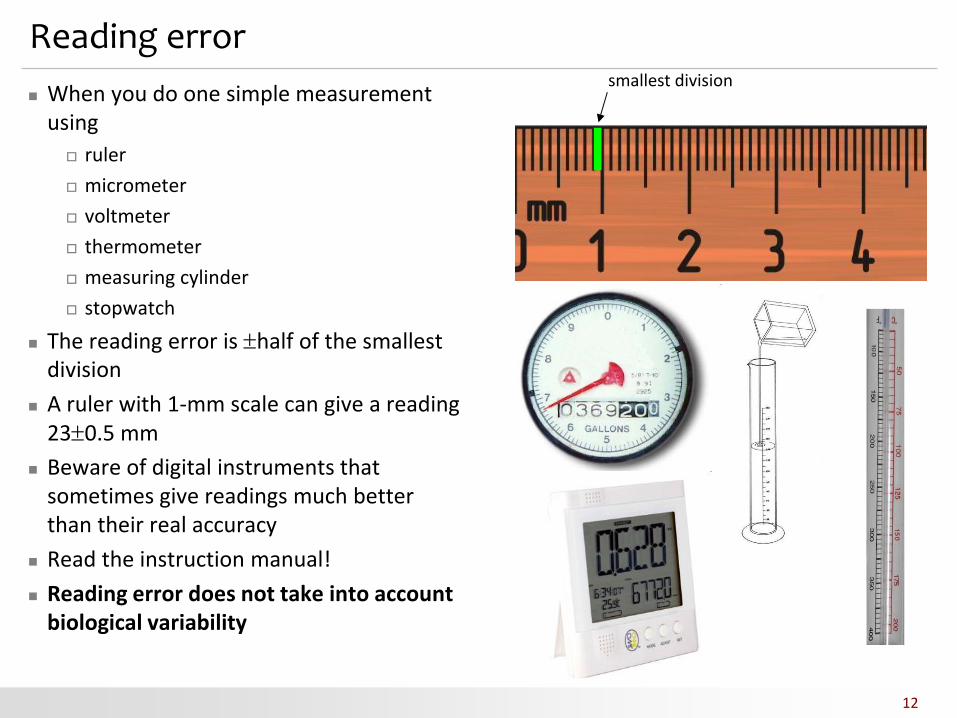
When you do one simple measurement using
ruler
micrometer
voltmeter
thermometer
measuring cylinder
stopwatch
The reading error is half of the smallest division
A ruler with 1-mm scale can give a reading 230.5 mm
Beware of digital instruments that sometimes give readings much better than their real accuracy
Read the instruction manual!
Reading error does not take into account biological variability
smallest division

13
Counting error
Dilution plating of bacteria
Counted 𝐶 = 17 colonies on a plate at the 10-5 dilution
Counting statistics: Poisson distribution
𝜎 = 𝜇
Use standard deviation as error estimate
𝑆 = 𝐶 = 17 ≈ 4
𝐶 = 17 ± 4
Counting error
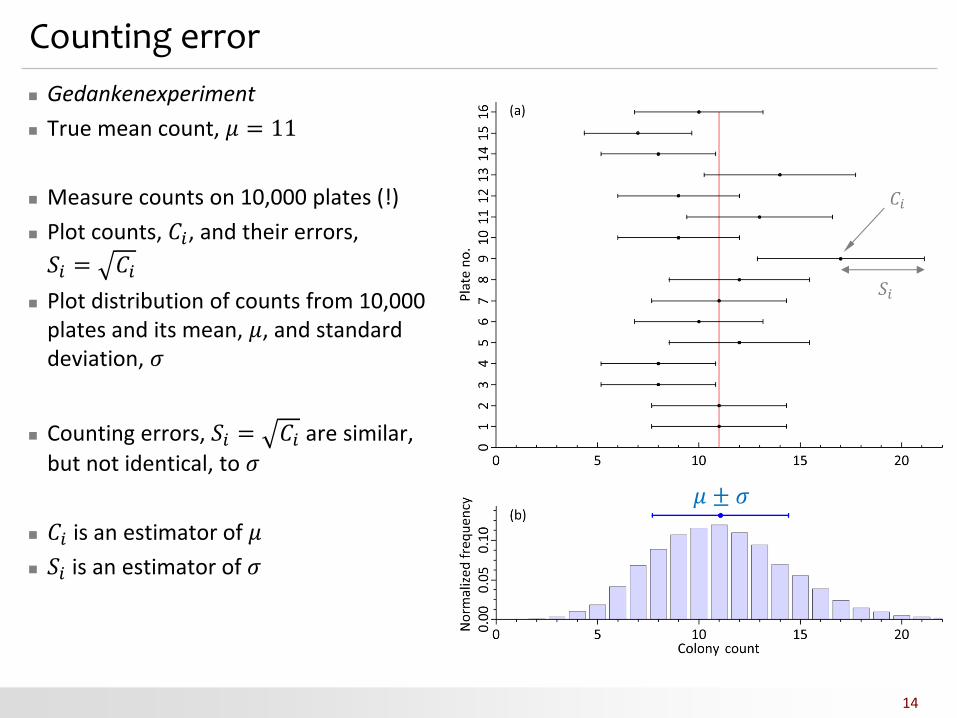
Gedankenexperiment
True mean count, 𝜇 = 11
Measure counts on 10,000 plates (!)
Plot counts, 𝐶𝑖, and their errors,
𝑆𝑖 = 𝐶𝑖
Plot distribution of counts from 10,000 plates and its mean, 𝜇, and standard deviation, 𝜎
Counting errors, 𝑆𝑖 = 𝐶𝑖 are similar,
but not identical, to 𝜎
𝐶𝑖 is an estimator of 𝜇
𝑆𝑖 is an estimator of 𝜎
14
𝐶𝑖
𝜇 ± 𝜎
𝑆𝑖

Exercise: is Dundee a murder capital of Scotland?
On 2 October 2013 The Courier published an article “Dundee is murder capital of Scotland”
Data in the article (2012/2013):
Compare Dundee and Glasgow
Find errors on murder rates
Hint: find errors on murder count first
City Murders Per 100,000
Dundee 6 4.1
Glasgow 19 3.2
Aberdeen 2 0.88
Edinburgh 2 0.41
15
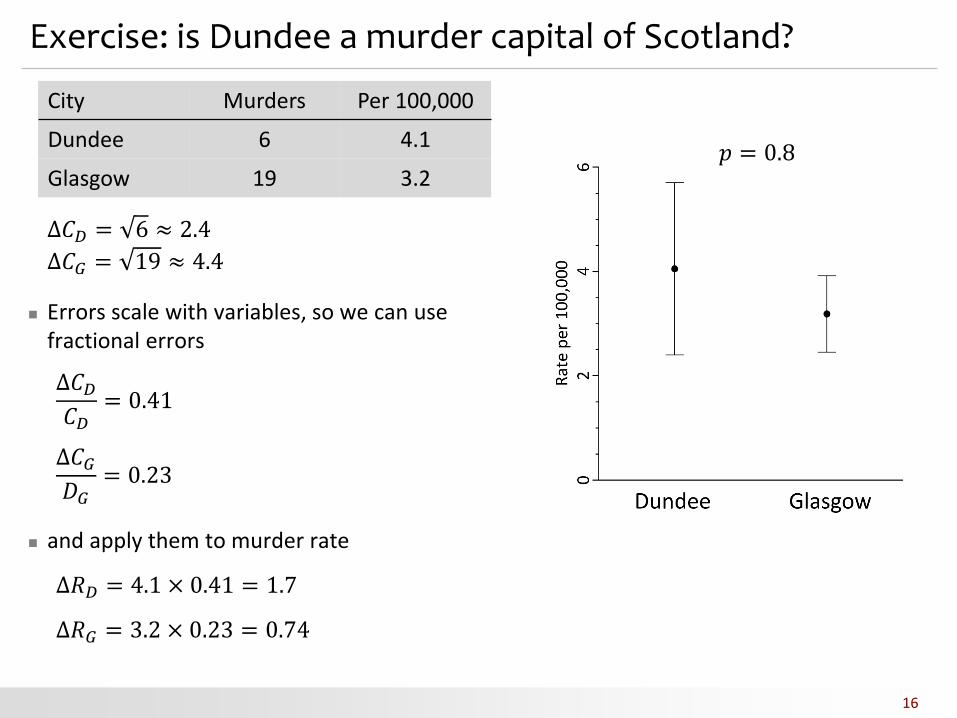
Exercise: is Dundee a murder capital of Scotland?
City Murders Per 100,000
Dundee 6 4.1
Glasgow 19 3.2
16
Δ𝐶𝐷 = 6 ≈ 2.4
Δ𝐶𝐺 = 19 ≈ 4.4
Errors scale with variables, so we can use fractional errors
Δ𝐶𝐷𝐶𝐷= 0.41
Δ𝐶𝐺𝐷𝐺= 0.23
and apply them to murder rate
Δ𝑅𝐷 = 4.1 × 0.41 = 1.7
Δ𝑅𝐺 = 3.2 × 0.23 = 0.74
𝑝 = 0.8
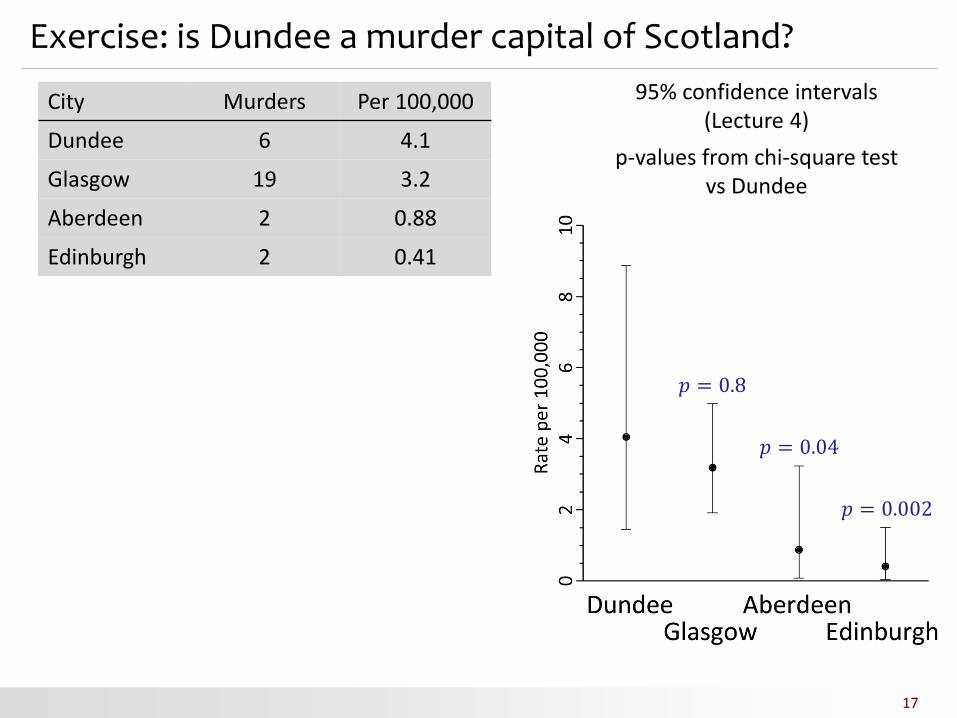
Exercise: is Dundee a murder capital of Scotland?
17
City Murders Per 100,000
Dundee 6 4.1
Glasgow 19 3.2
Aberdeen 2 0.88
Edinburgh 2 0.41
95% confidence intervals (Lecture 4)
p-values from chi-square test vs Dundee
𝑝 = 0.8
𝑝 = 0.04
𝑝 = 0.002

Measurement errors: summary
Experimental random errors are expected to be normally distributed
Some errors can be estimated directly
reading (scale, gauge, digital read-out)
counting
Other uncertainties require replicates (a sample)
this introduces sampling error
18
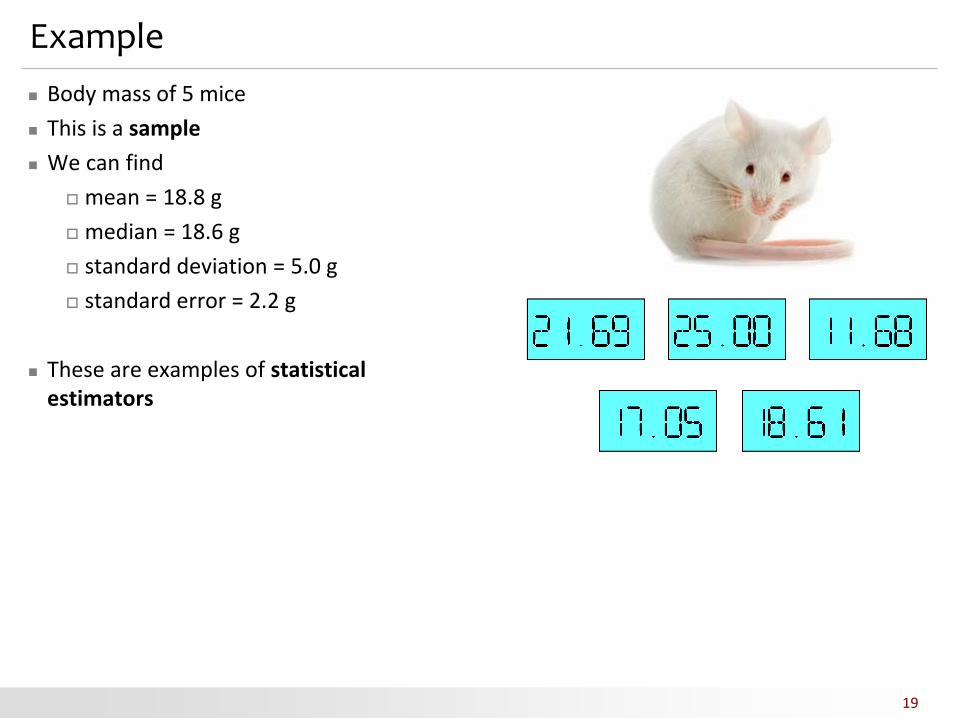
Example
Body mass of 5 mice
This is a sample
We can find
mean = 18.8 g
median = 18.6 g
standard deviation = 5.0 g
standard error = 2.2 g
These are examples of statistical estimators
19
3. Statistical estimators
“The average human has one breast and one testicle”
Des MacHale
21
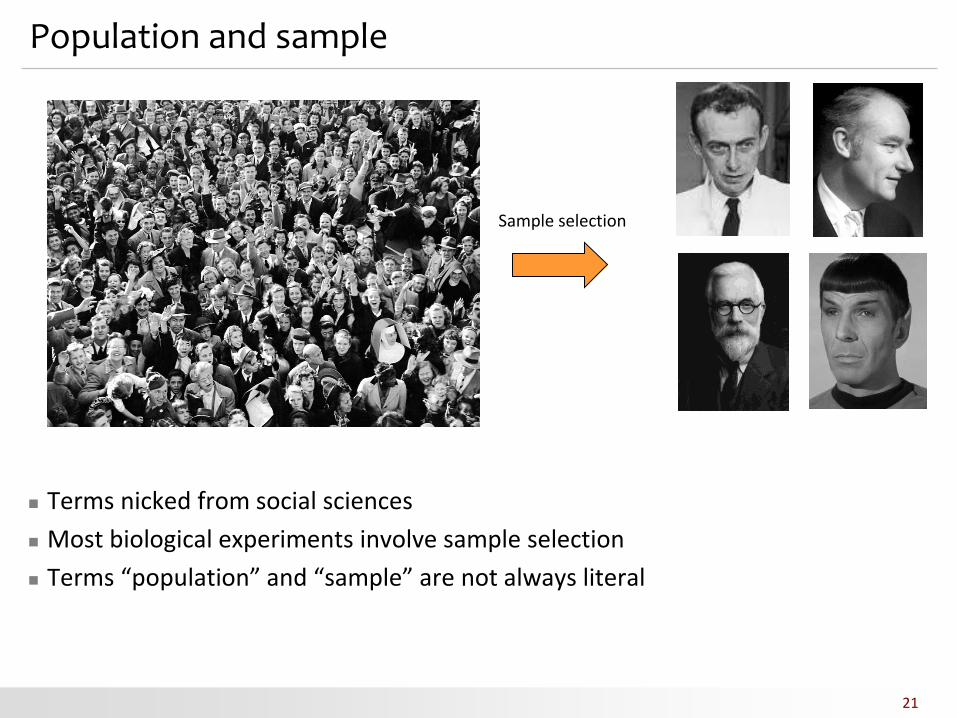
Population and sample
Terms nicked from social sciences
Most biological experiments involve sample selection
Terms “population” and “sample” are not always literal
Sample selection

What is a sample?
The term “sample” has different meanings in biology and statistics
Biology: sample is a specimen, e.g., a cell culture you want to analyse
Experiment in 5 biological replicates requires 5 biological samples
After quantification (e.g. protein abundance) we get a set of 5 numbers
Statistics: sample is (usually) a set of numbers (measurements)
In these talks: 𝑥1, 𝑥2, … , 𝑥𝑛
22
biological samples (specimens)
quantification
1.32 1.12
0.98
0.80 1.07
Statistical sample (set of numbers)
23
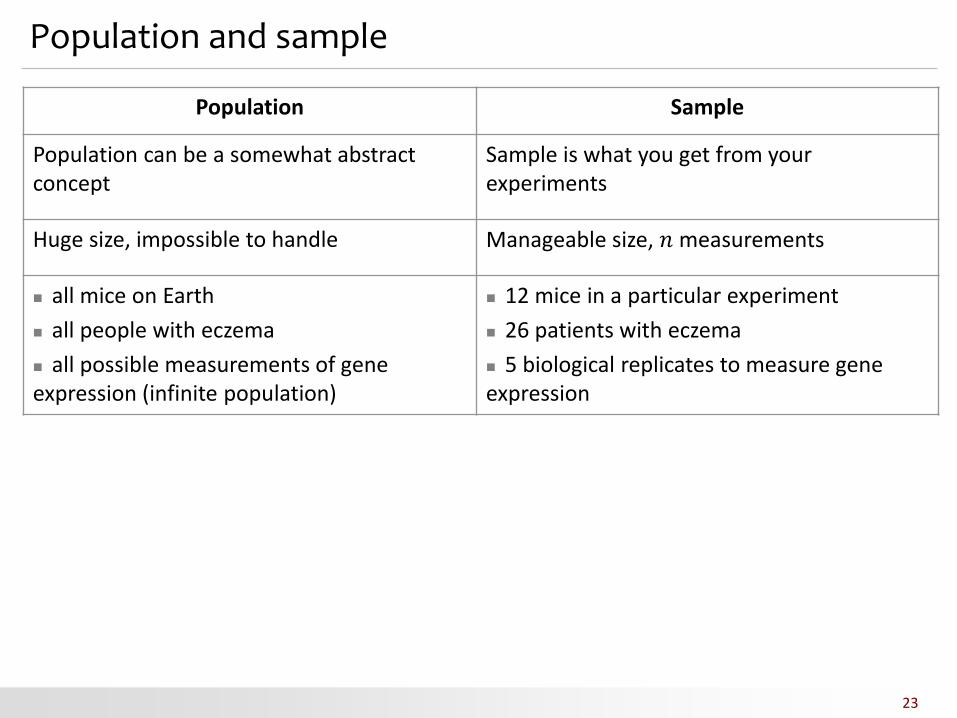
Population and sample
Population Sample
Population can be a somewhat abstract concept
Sample is what you get from your experiments
Huge size, impossible to handle Manageable size, 𝑛 measurements
all mice on Earth
all people with eczema
all possible measurements of gene expression (infinite population)
12 mice in a particular experiment .
26 patients with eczema
5 biological replicates to measure gene expression
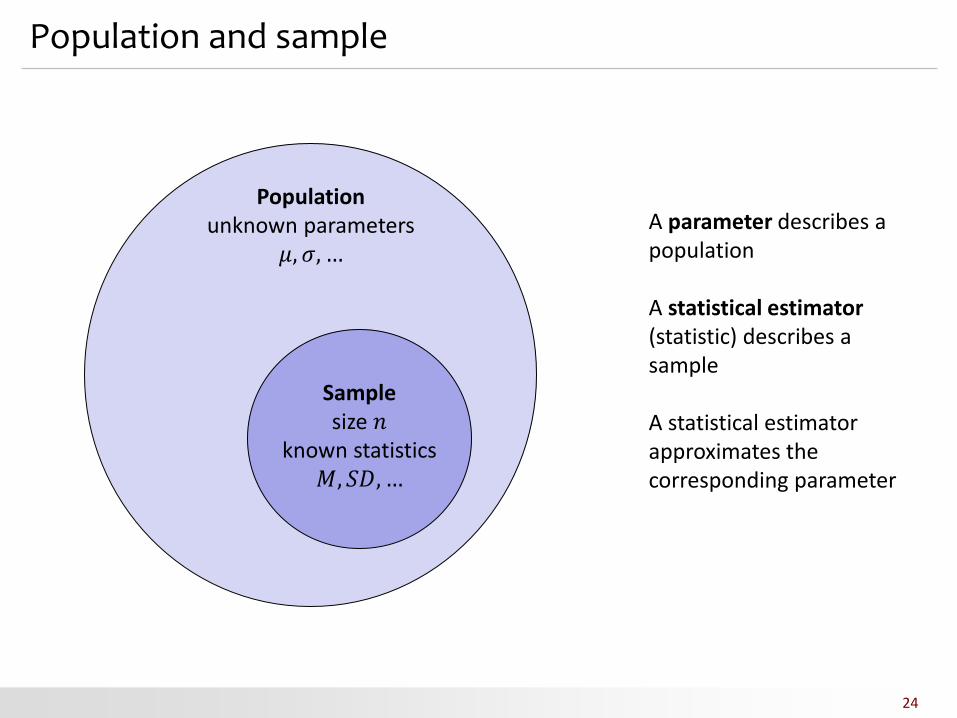
Population and sample
24
Population unknown parameters
𝜇, 𝜎, …
Sample size 𝑛
known statistics 𝑀, 𝑆𝐷,…
A parameter describes a population A statistical estimator (statistic) describes a sample A statistical estimator approximates the corresponding parameter

Sample size
25
Dilution plating experiment
What is the sample size?
𝑛 = 1
This sample consists of one measurement: 𝑥1 = 17
17 colonies
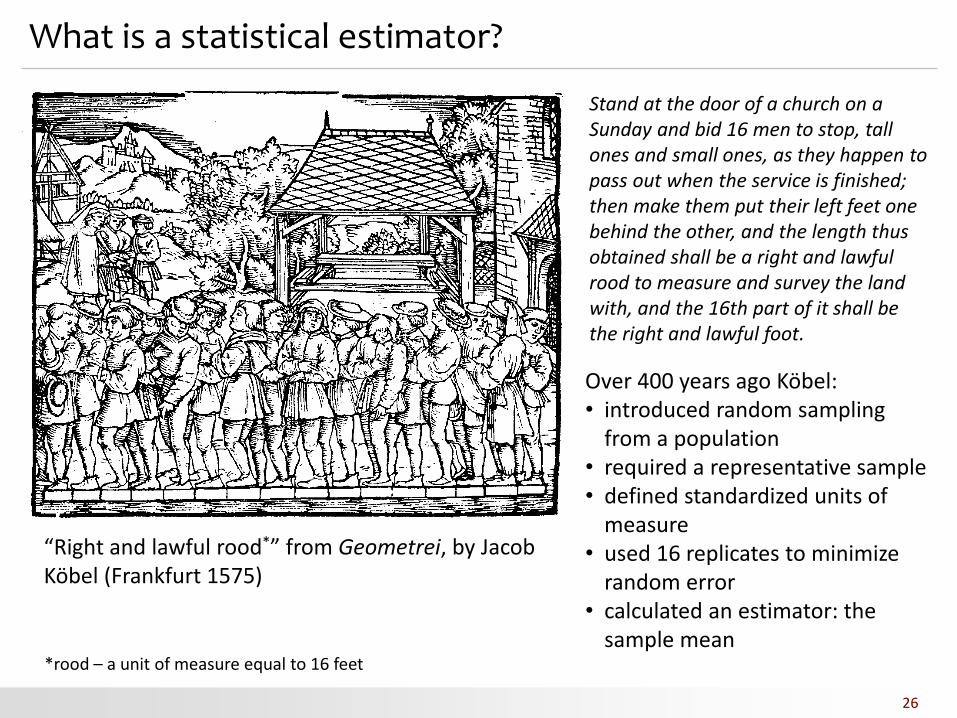
What is a statistical estimator?
26
“Right and lawful rood*” from Geometrei, by Jacob Köbel (Frankfurt 1575)
Stand at the door of a church on a Sunday and bid 16 men to stop, tall ones and small ones, as they happen to pass out when the service is finished; then make them put their left feet one behind the other, and the length thus obtained shall be a right and lawful rood to measure and survey the land with, and the 16th part of it shall be the right and lawful foot.
Over 400 years ago Köbel: • introduced random sampling
from a population • required a representative sample • defined standardized units of
measure • used 16 replicates to minimize
random error • calculated an estimator: the
sample mean *rood – a unit of measure equal to 16 feet

27
Statistical estimators
Statistical estimator is a sample attribute used to estimate a population parameter
From a sample 𝑥1, 𝑥2, … , 𝑥𝑛 we can find
𝑀 =1
𝑛 𝑥𝑖
𝑛
𝑖=1
𝑆𝐷 =1
𝑛 − 1 𝑥𝑖 −𝑀
2
𝑛
𝑖=1
• 𝑛 = 30 • 𝑀 = 20.3 g • 𝑆𝐷 = 5.2 g • 𝑆𝐸 = 0.94 g
𝑀 = 20.3 ± 0.9 g
mean
standard deviation
median, proportion, correlation, …
𝜇 𝜎
𝑀 𝑆𝐷
population 𝒩(20, 5)
sample 𝑛 = 30

28
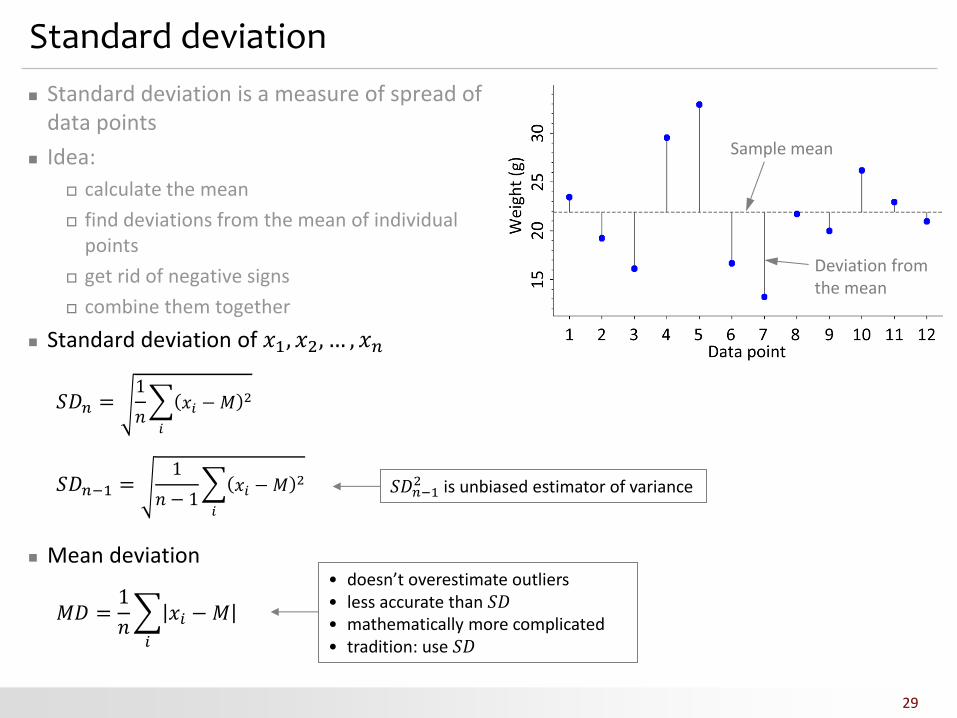
Standard deviation
Standard deviation is a measure of spread of data points
Idea:
calculate the mean
find deviations from the mean of individual points
get rid of negative signs
combine them together
Sample mean
Deviation from the mean
29
Standard deviation
Standard deviation is a measure of spread of data points
Idea:
calculate the mean
find deviations from the mean of individual points
get rid of negative signs
combine them together
Standard deviation of 𝑥1, 𝑥2, … , 𝑥𝑛
𝑆𝐷𝑛 =1
𝑛 𝑥𝑖 −𝑀
2
𝑖
𝑆𝐷𝑛−1 =1
𝑛 − 1 𝑥𝑖 −𝑀
2
𝑖
Mean deviation
𝑀𝐷 =1
𝑛 𝑥𝑖 −𝑀
𝑖
𝑆𝐷𝑛−12 is unbiased estimator of variance
• doesn’t overestimate outliers • less accurate than 𝑆𝐷 • mathematically more complicated • tradition: use 𝑆𝐷
Sample mean
Deviation from the mean

Standard error of the mean
Gedankenexperiment
Consider a population of mice with normally distributed body weight with 𝜇 = 20 g and 𝜎 = 5 g
Take a sample of 5 mice
Calculate sample mean, 𝑀
Repeat many times
Plot distributions of sample means
30
Distribution of sample means
Sam
ple
no
. N
orm
aliz
ed f
req
uen
cy

Standard error of the mean
Gedankenexperiment
Consider a population of mice with normally distributed body weight with 𝜇 = 20 g and 𝜎 = 5 g
Take a sample of 30 mice
Calculate sample mean, 𝑀
Repeat many times
Plot distributions of sample means
31
Distribution of sample means
Sam
ple
no
. N
orm
aliz
ed f
req
uen
cy

Standard error of the mean
Distribution of sample means is called sampling distribution of the mean
The larger the sample, the narrower the sampling distribution
Sampling distribution is Gaussian, with standard deviation
𝜎𝑚 =𝜎
𝑛
Hence, uncertainty of the mean can be estimated by
𝑆𝐸 =𝑆𝐷
𝑛
Standard error estimates the width of the sampling distribution
32
Sampling distribution of the mean
Sam
ple
no
. N
orm
aliz
ed f
req
uen
cy

Standard error of the mean
33
34
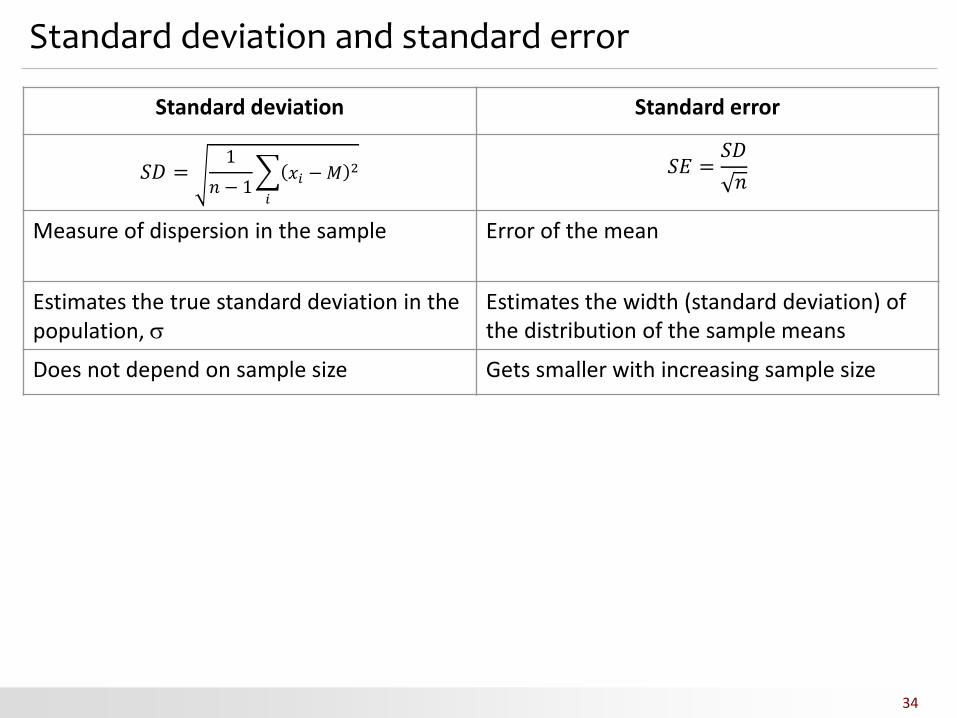
Standard deviation and standard error
Standard deviation Standard error
𝑆𝐷 =1
𝑛 − 1 𝑥𝑖 −𝑀
2
𝑖
𝑆𝐸 =𝑆𝐷
𝑛
Measure of dispersion in the sample Error of the mean
Estimates the true standard deviation in the population,
Estimates the width (standard deviation) of the distribution of the sample means
Does not depend on sample size Gets smaller with increasing sample size
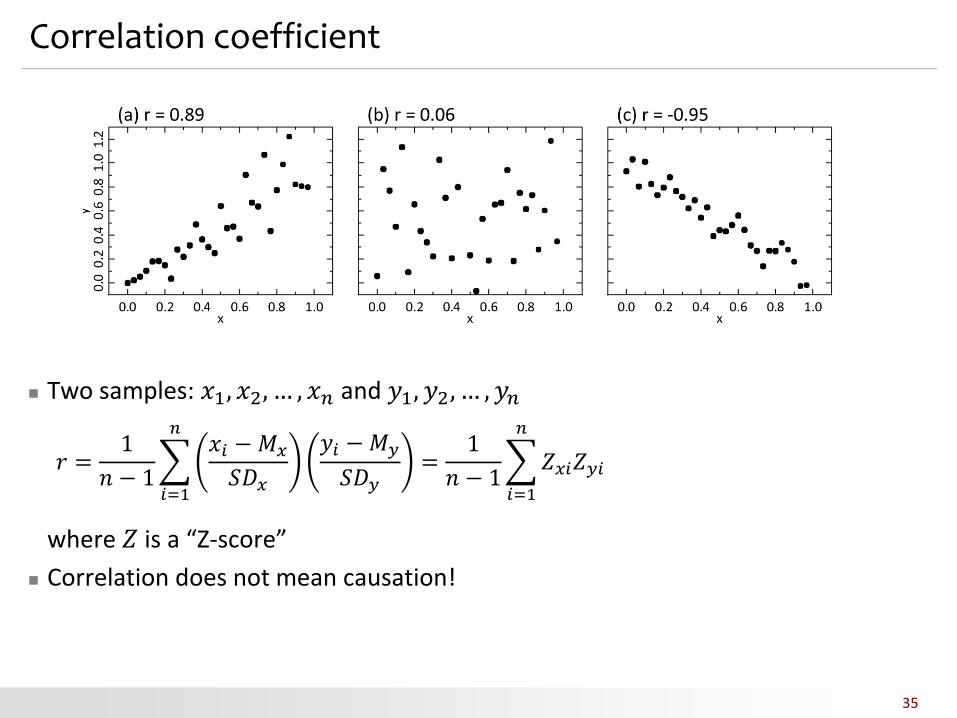
Correlation coefficient
Two samples: 𝑥1, 𝑥2, … , 𝑥𝑛 and 𝑦1, 𝑦2, … , 𝑦𝑛
𝑟 =1
𝑛 − 1 𝑥𝑖 −𝑀𝑥𝑆𝐷𝑥
𝑦𝑖 −𝑀𝑦
𝑆𝐷𝑦
𝑛
𝑖=1
=1
𝑛 − 1 𝑍𝑥𝑖𝑍𝑦𝑖
𝑛
𝑖=1
where 𝑍 is a “Z-score”
Correlation does not mean causation!
35

Correlation coefficient: example
𝑥 𝑦 𝑍𝑥 𝑍𝑦 𝑍𝑥𝑍𝑦
0.01 0.01 -1.35 -1.24 1.68
0.24 0.22 -0.64 -0.74 0.48
0.25 0.26 -0.62 -0.64 0.40
0.66 0.75 0.62 0.53 0.33
0.75 0.98 0.89 1.09 0.97
0.81 0.95 1.10 1.02 1.11
36
𝑍𝑥𝑍𝑦 = 4.96
𝑥 𝑦 𝑍𝑥 𝑍𝑦 𝑍𝑥𝑍𝑦
0.45 0.74 -1.72 0.57 -0.98
0.60 0.19 -0.54 -0.72 0.39
0.68 0.00 0.05 -1.14 -0.06
0.73 0.98 0.47 1.14 0.54
0.77 0.15 0.77 -0.81 -0.63
0.80 0.90 0.96 0.95 0.92 𝑍𝑥𝑍𝑦 = 0.18
𝑟 =1
𝑛 − 1 𝑍𝑥𝑖𝑍𝑦𝑖
𝑛
𝑖=1

Statistical estimators
37
Central point
Mean Geometric mean Harmonic mean Median Mode Trimmed mean
Dispersion
Variance Standard deviation Mean deviation Range Interquartile range Mean difference
Symmetry
Skewness Kurtosis
Dependence
Pearson’s correlation Rank correlation Distance

Hand-outs available at http://is.gd/statlec
Please leave your feedback forms on the table by the door