Marcos Antonio Almeida Santos MD, PhD - Stata · Marcos Antonio Almeida Santos MD, PhD Tenured...
38
Marcos Antonio Almeida Santos MD, PhD Tenured Professor at Universidade Tiradentes (UNIT) – Brazil General physician and cardiologist at Clínica & Hospital São Lucas – Aracaju (SE) Senior Teaching Assistant in PPCR Course at Harvard T.H.Chan School of Public Health - USA
Transcript of Marcos Antonio Almeida Santos MD, PhD - Stata · Marcos Antonio Almeida Santos MD, PhD Tenured...

Marcos Antonio Almeida Santos MD, PhD
Tenured Professor at Universidade Tiradentes (UNIT) – Brazil
General physician and cardiologist at Clínica & Hospital São Lucas – Aracaju (SE)
Senior Teaching Assistant in PPCR Course at Harvard T.H.Chan School of Public Health - USA

Marcos Antonio Almeida Santos has no relevant conflict of interest related to the content of this presentation;
The views expressed in this presentation do not necessarily reflect the views of the institutions.
Marcos Almeida - SEM Models in Health Sciences 2016 Brazilian Stata Users Group Meeting 2

In health sciences, relevant issues are handled with complex questionnaires;
These questionnaires oftentimes present dozens of indicators under Likert scales;
However, Likert scales can be challenging to curb with an overarching “regression” approach;
What is more, ordinal in principle, they usually present a skewed distribution, which may remain after algebraic transformation in 20-point or 100-point scales.
Marcos Almeida - SEM Models in Health Sciences 2016 Brazilian Stata Users Group Meeting 3
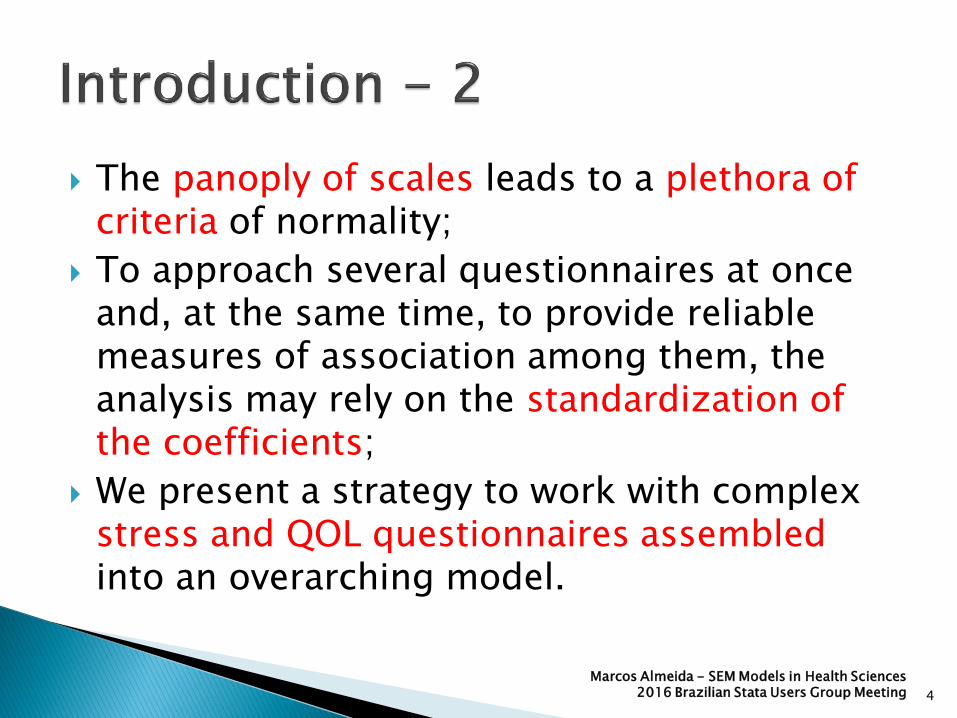
The panoply of scales leads to a plethora of criteria of normality;
To approach several questionnaires at once and, at the same time, to provide reliable measures of association among them, the analysis may rely on the standardization of the coefficients;
We present a strategy to work with complex stress and QOL questionnaires assembled into an overarching model.
Marcos Almeida - SEM Models in Health Sciences 2016 Brazilian Stata Users Group Meeting 4

Questionnaire WHOQOL-BREF: Quality of life – Developed by the WHO (1996); Number of questions: 26; Likert scale: scores from 1 to 5: (1 = not at all; 2 = not
much; 3 = moderately; 4 = a great deal; 5= completely ). Negatively phrased items (3): Q3, Q4 and Q26; Four Domains + Self-appraisal: Physical = mean (Q3r, Q4r, Q10, Q15, Q16, Q17, Q18); Psychological = mean (Q5,Q6,Q7,Q11,Q19,Q26r); Social relationships = mean(Q20,Q21,Q22); Environment = mean (Q8,Q9,Q12,Q13,Q14,Q23,Q24,Q25); Self-appraisal = mean (Q1,Q2). Scores lately *4 (range: 4-20) or a scale 0-100.
Marcos Almeida - SEM Models in Health Sciences 2016 Brazilian Stata Users Group Meeting 5

Questionnaire ISSL:
Inventory of Symptoms of Stress – Lipp
Number of questions: 53;
Binary variables (0 or 1);
Physical = 34; psychological 19;
Results used as: # positive questions;
Three Domains:
Alertness (15 Qs): range 0–15; >3 = yes;
Resistance+near exhaustion (15 Qs): range 0–15; >6 = yes;
Exhaustion (23 Qs): range 0–23; >8 = yes.
Marcos Almeida - SEM Models in Health Sciences 2016 Brazilian Stata Users Group Meeting 6

WHOQOL-BREF: QOL
26 Qs;
Likert scale (1-5) turned into a 4-20 range;
Negatively phrased Qs recoded.
Scale 4-20 selected.
Parceling in five “independent” domains;*
But...we aggregate the analysis leaving each domain as an “endogenous variable” associated with the latent variable QOL.
ISSL: STRESS 53 Qs; Dichotomous variables Sum of + answers; Scale of similar range; Parceling in three
domains;* But... instead of
categorizing QOL according to scores from each domain (binary “yes-no” or prevalent domain), we leave the domains as “reflective indicators” associated with Stress as a latent variable.
Marcos Almeida - SEM Models in Health Sciences 2016 Brazilian Stata Users Group Meeting 7
*Up to this point, following guidelines of each questionnaire.

Marcos Almeida - SEM Models in Health Sciences 2016 Brazilian Stata Users Group Meeting 8
Alertness (d1)
Resistance
up to near exhaustion
(d2)
Exhaustion (d3)
Social (d7)
Psychological (d6)
Environment (d8)
Physical health (d5)
Self-appraisal
(d4) Stress
Quality of Life ?
??
?

CFA under SEM;
Two latent variables were created as reflective “exogenous” factors: QOL and stress;
Parceling: questions from the respective questionnaires were used to create an “aggregate” arrangement, according to the specifications;
Selection of scales of similar range;
Thence, the number of loadings was decreased by parceling items by similarity and treating these parceled constructs as “endogenous” variables.
Marcos Almeida - SEM Models in Health Sciences
2016 Brazilian Stata Users Group Meeting 9

1. Parceling, checking severe departs from normality, selecting estimation method (ML);
2. Avoiding identification issues: ideally, at least 3 parcelled endogenous variables for each latent one;
3. Modeling “full” data (around 600 individuals): a) From a simple model up to a more complex one; b) Checking GOF parameters up to the “best fit”; c) Adding variance-covariance terms according to the rationale as well as the modification indices and convergence isssues.
4. Re-starting with random sub-samples: checking model’s reliability as well as performance of GOF parameters under progressively smaller sample sizes.
Marcos Almeida - SEM Models in Health Sciences 2016 Brazilian Stata Users Group Meeting 10

Immediate set of commands that creates a “compact data set”:
Allows Stata users to reproduce original data;
Data shared between statisticians or sent to reviewers (since it preserves confidentiality);
May be applied in the modeling strategy;
Used to perform GOF tests, etc.
Warning: it applies to sem, but not gsem.
Marcos Almeida - SEM Models in Health Sciences 2016 Brazilian Stata Users Group Meeting 11

. ssd init d1 d2 d3 d4 d5 d6 d7 d8
. ssd set observations 597
. ssd set means 2.963149 4.396985 4.574539 14.47236 14.2846 ///
13.75366 14.64992 11.93786
. ssd set sd 2.120208 2.820382 3.512665 2.733951 2.422642 ///
2.813333 3.234396 2.25064
. ssd set correlations 1.0 \ ///
0.5965 1.0000\ ///
0.5870 0.8156 1.0000\ ///
-0.2583 -0.4770 -0.4415 1.0000\ ///
-0.2184 -0.4368 -0.4971 0.5983 1.0000\ ///
-0.0994 -0.2326 -0.2406 0.4364 0.5241 1.0000\ ///
-0.1015 -0.2528 -0.2354 0.4823 0.5033 0.4730 1.0000\ ///
-0.2141 -0.3555 -0.3299 0.4878 0.5233 0.3288 0.4641 1.0000
Marcos Almeida - SEM Models in Health Sciences 2016 Brazilian Stata Users Group Meeting 12

Marcos Almeida - SEM Models in Health Sciences 2016 Brazilian Stata Users Group Meeting 13

Marcos Almeida - SEM Models in Health Sciences 2016 Brazilian Stata Users Group Meeting 14
. sem (Stress -> d1, ) (Stress -> d2, ) (Stress -> d3, ) (QOL -> d4, ) (QOL
-> d5, ) (QOL -> d6, ) (QOL -> d7, ) (QOL -> d8, ), covstruct(_lexogenous,
diagonal) vce(oim) latent(Stress QOL ) cov( Stress*QOL) nocapslatent

Marcos Almeida - SEM Models in Health Sciences 2016 Brazilian Stata Users Group Meeting 15

. sem (Stress -> d1, ) (Stress -> d2, ) (Stress -> d3, ) (QOL -> d4, ) (QOL ->
d5, ) (QOL -> d6, ) (QOL -> d7, ) (QOL -> d8, ), covstruct(_lexogenous, diagonal)
vce(oim) standardized latent(Stress QOL ) cov( Stress*QOL) nocapslatent
Marcos Almeida - SEM Models in Health Sciences
2016 Brazilian Stata Users Group Meeting 16
* Interpreted as “beta weights”

Marcos Almeida - SEM Models in Health Sciences 2016 Brazilian Stata Users Group Meeting 17

Chi-square test: null hypothesis = accept the model (covariances between the matrix and the predicted model do not differ). There is no difference between the model and a saturated model. Check p-values and dfs;
RMSEA :Steiger-Lind Root Mean Square Error of Approximation;
CFI :Bentler Comparative Fit Index;
SRMR :Standardized Root Mean Square Residual.
Marcos Almeida - SEM Models in Health Sciences
2016 Brazilian Stata Users Group Meeting 18

Marcos Almeida - SEM Models in Health Sciences 2016 Brazilian Stata Users Group Meeting 19
“Ideal” values
Chi2 >0.05
RMSEA <0.05 Upper <0.10
CFI>=0.95
SRMR <= 0.10

Marcos Almeida - SEM Models in Health Sciences 2016 Brazilian Stata Users Group Meeting 20
. estat mindices

Marcos Almeida - SEM Models in Health Sciences 2016 Brazilian Stata Users Group Meeting 21
. sem (Stress -> d1, ) (Stress -> d2, ) (Stress -> d3, ) (QOL -> d4, ) (QOL -> d5, ) (QOL -> d6, ) (QOL -> d7, ) (QOL -> d8, ), covstruct(_lexogenous, diagonal) vce(oim) standardized latent(Stress QOL ) cov( Stress*QOL e.d1*e.d2 e.d1*e.d3 e.d4*e.d5 e.d4*e.d6 e.d4*e.d7 e.d4*e.d8 e.d5*e.d6 e.d5*e.d7 e.d5*e.d8 e.d6*e.d7 e.d7*e.d8) nocapslatent
X

Marcos Almeida - SEM Models in Health Sciences 2016 Brazilian Stata Users Group Meeting 22

Marcos Almeida - SEM Models in Health Sciences 2016 Brazilian Stata Users Group Meeting 23
. estat mindices
(no modification indices to report, all MI values
less than 3.841458820694123)
“Ideal” values
Chi2 >0.05
RMSEA <0.05 Upper <0.10
CFI>=0.95
SRMR <= 0.10
.sem (Stress -> d1, ) (Stress -> d2, ) (Stress -> d3, )
(QOL -> d4, ) (QOL -> d5, ) (QOL -> d6, ) (QOL -> d7, )
(QOL -> d8, ), covstruct(_lexogenous, diagonal) vce(oim)
standardized latent(Stress QOL ) cov( Stress*QOL
e.d1*e.d2 e.d1*e.d3 e.d2*e.d4 e.d2*e.d5 e.d3*e.d4
e.d3*e.d5 e.d4*e.d5 e.d4*e.d6 e.d4*e.d7 e.d4*e.d8
e.d5*e.d6 e.d5*e.d7 e.d5*e.d8 e.d6*e.d7 e.d7*e.d8)
nocapslatent

Marcos Almeida - SEM Models in Health Sciences 2016 Brazilian Stata Users Group Meeting 24
* Loadings > 0.40; p < 0.05
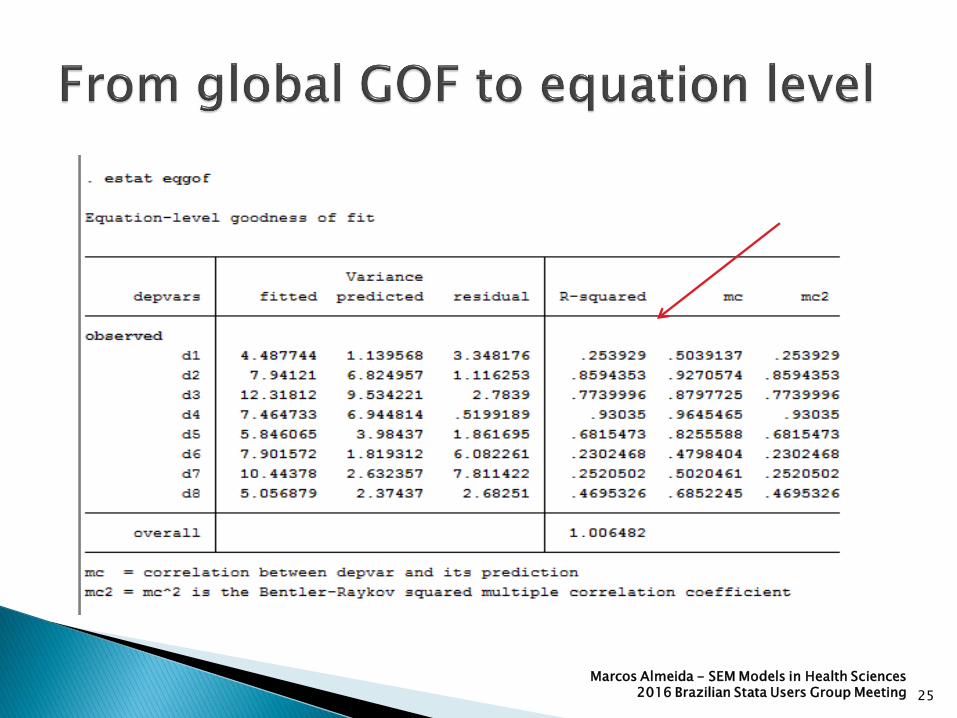
Marcos Almeida - SEM Models in Health Sciences 2016 Brazilian Stata Users Group Meeting 25

Marcos Almeida - SEM Models in Health Sciences 2016 Brazilian Stata Users Group Meeting 26

Marcos Almeida - SEM Models in Health Sciences 2016 Brazilian Stata Users Group Meeting 27
sem (Stress -> d1, ) (Stress -> d2, ) (Stress -> d3, ) (QOL -> d4, ) (QOL -> d5, ) (QOL -> d6, ) (QOL -
> d7, ) (QOL -> d8, ), covstruct(_lexogenous, diagonal) vce(oim) standardized latent(Stress QOL ) cov(
Stress*QOL e.d1*e.d2 e.d1*e.d3 e.d1*e.d6 e.d1*e.d7 e.d2*e.d4 e.d2*e.d5 e.d3*e.d4 e.d3*e.d5 e.d4*e.d5
e.d4*e.d6 e.d4*e.d7 e.d4*e.d8 e.d5*e.d6 e.d5*e.d7 e.d5*e.d8 e.d6*e.d7 e.d7*e.d8) nocapslatent

Marcos Almeida - SEM Models in Health Sciences 2016 Brazilian Stata Users Group Meeting 28

Full model (OIM): . sem (Stress -> d1, ) (Stress -> d2, ) (Stress -> d3,) (QOL -> d4, ) (QOL -> d5, ) (QOL -> d6, ) (QOL -> d7, ) (QOL -> d8, ), covstruct(_lexogenous, diagonal) latent(Stress QOL ) cov( Stress*QOL e.d1*e.d2 e.d1*e.d3 e.d2*e.d4 e.d2*e.d5 e.d3*e.d4 e.d3*e.d5 e.d4*e.d5 e.d4*e.d6 e.d4*e.d7 e.d4*e.d8 e.d5*e.d6 e.d5*e.d7 e.d5*e.d8 e.d6*e.d7 e.d7*e.d8) nocapslatent
. estat gof, stats(all)
Models n (random) = 400, 300, 200, 100,75: . set seed 12345
. sample 400, count
(…)
. estat gof, stats(all)
Note: when the model fails to converge, start from a simpler model.
Marcos Almeida - SEM Models in Health Sciences
2016 Brazilian Stata Users Group Meeting 29

Test/ n 600 400* 300* 200** 100 ** 75****
z: p > 0.05 loadings
- - - - Stress-d1 (0.074)
-
p for Chi2 0.304 0.193 0.129 0.642 0.336 0.280
RMSEA 0.019 0.037 0.052 <0.001*** 0.038 0.047
Upper 0.067 0.091 0.112 0.081 0.162 0.116
CFI 1.000 0.999 0.997 1.000 0.999 0.988
SRMR 0.003 0.010 0.003 0.008 0.022 0.060
Stress- QOL - 0.55 - 0.65 -0.59 -0.60 -0.73 - 0.56
IC 95% -0.65 -0.44
-0.80 -0.50
-0.76 -0.42
-0.80 -0.41
-1.11 -0.34
-0.75 -0.38
Marcos Almeida - SEM Models in Health Sciences 2016 Brazilian Stata Users Group Meeting 30
*Lower n leads to higher RMSEA **Simplified : covariance between d2-d5 excluded due to failure to converge.
***Increase in df leads to lower RMSEA. ****Basic model (slide 13).

Marcos Almeida - SEM Models in Health Sciences 2016 Brazilian Stata Users Group Meeting 31
0.5
11.5
0.5
11.5
d1 d2 d3 d4 d5 d6 d7 d8 d1 d2 d3 d4 d5 d6 d7 d8 d1 d2 d3 d4 d5 d6 d7 d8
full m400 m300
m200 m100 m75
IC 95%coef
indicator
Graphs by model (sample size from 600 to 75)

Marcos Almeida - SEM Models in Health Sciences 2016 Brazilian Stata Users Group Meeting 32
-1.2
-1-.
8-.
6-.
4
full m400 m300 m200 m100 m75
Model (sample size from 600 to 75)
IC 95%coef

Be aware the GOF tests are “global fit” tests;
Maximum likelihood - ml - estimation works well under non-severe departs from normality of distribution and provides the widest array of GOF tests and postestimations;
Under Likert scales, the option vce(robust) shall be taken into consideration;
With an important fraction of missing values, the option – mlmv – is suggested so as to avoid listwise deletion and decrease of power;
Marcos Almeida - SEM Models in Health Sciences 2016 Brazilian Stata Users Group Meeting 33
Evaluating p-values from a chi-square test assumes there is an overidentified model (df >0) to “improve”;
The “best” set of GOF parameters as well as the “ideal” values of each one of the GOF statistics, let alone the relevance, are topics under debate;
Respecification (or overparameterization) of a model shall be fundamentally based on the rationale, rather than on residuals or GOF tests;
In this case study, some differences between models may be due to the random sampling.
Marcos Almeida - SEM Models in Health Sciences 2016 Brazilian Stata Users Group Meeting 34

Complex and combined questionnaries can be parceled and analysed under SEM models;
Most GOF tests were somewhat “stable” in spite of a decrease in the sample size;
Researchers are supposed to present the results under unstandardized and standardized ways;
Do not be “selective” when presenting GOF tests;
RMSEA and its upper bound “signalled” earlier a potential lack of fit due to small sample size (but “N” is part of the denominators in the formula).
Marcos Almeida - SEM Models in Health Sciences 2016 Brazilian Stata Users Group Meeting 35

Point estimates (for example, those related to the covariance between the latent variables) tended to keep a reasonal level of “stability” when decreasing the sample size;
Confidence intervals increased, accordingly;
Under small sample sizes, a more simplified model performed better (and loadings were more similar to the “full” model) than a model with a slighly larger sample size, yet still “complex” in terms of the number of covariances;
This can be one of the strategies to tackle nonconvergence under short sample size.
Marcos Almeida - SEM Models in Health Sciences 2016 Brazilian Stata Users Group Meeting 36

The WHOQOL Group. World Health Organization. WHOQOL: measuring
quality of life. Geneva: WHO; 1997 (MAS/MNH/PSF/97.4). Also in: http://www.who.int/substance_abuse/research_tools/whoqolbref/en/
Lipp, M. E. N. & Guevara, A. J. H. 1994. Text in portuguese. Validação
empírica do Inventário de Sintomas de Stress. Estudos de Psicologia, 11(3), 43-49.
Acock, Alan C. 2013. Discovering Structural Equation Modeling Using
Stata. Revised edition. StataPress. Kline, Rex B. 2016. Principles and Practice of Structural Equation
Modeling. Fourth edition. Guilford. StataCorp. Structural Equation Modeling Reference Manual.
Downloadable at: http://www.stata.com/bookstore/structural-equation-modeling-reference-manual/
Marcos Almeida - SEM Models in Health Sciences 2016 Brazilian Stata Users Group Meeting 37

Thank you!
Contact:
Marcos Almeida, MD PhD
Email: [email protected]
Marcos Almeida - SEM Models in Health Sciences 2016 Brazilian Stata Users Group Meeting 38