
March 2017 Péter Kotek Senior Research Associate -...
15
Introduction of REKK EGMM March 2017 Péter Kotek Senior Research Associate
Transcript of March 2017 Péter Kotek Senior Research Associate -...

Introduction of REKK EGMM
March 2017
Péter Kotek
Senior Research Associate

REKK
at Corvinus University of Budapest
• 20 full-time researchers ‣ Electricity
‣ Natural gas
‣ District heating
‣ Renewable energy
‣ Water economics
• Applied research and consulting‣ Gas and electricity market modelling,
Central Eastern European (CEE) focus
‣ Market participants, regulators and TSOs in CEE region
‣ Strong cooperation with European Commission
• Training activities‣ More than 2000 students enrolled to
trainings facilitated by REKK and ERRA since 2004
‣ Global coverage – besides Europe regulators and industry experts from Africa, Middle East and Central Asia
• Think Tank activities‣ Conferences and workshops with a
CEE market focuswww.rekk.hu
2

European Gas Market Model –
major characteristics
• Whole Europe (35 countries) is modelled
• Competitive prices by countries; price modelled for each 12 months
• Trade is based on long term contracts and spot trade within the EU and with exogenous countries and global LNG market (NO, RU, TR, LNG)
• Natural gas flows and congestions on interconnectors
• Physical constraints are interconnection capacities (transmission tariffs are also included)
• Trade constraints: TOP obligations with flexibility
• Domestic production and storage facilities are included
• Arrows: modelled gas flows
• LNG market representation is linked to Asian LNG prices
3
Wholesale gas
price, €/MWh
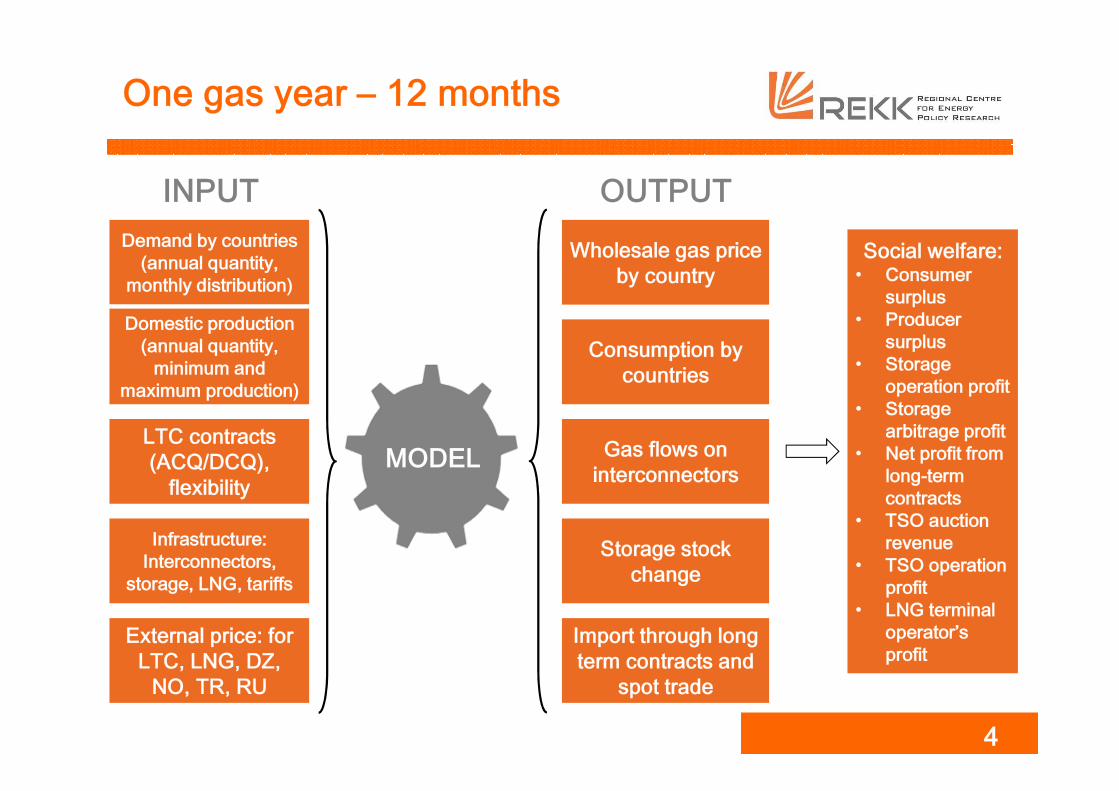
One gas year – 12 months
4
INPUT
Demand by countries
(annual quantity,
monthly distribution)
Domestic production
(annual quantity,
minimum and
maximum production)
LTC contracts
(ACQ/DCQ),
flexibility
Infrastructure:
Interconnectors,
storage, LNG, tariffs
External price: for
LTC, LNG, DZ,
NO, TR, RU
Wholesale gas price
by country
Consumption by
countries
Gas flows on
interconnectors
Storage stock
change
Import through long
term contracts and
spot trade
OUTPUT
MODEL
Social welfare:• Consumer
surplus
• Producer
surplus
• Storage
operation profit
• Storage
arbitrage profit
• Net profit from
long-term
contracts
• TSO auction
revenue
• TSO operation
profit
• LNG terminal
operator’s
profit

A simple model of spot LNG pricing for
Europe (in EUR/MWh)
AUS EU ASIA AUS ASIA AUS EU
LNG SPOT SHIPM SHIPMP P C C→ → →
= − +
17,2AUS EU
LNGP→
=
5
Europe (UK)
Asia (Japan)
Spot price: 13
Australia
Shipm cost:
1.3
Norway
Shipm cost: 0.5
LNG Supply to Europe
8.9
14.9
quantity
Price,
EUR/
MWh
NO LNG
Cap
AUS LNG
Cap
Global LNG market is
represented by shipment
cost adjusted Japan
LNG prices������→��
= 8.9
�������→��
= 14.9

Examples of model usage
1. Effects of increased LNG supply to European
prices (study)
2. Nord Stream expansion and infrastructure
investment in Europe (study)
3. New infrastructure project evaluation (CBA)
(study)
6

1. Increased LNG flows to Europe split the Western
and Eastern market due to bottlenecks
7
• We modelled the price effects of
increased LNG flows in our 2016
reference
• Due to infrastructural constraints
(no LNG terminal and high tariffs
on interconnectors) in the region,
DR countries benefit less than
the EU as a whole
• DR countries may not receive
actual LNG „molecule”, but other
spot gas crowded out in Western
Europe by cheaper LNG sources
• Average EU wholesale gas price
might decrease below 12 €/MWh
at LNG flows of 140 bcm/year;
DR prices are 7% higher
• Average DR price covers large
differences in individual prices• Main beneficiaries of larger
flows include DE (through NL),
AT (through IT and DE) and SI
(through AT and IT)
516624
758
1036
1217
1380~
50
bcm
~6
5 b
cm
~8
0 b
cm
~1
10
bcm
~1
25
bcm
~1
40
bcm
10
11
12
13
14
15
16
0
200
400
600
800
1000
1200
1400
1600
EUR/M
Wh
TWh
Total LNG flow DR avg price EU avg price
REF 2016
LNG flows
(bcm/year)
Price change (%)
~50 bcm ~65 bcm ~80 bcm ~110 bcm ~125 bcm ~140 bcm
AT 0% -5% -8% -12% -15% -20%
BA 0% 0% 0% -1% -4% -5%
BG 0% 0% 0% 0% 0% 0%
CZ 0% -3% -6% -8% -13% -18%
DE 0% -4% -7% -11% -15% -21%
HR 0% -3% -6% -9% -13% -15%
HU 0% -2% -3% -5% -8% -11%
MD 0% -1% -1% -3% -5% -8%
RO 0% 0% 0% -1% -1% -1%
RS 0% -1% -2% -4% -7% -9%
SI 0% -4% -8% -12% -16% -19%
SK 0% -2% -4% -7% -11% -15%
UA 0% -1% -2% -4% -6% -9%
DR 0% -3% -5% -8% -12% -16%
EU 0% -3% -7% -11% -16% -22%

2. Nord Stream 2 project divides Europe
• Scenario assumptions‣ Realisation of Nord Stream 2,
doubling current capacity to 110 bcm/year
‣ Most long-term Russian contracts assumed to re-routed (RU-AT, RU-BA, RU-CZ, RU-FR, RU-DE, RU-HU, RU-IT, RU-RS, RU-SK, RU-SI)
‣ LTCs crossing the Balkans route and Ukraine are kept intact (RU-UA, RU-RO, RU-BG, RU-MK, RU-GR, RU-TR)
‣ Delivery point is at the border of each country
‣ Price of Russian gas delivered is unchanged for all contracts
• Nord Stream expansion effects‣ General price increase in Danube
Region and CSEE
‣ Marginal price drop in Western Europe
8
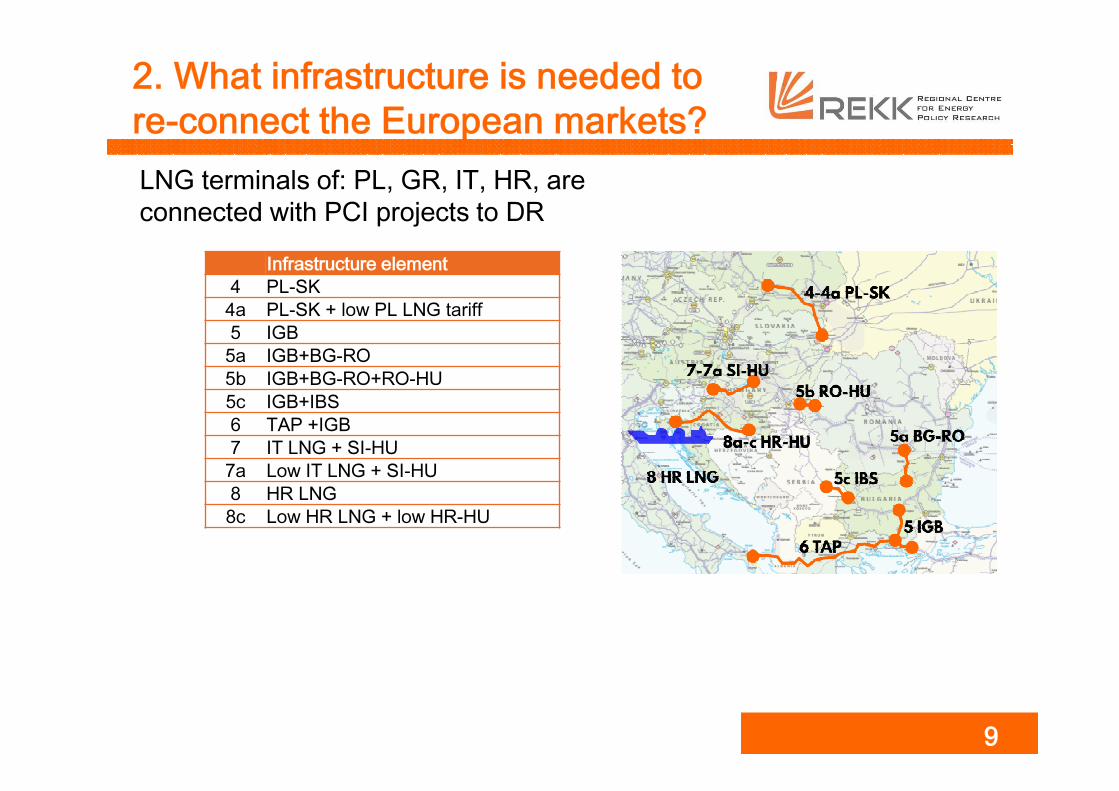
2. What infrastructure is needed to
re-connect the European markets?
LNG terminals of: PL, GR, IT, HR, are
connected with PCI projects to DR
9
Infrastructure element
4 PL-SK
4a PL-SK + low PL LNG tariff
5 IGB
5a IGB+BG-RO
5b IGB+BG-RO+RO-HU
5c IGB+IBS
6 TAP +IGB
7 IT LNG + SI-HU
7a Low IT LNG + SI-HU
8 HR LNG
8c Low HR LNG + low HR-HU

2. Nord Stream 2 creates additional
investment needs
• Total welfare change to reference was considered the benefit of the project
• Investment was made in t-1
• Benefits were awarded for a 25 year lifetime
• Projects with positive social NPV in base case (without Nord Stream):
‣ IGB
‣ IGB with TAP
‣ HR LNG
• Nord Stream causes general price hike in the region, thus any new infrastructure has stronger welfare effect
• Additional investment need ~1000 Mn EUR with NS expansion
Social NPV, M€
Without NS With NS
PL-SK -521 -456
PL-SK low -702 -514
IGB 261 1145
IGB+BG-RO -262 495
IGB+BG-RO+RO-HU -680 77
IGB+IBS -46 1296
IGB (with TAP) 236 1677
IT LNG +SIHU -128 -74
low IT LNG +SIHU -303 -74
HR LNG 373 857
Low HR LNG+low HR-
HU 717 1625
10

3. Sample project evaluation
(CBA, social NPV)
Sensitivity for
NPVBest est. Flat oil
-10%
LNG
+10%
LNG
-50% in
EnC CP
-25% in
EnC CP
-20% in
Europe
-10% in
Europe
+10% in
Europe
+20% in
Europe
with-out
HR LNG
GAS_09
Utilization: from BG to RS 91%,
from RS to BG:2%
Project
codeCountry A Country B
Capacity, GWh/dDate
A→B B→A
GAS 09 BG RS 39 39 2019
Welfare change, M€
CO2,
M€
Inv.
cost,
M€
NPV,
M€Cons. Prod. Trad. Infra Total
AL 1 0 0 0 1 0 XXX 1
BA 18 0 -8 11 20 1 XXX 21
BG 68 -2 -72 364 358 1 XXX 313
GR -9 0 5 432 428 0 XXX 428
HR -4 1 -1 -45 -48 0 XXX -48
HU 218 -11 -143 -359 -294 4 XXX -290
IT 263 -24 -189 -3 47 4 XXX 51
KO* 0 0 0 0 0 0 XXX 0
ME 0 0 0 0 0 0 XXX 0
MK 7 0 -4 1 4 0 XXX 5
MD 7 0 0 1 7 0 XXX 7
PL 35 -9 -20 -1 4 1 XXX 5
RO 93 -57 -3 4 36 2 XXX 39
RS 273 -34 -147 102 193 14 XXX 138
SK 33 0 -41 -125 -132 1 XXX -131
UA 229 -164 -38 24 52 7 XXX 59
Region 1232 -300 -662 407 676 36 XXX 596
11

Model scheme
13
Local market 1
Local market 2
External market 2
D
S
P
Q
S
D
P
Q
External market 1
Market
price
spot
t=1 t=2 …
Quantity
Price
X
X
TO
P L
1
T-L1 T
OP
L2
spotLNG exporters
LNG

EGMM references
• Analysis of the CSEE gas storage market; the impact of system use charges on the demand for gas storage capacity (E.ON, 2012) and (Hungarian Min. of Foreign Affairs, 2013)
• CBA of PECI projects for the Energy Community (2013, 2016)
• The impact of gas infrastructure corridors on the regional gas market (MoFARoBoGo, March 2014), FGSZ South Stream (April 2014)
• Supply Security analyses related to the Ukrainian crisis (2014, Atlantic Council, EFET, IDDRI)
• How can renewables and energy efficiency improve gas security in selected Member States? (2015, Towards2030 – Dialogue project)
• CBA of PCI projects for the Hungarian Energy and Public Utility Regulatory Authority (2014-2015, Hungarian regulator)
• Measures To Increase The Flexibility And Resilience Of The European Natural Gas Market (2014, IEA)
• CESEC gas infrastructure corridor modelling (2015, European Commission)
• LNG receiving capability of Europe at different price scenarios and pricing strategies and infrastructure bottlenecks (2016 Danube region)
• Effect of tariffs on natural gas pipeline utilisation and flows in the CESEC region (2016, European Commission)
14

CBA and CBCA related references
• CBA of the PL-SK gas interconnector (Hungarian Regulator)
• CBA analysis of the RO-HU-AT gas corridor (Hungarian Regulator)
• Expert opinion on the Croatian (Krk) LNG CBA (Hungarian Regulator)
• CBA analysis of the HR-SI gas interconnector (Hungarian Regulator 2015)
• SI-HU interconnector (Slovenian TSO Plinovodi 2016)
• Evaluation of PECI infrastructure for Energy Community Secretariat (2016)
15