March 2015 Calgary and Area Real Estate Stats
21
Calgary & Area Real Estate Statistics: March 2015 1 Request Your Free Home Evaluation Today!
-
Upload
coldwell-banker-compete-real-estate -
Category
Real Estate
-
view
228 -
download
0
Transcript of March 2015 Calgary and Area Real Estate Stats

Calgary & Area
Real Estate
Statistics:
March 2015
1
Request Your Free Home
Evaluation Today!
TABLE OF CONTENTS
3
March Real Estate Summary
4 - 5
City of Calgary Detached Homes Sales Data
6 - 7
City of Calgary Attached Homes Sales Data
8 - 9
City of Calgary Apartment Homes Sales Data
10 - 11
Rural Rockyview Detached Sales Data
12
Message From The Calgary Real Estate Board
13 – 14
Rural Foothills Detached Sales Data
15 – 16
City of Airdrie Detached Sales Data
17 – 18
City of Airdrie Attached Sales Data
19 - 20
City of Airdrie Apartment Sales Data
2

Inventory Gains
Influence Housing Prices
First quarter activity reflects economic
uncertainty
Hooray! The sky is NOT falling! Please note that the absorption rates for detached properties in most of the reported market areas are over 22% AND in most cases the absorption rates have increased compared to February numbers. Because 2014 was a “Boom” sales year for Calgary Real Estate, even without the drop in the price of oil, the absorption rates in 2015 would have been lower. The data over the last five years show that in many of the reported markets we are not far off 2011 or 2012 absorption rates. In fact, the March absorption rates reflect a “normal” Calgary and surrounding areas market. For all of us who are involved in the residential real estate market, we know that a portion of our population will always marry divorce, have children, downsize, move up or away or move to Alberta, so there will always be demand. Anyone who buys property during this market cycle will have the good fortune of incredibly low financing rates making this a great time to purchase an investment property. If you are curious about the current market value of your home, or market conditions in general, please feel free to contact us. Hope this helps! Susanita de Diego
3

City of Calgary Detached Homes Sales Data
Yearly – March 2014 – March2015
The following table shows the City of Calgary Detached Homes Sales Data for each month since
March of last year.
Month/Year Detached
Sales
Previous Month End
Inventory + Inventory Added
During the Month
% of Available
Inventory Sold
Days on
Market
Months of
Supply
March 2014 1,506 1,469 + 1,963 = 3,432 43.88% 26 1.11
April 2014 1,532 1,675 + 2,252 = 3,927 39.01% 25 1.41
May 2014 1,774 2,155 + 2,575 = 4,730 37.51% 25 1.44
June 2014 1,549 2,554 + 2,280 = 4,834 32.04% 27 1.77
July 2014 1,362 2,737 + 1,861 = 4,598 29.62% 32 1.96
August 2014 1,278 2,674 + 1,792 = 4,466 28.62% 33 2.05
September 2014 1,224 2,616 + 1,868 = 4,484 27.30% 35 2.10
October 2014 1,290 2,571 + 1,626 = 4,197 30.74% 36 1.71
November 2014 1,033 2,205 + 1,126 = 3,331 31.01% 38 1.95
December 2015 607 2,015 + 763 = 2,778 21.85% 41 2.78
January 2015 535 1,687 +1,843 = 3,530 15.16% 37 4.68
February 2015 739 2,506 + 1,674 = 4,180 17.68% 34 3.99
March 2015 1,082 2,950 + 1,776 = 4,726 22.89% 37 2,79
City of Calgary Detached Homes Sales Data
Monthly – March 2011 – March 2015
The following table shows the City of Calgary Detached Homes Sales Data for each month since
March of last year.
Month/Year Detached Sales Previous Month End
Inventory + Inventory
Added During the Month
% of Available
Inventory Sold
Days on
Market
Months of
Supply
March 2011 1,221 3,342 + 2,174 = 5,516 22.14% 39 2.74
March 2012 1,412 2,784 + 2,111 = 4,895 28.85% 40 1.97
March 2013 1,304 1.929 + 2,007 = 3,936 33.13% 33 1.74
March 2014 1,506 1,469 + 1,963 = 3,432 43.88% 26 1.11
March 2015 1,082 2,950 + 1,776 = 4,726 22.89% 37 2.79
4
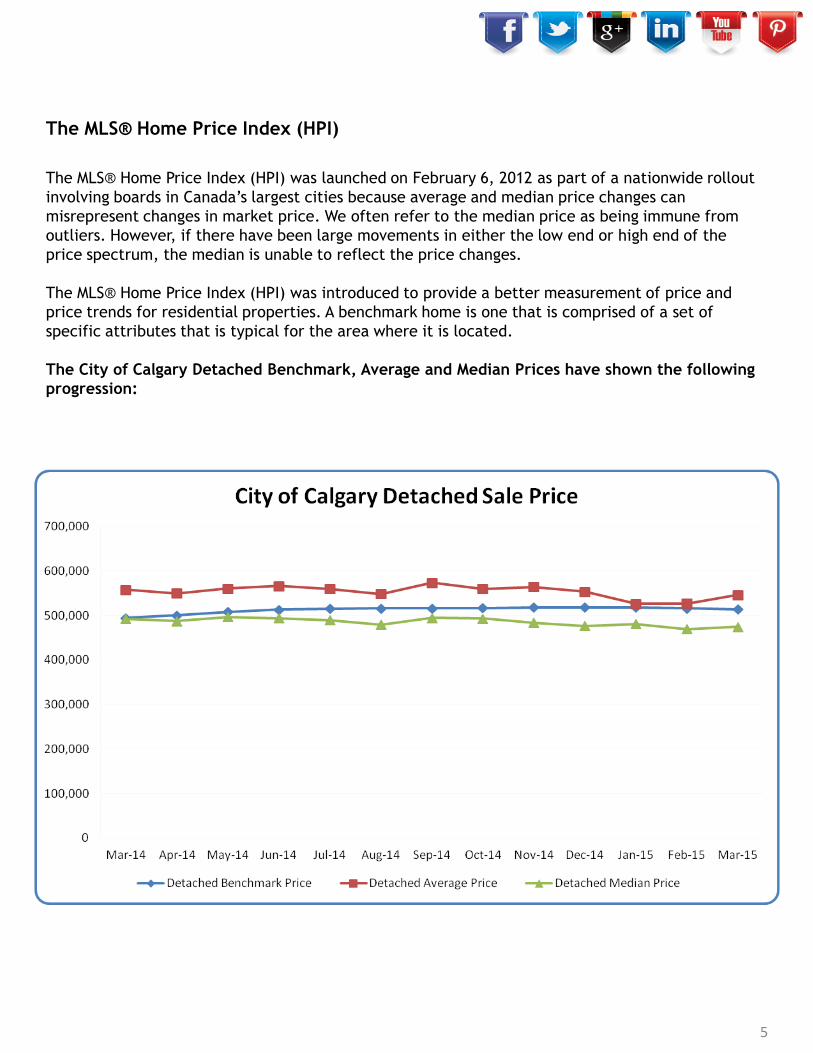
The MLS® Home Price Index (HPI)
The MLS® Home Price Index (HPI) was launched on February 6, 2012 as part of a nationwide rollout
involving boards in Canada’s largest cities because average and median price changes can
misrepresent changes in market price. We often refer to the median price as being immune from
outliers. However, if there have been large movements in either the low end or high end of the
price spectrum, the median is unable to reflect the price changes.
The MLS® Home Price Index (HPI) was introduced to provide a better measurement of price and
price trends for residential properties. A benchmark home is one that is comprised of a set of
specific attributes that is typical for the area where it is located.
The City of Calgary Detached Benchmark, Average and Median Prices have shown the following
progression:
5

City of Calgary Attached Homes Sales Data
Yearly – March 2014 – March 2015
The following table shows the City of Calgary Attached Homes Sales Data for each month since
March of last year.
Month/Year Attached
Sales
Previous Month End
Inventory + Inventory Added
During the Month
% of Available
Inventory Sold
Days on
Market
Months of
Supply
March 2014 523 532 + 685 = 1,217 42.97% 30 1.16
April 2014 553 607 + 807 = 1,141 48.47% 26 1.37
May 2014 656 758 + 934 = 1,692 38.77% 28 1.37
June 2014 635 901 + 816 = 1,717 36.98% 28 1.46
July 2014 518 925 + 695 = 1,620 31.98% 32 1.79
August 2014 529 925 + 699 = 1,624 32.57% 34 1.71
September 2014 487 905 + 699 = 1,604 30.36% 34 1.87
October 2014 466 910 + 671 = 1,581 29.48% 38 1.97
November 2014 419 918 + 489 = 1,407 29.78% 36 2.02
December 2015 252 845 + 315 = 1,160 21.72% 45 2.82
January 2015 190 711 + 700 = 1,411 13.47% 41 5.27
February 2015 261 1,001 + 681 = 1,682 15.52% 34 4.66
March 2015 397 1,231 + 689 = 1,920 20.68% 39 3.17
City of Calgary Attached Homes Sales Data
Monthly – March 2011 – March 2015
The following table shows the City of Calgary Attached Homes Sales Data for each month since
February of last year.
Month/Year Attached Sales Previous Month End
Inventory + Inventory
Added During the Month
% of Available
Inventory Sold
Days on
Market
Months of
Supply
March 2011 368 1,034 + 643 = 1,677 21.94% 47 2.99
March 2012 395 896 + 588 = 1,484 26.62% 45 2.38
March 2013 453 704 + 613 = 1,317 34.40% 36 1.68
March 2014 523 532 + 685 = 1,219 42.90% 30 1.16
March 2015 397 1,231 + 689 = 1,920 20.68% 39 3.17
6
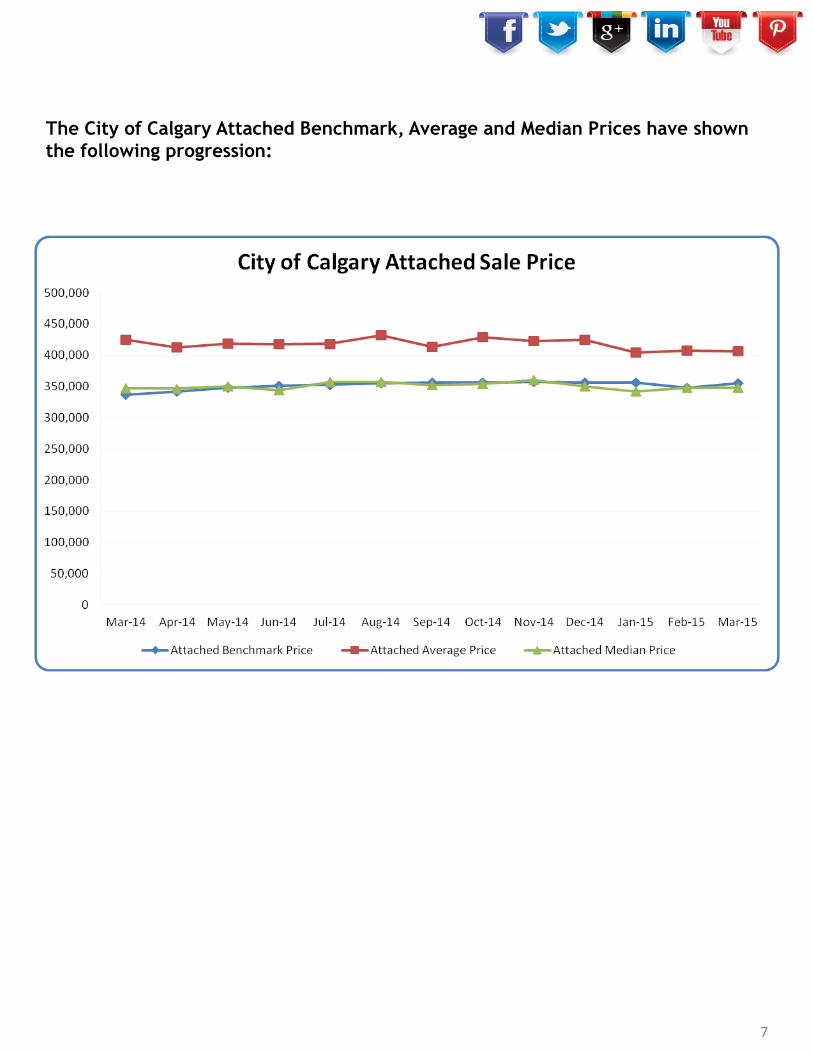
The City of Calgary Attached Benchmark, Average and Median Prices have shown
the following progression:
7
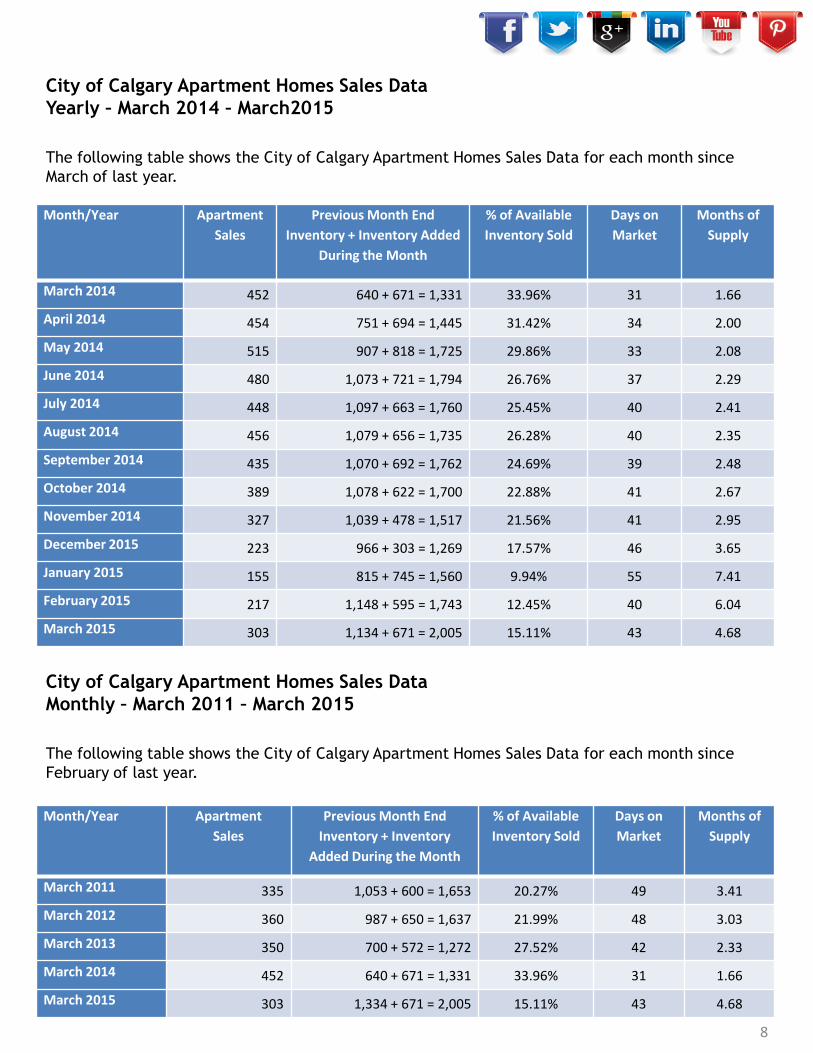
City of Calgary Apartment Homes Sales Data
Yearly – March 2014 – March2015
The following table shows the City of Calgary Apartment Homes Sales Data for each month since
March of last year.
Month/Year Apartment
Sales
Previous Month End
Inventory + Inventory Added
During the Month
% of Available
Inventory Sold
Days on
Market
Months of
Supply
March 2014 452 640 + 671 = 1,331 33.96% 31 1.66
April 2014 454 751 + 694 = 1,445 31.42% 34 2.00
May 2014 515 907 + 818 = 1,725 29.86% 33 2.08
June 2014 480 1,073 + 721 = 1,794 26.76% 37 2.29
July 2014 448 1,097 + 663 = 1,760 25.45% 40 2.41
August 2014 456 1,079 + 656 = 1,735 26.28% 40 2.35
September 2014 435 1,070 + 692 = 1,762 24.69% 39 2.48
October 2014 389 1,078 + 622 = 1,700 22.88% 41 2.67
November 2014 327 1,039 + 478 = 1,517 21.56% 41 2.95
December 2015 223 966 + 303 = 1,269 17.57% 46 3.65
January 2015 155 815 + 745 = 1,560 9.94% 55 7.41
February 2015 217 1,148 + 595 = 1,743 12.45% 40 6.04
March 2015 303 1,134 + 671 = 2,005 15.11% 43 4.68
City of Calgary Apartment Homes Sales Data
Monthly – March 2011 – March 2015
The following table shows the City of Calgary Apartment Homes Sales Data for each month since
February of last year.
Month/Year Apartment
Sales
Previous Month End
Inventory + Inventory
Added During the Month
% of Available
Inventory Sold
Days on
Market
Months of
Supply
March 2011 335 1,053 + 600 = 1,653 20.27% 49 3.41
March 2012 360 987 + 650 = 1,637 21.99% 48 3.03
March 2013 350 700 + 572 = 1,272 27.52% 42 2.33
March 2014 452 640 + 671 = 1,331 33.96% 31 1.66
March 2015 303 1,334 + 671 = 2,005 15.11% 43 4.68
8
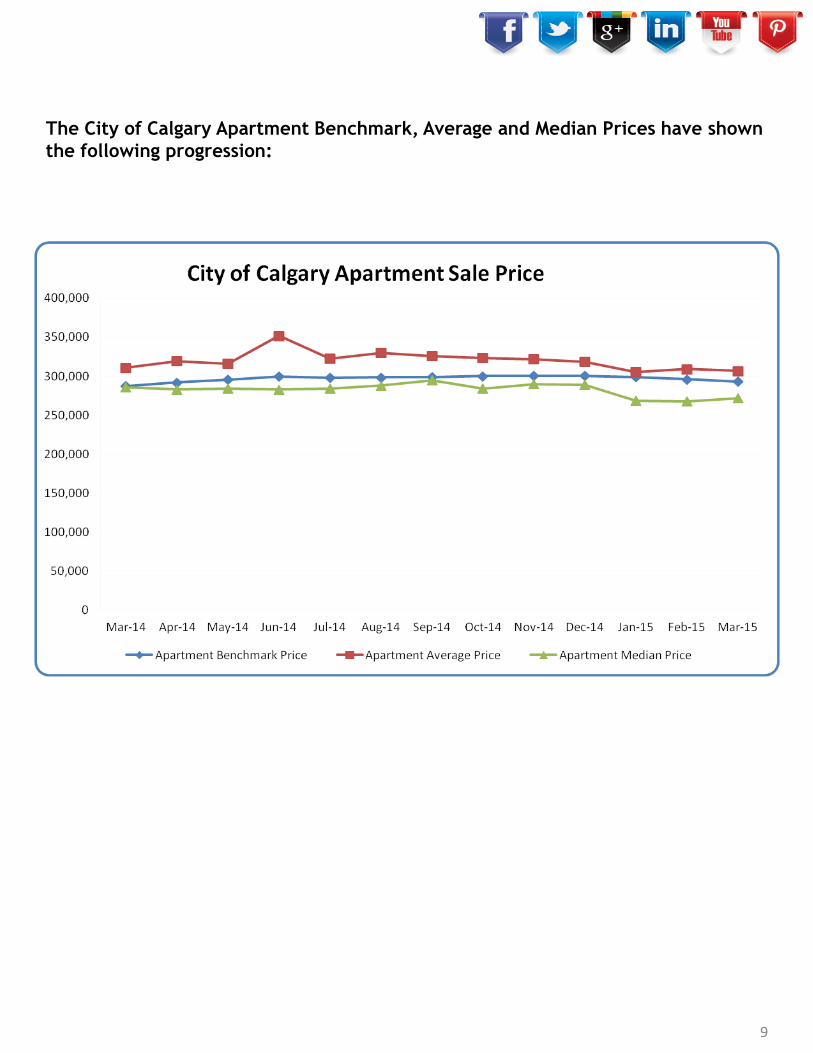
The City of Calgary Apartment Benchmark, Average and Median Prices have shown
the following progression:
9

Rural Rockyview Detached Sales Data
Yearly – March 2014 – March 2015
The following table shows the Rural Rockyview Detached Sales Data for each month since March of
last year.
Month/Year Detached
Sales
Previous Month End
Inventory + Inventory Added
During the Month
% of Available
Inventory Sold
Days on
Market
Months of
Supply
March 2014 49 283 + 100 = 383 12.79% 65 5.94
April 2014 47 291 + 89 = 380 12.37% 66 6.51
May 2014 58 306 + 133 = 439 13.21% 69 5.84
June 2014 38 339 + 126 = 465 8.17% 91 9.68
July 2014 45 368 + 83 = 451 9.98% 88 8.07
August 2014 41 363 + 75 = 438 9.36% 82 8.78
September 2014 46 360 + 86 = 446 10.31% 84 7.28
October 2014 37 335 + 69 = 404 9.16% 92 8.30
November 2014 10 307 + 49 = 356 2.81% 116 28.40
December 2015 15 284 + 31 = 315 4.76% 140 14.67
January 2015 19 220 + 88 = 308 6.17% 142 13.05
February 2015 20 248 + 76 = 324 6.17% 74 13.85
March 2015 23 277 + 82 = 359 6.41% 86 12.87
Rural Rockyview Detached Sales Data
Monthly – March 2011 – March 2015
The following table shows the Rural Rockyview Detached Sales Data for each month since March of
last year.
Month/Year Detached Sales Previous Month End
Inventory + Inventory
Added During the Month
% of Available
Inventory Sold
Days on
Market
Months of
Supply
March 2011 28 284 + 108 = 392 7.14% 79 12.07
March 2012 31 327 + 120 = 447 6.94% 84 12.16
March 2013 36 347 + 90 = 437 8.24% 95 10.14
March 2014 49 283 + 100 = 383 12.79% 65 5.94
March 2015 23 277 + 82 = 359 6.41% 86 12.87
10
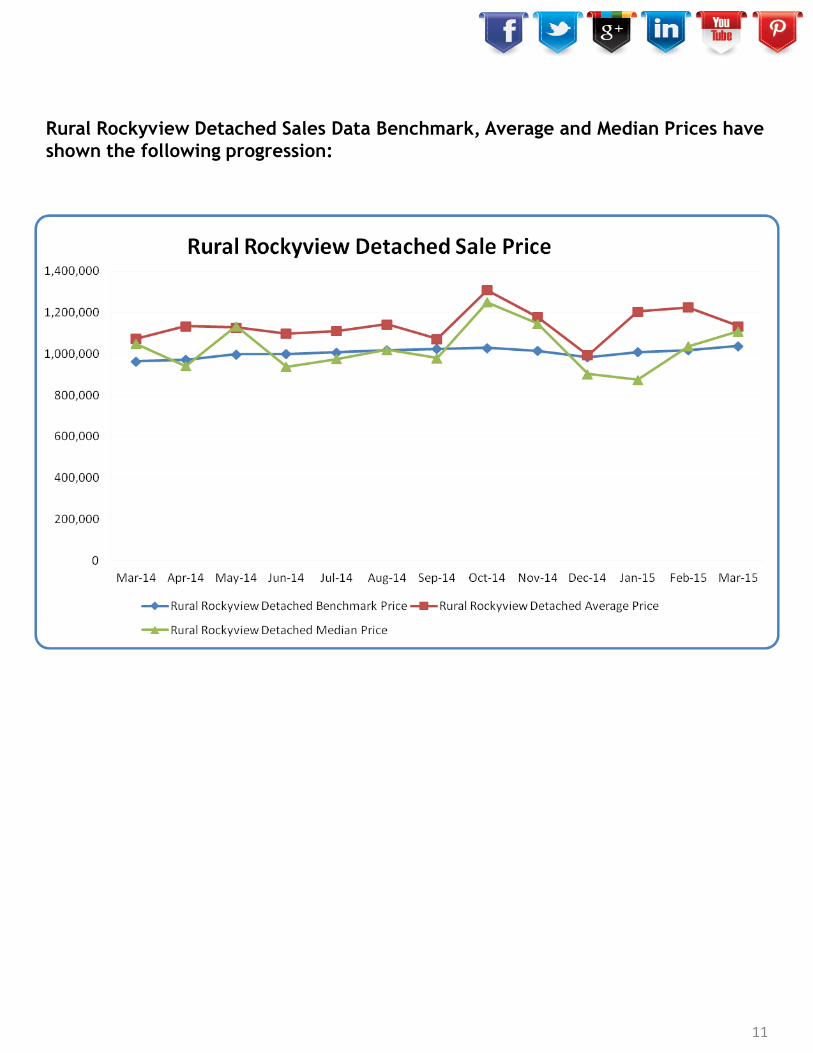
Rural Rockyview Detached Sales Data Benchmark, Average and Median Prices have
shown the following progression:
11

Based on current sales activity and rising supply
levels, the change in pricing does not come as a
surprise,” said CREB® chief economist Ann-
Marie Lurie. “However, the recent price
adjustments have not eroded all the higher
than expected price gains recorded last year.
While conditions have likely tempered growth
in new listings, further near term price
adjustments will be dependent on changes to
inventory levels.
“
” 12
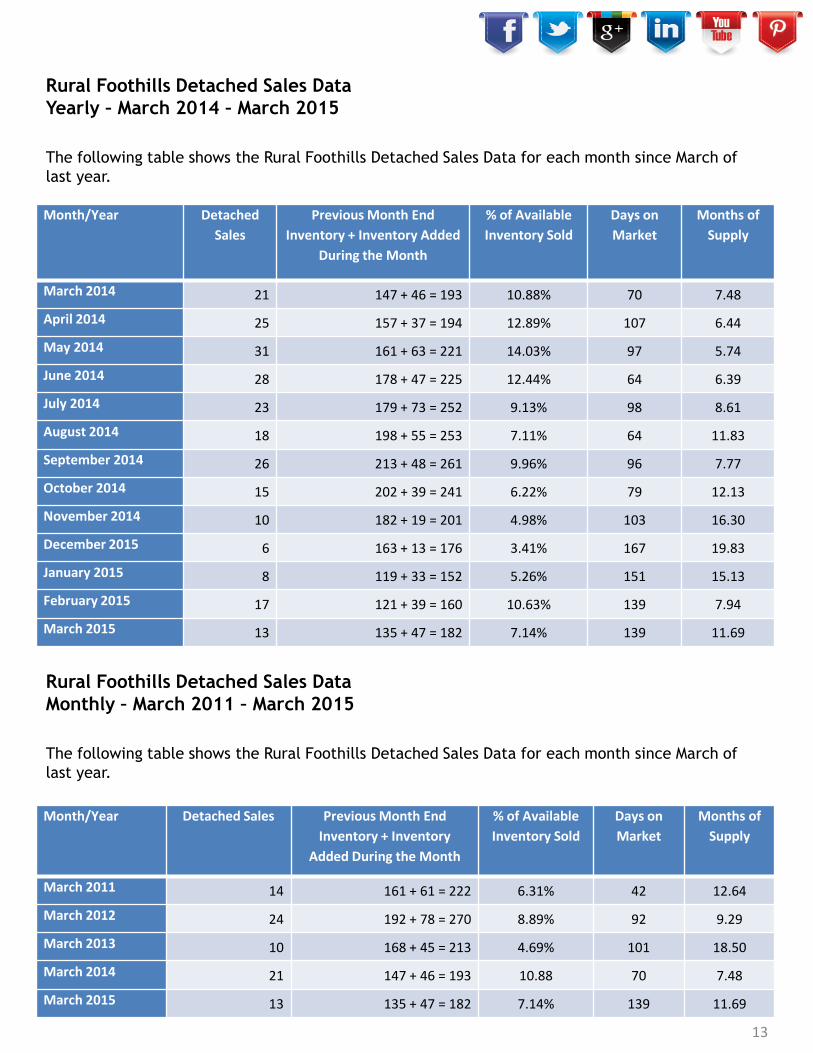
Rural Foothills Detached Sales Data
Yearly – March 2014 – March 2015
The following table shows the Rural Foothills Detached Sales Data for each month since March of
last year.
Month/Year Detached
Sales
Previous Month End
Inventory + Inventory Added
During the Month
% of Available
Inventory Sold
Days on
Market
Months of
Supply
March 2014 21 147 + 46 = 193 10.88% 70 7.48
April 2014 25 157 + 37 = 194 12.89% 107 6.44
May 2014 31 161 + 63 = 221 14.03% 97 5.74
June 2014 28 178 + 47 = 225 12.44% 64 6.39
July 2014 23 179 + 73 = 252 9.13% 98 8.61
August 2014 18 198 + 55 = 253 7.11% 64 11.83
September 2014 26 213 + 48 = 261 9.96% 96 7.77
October 2014 15 202 + 39 = 241 6.22% 79 12.13
November 2014 10 182 + 19 = 201 4.98% 103 16.30
December 2015 6 163 + 13 = 176 3.41% 167 19.83
January 2015 8 119 + 33 = 152 5.26% 151 15.13
February 2015 17 121 + 39 = 160 10.63% 139 7.94
March 2015 13 135 + 47 = 182 7.14% 139 11.69
Rural Foothills Detached Sales Data
Monthly – March 2011 – March 2015
The following table shows the Rural Foothills Detached Sales Data for each month since March of
last year.
Month/Year Detached Sales Previous Month End
Inventory + Inventory
Added During the Month
% of Available
Inventory Sold
Days on
Market
Months of
Supply
March 2011 14 161 + 61 = 222 6.31% 42 12.64
March 2012 24 192 + 78 = 270 8.89% 92 9.29
March 2013 10 168 + 45 = 213 4.69% 101 18.50
March 2014 21 147 + 46 = 193 10.88 70 7.48
March 2015 13 135 + 47 = 182 7.14% 139 11.69
13

Rural Foothills Detached Sales Data Benchmark, Average and Median Prices have
shown the following progression:
14

City of Airdrie Detached Sales Data
Yearly – March 2014 – March 2015
The following table shows the City of Airdrie Detached Sales Data for each month since March of
last year.
Month/Year Detached
Sales
Previous Month End
Inventory + Inventory Added
During the Month
% of Available
Inventory Sold
Days on
Market
Months of
Supply
March 2014 118 120 + 139 = 259 45.56% 28 1.07
April 2014 115 126 + 139 = 265 43.40% 28 1.18
May 2014 135 136 + 208 = 344 39.24% 27 1.41
June 2014 131 191 + 157 = 248 52.82% 29 1.45
July 2014 112 190 + 145 = 335 33.43% 32 1.73
August 2014 76 194 + 119 = 313 24.28% 31 2.66
September 2014 84 202 + 123 = 325 25.85% 45 2.18
October 2014 106 183 + 120 = 303 34.98% 45 1.41
November 2014 76 149 + 81 = 230 33.04% 38 1.72
December 2015 44 131 + 56 = 187 23.53% 48 2.89
January 2015 41 127 + 154 = 281 14.59% 49 5.15
February 2015 70 211 + 149 = 360 19.44% 35 3.54
March 2015 93 248 + 133 = 381 24.41% 38 2.63
City of Airdrie Detached Sales Data
Monthly – March 2011 – March 2015
The following table shows the City of Airdrie Detached Sales Data for each month since March of
last year.
Month/Year Detached Sales Previous Month End
Inventory + Inventory
Added During the Month
% of Available
Inventory Sold
Days on
Market
Months of
Supply
March 2011 63 234 + 140 = 374 16.84% 53 4.30
March 2012 96 213 + 147 = 360 26.67% 48 2.38
March 2013 76 137 + 115 = 252 30.17% 34 1.91
March 2014 118 120 + 139 = 259 45.56% 28 1.07
March 2015 98 248 + 133 = 381 24.41% 38 2.63
15

City of Airdrie Detached Sales Data Benchmark, Average and Median Prices have
shown the following progression:
16
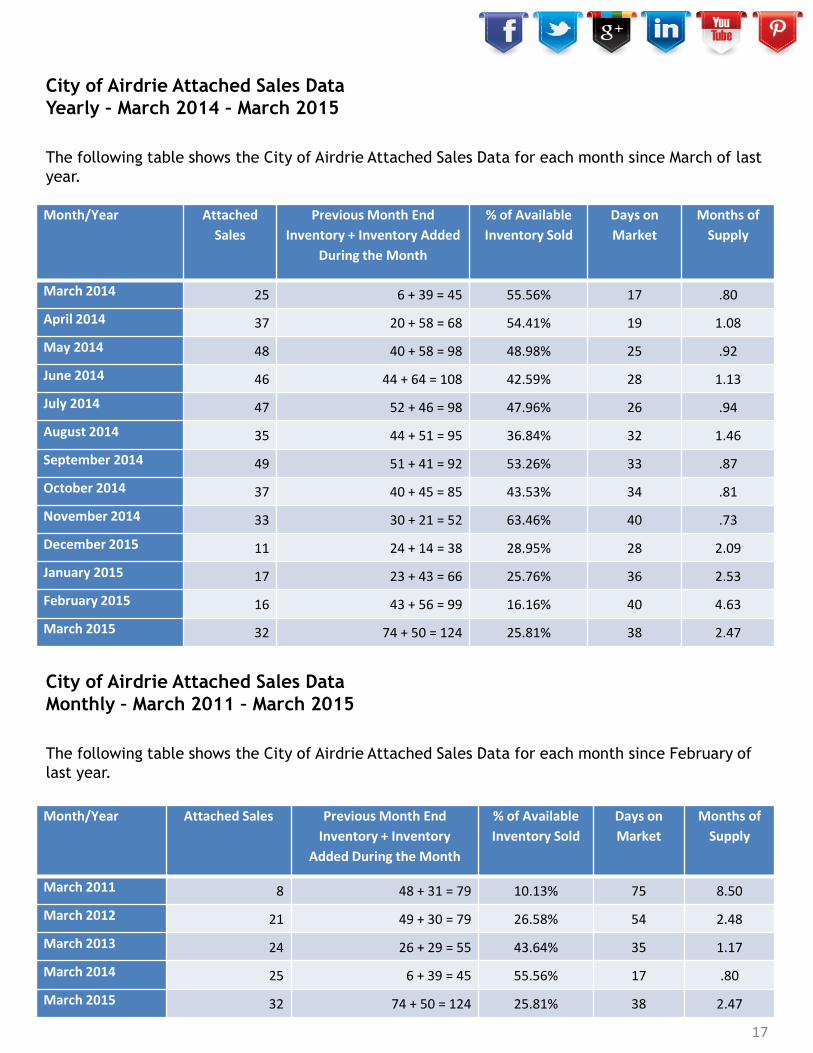
City of Airdrie Attached Sales Data
Yearly – March 2014 – March 2015
The following table shows the City of Airdrie Attached Sales Data for each month since March of last
year.
Month/Year Attached
Sales
Previous Month End
Inventory + Inventory Added
During the Month
% of Available
Inventory Sold
Days on
Market
Months of
Supply
March 2014 25 6 + 39 = 45 55.56% 17 .80
April 2014 37 20 + 58 = 68 54.41% 19 1.08
May 2014 48 40 + 58 = 98 48.98% 25 .92
June 2014 46 44 + 64 = 108 42.59% 28 1.13
July 2014 47 52 + 46 = 98 47.96% 26 .94
August 2014 35 44 + 51 = 95 36.84% 32 1.46
September 2014 49 51 + 41 = 92 53.26% 33 .87
October 2014 37 40 + 45 = 85 43.53% 34 .81
November 2014 33 30 + 21 = 52 63.46% 40 .73
December 2015 11 24 + 14 = 38 28.95% 28 2.09
January 2015 17 23 + 43 = 66 25.76% 36 2.53
February 2015 16 43 + 56 = 99 16.16% 40 4.63
March 2015 32 74 + 50 = 124 25.81% 38 2.47
City of Airdrie Attached Sales Data
Monthly – March 2011 – March 2015
The following table shows the City of Airdrie Attached Sales Data for each month since February of
last year.
Month/Year Attached Sales Previous Month End
Inventory + Inventory
Added During the Month
% of Available
Inventory Sold
Days on
Market
Months of
Supply
March 2011 8 48 + 31 = 79 10.13% 75 8.50
March 2012 21 49 + 30 = 79 26.58% 54 2.48
March 2013 24 26 + 29 = 55 43.64% 35 1.17
March 2014 25 6 + 39 = 45 55.56% 17 .80
March 2015 32 74 + 50 = 124 25.81% 38 2.47
17
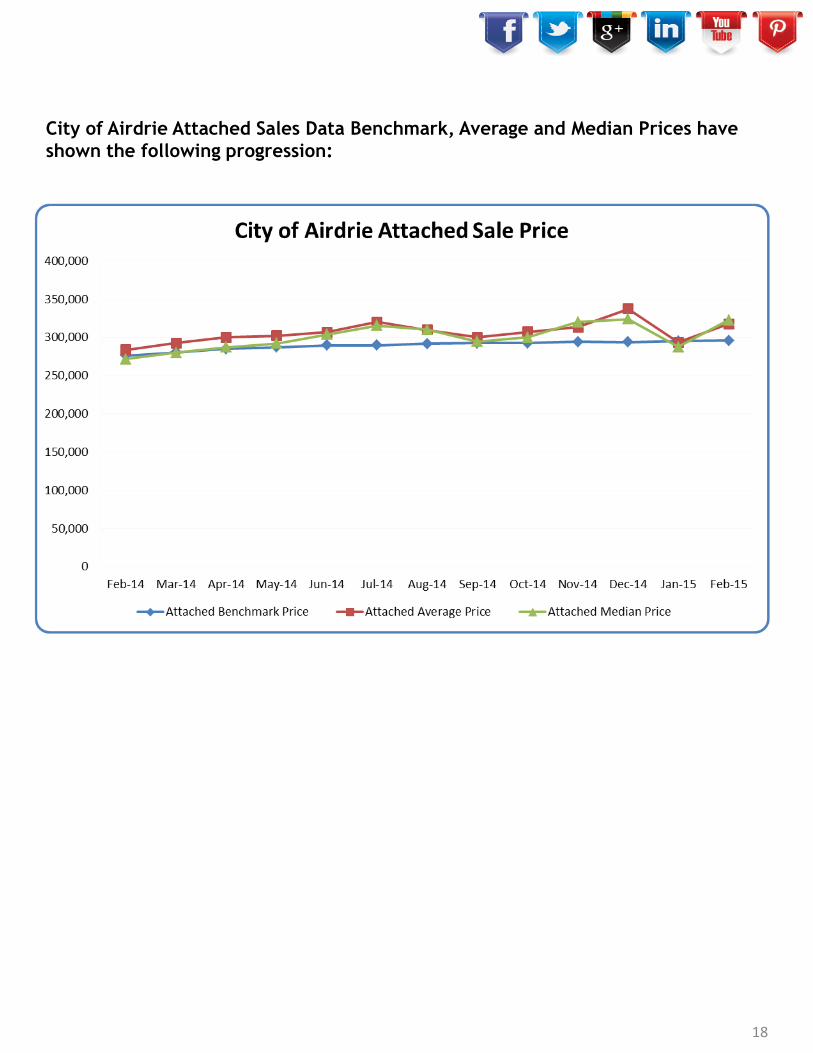
City of Airdrie Attached Sales Data Benchmark, Average and Median Prices have
shown the following progression:
18

City of Airdrie Apartment Sales Data
Yearly – March 2014 – March 2015
The following table shows the City of Airdrie Apartment Sales Data for each month since March of
last year.
Month/Year Apartment
Sales
Previous Month End
Inventory + Inventory Added
During the Month
% of Available
Inventory Sold
Days on
Market
Months of
Supply
March 2014 17 121 + 21 = 33 51.52% 28 .94
April 2014 17 16 + 21 = 37 45.95% 27 1.18
May 2014 12 20 + 18 = 38 31.58% 29 1.75
June 2014 17 21 + 29 = 50 34.00% 36 1.88
July 2014 21 32 + 16 = 48 43.75% 50 1.24
August 2014 20 26 + 14 = 40 50.00% 36 .90
September 2014 9 18 + 14 = 32 28.13% 40 1.89
October 2014 16 17 + 17 = 34 47.06% 36 .88
November 2014 7 14 + 13 = 27 25.93% 36 3.14
December 2015 9 22 + 9 = 29 31.03% 53 2.11
January 2015 7 19 + 25 = 44 15.91% 40 5.14
February 2015 12 40 + 43 = 83 14.46% 29 3.58
March 2015 13 43 + 11 = 54 24.07% 50 2.77
City of Airdrie Apartment Sales Data
Monthly – March 2011 – March 2015
The following table shows the City of Airdrie Apartment Sales Data for each month since March of
last year.
Month/Year Apartment Sales Previous Month End
Inventory + Inventory
Added During the Month
% of Available
Inventory Sold
Days on
Market
Months of
Supply
March 2011 8 47 + 6 = 53 15.09% 77 4.38
March 2012 9 42 + 12 = 54 16.67% 59 4.67
March 2013 8 24 + 7 = 31 25.81 69 2.63
March 2014 17 12 + 21 = 33 51.52% 28 .94
March 2015 13 43 + 11 = 54 24.07% 50 2.77
19
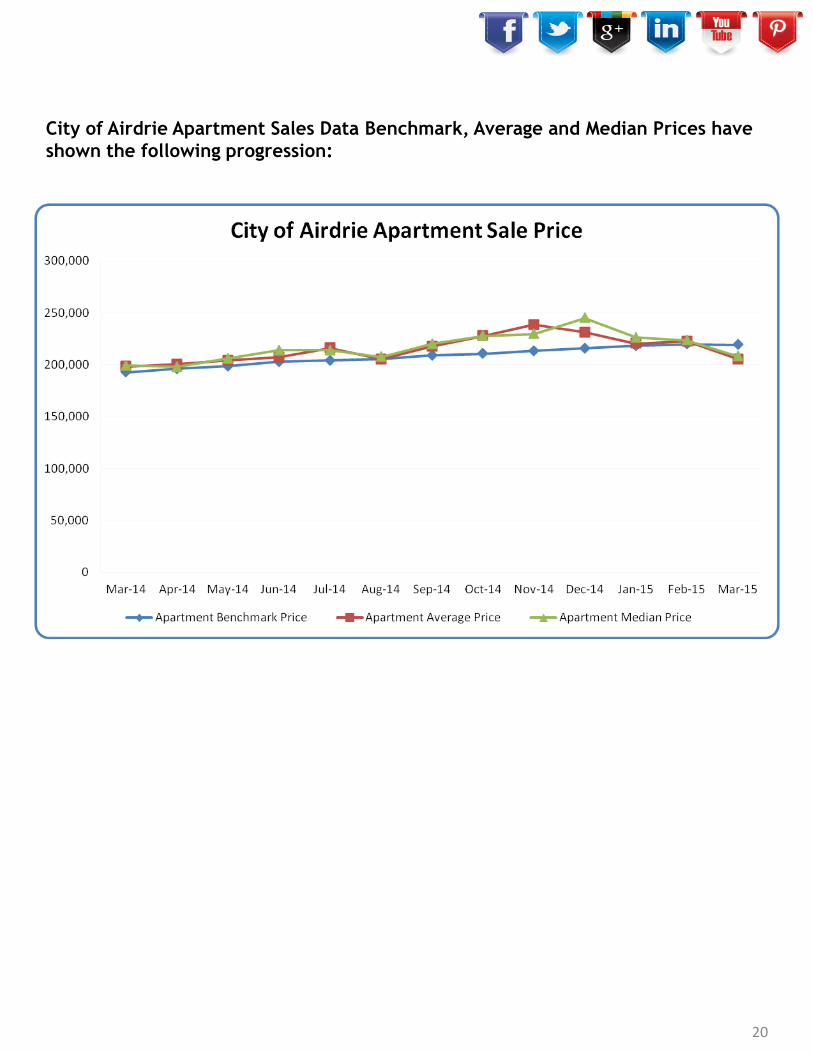
City of Airdrie Apartment Sales Data Benchmark, Average and Median Prices have
shown the following progression:
20

Curious About the
Value of Your Home?
As you can see, current market conditions play a critical role in determining the value of your home. Equally important however, is having an experienced and knowledgeable professional Realtor® on your side. Coldwell Banker Complete Real Estate would welcome the opportunity to discuss any of your Real Estate needs at your convenience.
#yesyoumatter
Request Your Free Home
Evaluation Today!
Coldwell Banker Complete Real Estate Phone: 403-686-1455
21